Attached files
| file | filename |
|---|---|
| 8-K - FORM 8-K - GOLDMAN SACHS GROUP INC | d440554d8k.htm |
Goldman Sachs Presentation to Barclays Financial Services Conference September 12, 2017 Harvey M. Schwartz President and Co-Chief Operating Officer Exhibit 99.1
Cautionary Note on Forward-Looking Statements Today’s presentation includes forward-looking statements. These statements are not historical facts, but instead represent only the Firm’s beliefs regarding future events, many of which, by their nature, are inherently uncertain and outside of the Firm’s control. Forward-looking statements include statements about potential revenue and growth opportunities. It is possible that the Firm’s actual results, including the incremental revenues, if any, from such opportunities, and financial condition, may differ, possibly materially, from the anticipated results, financial condition and incremental revenues indicated in these forward-looking statements. For a discussion of some of the risks and important factors that could affect the Firm’s future results and financial condition, see “Risk Factors” in our Annual Report on Form 10-K for the year ended December 31, 2016. You should also read the forward-looking disclaimers in our Form 10-Q for the period ended June 30, 2017, particularly as it relates to capital and leverage ratios, and information on the calculation of non-GAAP financial measures that is posted on the Investor Relations portion of our website: www.gs.com. Statements about our revenue and growth opportunities are subject to the risk that the Firm’s businesses may be unable to generate additional incremental revenues or take advantage of growth opportunities. The statements in the presentation are current only as of its date, September 12, 2017.
Review of Financial Performance
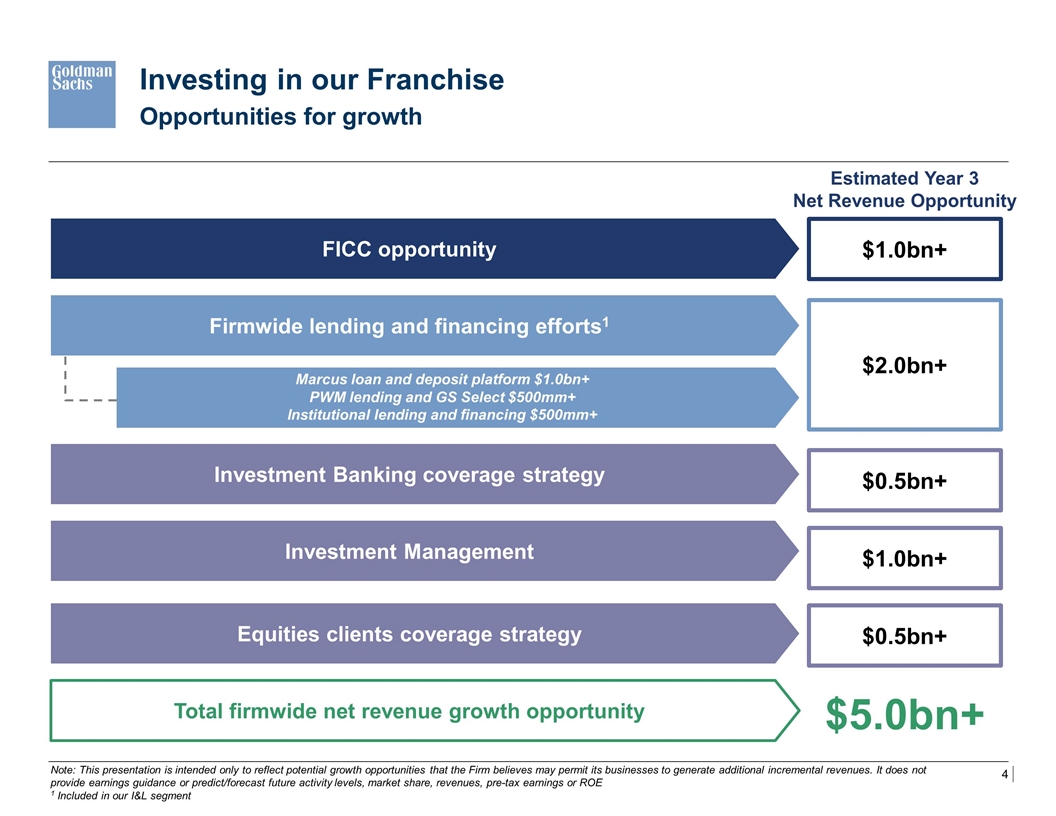
Opportunities for growth Investing in our Franchise $0.5bn+ Firmwide lending and financing efforts1 $1.0bn+ Investment Management $0.5bn+ Equities clients coverage strategy Estimated Year 3 Net Revenue Opportunity FICC opportunity Total firmwide net revenue growth opportunity $2.0bn+ $5.0bn+ Investment Banking coverage strategy Marcus loan and deposit platform $1.0bn+ PWM lending and GS Select $500mm+ Institutional lending and financing $500mm+ $1.0bn+ Note: This presentation is intended only to reflect potential growth opportunities that the Firm believes may permit its businesses to generate additional incremental revenues. It does not provide earnings guidance or predict/forecast future activity levels, market share, revenues, pre-tax earnings or ROE 1 Included in our I&L segment
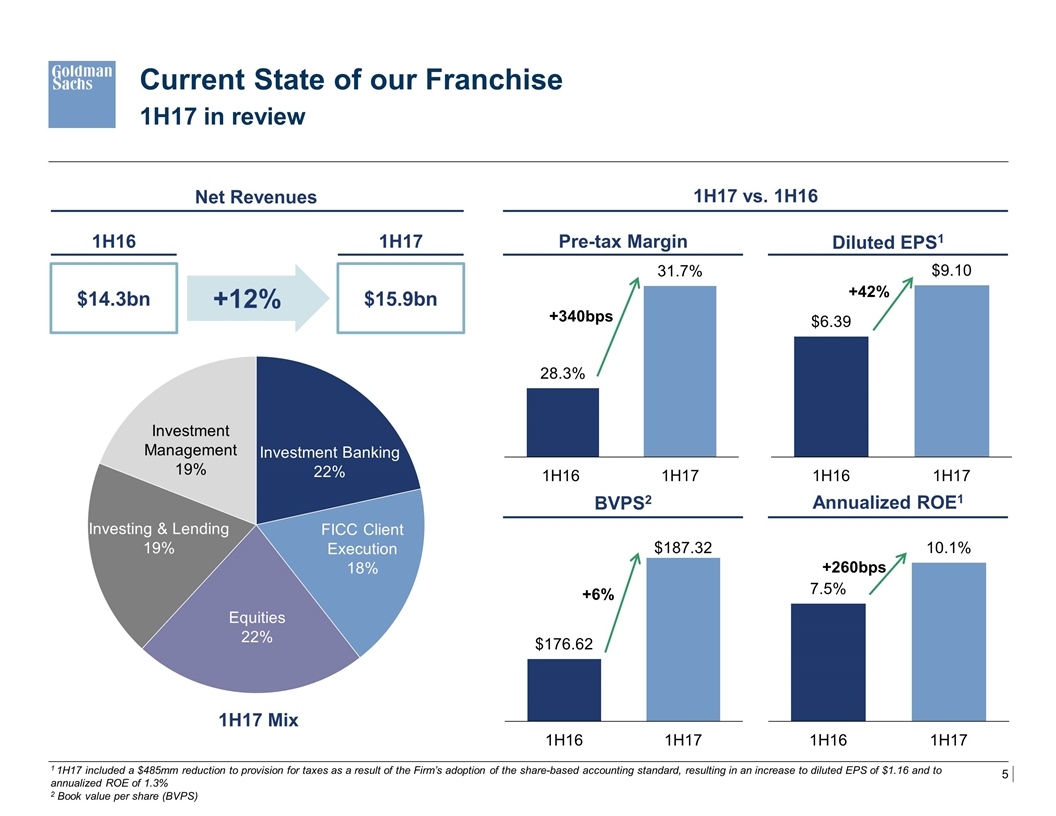
Pre-tax Margin Current State of our Franchise 1H17 in review $14.3bn $15.9bn +12% 1H16 1H17 1H17 vs. 1H16 +340bps Diluted EPS1 +42% BVPS2 +6% Annualized ROE1 +260bps 1 1H17 included a $485mm reduction to provision for taxes as a result of the Firm’s adoption of the share-based accounting standard, resulting in an increase to diluted EPS of $1.16 and to annualized ROE of 1.3% 2 Book value per share (BVPS) Net Revenues 1H17 Mix
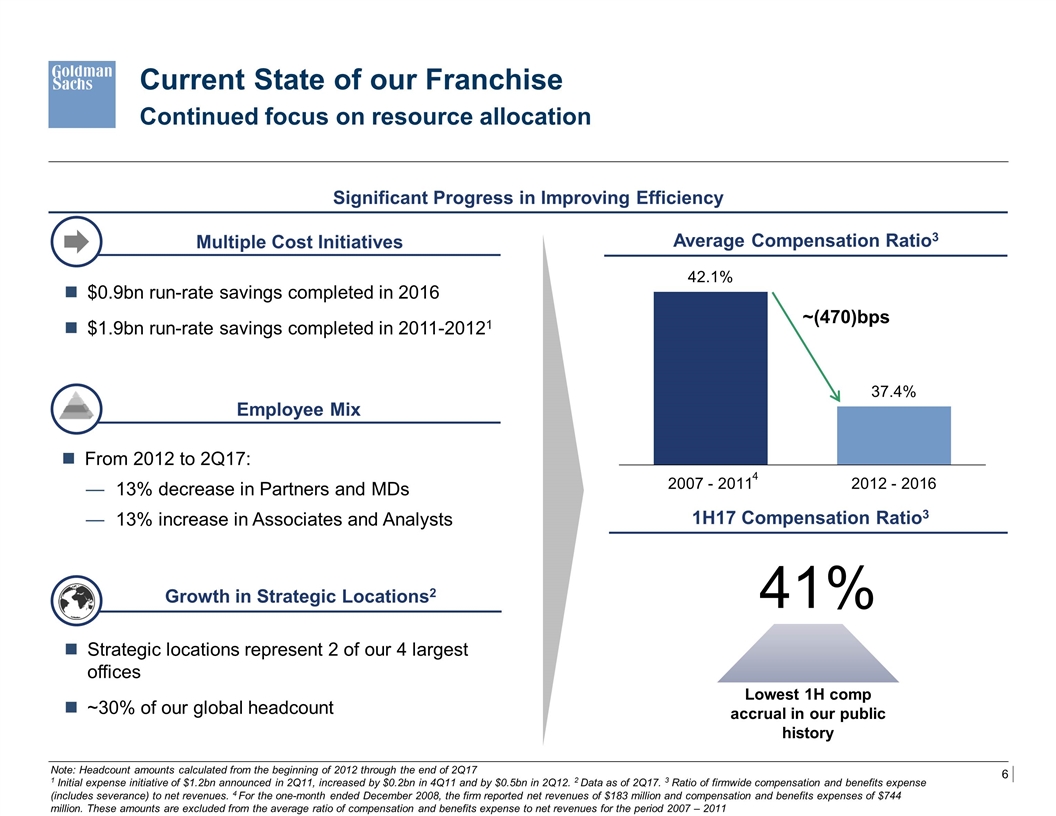
Current State of our Franchise Continued focus on resource allocation Significant Progress in Improving Efficiency Growth in Strategic Locations2 Strategic locations represent 2 of our 4 largest offices ~30% of our global headcount Average Compensation Ratio3 1H17 Compensation Ratio3 ~(470)bps From 2012 to 2Q17: 13% decrease in Partners and MDs 13% increase in Associates and Analysts Employee Mix Lowest 1H comp accrual in our public history 41% Note: Headcount amounts calculated from the beginning of 2012 through the end of 2Q17 1 Initial expense initiative of $1.2bn announced in 2Q11, increased by $0.2bn in 4Q11 and by $0.5bn in 2Q12. 2 Data as of 2Q17. 3 Ratio of firmwide compensation and benefits expense (includes severance) to net revenues. 4 For the one-month ended December 2008, the firm reported net revenues of $183 million and compensation and benefits expenses of $744 million. These amounts are excluded from the average ratio of compensation and benefits expense to net revenues for the period 2007 – 2011 4 $0.9bn run-rate savings completed in 2016 $1.9bn run-rate savings completed in 2011-20121 Multiple Cost Initiatives
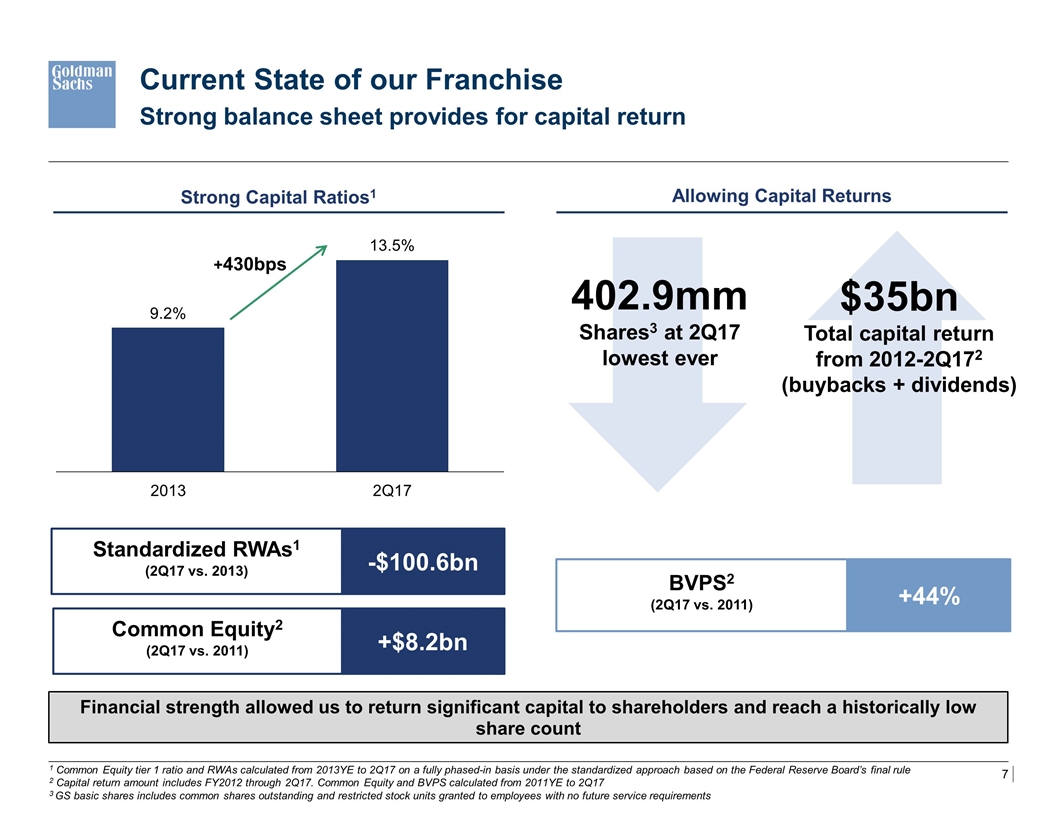
Financial strength allowed us to return significant capital to shareholders and reach a historically low share count Allowing Capital Returns 402.9mm Shares3 at 2Q17 lowest ever $35bn Total capital return from 2012-2Q172 (buybacks + dividends) 1 Common Equity tier 1 ratio and RWAs calculated from 2013YE to 2Q17 on a fully phased-in basis under the standardized approach based on the Federal Reserve Board’s final rule 2 Capital return amount includes FY2012 through 2Q17. Common Equity and BVPS calculated from 2011YE to 2Q17 3 GS basic shares includes common shares outstanding and restricted stock units granted to employees with no future service requirements Strong Capital Ratios1 +430bps -$100.6bn Standardized RWAs1 (2Q17 vs. 2013) +$8.2bn Common Equity2 (2Q17 vs. 2011) Current State of our Franchise Strong balance sheet provides for capital return +44% BVPS2 (2Q17 vs. 2011)
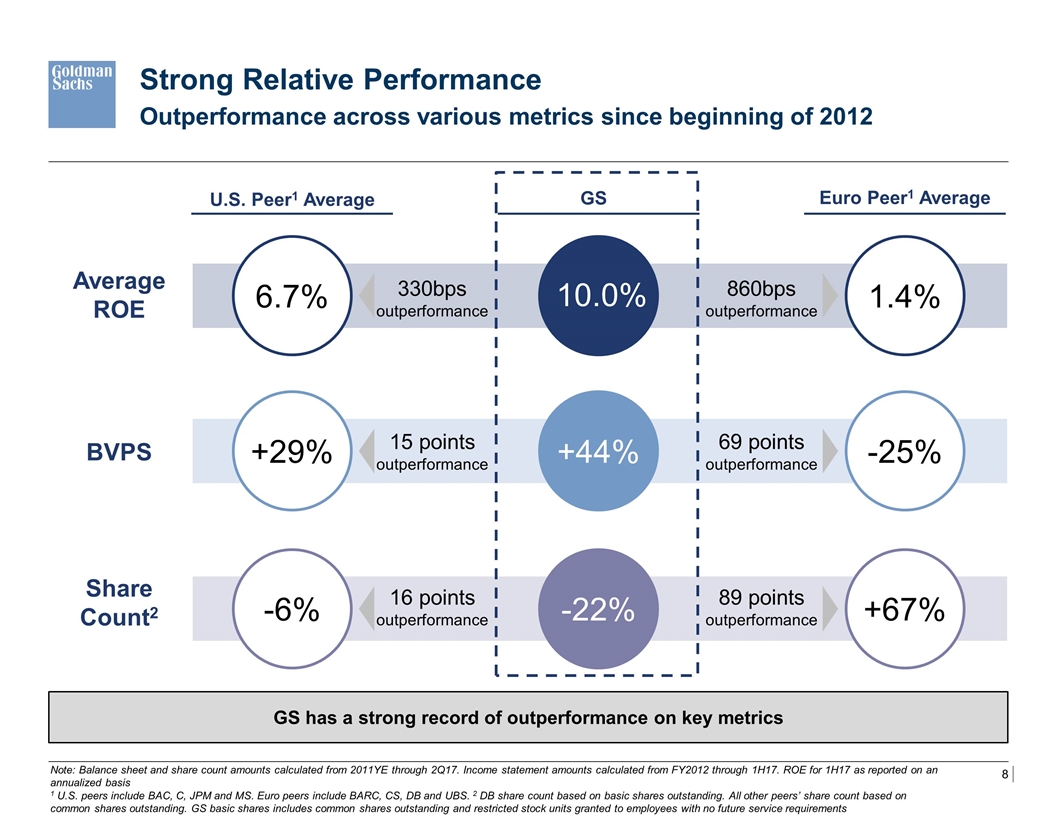
GS has a strong record of outperformance on key metrics U.S. Peer1 Average Strong Relative Performance Outperformance across various metrics since beginning of 2012 GS Euro Peer1 Average +44% -22% 6.7% 1.4% +29% -25% -6% +67% Note: Balance sheet and share count amounts calculated from 2011YE through 2Q17. Income statement amounts calculated from FY2012 through 1H17. ROE for 1H17 as reported on an annualized basis 1 U.S. peers include BAC, C, JPM and MS. Euro peers include BARC, CS, DB and UBS. 2 DB share count based on basic shares outstanding. All other peers’ share count based on common shares outstanding. GS basic shares includes common shares outstanding and restricted stock units granted to employees with no future service requirements 860bps outperformance 15 points outperformance 69 points outperformance 16 points outperformance 89 points outperformance Average ROE BVPS Share Count2 330bps outperformance 10.0%
Fixed Income, Currencies and Commodities
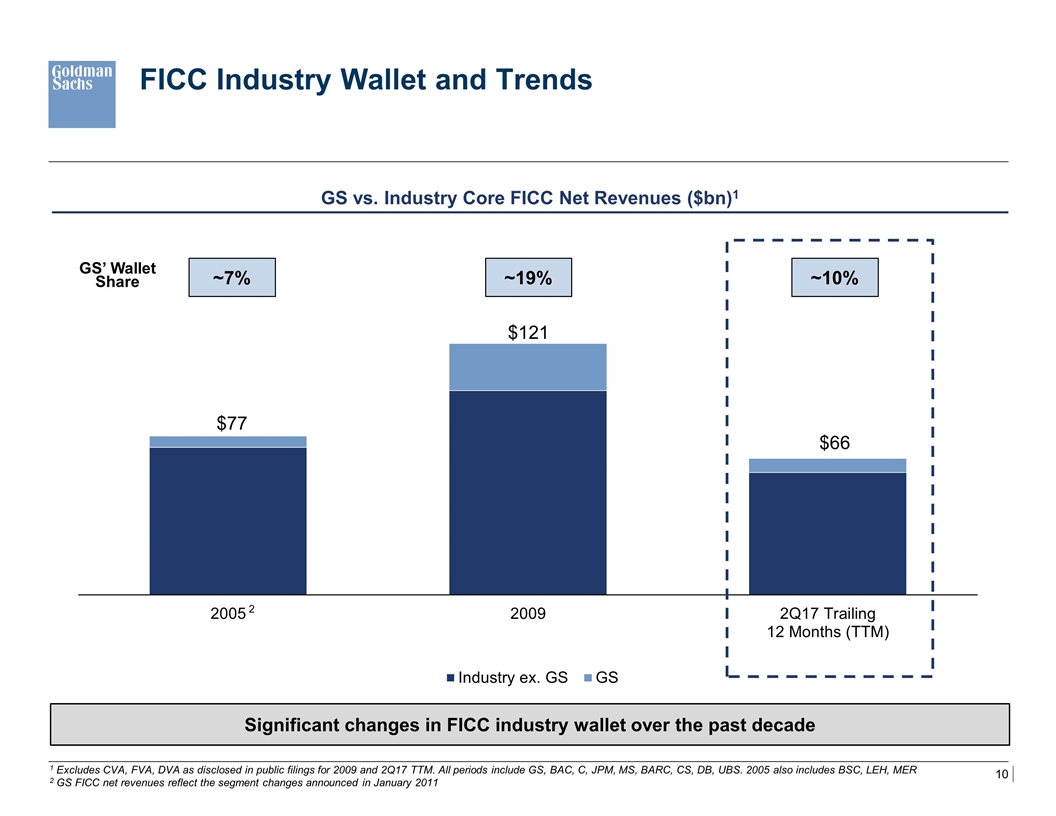
FICC Industry Wallet and Trends GS vs. Industry Core FICC Net Revenues ($bn)1 Significant changes in FICC industry wallet over the past decade GS’ Wallet Share 1 Excludes CVA, FVA, DVA as disclosed in public filings for 2009 and 2Q17 TTM. All periods include GS, BAC, C, JPM, MS, BARC, CS, DB, UBS. 2005 also includes BSC, LEH, MER 2 GS FICC net revenues reflect the segment changes announced in January 2011 $77 $66 $121 ~7% ~10% ~19% 2
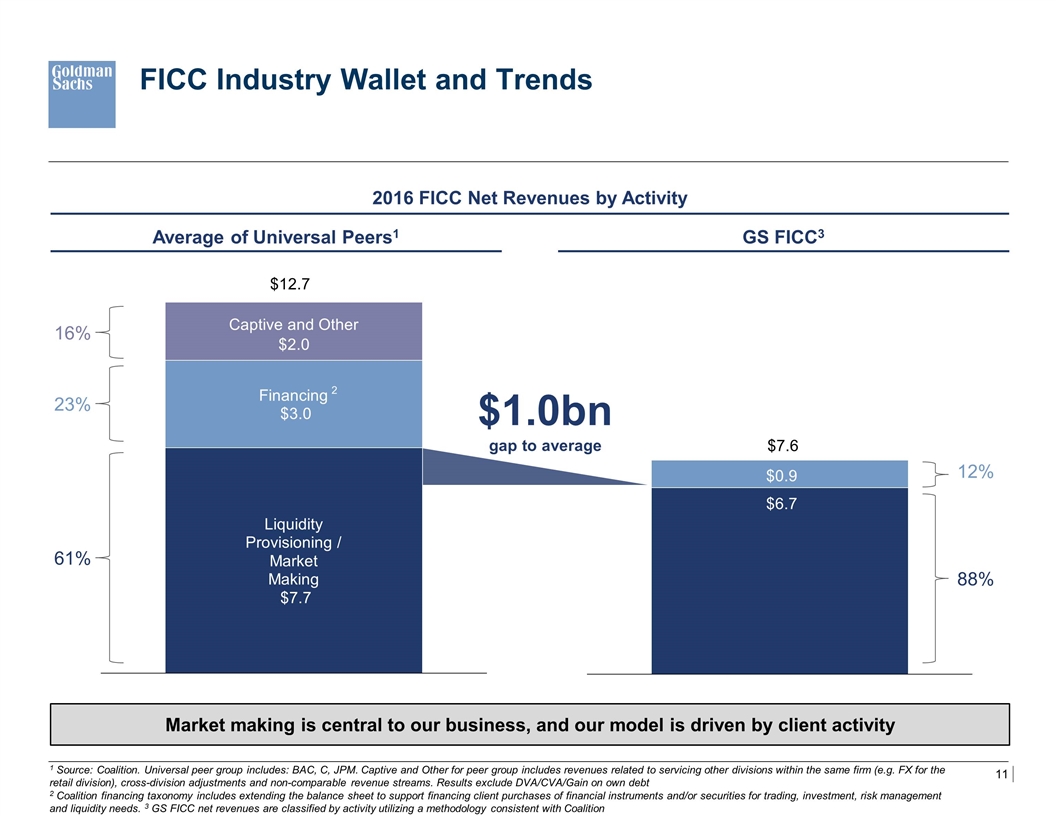
$1.0bn gap to average FICC Industry Wallet and Trends 2016 FICC Net Revenues by Activity Market making is central to our business, and our model is driven by client activity 1 Source: Coalition. Universal peer group includes: BAC, C, JPM. Captive and Other for peer group includes revenues related to servicing other divisions within the same firm (e.g. FX for the retail division), cross-division adjustments and non-comparable revenue streams. Results exclude DVA/CVA/Gain on own debt 2 Coalition financing taxonomy includes extending the balance sheet to support financing client purchases of financial instruments and/or securities for trading, investment, risk management and liquidity needs. 3 GS FICC net revenues are classified by activity utilizing a methodology consistent with Coalition Average of Universal Peers1 GS FICC3 61% 23% 16% 88% 12% 2
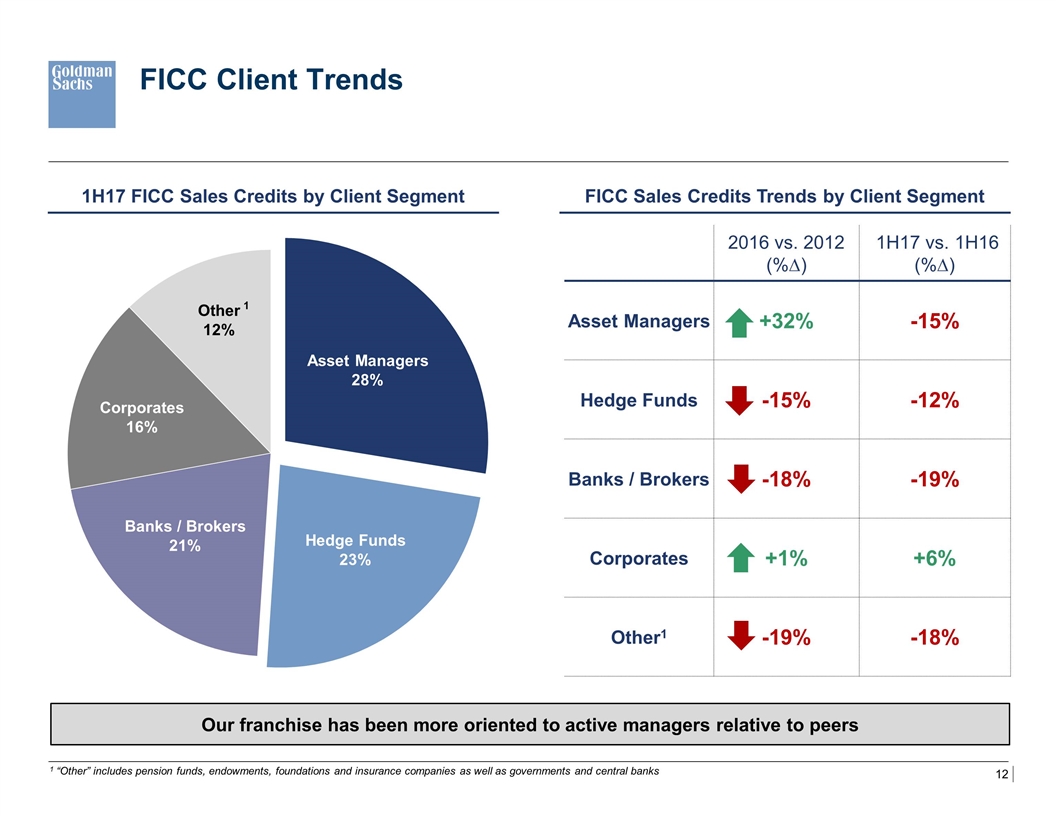
FICC Client Trends 1H17 FICC Sales Credits by Client Segment Our franchise has been more oriented to active managers relative to peers FICC Sales Credits Trends by Client Segment 1 “Other” includes pension funds, endowments, foundations and insurance companies as well as governments and central banks 2016 vs. 2012 (%∆) 1H17 vs. 1H16 (%∆) Asset Managers +32% -15% Hedge Funds -15% -12% Banks / Brokers -18% -19% Corporates +1% +6% Other1 -19% -18% 1
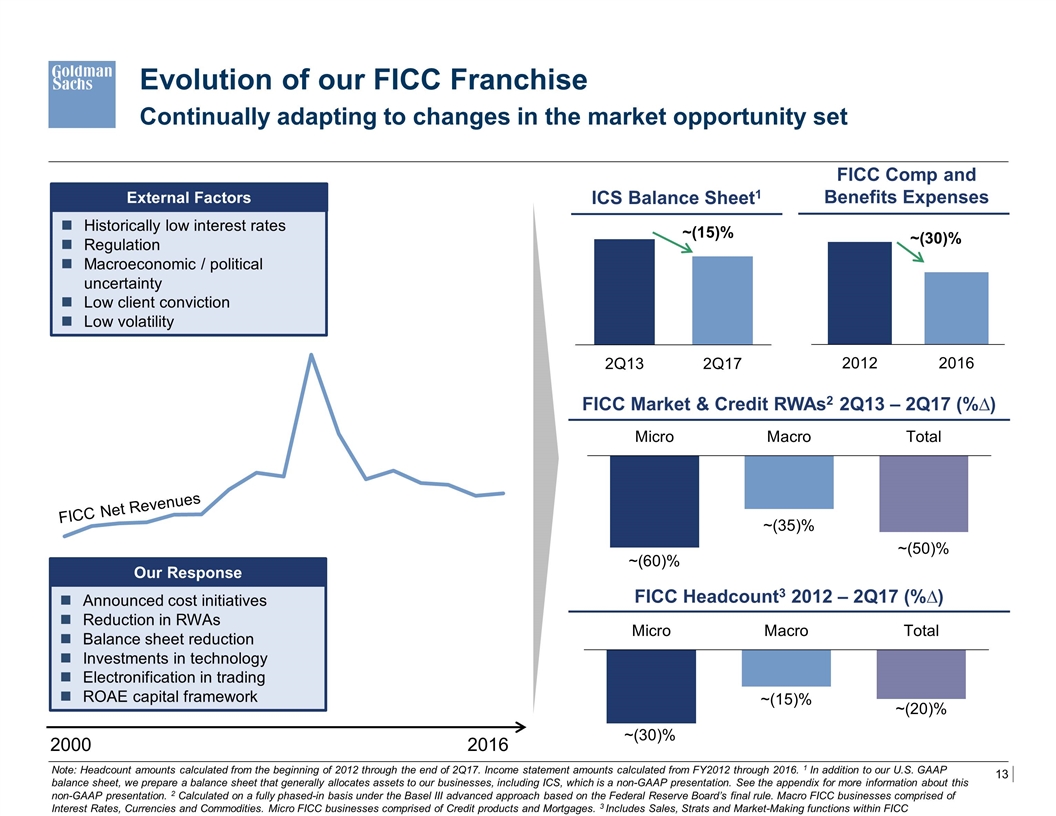
Evolution of our FICC Franchise 2000 2016 Historically low interest rates Regulation Macroeconomic / political uncertainty Low client conviction Low volatility Announced cost initiatives Reduction in RWAs Balance sheet reduction Investments in technology Electronification in trading ROAE capital framework Our Response External Factors FICC Net Revenues ICS Balance Sheet1 ~(15)% Continually adapting to changes in the market opportunity set Note: Headcount amounts calculated from the beginning of 2012 through the end of 2Q17. Income statement amounts calculated from FY2012 through 2016. 1 In addition to our U.S. GAAP balance sheet, we prepare a balance sheet that generally allocates assets to our businesses, including ICS, which is a non-GAAP presentation. See the appendix for more information about this non-GAAP presentation. 2 Calculated on a fully phased-in basis under the Basel III advanced approach based on the Federal Reserve Board’s final rule. Macro FICC businesses comprised of Interest Rates, Currencies and Commodities. Micro FICC businesses comprised of Credit products and Mortgages. 3 Includes Sales, Strats and Market-Making functions within FICC FICC Market & Credit RWAs2 2Q13 – 2Q17 (%∆) FICC Headcount3 2012 – 2Q17 (%∆) FICC Comp and Benefits Expenses ~(30)%
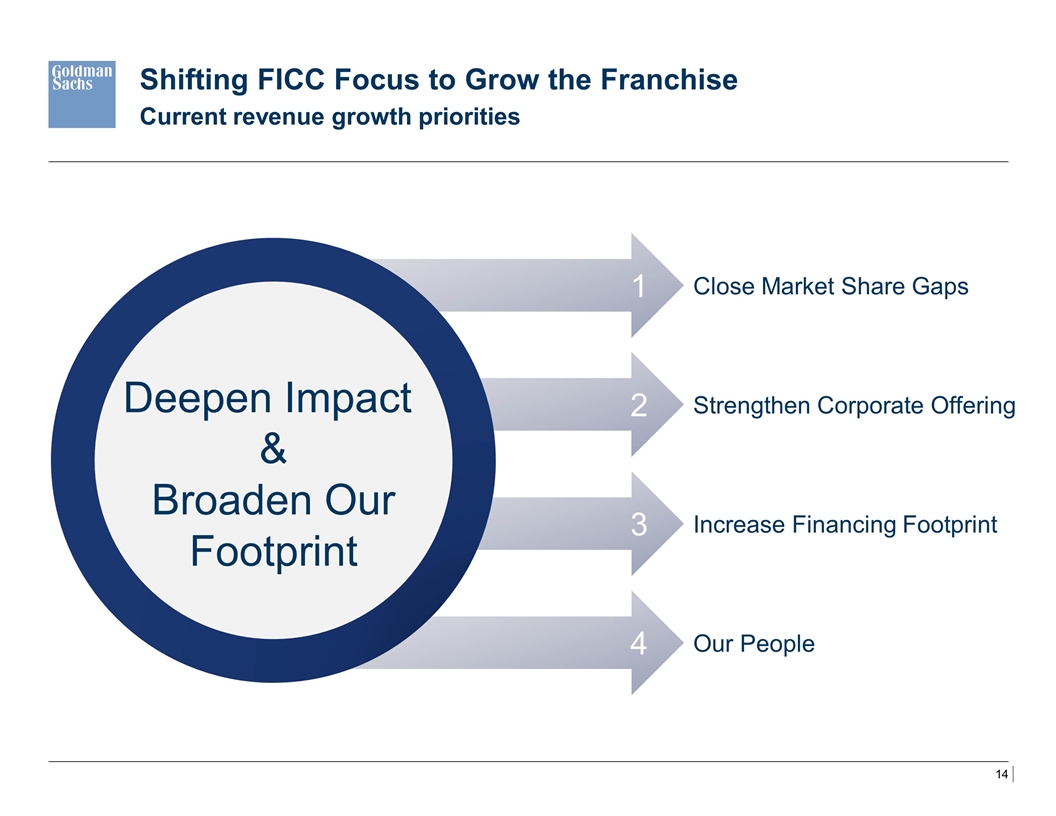
1 2 3 4 Close Market Share Gaps Increase Financing Footprint Strengthen Corporate Offering Our People Shifting FICC Focus to Grow the Franchise Current revenue growth priorities Deepen Impact & Broaden Our Footprint
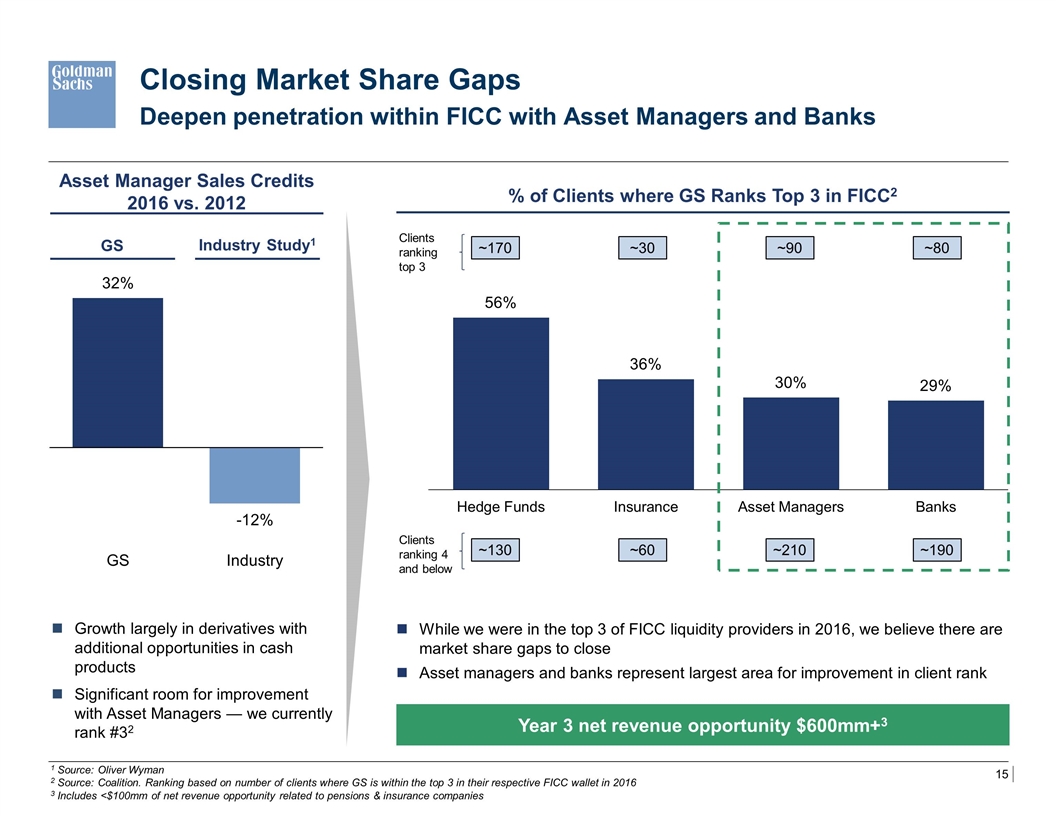
Clients ranking 4 and below Closing Market Share Gaps Deepen penetration within FICC with Asset Managers and Banks 1 Source: Oliver Wyman 2 Source: Coalition. Ranking based on number of clients where GS is within the top 3 in their respective FICC wallet in 2016 3 Includes <$100mm of net revenue opportunity related to pensions & insurance companies Growth largely in derivatives with additional opportunities in cash products Significant room for improvement with Asset Managers — we currently rank #32 While we were in the top 3 of FICC liquidity providers in 2016, we believe there are market share gaps to close Asset managers and banks represent largest area for improvement in client rank % of Clients where GS Ranks Top 3 in FICC2 Asset Manager Sales Credits 2016 vs. 2012 Year 3 net revenue opportunity $600mm+3 ~130 ~60 ~210 ~190 GS Industry Study1 Clients ranking top 3 ~170 ~30 ~90 ~80
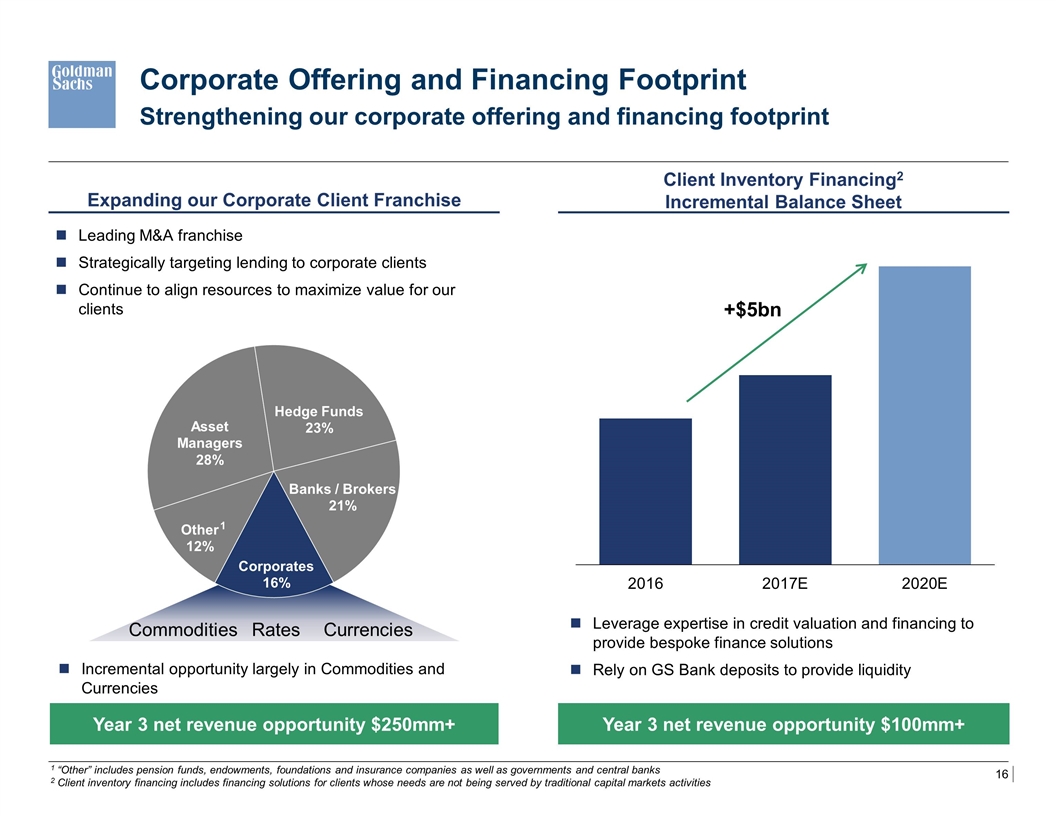
Corporate Offering and Financing Footprint Strengthening our corporate offering and financing footprint Leading M&A franchise Strategically targeting lending to corporate clients Continue to align resources to maximize value for our clients Year 3 net revenue opportunity $250mm+ Year 3 net revenue opportunity $100mm+ Expanding our Corporate Client Franchise Leverage expertise in credit valuation and financing to provide bespoke finance solutions Rely on GS Bank deposits to provide liquidity +$5bn 1 “Other” includes pension funds, endowments, foundations and insurance companies as well as governments and central banks 2 Client inventory financing includes financing solutions for clients whose needs are not being served by traditional capital markets activities 1 Commodities Currencies Client Inventory Financing2 Incremental Balance Sheet Rates Incremental opportunity largely in Commodities and Currencies
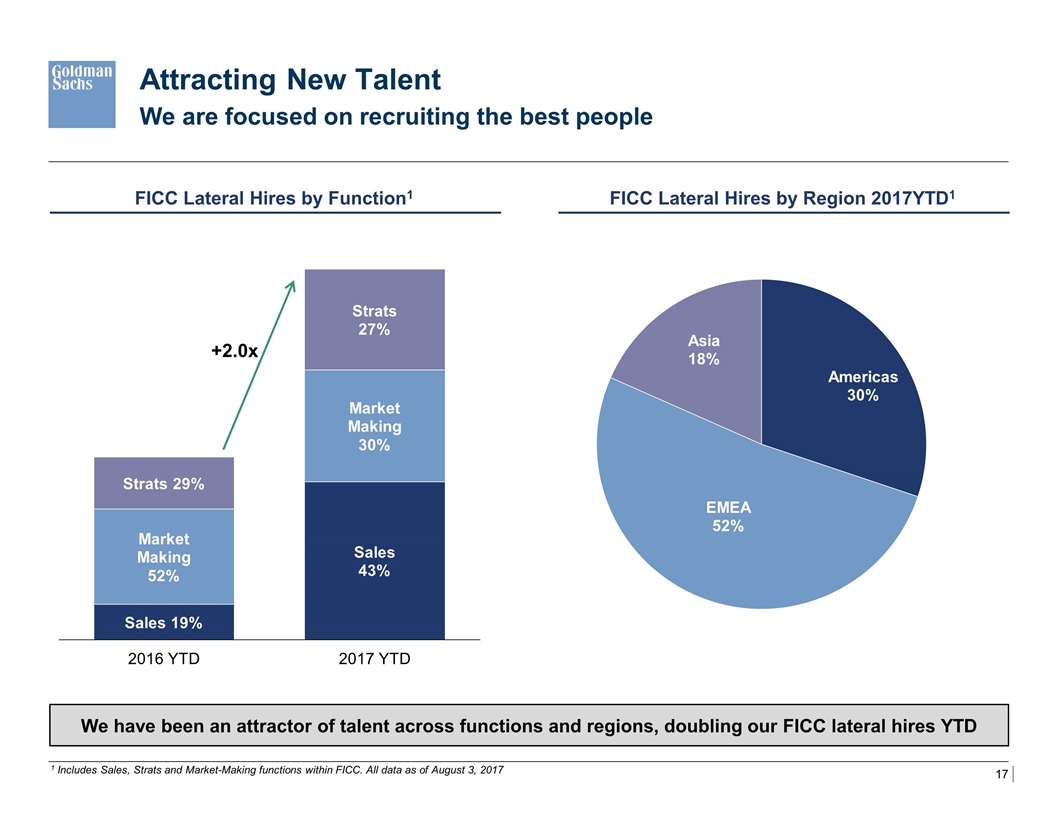
Attracting New Talent We are focused on recruiting the best people FICC Lateral Hires by Function1 +2.0x 1 Includes Sales, Strats and Market-Making functions within FICC. All data as of August 3, 2017 FICC Lateral Hires by Region 2017YTD1 We have been an attractor of talent across functions and regions, doubling our FICC lateral hires YTD
Firmwide Opportunities
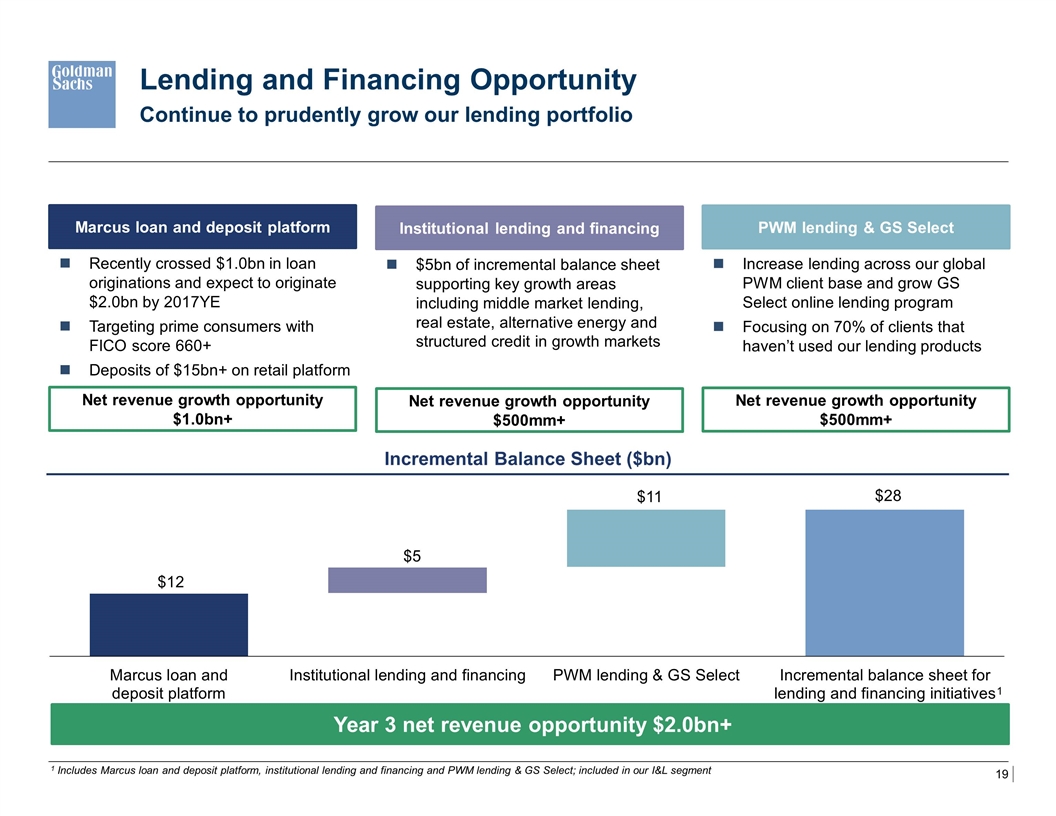
Continue to prudently grow our lending portfolio Lending and Financing Opportunity Year 3 net revenue opportunity $2.0bn+ $5bn of incremental balance sheet supporting key growth areas including middle market lending, real estate, alternative energy and structured credit in growth markets Institutional lending and financing Net revenue growth opportunity $500mm+ Increase lending across our global PWM client base and grow GS Select online lending program Focusing on 70% of clients that haven’t used our lending products PWM lending & GS Select Net revenue growth opportunity $500mm+ Recently crossed $1.0bn in loan originations and expect to originate $2.0bn by 2017YE Targeting prime consumers with FICO score 660+ Deposits of $15bn+ on retail platform Marcus loan and deposit platform Net revenue growth opportunity $1.0bn+ Incremental Balance Sheet ($bn) 1 1 Includes Marcus loan and deposit platform, institutional lending and financing and PWM lending & GS Select; included in our I&L segment
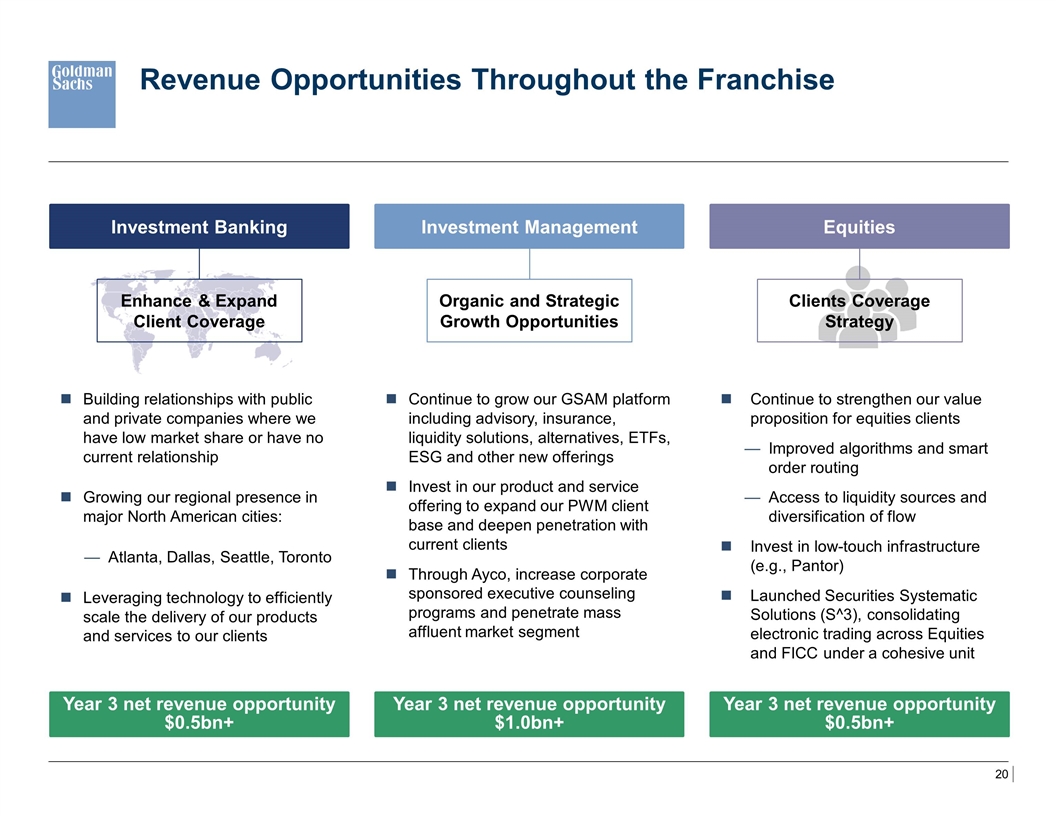
Revenue Opportunities Throughout the Franchise Year 3 net revenue opportunity $0.5bn+ Year 3 net revenue opportunity $1.0bn+ Year 3 net revenue opportunity $0.5bn+ Continue to strengthen our value proposition for equities clients Improved algorithms and smart order routing Access to liquidity sources and diversification of flow Invest in low-touch infrastructure (e.g., Pantor) Launched Securities Systematic Solutions (S^3), consolidating electronic trading across Equities and FICC under a cohesive unit Continue to grow our GSAM platform including advisory, insurance, liquidity solutions, alternatives, ETFs, ESG and other new offerings Invest in our product and service offering to expand our PWM client base and deepen penetration with current clients Through Ayco, increase corporate sponsored executive counseling programs and penetrate mass affluent market segment Investment Management Equities Investment Banking Enhance & Expand Client Coverage Clients Coverage Strategy Building relationships with public and private companies where we have low market share or have no current relationship Growing our regional presence in major North American cities: Atlanta, Dallas, Seattle, Toronto Leveraging technology to efficiently scale the delivery of our products and services to our clients Organic and Strategic Growth Opportunities
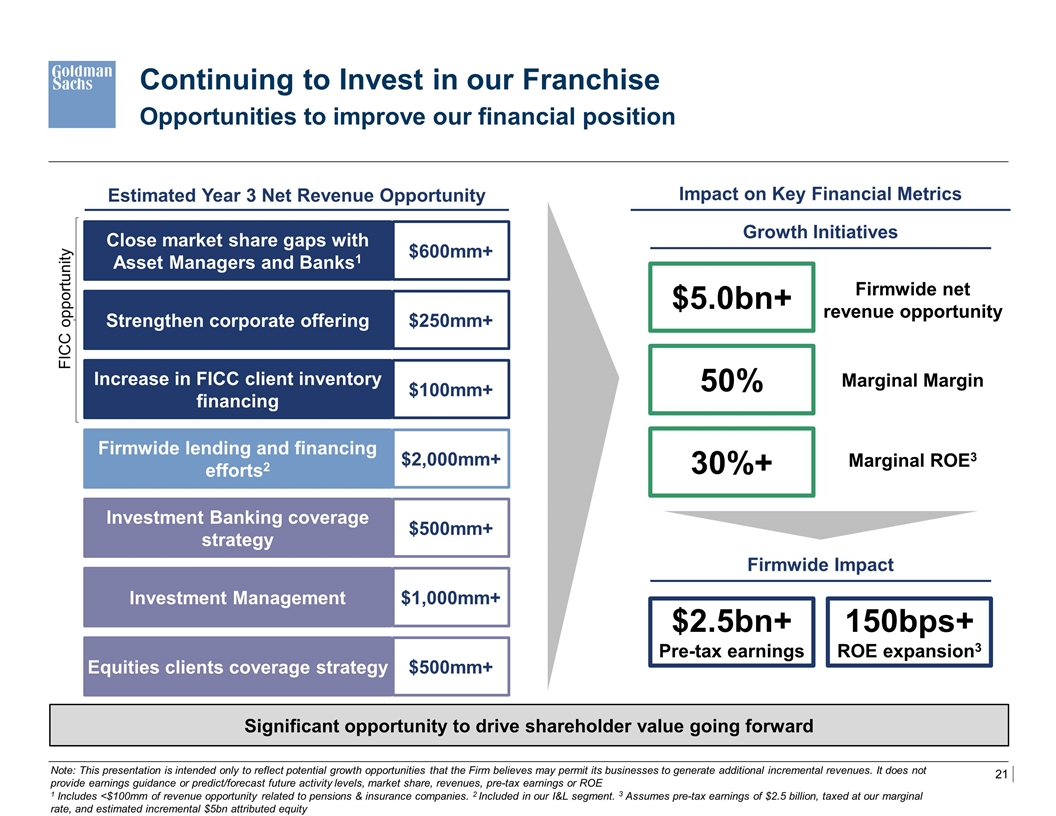
Opportunities to improve our financial position Continuing to Invest in our Franchise Firmwide lending and financing efforts2 Investment Banking coverage strategy Investment Management Close market share gaps with Asset Managers and Banks1 Increase in FICC client inventory financing Strengthen corporate offering Note: This presentation is intended only to reflect potential growth opportunities that the Firm believes may permit its businesses to generate additional incremental revenues. It does not provide earnings guidance or predict/forecast future activity levels, market share, revenues, pre-tax earnings or ROE 1 Includes <$100mm of revenue opportunity related to pensions & insurance companies. 2 Included in our I&L segment. 3 Assumes pre-tax earnings of $2.5 billion, taxed at our marginal rate, and estimated incremental $5bn attributed equity Estimated Year 3 Net Revenue Opportunity $2.5bn+ Pre-tax earnings Equities clients coverage strategy FICC opportunity Impact on Key Financial Metrics $600mm+ $250mm+ $100mm+ $2,000mm+ $500mm+ $1,000mm+ $500mm+ Significant opportunity to drive shareholder value going forward $5.0bn+ 150bps+ ROE expansion3 Firmwide net revenue opportunity 50% Marginal Margin 30%+ Marginal ROE3 Growth Initiatives Firmwide Impact
Appendix
In addition to preparing our condensed consolidated statements of financial condition in accordance with U.S. GAAP, we prepare a balance sheet that generally allocates assets to our businesses, which is a non-GAAP presentation and may not be comparable to similar non-GAAP presentations used by other companies. We believe that presenting our assets on this basis is meaningful because it is consistent with the way management views and manages risks associated with the firm’s assets and better enables investors to assess the liquidity of the firm’s assets. For a reconciliation of this balance sheet allocation to our U.S. GAAP balance sheet for the period ended June 30, 2017, see “Balance Sheet and Funding Sources” in Part I, Item 2 “Management’s Discussion and Analysis of Financial Condition and Results of Operations” in the firm’s Quarterly Report on Form 10-Q for the period ended June 30, 2017. For a reconciliation of this balance sheet allocation to our U.S. GAAP balance sheet for the period ended June 30, 2013, see “Balance Sheet and Funding Sources” in Part I, Item 2 “Management’s Discussion and Analysis of Financial Condition and Results of Operations” in the firm’s Quarterly Report on Form 10-Q for the period ended June 30, 2013. Appendix Non-GAAP measures
Goldman Sachs Presentation to Barclays Financial Services Conference September 12, 2017 Harvey M. Schwartz President and Co-Chief Operating Officer
