Attached files
| file | filename |
|---|---|
| 8-K - 8-K - COLUMBIA PROPERTY TRUST, INC. | cxp8-k201709presentation.htm |

1
09. 2017
INVESTOR
PRESENTATION

2
FORWARD-LOOKING STATEMENTS
Certain statements contained in this presentation other than historical facts may be considered forward-looking statements. Such statements include,
in particular, statements about our plans, strategies, and prospects, and are subject to certain risks and uncertainties, including known and unknown
risks, which could cause actual results to differ materially from those projected or anticipated. Therefore, such statements are not intended to be a
guarantee of our performance in future periods. Such forward-looking statements can generally be identified by our use of forward-looking
terminology such as "may," "will," "expect," "intend," "anticipate," "estimate," "believe," "continue," or other similar words. These forward-looking
statements include information about possible or assumed future results of the business and our financial condition, liquidity, results of operations,
future plans and objectives. They also include, among other things, statement regarding subjects that are forward-looking by their nature, such as
our business and financial strategy, our 2017 guidance (including projecting net operating income, cash rents and contractual growth), our ability to
obtain future financing, future acquisitions and dispositions of operating assets, future repurchases of common stock, and market and industry trends.
Readers are cautioned not to place undue reliance on these forward-looking statements. We make no representations or warranties (express or
implied) about the accuracy of any such forward-looking statements contained in this presentation, and we do not intend to publicly update or revise
any forward-looking statements, whether as a result of new information, future events, or otherwise.
Any such forward-looking statements are subject to risks, uncertainties, and other factors and are based on a number of assumptions involving
judgments with respect to, among other things, future economic, competitive, and market conditions, all of which are difficult or impossible to predict
accurately. To the extent that our assumptions differ from actual conditions, our ability to accurately anticipate results expressed in such forward-
looking statements, including our ability to generate positive cash flow from operations, make distributions to stockholders, and maintain the value of
our real estate properties, may be significantly hindered. See Item 1A in the Company's most recently filed Annual Report on Form 10-K for the year
ended December 31, 2016, for a discussion of some of the risks and uncertainties that could cause actual results to differ materially from those
presented in our forward-looking statements. The risk factors described in our Annual Report are not the only ones we face but do represent those
risks and uncertainties that we believe are material to us. Additional risks and uncertainties not currently known to us or that we currently deem
immaterial may also harm our business. For additional information, please reference the supplemental report furnished by the Company as Exhibit
99.2 to the Company Form 8-K furnished with the Securities and Exchange Commission on July 27, 2017.
The names, logos and related product and service names, design marks, and slogans are the trademarks or service marks of their respective
companies. When evaluating the Company’s performance and capital resources, management considers the financial impact of investments held
directly and through unconsolidated joint ventures. This presentation includes financial and operational information for our wholly-owned investments
and our proportional interest in unconsolidated investments. We do not control the Market Square Joint Venture and recognize that proportional
financial data may not accurately depict all of the legal and economic implications of our interest in this joint venture. Unless otherwise noted, all data
herein is as of June 30, 2017, and pro forma for the planned return of 263 Shuman Boulevard to the lender.

3
COLUMBIA PROPERTY TRUST
Shares trading 15-25% below estimated net asset value3
Highest dividend yield among gateway office peers
ENTICING VALUE
PROPOSITION
Experienced senior management team averages over 25 years
of real estate experience
Regional leadership platforms in NY, SF and DC
EXPERIENCED
LEADERSHIP
Investment-grade rating (Baa2 Stable / BBB Stable)
Broad access to capital
STRONG & FLEXIBLE
BALANCE SHEET
Desirable properties in amenity-rich CBD locations
~80% of portfolio in NY, SF, & DC1
CHOICE GATEWAY
PORTFOLIO
1Based on gross real estate assets; represents 100% of properties owned through unconsolidated joint ventures.
2From runoff of large lease abatements, signed but not yet commenced leases, and escalators on existing leases.
3Based on consensus analyst estimates as of 9.6.2017.
Below-market lease rates at many properties have contributed
to strong cash leasing spreads – a trend we expect to continue
Additional $50+ million of contractual annual cash NOI2
ATTRACTIVE
EMBEDDED GROWTH

4
DESIRABLE BUILDINGS IN PRIME GATEWAY LOCATIONS
PORTFOL
IO
333 Market St.
San Francisco
University Circle
East Palo Alto, CA
Pasadena Corporate
Park, Los Angeles
650 California St.
San Francisco
221 Main St.
San Francisco
229 W. 43rd St.
New York
116 Huntington Ave.
Boston
Market Square
Washington, D.C.
80 M St.
Washington, D.C.
One & Three Glenlake
Atlanta
Lindbergh Center
Atlanta
Cranberry Woods
Pittsburgh, PA
222 E. 41st St.
New York
95 Columbus
Jersey City, NJ
114 Fifth Ave.
New York
315 Park Ave. S.
New York
95% LEASED
5
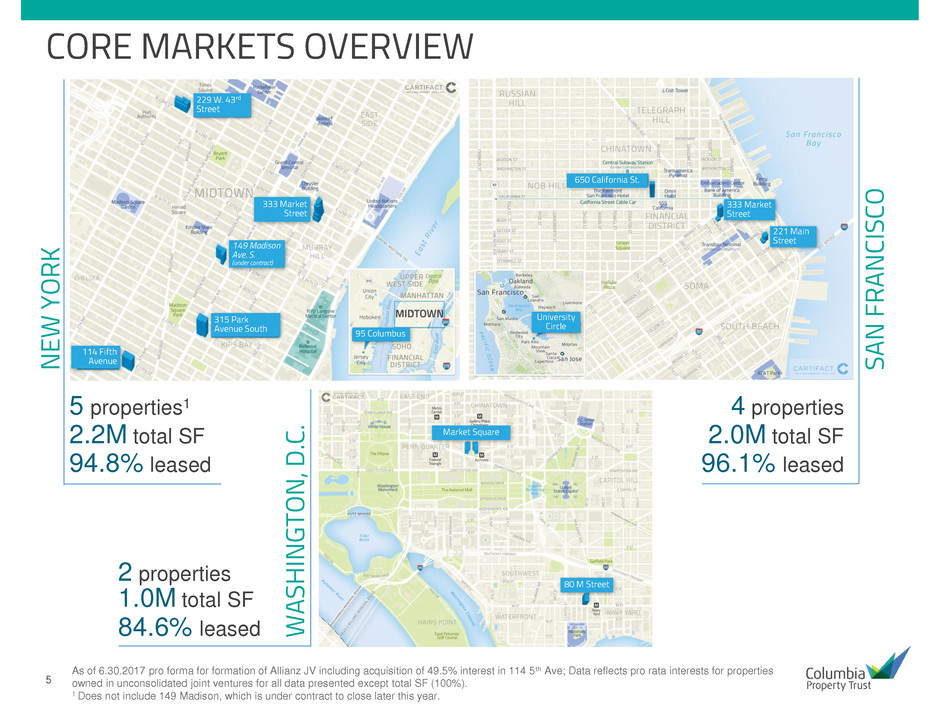
CORE MARKETS OVERVIEW
As of 6.30.2017 pro forma for formation of Allianz JV including acquisition of 49.5% interest in 114 5th Ave; Data reflects pro rata interests for properties
owned in unconsolidated joint ventures for all data presented except total SF (100%).
1 Does not include 149 Madison, which is under contract to close later this year.
5 properties1
2.2M total SF
94.8% leased
4 properties
2.0M total SF
96.1% leased
2 properties
1.0M total SF
84.6% leased
NE
W
YOR
K
SA
N
FR
ANCISC
O
W
AS
HINGTON,
D.C
.
95 Columbus
Market Square
80 M Street
University
Circle
333 Market
Street
650 California St.
221 Main
Street149 Madison
Ave. S.
(under contract)
333 Market
Street
114 Fifth
Avenue
315 Park
Avenue South
229 W. 43rd
Street

6
RECENT LEASING ACHIEVEMENTS
1.6M
30-year, 390,000 SF lease
with NYU Langone for all
of 222 E. 41st
195,000 SF of leases signed YTD
at 650 California, returning the
building to 91% leased despite
50,000 SF April move-out
Expanded and extended
Snapchat for a total 121,000 SF
at 229 W. 43rd
Returned 80 M Street to
94% leased (from 66%)
with 150,000 SF total leasing,
including WeWork lease
One Glenlake Parkway now
100% leased (from 71%)
with 138,000 SF leasing,
including Cotiviti lease
Brought University Circle to 100%
leased with expansion of Amazon
Web Services; eliminated only
substantial near-term roll with 119K
SF renewal of DLA Piper
51%
SF of leases signed on
same-store portfolio
2016-2017 YTD
average cash leasing
spreads during that
period, excluding NYU

7
ADDITIONAL GROWTH FROM VACANCY &
NEAR-TERM LEASE ROLLOVER
PROPERTY VACANCY 2017-2018 ROLL TOTAL HIGHLIGHTS
315 PARK AVE. S.
New York 137,000 0 137,000
• Significant lobby & storefront
renovations to position property as
best-in-class in submarket
• Roll-up opportunity on recently
vacated Credit Suisse SF
MARKET SQUARE(1)
Washington, D.C. 82,000 10,000 92,000
• Renovated to maintain
competitiveness
• Targeting government affairs
offices with spec suites, plus larger
prospects
221 MAIN ST.
San Francisco 18,000 54,000 72,000
• Coveted South of Market address,
with recent upgrades and amenities
that rival new construction
• Significant roll-up opportunity on
expiring leases
116 HUNTINGTON
AVE.
Boston
63,000 0 63,000
• Renovated to reposition as
boutique office
• Renewal successes, plus strong
interest in availability
149 MADISON AVE.
New York 127,000 0 127,000
• Acquisition under contract will be
vacant beginning 1Q18
• Full renovation plans underway,
with initial occupancy expected
in 2019
1Reflects 51% of the SF for the Market Square Joint Venture.
8
194
225
$160M
$180M
$200M
$220M
$240M
$260M
$280M
$300M
2Q 17
Cash NOI
Annualized
Allianz - Step 1
& 263 Shuman
Uncommenced
Leases &
Free Rent
Burnoff
Lease
Bumps
Lease
Expirations
Lease
Rollover
Lease Up
Vacant Space
Pro Forma
Cash NOI
Allianz - Step 2
& Acquisitions
Pro Forma
Cash NOI
+ Acquisitions
225
281
257
Contractual
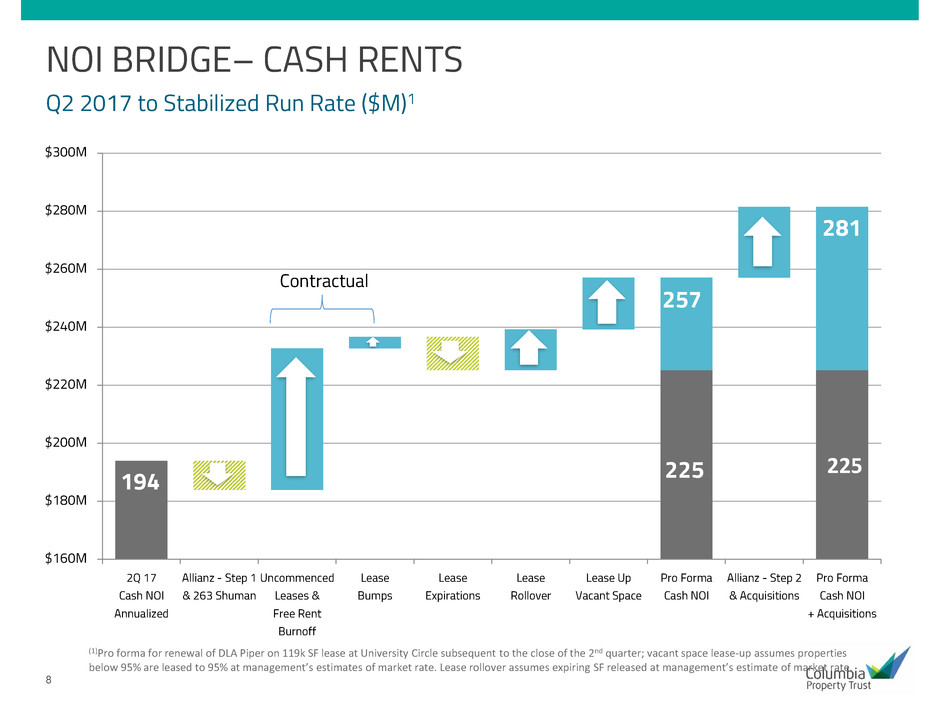
NOI BRIDGE– CASH RENTS
Q2 2017 to Stabilized Run Rate ($M)1
(1)Pro forma for renewal of DLA Piper on 119k SF lease at University Circle subsequent to the close of the 2nd quarter; vacant space lease-up assumes properties
below 95% are leased to 95% at management’s estimates of market rate. Lease rollover assumes expiring SF released at management’s estimate of market rate.

9
69
68 68 68 68 67 67
80
$55M
$60M
$65M
$70M
$75M
$80M
$85M
$90M
2Q 17 Normalized
(2)
3Q 17 4Q 17 1Q 18 2Q 18 3Q 18 (3) 4Q 18 (3)
Leases uncommenced or in abatement at 7/1/17 (contractual)
In place - net of expirations (contractual)
$4-7M of
additional
growth potential
from speculative
leasing of vacant
space and lease
rollover(4)
80
75
717069
EMBEDDED CONTRACTUAL GROWTH WITH LIMITED
NEAR-TERM ROLLOVER
Tenant Revenue – Quarterly Cash Rents(1)
(1) Tenant revenue (base rent + expense reimbursements) based on our portfolio as of 9.6.2017 assuming exit of 263 Shuman and no further acquisitions or
dispositions
(2) 2Q 17 Normalized = 2Q Actual (cash) - 22.5% of University Circle - 22.5% of 333 Market Street - 263 Shuman + 49.5% 114 5th Avenue.
(3) Pro forma for renewal of DLA Piper on 119k SF lease at University Circle subsequent to the close of the 2nd quarter.
(4) Timing of speculative leasing uncertain; low end of range assumes 25% renewal probability at market rate (based on managements estimates) on leases expiring
between 7/1/17 - 12/31/18 and lease up of properties below 90% to 90%. High end of range assumes 75% renewal probability at market on leases expiring between
7/1/17 - 12/31/18 and lease up of properties below 95% to 95%.
1st full quarter of NYU
rent; Affirm free rent
ends (650 Cal)
NYU free rent ends
(222 E 41st); WeWork
free rent ends (650 Cal)
10
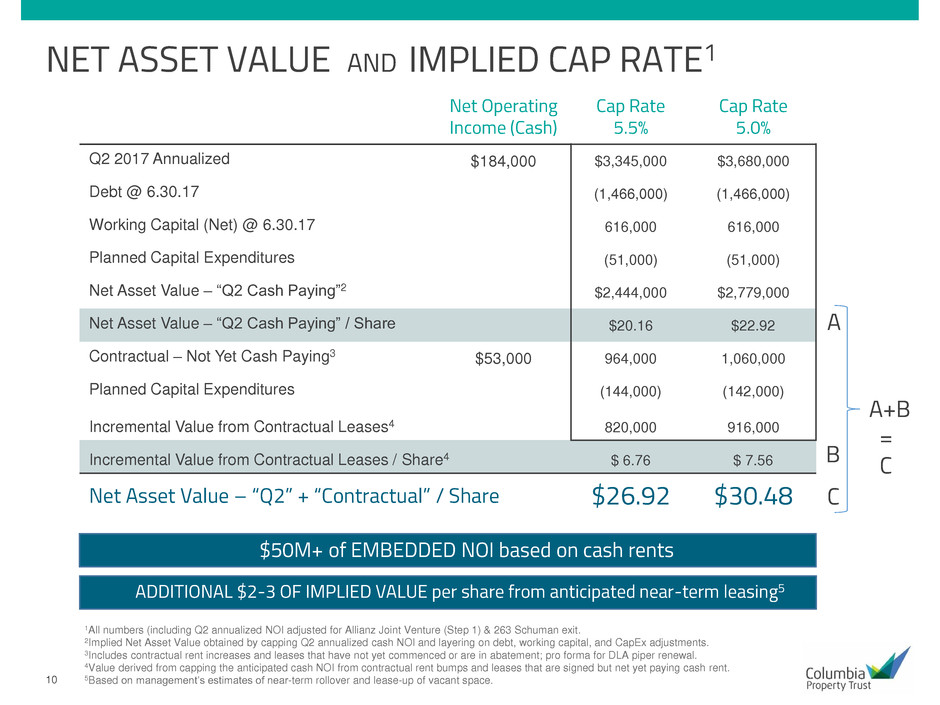
NET ASSET VALUE AND IMPLIED CAP RATE1
1All numbers (including Q2 annualized NOI adjusted for Allianz Joint Venture (Step 1) & 263 Schuman exit.
2Implied Net Asset Value obtained by capping Q2 annualized cash NOI and layering on debt, working capital, and CapEx adjustments.
3Includes contractual rent increases and leases that have not yet commenced or are in abatement; pro forma for DLA piper renewal.
4Value derived from capping the anticipated cash NOI from contractual rent bumps and leases that are signed but net yet paying cash rent.
5Based on management’s estimates of near-term rollover and lease-up of vacant space.
Net Operating
Income (Cash)
Cap Rate
5.5%
Cap Rate
5.0%
Q2 2017 Annualized $184,000 $3,345,000 $3,680,000
Debt @ 6.30.17 (1,466,000) (1,466,000)
Working Capital (Net) @ 6.30.17 616,000 616,000
Planned Capital Expenditures (51,000) (51,000)
Net Asset Value – “Q2 Cash Paying”2 $2,444,000 $2,779,000
Net Asset Value – “Q2 Cash Paying” / Share $20.16 $22.92
Contractual – Not Yet Cash Paying3 $53,000 964,000 1,060,000
Planned Capital Expenditures (144,000) (142,000)
Incremental Value from Contractual Leases4 820,000 916,000
Incremental Value from Contractual Leases / Share4 $ 6.76 $ 7.56
Net Asset Value – “Q2” + “Contractual” / Share $26.92 $30.48
$50M+ of EMBEDDED NOI based on cash rents
A
B
C
ADDITIONAL $2-3 OF IMPLIED VALUE per share from anticipated near-term leasing5
A+B
=
C

11
HIGHEST YIELD & PROJECTED EARNINGS GROWTH
AMONG GATEWAY PEERS
As of 9.6.2017; analyst estimates sourced from S&P Global Market Intelligence.
1.0%
1.5%
2.0%
2.5%
3.0%
3.5%
4.0%
ESRT KRC DEI PGRE BXP HPP SLG VNO CXP
DIVIDEND YIELD vs. GATEWAY OFFICE PEERS
-10.0%
0.0%
10.0%
20.0%
30.0%
40.0%
50.0%
VNO DEI ESRT BXP SLG KRC HPP PGRE CXP
PROJECTED 2018 AFFO/SHARE GROWTH (CONSENSUS ESTIMATES)

12
$25
$166
$300
$150
$350 $350
0
100
200
300
400
500
2017 2018 2019 2020 2021 2022 2023 2024 2025 2026
STABLE & FLEXIBLE BALANCE SHEET
INVESTMENT GRADE
BALANCE SHEET
25% / 75%
Secured Unsecured
25%
Net Debt to
Real-Estate
Assets1
Baa2
Stable /
Ratings
BBB
Stable
5.2x
Net Debt to
EBITDA
DEBT
OUT
STANDIN
G ($M
)
Mortgage Debt
Bonds
Term Loans
WELL-LADDERED MATURITES2
2.12%
3.07%3 5.07%
4.15% 3.65%
5.80%
Market Square4
One Glenlake
$500M undrawn line of credit
Unencumbered asset pool of
$3.3 billion (81% of total
portfolio)
$507M cash balance
$700M of investment
grade bonds issued in
2015-16
LIQUIDITY
1Based on gross real estate assets as of 6.30.2017.
2Pro forma for the exit of 263 Shuman and repayment of 650 California.
3Includes effective rate on variable rate loan swapped to fixed. Pro forma for modification in July 2017 that reduced LIBOR spread by 45 bps.
4Reflects 51% of the mortgage note secured by the Market Square Buildings, which Columbia owns through an unconsolidated joint venture.

13
DIVERSIFIED BASE OF HIGH QUALITY TENANTS
STRONG INDUSTRY DIVERSIFICATION1
Data as of 6.30.17, pro forma for the formation of the Allianz Joint Venture.
1Reflects ALR at CXP’s pro rata share for properties owned through unconsolidated joint ventures.
2Credit rating may reflect the credit rating of the partner or a guarantor. Only the Standard & Poor’s credit rating has been provided.
3Rating represents Yahoo!; in discussions with Verizon (A-) regarding parent guarantee following recent merger.
TOP TENANTS1,2
19%
14%
9%
7%6%
6%
6%
6%
3%
3%
21%
Services - Business Services
Depository Institutions
Transportation & Utilities - Communication
Services - Legal Services
Services - Health Services
Nondepository Institutions
Transportation & Utilities - Electric, Gas, And Sanitary Services
Services - Engineering & Management Services
Security And Commodity Brokers
Real Estate
Other
Tenant
Credit
Rating
% of
ALR
AT&T Corporation/AT&T Services BBB+ 6.8%
Wells Fargo Bank N.A. AA- 6.3%
Pershing LLC A 5.6%
Westinghouse Electric Company Not Rated 4.9%
NYU AA- 4.6%
Verizon / Yahoo!3 BB+ 4.5%
Newell Brands, Inc. BBB- 2.9%
DocuSign, Inc. Not Rated 2.7%
WeWork Companies Not Rated 2.3%
DLA Piper US, LLP Not Rated 2.0%
Amazon Web Services, Inc. AA- 2.0%

14
STRATEGIC JOINT VENTURE
with Allianz Real Estate
HIGHLIGHTS
Ability to increase scale in top markets on a
leverage-neutral basis
Attractive cost of capital
Initial gross asset value of $1.26B
Plans to acquire additional assets in select gateway
markets
Allianz to increase to 45% interest in University
Circle and 333 Market Street within next 12 months
Joint Venture Ownership Interest
Property
CXP Allianz
49.5%* 49.5%* 114 Fifth Avenue, New York
77.5% 22.5% University Circle, San Francisco
77.5% 22.5% 333 Market Street, San Francisco
*L&L Holding Co. LLC holds a 1% ownership interest in 114 Fifth Avenue.

15
COLUMBIA PROPERTY TRUST – SENIOR TEAM
KEVIN HOOVER
SVP – Portfolio
Management
NELSON MILLS
President and CEO
JIM FLEMING
Executive VP
and CFO
WENDY GILL
SVP - Corporate
Operations and Chief
Accounting Officer
DAVID DOWDNEY
SVP – Western
Region
ADAM POPPER
SVP – Eastern
Region
MARK WITSCHORIK
VP – Eastern Region,
Washington D.C.
MICHAEL SCHMIDT
VP – Western Region
AMY TABB
VP – Portfolio
Operations
KELLY LIM
VP – Eastern Region,
New York
LINDA BOLAN
VP – National
Property Management
and Sustainability
DOUG MCDONALD
VP – Finance

16
LOOKING AHEAD
OPPORTUNITIES FOR INVESTMENT
Acquisitions in target markets
Individual assets
Portfolio acquisitions
Share repurchases
Reposition and lease 149 Madison
ADDITIONAL SOURCES OF CAPITAL
Allianz increased interest in
University Circle & 333 Market
(see page 14)
Recycle assets
$507M
Cash on hand1
$500M
Available line of
credit balance
1As of 6.30.2017.

17
APPENDIX
FOR MORE INFORMATION
Columbia Property Trust
INVESTOR RELATIONS
404.465.2227
ir@columbia.reit
www.columbia.reit
18
221 226226
259
286
$160M
$180M
$200M
$220M
$240M
$260M
$280M
$300M
2Q 17
GAAP NOI…
Allianz - Step 1
& 263 Shuman
Uncommenced Leases Lease
Expirations
Lease
Rollover
Lease Up
Vacant Space
Pro Forma
GAAP NOI
Allianz - Step 2
& Acquisitions
Pro Forma
GAAP NOI…
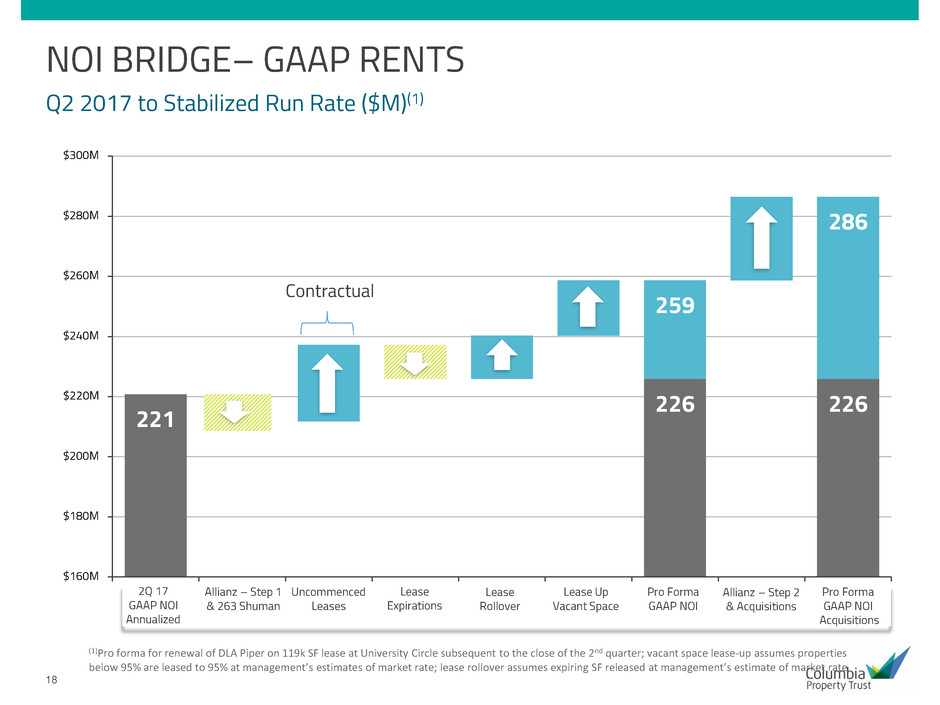
NOI BRIDGE– GAAP RENTS
2Q 17
GAAP NOI
Annualized
Allianz – Step 1
& 263 Shuman
Uncommenced
Leases
Lease
Expirations
Lease
Rollover
Lease Up
Vacant Space
Pro Forma
GAAP NOI
Allianz – Step 2
& Acquisitions
Pro Forma
GAAP NOI
Acquisitions
Contractual
Q2 2017 to Stabilized Run Rate ($M)(1)
(1)Pro forma for renewal of DLA Piper on 119k SF lease at University Circle subsequent to the close of the 2nd quarter; vacant space lease-up assumes properties
below 95% are leased to 95% at management’s estimates of market rate; lease rollover assumes expiring SF released at management’s estimate of market rate

19
EMBEDDED CONTRACTUAL GROWTH WITH LIMITED
NEAR-TERM ROLLOVER
78
77 77 77 76 76 75
83
$55M
$60M
$65M
$70M
$75M
$80M
$85M
$90M
2Q 17 Normalized
(2)
3Q 17 4Q 17 1Q 18 2Q 18 3Q 18 (3) 4Q 18 (3)
Leases uncommenced at 7/1/17 (contractual)
In place (contractual)
83838282
80
90.3
$4-7M of
Additional
growth potential
from speculative
leasing of vacant
space and lease
rollover(4)
Tenant Revenue – Quarterly GAAP Rents(1)
(1) Tenant revenue (base rent + expense reimbursements) based on our portfolio as of 9.6.2017 assuming exit of 263 Shuman and no further acquisitions or
dispositions
(2) 2Q 17 Normalized = 2Q Actual (GAAP) - 22.5% of University Circle - 22.5% of 333 Market Street - 263 Shuman + 49.5% 114 5th Avenue.
(3) Pro forma for renewal of DLA Piper on 119k SF lease at University Circle subsequent to the close of the 2nd quarter.
(4) Timing of speculative leasing uncertain; low end of range assumes 25% renewal probability at market rate (based on managements estimates) on leases expiring
between 7/1/17 - 12/31/18 and lease up of properties below 90% to 90%. High end of range assumes 75% renewal probability at market on leases expiring between
7/1/17 - 12/31/18 and lease up of properties below 95% to 95%.
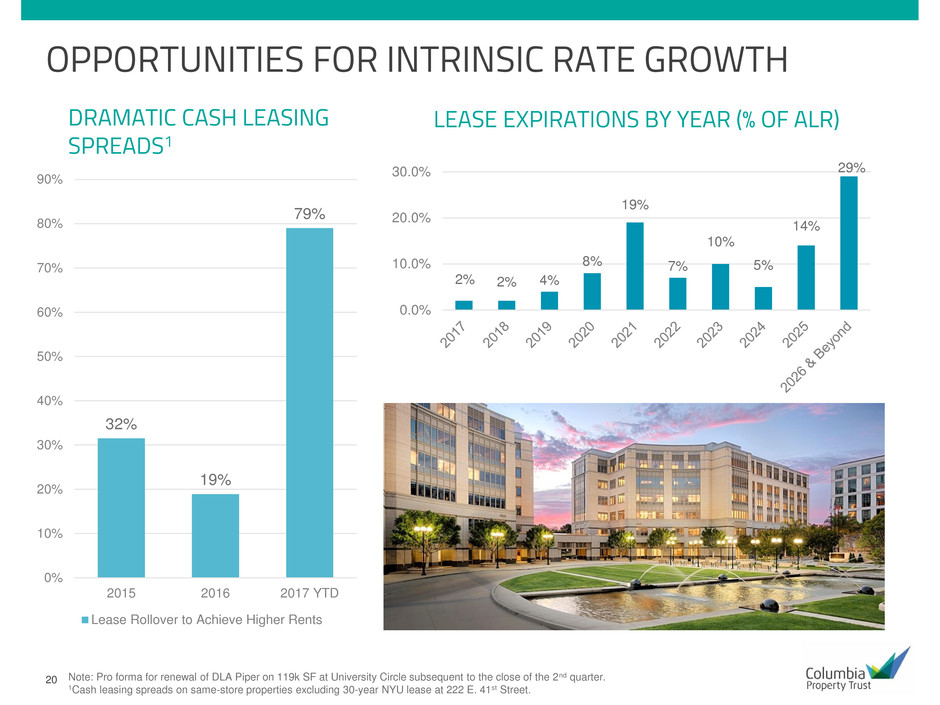
20
OPPORTUNITIES FOR INTRINSIC RATE GROWTH
2% 2% 4%
8%
19%
7%
10%
5%
14%
29%
0.0%
10.0%
20.0%
30.0%
32%
19%
79%
0%
10%
20%
30%
40%
50%
60%
70%
80%
90%
2015 2016 2017 YTD
Lease Rollover to Achieve Higher Rents
Note: Pro forma for renewal of DLA Piper on 119k SF at University Circle subsequent to the close of the 2nd quarter.
1Cash leasing spreads on same-store properties excluding 30-year NYU lease at 222 E. 41st Street.
DRAMATIC CASH LEASING
SPREADS1
LEASE EXPIRATIONS BY YEAR (% OF ALR)

21
EMBEDDED GROWTH FROM SIGNED LEASES1
TENANT PROPERTY MARKET
SF
(000s)
CURRENTLY IN
ABATEMENT
NOT YET
COMMENCED
NYU Langone Medical Center 222 E. 41st Street NY 390 ✔
WeWork 80 M Street DC 69 ✔
WeWork 650 California Street SF 61 ✔
Bustle 315 Park Avenue South NY 34 ✔
Other Abated Leases 150 ✔
DLA Piper (renewal)2 University Circle SF 92 ✔
Affirm 650 California Street SF 81 ✔
Cotiviti One Glenlake ATL 66 ✔
Snap 229 West 43rd Street NY 26 ✔
Other Leases Not Yet Commenced 96 ✔
Total Embedded NOI – Cash Rents3 $35.2M $18.0M
1SF and NOI for joint ventures are reflected at CXP’s ownership interest
2DLA Piper has given notice that they will exercise their renewal option; new lease at higher rate not yet commenced
3Non-GAAP financial measure. See Appendix.

22
149 MADISON
HIGHLIGHTS
14’+ slab-to-slab ceiling heights throughout
Oversized windows
Highly-desirable boutique-sized floorplates (10,400 SF)
Potential for rooftop deck with city skyline views
Submarket: Midtown South
Year Built: 1916
Total Rentable SF: 127,000
Columbia is under contract to acquire 149 Madison Avenue
later this year, expanding our presence in New York.
149 Madison is a 12-story building located in the heart of the
NoMAD district of Midtown South, on the southeast corner of 32nd
Street and Madison Avenue. One of New York’s most vibrant
neighborhoods, the Midtown South submarket has become one of
the most attractive and dynamic locations in Manhattan.
Columbia plans to invest significant capital to perform a
comprehensive renovation of the property, including updating and
upgrading its infrastructure, interior and exterior finishes, and
common areas throughout to give it a modern boutique office feel.

23
LEASING SUCCESS CASE STUDIES
650 CALIFORNIA
SAN FRANCISCO
222 E. 41ST STREET
NEW YORK
Primary tenant Jones Day informed us of
plans to vacate upon lease expiration in
Oct. 2016 (353K SF)
Began exploring multi-tenant strategies
as well as potential full-building users in
2015
Signed 30-Year, 390K SF lease with NYU
221K SF of rollover from 2016-April 2017:
Low retention rate by design to bring
building up to market rate
Upgraded lobby and amenities and
embarked on selective spec suite program
Returned building to 91% leased with 218K
SF of leasing in last 12 months, including
195K YTD 2017

24
LEASING SUCCESS CASE STUDIES
150k SF Oracle downsize created 29%
vacancy
Upgraded common areas and amenities to
best-in-submarket
Returned property to 100% leased with
138,000 SF leasing since Nov. 2016,
including 66K SF Cotiviti lease
Rebranded property to attract more
creative tenant base and compete with
new construction in submarket
Signed150,000 SF of leases to return
building to 94% leased
ONE GLENLAKE
ATLANTA
80 M STREET
WASHINGTON, D.C.

25
LEASING SUCCESS CASE STUDIES
229 W. 43RD STREET
NEW YORK
UNIVERSITY CIRCLE
SAN FRANCISCO
Capitalized on two large vacates by
rebranding formerly law-firm-centric property
to attract more diverse tenant base in 2012
Subsequently signed and expanded Amazon
Web Services and other tech tenants,
reaching 100% occupancy while raising in-
place gross rates over 30% (from $68 to $90
PSF)
Eliminated only substantial near-term roll with
119K SF renewal of DLA Piper (mid-2018
expiration).
Expanded and extended Snap on 121K SF
Brings building to 100% leased, with all
near-term roll pre-leased, with positive
leasing spreads

26
RECONCILIATIONS: NON-GAAP TO COMPARABLE GAAP
MEASURES
(in thousands) Three Months
Ended 6/30/17 Annualized
Net Cash Provided by Operating Activities $ 30,224 $ 120,896
Straight line rental income 6,087 24,348
Depreciation of real estate assets (20,423) (81,692)
Amortization of lease-related costs (7,920) (31,680)
Loss from unconsolidated joint venture (1,817) (7,268)
Other non-cash expenses (2,981) (11,924)
Net changes in operating assets & liabilities (2,037) (8,148)
Net Income $ 1,133 $ 4,532
Interest expense (net) 13,785 55,140
Interest income from development authority bonds (1,800) (7,200)
Income tax benefit 7 28
Depreciation of real estate assets 20,423 81,692
Amortization of lease-related costs 8.191 32,764
Adjustments from unconsolidated joint venture 4,233 16,932
EBITDA $ 45,972 $ 183,888
Adjusted EBITDA $ 45,972 $ 183,888
General and administrative 9,201 36,804
Straight line rental income (5,893) (23,572)
Net effect of below market amortization (271) (1,084)
Adjustments from unconsolidated joint venture (512) (2,048)
Net Operating Income (based on cash rents) $ 48,497 $ 193,988

27
RECONCILIATIONS: NON-GAAP TO COMPARABLE GAAP
MEASURES
(continued from prior page)
(in thousands) Three Months
Ended 6/30/17 Annualized
Net Operating Income (based on cash rents) $ 48,497 $ 193,988
Allianz Step 1 & 263 Shuman Disposition (2,500) (10,000)
Uncommenced Leases & Free Rent Burnoff 12,000 48,000
Lease Bumps 1,003 4,012
Lease Expirations (2,750) (11,000)
Lease Rollover 3,500 14,000
Lease Up Vacant Space 4,500 18,000
Net Operating Income (based on cash rents) – “Pro Forma” $ 64,250 $ 257,000
Allianz Step 2 & Acquisitions 6,000 24,000
Net Operating Income (based on cash rents) – “Pro Forma” + “Acquisitions” $ 70,250 $ 281,000

28
RECONCILIATIONS: NON-GAAP TO COMPARABLE GAAP
MEASURES
(in thousands) Three Months
Ended 6/30/17 Annualized
Net Income $ 1,133 $ 4,532
Interest expense (net) 13,785 55,140
Interest income from development authority bonds (1,800) (7,200)
Income tax benefit 7 28
Depreciation of real estate assets 20,423 81,692
Amortization of lease-related costs 8.191 32,764
Adjustments from unconsolidated joint venture 4,233 16,932
EBITDA $ 45,972 $ 183,888
Adjusted EBITDA $ 45,972 $ 183,888
General and administrative 9,201 36,804
Adjustments from unconsolidated joint venture 9 36
Net Operating Income (based on GAAP rents) $ 55,182 $ 220,728
Allianz Step 1 & 263 Shuman Disposition (2,182) (8,728)
Uncommenced Leases 6,500 26,000
Lease Expirations (2,750) (11,000)
Lease Rollover 3,500 14,000
Lease Up Vacant Space 4,500 18,000
Net Operating Income (based on GAAP rents) – “Pro Forma” $ 64,750 $ 259,000
Allianz Step 2 & Acquisitions 6,750 27,000
Net Operating Income (based on GAAP rents) – “Pro Forma” + “Acquisitions” $ 71,500 $ 286,000

29
RECONCILIATIONS: NON-GAAP TO COMPARABLE GAAP
MEASURES
(in thousands) Three Months
Ended 6/30/17
Total Revenues – GAAP $ 74,857
Total Revenues – CXP’s Interest in Unconsolidated Joint Ventures 5,318
Total Revenues $ 80,175
Allianz Step 1 & 263 Shuman Disposition 189
Other Property Income & Lease Termination Income (764)
Lease Expirations – 2Q 17 (900)
Total Revenues – 2Q 17 Normalized (GAAP) $ 78,700
Total Revenues – GAAP $ 74,857
Total Revenues – CXP’s Interest in Unconsolidated Joint Ventures 5,318
Total Revenues $ 80,175
Allianz Step 1 & 263 Shuman Disposition 189
Other Property Income & Lease Termination Income (764)
Lease Expirations – 2Q 17 (900)
Straight-line Rent & Other Adjustments (9,400)
Total Revenues – 2Q 17 Normalized (Cash) $ 69,300
