Attached files
| file | filename |
|---|---|
| 8-K - PMT FORM 8-K (09-11-17) - PennyMac Mortgage Investment Trust | pmt-8k_20170911.htm |

PennyMac Mortgage Investment Trust September 11, 2017 Barclays Global Financial Services Conference Exhibit 99.1
Forward-Looking Statements This presentation contains forward-looking statements within the meaning of Section 21E of the Securities Exchange Act of 1934, as amended, regarding management’s beliefs, estimates, projections and assumptions with respect to, among other things, the Company’s financial results, future operations, business plans and investment strategies, as well as industry and market conditions, all of which are subject to change. Words like “believe,” “expect,” “anticipate,” “promise,” “plan,” and other expressions or words of similar meanings, as well as future or conditional verbs such as “will,” “would,” “should,” “could,” or “may” are generally intended to identify forward-looking statements. Actual results and operations for any future period may vary materially from those projected herein, from past results discussed herein, or illustrative examples provided herein. Factors which could cause actual results to differ materially from historical results or those anticipated include, but are not limited to: changes in our investment objectives or investment or operational strategies, including any new lines of business or new products and services that may subject us to additional risks; volatility in our industry, the debt or equity markets, the general economy or the real estate finance and real estate markets specifically, whether the result of market events or otherwise; events or circumstances which undermine confidence in the financial markets or otherwise have a broad impact on financial markets, such as the sudden instability or collapse of large depository institutions or other significant corporations, terrorist attacks, natural or man-made disasters, or threatened or actual armed conflicts; changes in general business, economic, market, employment and political conditions, or in consumer confidence and spending habits from those expected; declines in real estate or significant changes in U.S. housing prices or activity in the U.S. housing market; the availability of, and level of competition for, attractive risk-adjusted investment opportunities in mortgage loans and mortgage-related assets that satisfy our investment objectives; the inherent difficulty in winning bids to acquire mortgage loans, and our success in doing so; the concentration of credit risks to which we are exposed; the degree and nature of our competition; our dependence on our manager and servicer, potential conflicts of interest with such entities and their affiliates, and the performance of such entities; changes in personnel and lack of availability of qualified personnel at our manager, servicer or their affiliates; the availability, terms and deployment of short-term and long-term capital; the adequacy of our cash reserves and working capital; our ability to maintain the desired relationship between our financing and the interest rates and maturities of our assets; the timing and amount of cash flows, if any, from our investments; unanticipated increases or volatility in financing and other costs, including a rise in interest rates; the performance, financial condition and liquidity of borrowers; the ability of our servicer, which also provides us with fulfillment services, to approve and monitor correspondent sellers and underwrite loans to investor standards; incomplete or inaccurate information or documentation provided by customers or counterparties, or adverse changes in the financial condition of our customers and counterparties; our indemnification and repurchase obligations in connection with mortgage loans we purchase and later sell or securitize; the quality and enforceability of the collateral documentation evidencing our ownership and rights in the assets in which we invest; increased rates of delinquency, default and/or decreased recovery rates on our investments; our ability to foreclose on our investments in a timely manner or at all; increased prepayments of the mortgages and other loans underlying our mortgage-backed securities or relating to our mortgage servicing rights , excess servicing spread and other investments; the degree to which our hedging strategies may or may not protect us from interest rate volatility; the effect of the accuracy of or changes in the estimates we make about uncertainties, contingencies and asset and liability valuations when measuring and reporting upon our financial condition and results of operations; our failure to maintain appropriate internal controls over financial reporting; technologies for loans and our ability to mitigate security risks and cyber intrusions; our ability to obtain and/or maintain licenses and other approvals in those jurisdictions where required to conduct our business; our ability to detect misconduct and fraud; our ability to comply with various federal, state and local laws and regulations that govern our business; developments in the secondary markets for our mortgage loan products; legislative and regulatory changes that impact the mortgage loan industry or housing market; changes in regulations or the occurrence of other events that impact the business, operations or prospects of government agencies or government-sponsored entities, or such changes that increase the cost of doing business with such entities; the Dodd-Frank Wall Street Reform and Consumer Protection Act and its implementing regulations and regulatory agencies, and any other legislative and regulatory changes that impact the business, operations or governance of mortgage lenders and/or publicly-traded companies; the Consumer Financial Protection Bureau and its issued and future rules and the enforcement thereof; changes in government support of homeownership; changes in government or government-sponsored home affordability programs; limitations imposed on our business and our ability to satisfy complex rules for us to qualify as a real estate investment trust (REIT) for U.S. federal income tax purposes and qualify for an exclusion from the Investment Company Act of 1940 and the ability of certain of our subsidiaries to qualify as REITs or as taxable REIT subsidiaries for U.S. federal income tax purposes, as applicable, and our ability and the ability of our subsidiaries to operate effectively within the limitations imposed by these rules; changes in governmental regulations, accounting treatment, tax rates and similar matters (including changes to laws governing the taxation of REITs, or the exclusions from registration as an investment company); the effect of public opinion on our reputation; the occurrence of natural disasters or other events or circumstances that could impact our operations; and our organizational structure and certain requirements in our charter documents. You should not place undue reliance on any forward-looking statement and should consider all of the uncertainties and risks described above, as well as those more fully discussed in reports and other documents filed by the Company with the Securities and Exchange Commission from time to time. The Company undertakes no obligation to publicly update or revise any forward-looking statements or any other information contained herein, and the statements made in this presentation are current as of the date of this presentation only. 2017 Barclays Global Financial Services Conference
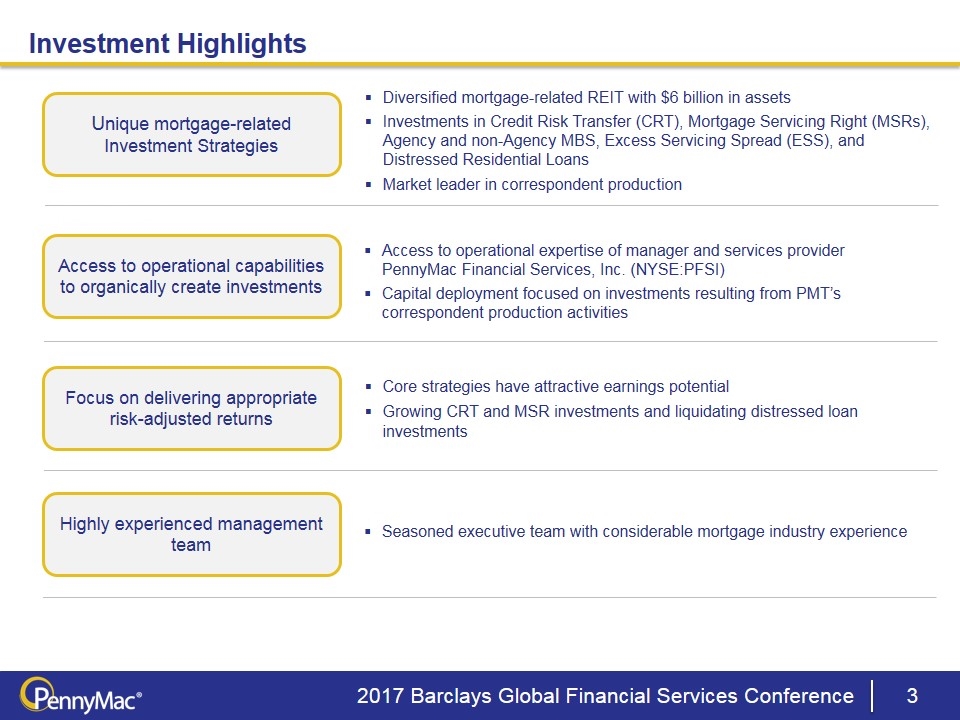
Investment Highlights 2017 Barclays Global Financial Services Conference Access to operational expertise of manager and services provider PennyMac Financial Services, Inc. (NYSE:PFSI) Capital deployment focused on investments resulting from PMT’s correspondent production activities Unique mortgage-related Investment Strategies Access to operational capabilities to organically create investments Focus on delivering appropriate risk-adjusted returns Diversified mortgage-related REIT with $6 billion in assets Investments in Credit Risk Transfer (CRT), Mortgage Servicing Right (MSRs), Agency and non-Agency MBS, Excess Servicing Spread (ESS), and Distressed Residential Loans Market leader in correspondent production Core strategies have attractive earnings potential Growing CRT and MSR investments and liquidating distressed loan investments Highly experienced management team Seasoned executive team with considerable mortgage industry experience
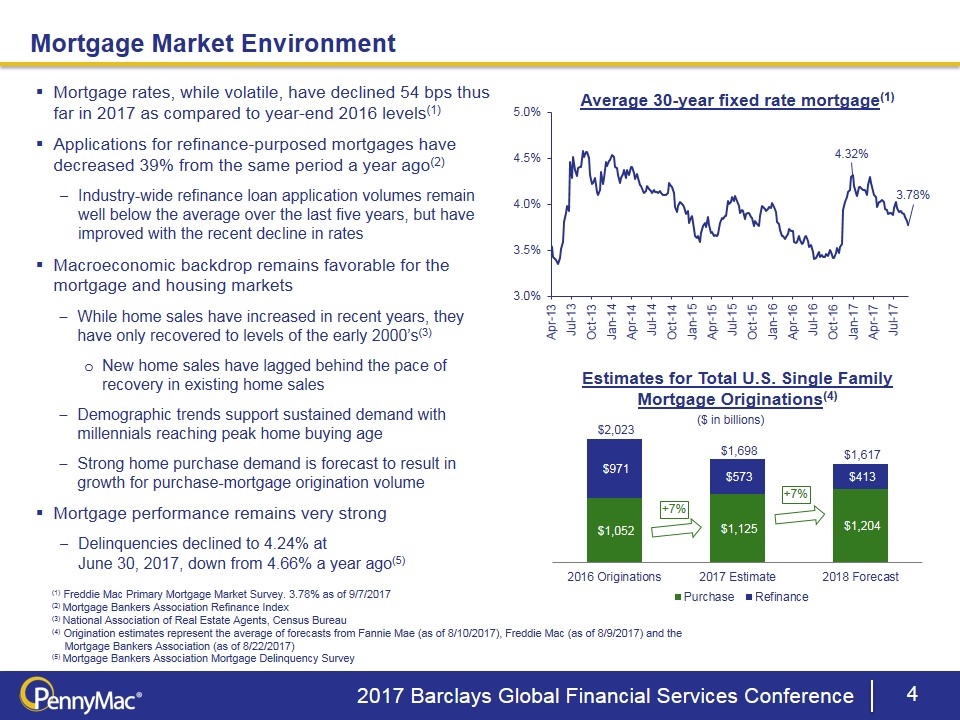
(1) Freddie Mac Primary Mortgage Market Survey. 3.78% as of 9/7/2017 (2) Mortgage Bankers Association Refinance Index (3) National Association of Real Estate Agents, Census Bureau (4) Origination estimates represent the average of forecasts from Fannie Mae (as of 8/10/2017), Freddie Mac (as of 8/9/2017) and the Mortgage Bankers Association (as of 8/22/2017) (5) Mortgage Bankers Association Mortgage Delinquency Survey Mortgage rates, while volatile, have declined 54 bps thus far in 2017 as compared to year-end 2016 levels(1) Applications for refinance-purposed mortgages have decreased 39% from the same period a year ago(2) Industry-wide refinance loan application volumes remain well below the average over the last five years, but have improved with the recent decline in rates Macroeconomic backdrop remains favorable for the mortgage and housing markets While home sales have increased in recent years, they have only recovered to levels of the early 2000’s(3) New home sales have lagged behind the pace of recovery in existing home sales Demographic trends support sustained demand with millennials reaching peak home buying age Strong home purchase demand is forecast to result in growth for purchase-mortgage origination volume Mortgage performance remains very strong Delinquencies declined to 4.24% at June 30, 2017, down from 4.66% a year ago(5) Estimates for Total U.S. Single Family Mortgage Originations(4) +7% Average 30-year fixed rate mortgage(1) ($ in billions) Mortgage Market Environment 2017 Barclays Global Financial Services Conference
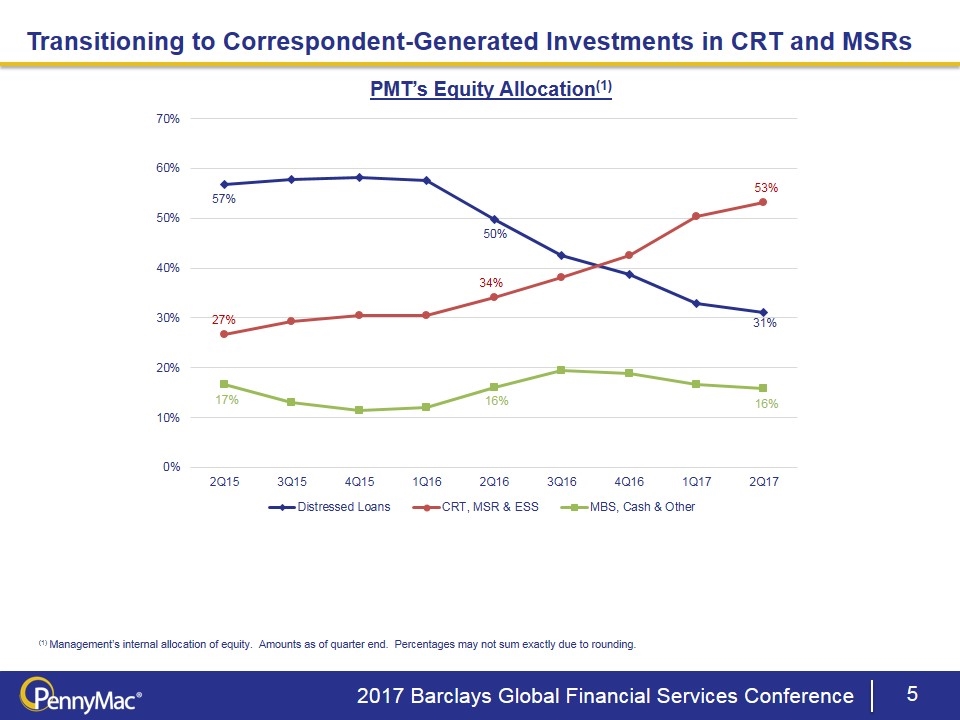
Transitioning to Correspondent-Generated Investments in CRT and MSRs PMT’s Equity Allocation(1) (1) Management’s internal allocation of equity. Amounts as of quarter end. Percentages may not sum exactly due to rounding. 2017 Barclays Global Financial Services Conference
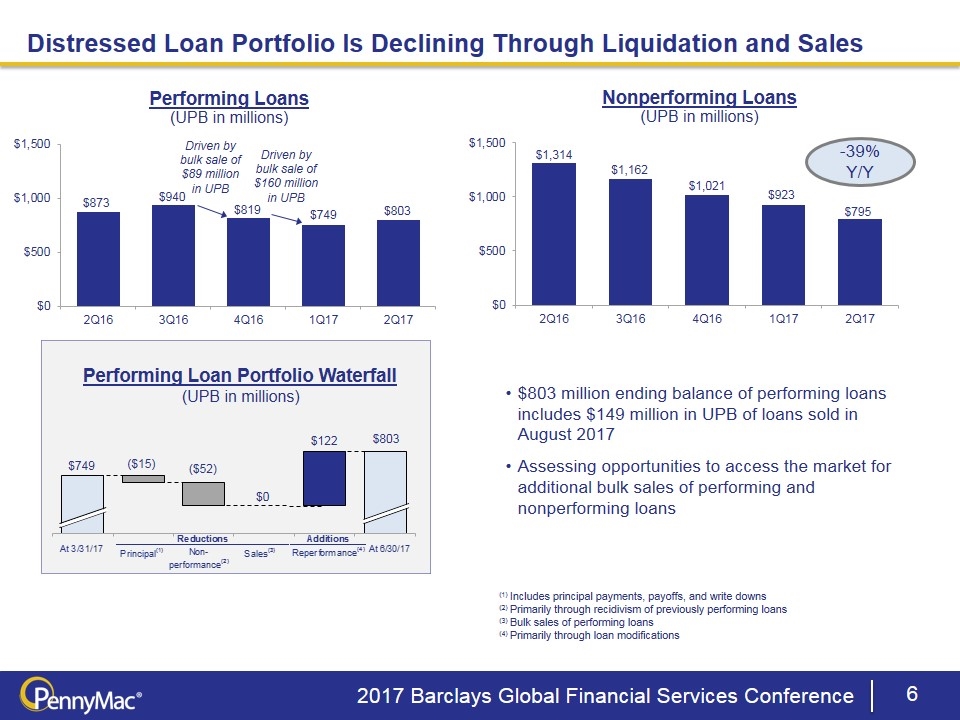
Driven by bulk sale of $160 million in UPB Driven by bulk sale of $89 million in UPB Distressed Loan Portfolio Is Declining Through Liquidation and Sales $803 million ending balance of performing loans includes $149 million in UPB of loans sold in August 2017 Assessing opportunities to access the market for additional bulk sales of performing and nonperforming loans (1) Includes principal payments, payoffs, and write downs (2) Primarily through recidivism of previously performing loans (3) Bulk sales of performing loans (4) Primarily through loan modifications Performing Loan Portfolio Waterfall (UPB in millions) -39% Y/Y $0 2017 Barclays Global Financial Services Conference Value Bounds Start End At 3/31/17 $202.9 $748.75710600000002 $202.9 Runoff $566.95113100000003 $202.9 $769.85113100000001 $202.9 $787.429847 $17.578716 $769.85113100000001 $787.429847 $16.3 $787.429847 $803.72984699999995 $-,584.52984700000002 At 6/30/17 803.72984699999995 0.53180000000000005 Value Bounds Start End 0.16550000000000001 At 3/31/17 202.9 202.9 202.9 2.3E-2 Runoff -7.7787160000000171 202.9 195.121284 202.9 17.578716 195.121284 212.7 16.3 212.7 229 MSR acquisitions 0 229 229 At 6/30/17 229 1207.0069999999998 9655.6219999999994 10862.628999999999 10.862628999999998 $,111,611,716.76000001 $,161,902,183.62 $,273,513,900.38 $0.27351390038000001 194.4 185024614 182.1 6.7545304777594795E-2 306813148 Base Fall Rise Flow At 3/31/17 0 200000000 748757106 At 3/31/17 Payoffs/Pay downs/Write downs 185024614 14975386 0 -14975386 Payoffs/Pay downs/Write downs New Adds via Re-performance 185024614 0 121788534 121788534 New Adds via Re-performance Departures via Non-performance 254522741 52290407 0 -52290407 Departures via Non-performance At 6/30/17 254522741 At 6/30/17 748757106 -14975386 121788534 -52290407 803279847 733.78172000000006 681.4913130000001 Base Fall Rise At 3/31/17 0 0 748.75710600000002 Payoffs 733.78172000000006 14.975386 0 Non-performance 681.4913130000001 52.290407000000002 0 Re-performance 681.4913130000001 0 121.788534 At 6/30/17 803.27984700000013 Additions Performance(1) Reductions Payoffs Non-performance Sales Reductions Payoffs Non-performance Sales Reductions Payoffs Non-performance Sales Reductions Payoffs Non-performance At 3/31/17 At 6/30/17 Value Bounds Start End At 3/31/17 $202.9 $748.75710600000002 $202.9 Runoff $566.95113100000003 $202.9 $769.85113100000001 $202.9 $787.429847 $17.578716 $769.85113100000001 $787.429847 $16.3 $787.429847 $803.72984699999995 $-,584.52984700000002 At 6/30/17 803.72984699999995 0.53180000000000005 Value Bounds Start End 0.16550000000000001 At 3/31/17 202.9 202.9 202.9 2.3E-2 Runoff -7.7787160000000171 202.9 195.121284 202.9 17.578716 195.121284 212.7 16.3 212.7 229 MSR acquisitions 0 229 229 At 6/30/17 229 1207.0069999999998 9655.6219999999994 10862.628999999999 10.862628999999998 $,111,611,716.76000001 $,161,902,183.62 $,273,513,900.38 $0.27351390038000001 194.4 185024614 182.1 6.7545304777594795E-2 306813148 Base Fall Rise Flow At 3/31/17 0 200000000 748757106 At 3/31/17 Payoffs/Pay downs/Write downs 185024614 14975386 0 -14975386 Payoffs/Pay downs/Write downs New Adds via Re-performance 185024614 0 121788534 121788534 New Adds via Re-performance Departures via Non-performance 254522741 52290407 0 -52290407 Departures via Non-performance At 6/30/17 254522741 At 6/30/17 748757106 -14975386 121788534 -52290407 803279847 733.78172000000006 681.4913130000001 Base Fall Rise At 3/31/17 0 0 748.75710600000002 Payoffs 733.78172000000006 14.975386 0 Non-performance 681.4913130000001 52.290407000000002 0 Re-performance 681.4913130000001 0 121.788534 At 6/30/17 803.27984700000013 Additions Performance(1) Reductions Payoffs Non-performance Sales Reductions Payoffs Non-performance Sales Reductions Payoffs Non-performance Sales Reductions Payoffs Non-performance At 3/31/17 At 6/30/17 Value Bounds Start End 0 0 $,111,611,716.76000001 $,161,902,183.62 $,273,513,900.38 $0.27351390038000001 194.4 185024614 182.1 6.7545304777594795E-2 306813148 Base Fall Rise Flow At 3/31/17 0 200000000 748757106 At 3/31/17 Payoffs/Pay downs/Write downs 185024614 14975386 0 -14975386 Payoffs/Pay downs/Write downs New Adds via Re-performance 185024614 0 121788534 121788534 New Adds via Re-performance Departures via Non-performance 254522741 52290407 0 -52290407 Departures via Non-performance At 6/30/17 254522741 At 6/30/17 748757106 -14975386 121788534 -52290407 803279847 733.78172000000006 681.4913130000001 Base Fall Rise At 3/31/17 0 0 748.75710600000002 Payoffs 733.78172000000006 14.975386 0 Non-performance 681.4913130000001 52.290407000000002 0 Re-performance 681.4913130000001 0 121.788534 At 6/30/17 803.27984700000013 -0.13867822318526546 7.2096128170894502E-2 Additions Performance(4) Reductions Payoffs Non-performance Sales Reductions Payoffs Non-performance Sales Reductions Principal(1) Non-performance(2) Sales(3) Reductions Payoffs Non-performance(3) At 3/31/17 At 6/30/17 Value Bounds Start End 0 0 $,111,611,716.76000001 $,161,902,183.62 $,273,513,900.38 $0.27351390038000001 194.4 185024614 182.1 6.7545304777594795E-2 306813148 Base Fall Rise Flow At 3/31/17 0 200000000 748757106 At 3/31/17 Payoffs/Pay downs/Write downs 185024614 14975386 0 -14975386 Payoffs/Pay downs/Write downs New Adds via Re-performance 185024614 0 121788534 121788534 New Adds via Re-performance Departures via Non-performance 254522741 52290407 0 -52290407 Departures via Non-performance At 6/30/17 254522741 At 6/30/17 748757106 -14975386 121788534 -52290407 803279847 733.78172000000006 681.4913130000001 Base Fall Rise At 3/31/17 0 0 748.75710600000002 Payoffs 733.78172000000006 14.975386 0 Non-performance 681.4913130000001 52.290407000000002 0 Re-performance 681.4913130000001 0 121.788534 At 6/30/17 803.27984700000013 -0.13867822318526546 7.2096128170894502E-2 Additions Reperformance(4) Reductions Payoffs Non-performance Sales Reductions Payoffs Non-performance Sales Reductions Payoffs(1) Non-performance(2) Sales(3) Reductions Payoffs Non-performance(3) At 3/31/17 At 6/30/17
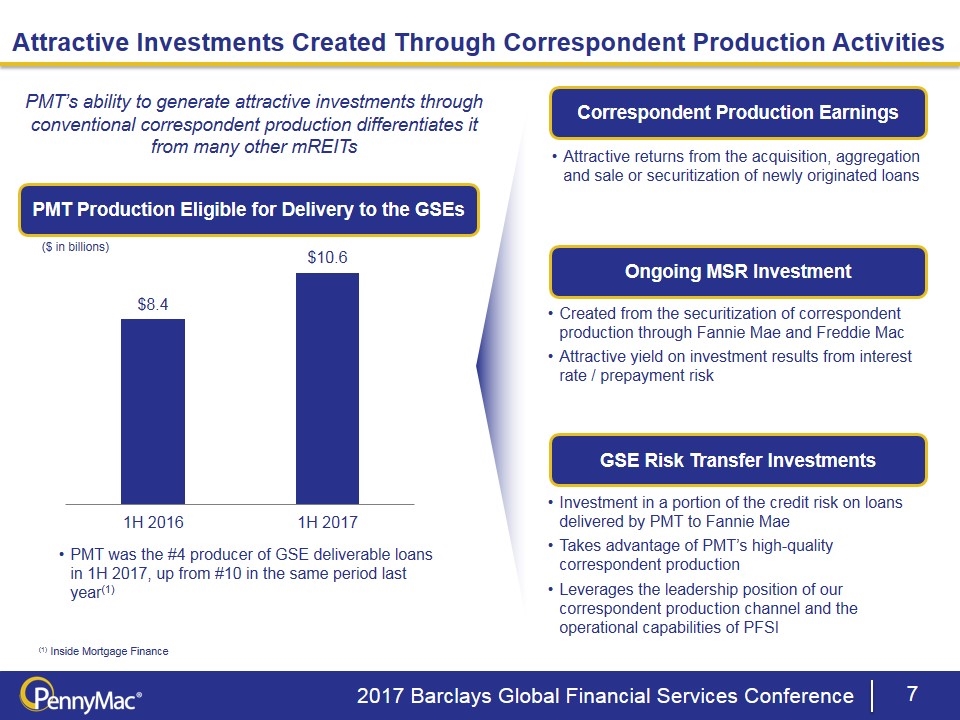
GSE Risk Transfer Investments Ongoing MSR Investment Correspondent Production Earnings Attractive Investments Created Through Correspondent Production Activities Investment in a portion of the credit risk on loans delivered by PMT to Fannie Mae Takes advantage of PMT’s high-quality correspondent production Leverages the leadership position of our correspondent production channel and the operational capabilities of PFSI PMT Production Eligible for Delivery to the GSEs Attractive returns from the acquisition, aggregation and sale or securitization of newly originated loans Created from the securitization of correspondent production through Fannie Mae and Freddie Mac Attractive yield on investment results from interest rate / prepayment risk 2017 Barclays Global Financial Services Conference PMT’s ability to generate attractive investments through conventional correspondent production differentiates it from many other mREITs ($ in billions) PMT was the #4 producer of GSE deliverable loans in 1H 2017, up from #10 in the same period last year(1) (1) Inside Mortgage Finance
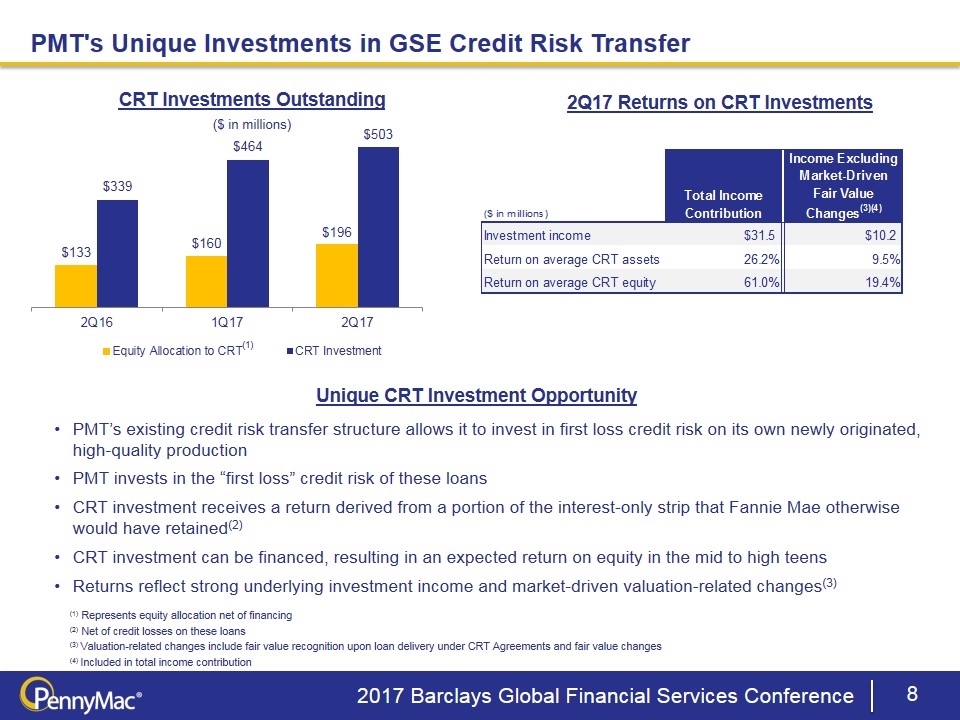
CRT Investments Outstanding ($ in millions) PMT's Unique Investments in GSE Credit Risk Transfer (1) Represents equity allocation net of financing (2) Net of credit losses on these loans (3) Valuation-related changes include fair value recognition upon loan delivery under CRT Agreements and fair value changes (4) Included in total income contribution (1) PMT’s existing credit risk transfer structure allows it to invest in first loss credit risk on its own newly originated, high-quality production PMT invests in the “first loss” credit risk of these loans CRT investment receives a return derived from a portion of the interest-only strip that Fannie Mae otherwise would have retained(2) CRT investment can be financed, resulting in an expected return on equity in the mid to high teens Returns reflect strong underlying investment income and market-driven valuation-related changes(3) 2Q17 Returns on CRT Investments Unique CRT Investment Opportunity 2017 Barclays Global Financial Services Conference CRT ($ in millions) Total Income Contribution Income Excluding Market-Driven Fair Value Changes(3)(4) Average CRT asset Investment income $31.5 $10.199999999999999 $,275,695,412 Return on average CRT assets 0.26203303113591164 9.5% Return on average CRT equity 0.61015980850095652 0.19423309987201504 ` 9393 26426 17033 0.64455460531294939
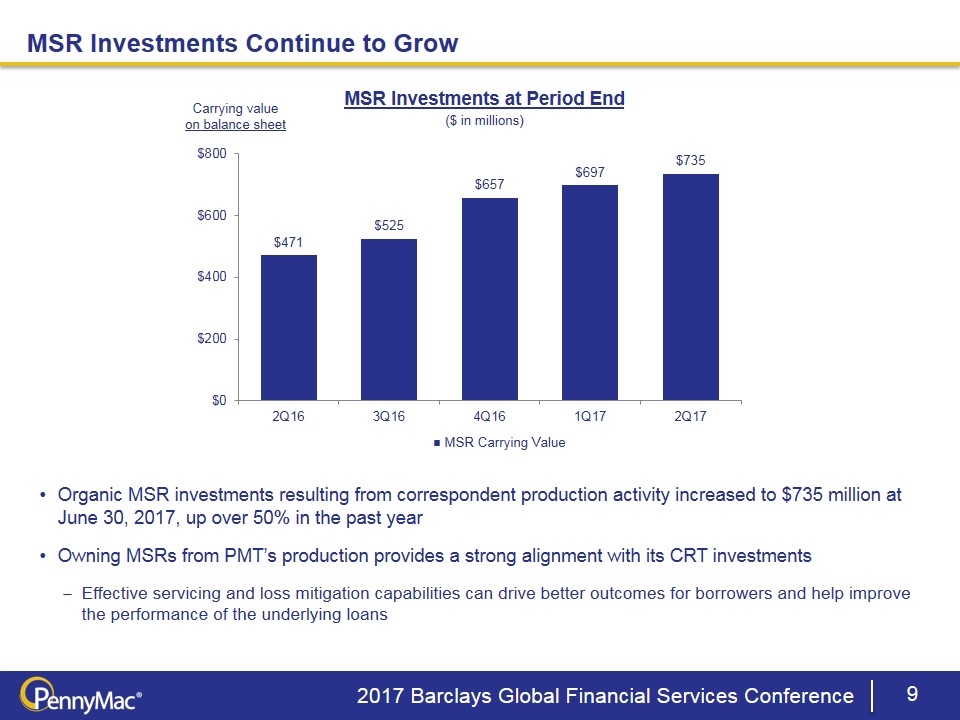
MSR Investments Continue to Grow Organic MSR investments resulting from correspondent production activity increased to $735 million at June 30, 2017, up over 50% in the past year Owning MSRs from PMT’s production provides a strong alignment with its CRT investments Effective servicing and loss mitigation capabilities can drive better outcomes for borrowers and help improve the performance of the underlying loans MSR Investments at Period End ($ in millions) Carrying value on balance sheet ■ MSR Carrying Value 9 2017 Barclays Global Financial Services Conference
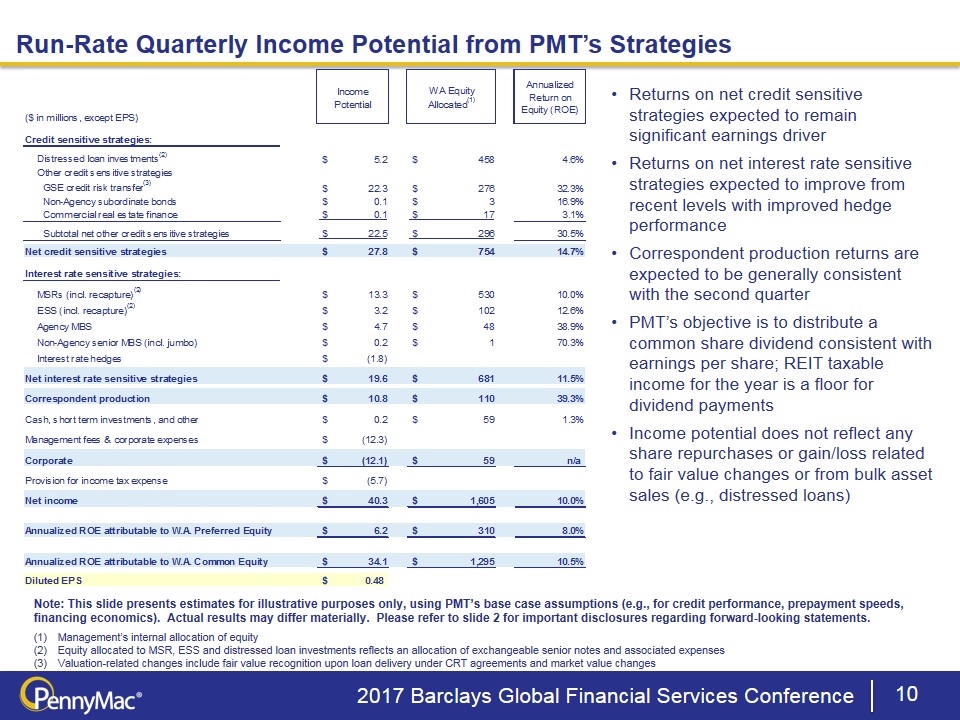
Note: This slide presents estimates for illustrative purposes only, using PMT’s base case assumptions (e.g., for credit performance, prepayment speeds, financing economics). Actual results may differ materially. Please refer to slide 2 for important disclosures regarding forward-looking statements. Management’s internal allocation of equity Equity allocated to MSR, ESS and distressed loan investments reflects an allocation of exchangeable senior notes and associated expenses Valuation-related changes include fair value recognition upon loan delivery under CRT agreements and market value changes Run-Rate Quarterly Income Potential from PMT’s Strategies Returns on net credit sensitive strategies expected to remain significant earnings driver Returns on net interest rate sensitive strategies expected to improve from recent levels with improved hedge performance Correspondent production returns are expected to be generally consistent with the second quarter PMT’s objective is to distribute a common share dividend consistent with earnings per share; REIT taxable income for the year is a floor for dividend payments Income potential does not reflect any share repurchases or gain/loss related to fair value changes or from bulk asset sales (e.g., distressed loans) 2017 Barclays Global Financial Services Conference Q3 2017 Monthly QTD 2017 QTD 2017 Quarterly Run-Rate Quarterly Income Potential (Q3-Q4 2017 Average) ($ in millions, except EPS) Income Potential WA EquityAllocated(1) Annualized Return on Equity (ROE) Credit sensitive strategies: Distressed loan investments(2) $5,233,377.7913506906 $,458,338,326.80101633 4.6% Other credit sensitive strategies GSE credit risk transfer(3) $22,292,201.309285805 $,276,377,137.86997062 0.32263452007776122 Non-Agency subordinate bonds $,110,780.99342799015 $2,617,116.118575888 0.16931766559230135 Commercial real estate finance $,131,617.3364641481 $16,909,809.24120903 3.1% Subtotal net other credit sensitive strategies $22,534,599.336360212 $,295,904,063.12303722 0.30462034347923506 Net credit sensitive strategies $27,767,977.127710901 $,754,242,389.92405355 0.14726288258874934 Interest rate sensitive strategies: MSRs (incl. recapture)(2) $13,261,783.486343138 $,529,530,914.26602077 0.10017759589900586 ESS (incl. recapture)(2) $3,206,131.2398597915 $,102,027,733.1663743 0.12569646095486509 Agency MBS $4,700,837.2011943143 $48,287,379.577292785 0.3894050364584199 Non-Agency senior MBS (incl. jumbo) $,175,749.71624790004 $,999,417.6846050818 0.70340847057293066 Interest rate hedges $-1,754,418.8803193539 Net interest rate sensitive strategies $19,590,082.763325792 $,680,845,444.54455614 0.11509268613190388 Correspondent production $10,846,522.650483508 $,110,459,663.134647 0.39277768393522228 Cash, short term investments, and other $,197,335.84218632194 $59,075,808.788209282 1.3% Management fees & corporate expenses $,-12,346,762.8575575 Corporate $,-12,149,427.15371177 $59,075,808.788209282 n/a Provision for income tax expense $-5,748,158.3700489597 Net income $40,306,997.15610002 $1,604,623,306.2581654 0.10047715747091383 Annualized ROE attributable to W.A. Preferred Equity $6,235,937.5 $,310,000,000 8.5% Annualized ROE attributable to W.A. Common Equity $34,071,059.65610002 $1,294,623,306.2581654 0.10526941540879627 Diluted EPS $0.47906456479313037 Checks To Top Of House $0 -5.2862882614135742E-2 Diluted EPS $0.47906456479313037 Quarterly Calc Date: 3/9/2017 Date: 7/4/2017 Equity Issued ,115,000,000 Equity Issued Net Equity Issued ,111,171,500 Net Equity Issued ,195,000,000 per annum 8.125% per annum ,195,000,000 Days in Effect Days in Effect 0.08 Three Month Total Days 90 Three Month Total Days Wtd Equity Q Wtd Equity Q 90 Q1 Preferred Income 2,335,937.5 Q1 Preferred Income Preferred ROE 8.1250000000000003E-2 Preferred ROE 3,900,000 0.08 Balance Sheet Metrics WA Liabilities Credit sensitive strategies: Distressed loan investments $1,365,283,181.4301 Other credit sensitive strategies GSE credit risk transfer $,228,691,278.85000002 Non-Agency subordinate bonds $28,582,474.63710323 Commercial real estate finance $2,457,438.42291125 Subtotal net other credit sensitive strategies $,259,731,191.91001451 Net credit sensitive strategies $1,625,014,373.3401146 Interest rate sensitive strategies: MSRs (incl. recapture) $,286,064,681.49000001 ESS (incl. recapture) $,150,793,104.67500001 Agency MBS $,444,527,741.42500001 Non-Agency senior MBS (incl. jumbo) $,442,932,296.7378968 MSR Hedge Net interest rate sensitive strategies $1,324,317,824.3278968 $0 Correspondent production
