Attached files
| file | filename |
|---|---|
| 8-K - FORM 8-K - CYS Investments, Inc. | d443874d8k.htm |
Investment Outlook September 2017 Barclays Global Financial Services Conference September 11, 2017 Kevin E. Grant, CFA Chief Executive Officer and President Exhibit 99.1
Forward-Looking Statements This presentation contains forward-looking statements, within the meaning of Section 27A of the Securities Act of 1933, as amended, and Section 21E of the Securities Exchange Act of 1934, as amended, that are based on management’s beliefs and assumptions, current expectations, estimates and projections. Such statements, including information relating to the Company’s expectations for distributions, availability and cost of financing, liquidity, hedging, market conditions, monetary policy, return on equity, the yield curve, U.S. and international economies, interest expense, housing, movements in interest rates, actions by the U.S. Government, the Federal Reserve (the “Fed”) and other government entities, the performance of the Company’s target assets, the impact of current Federal Reserve voters on certain policies of the Federal Reserve, the policy views of central banks and the size of the mortgage market, are not considered historical facts and are considered forward-looking information under the federal securities laws. This information may contain words such as “believes,” “plans,” “expects,” “intends,” “estimates” or similar expressions. This information is not a guarantee of the Company’s future performance and is subject to risks, uncertainties and other important factors that could cause the Company’s actual performance or achievements to differ materially from those expressed or implied by this forward-looking information and include, without limitation, changes in the market value and yield of our assets, changes in interest rates and the yield curve, net interest margin, return on equity, availability and terms of financing and hedging, market demand for Agency RMBS, the likelihood that proposed legislation is made law and the anticipated impact thereof, projections and actions by the U.S. government or any agency thereof, including the Federal Reserve and the Federal Open Market Committee (the “FOMC”), and the effects of such actions and various other risks and uncertainties related to our business and the economy, some of which are described in our filings with the SEC. Given these uncertainties, you should not rely on forward-looking information. The Company undertakes no obligations to update any forward-looking information, whether as a result of new information, future events or otherwise.
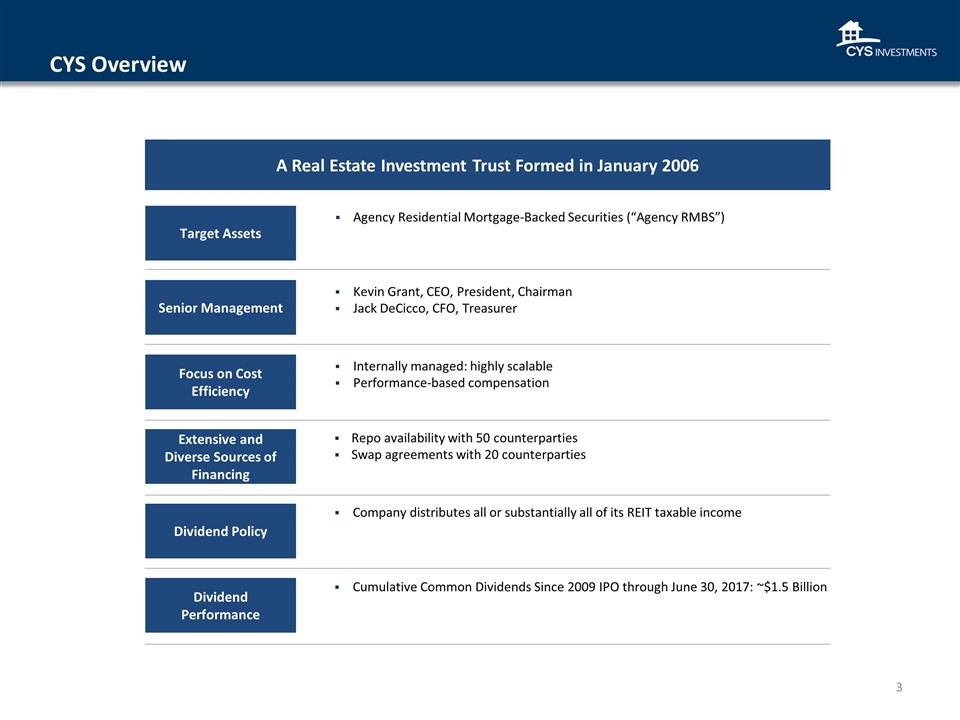
CYS Overview Target Assets Agency Residential Mortgage-Backed Securities (“Agency RMBS”) Extensive and Diverse Sources of Financing Repo availability with 50 counterparties Swap agreements with 20 counterparties Focus on Cost Efficiency Internally managed: highly scalable Performance-based compensation Senior Management Kevin Grant, CEO, President, Chairman Jack DeCicco, CFO, Treasurer Dividend Policy Company distributes all or substantially all of its REIT taxable income A Real Estate Investment Trust Formed in January 2006 Dividend Performance Cumulative Common Dividends Since 2009 IPO through June 30, 2017: ~$1.5 Billion
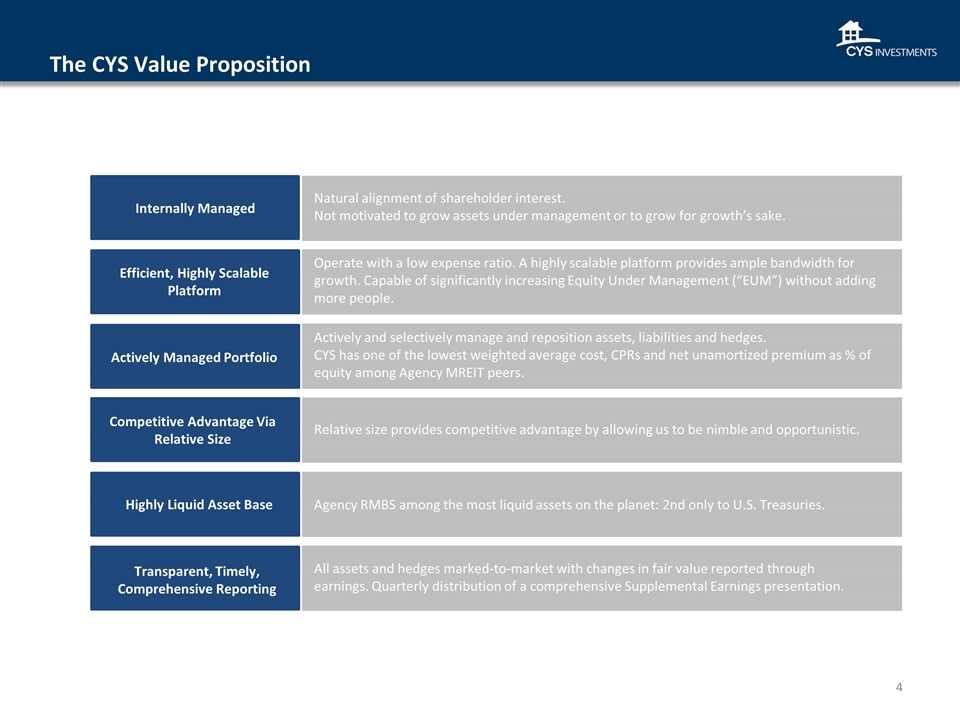
The CYS Value Proposition Internally Managed Natural alignment of shareholder interest. Not motivated to grow assets under management or to grow for growth’s sake. Efficient, Highly Scalable Platform Operate with a low expense ratio. A highly scalable platform provides ample bandwidth for growth. Capable of significantly increasing Equity Under Management (“EUM”) without adding more people. Competitive Advantage Via Relative Size Relative size provides competitive advantage by allowing us to be nimble and opportunistic. Highly Liquid Asset Base Agency RMBS among the most liquid assets on the planet: 2nd only to U.S. Treasuries. Transparent, Timely, Comprehensive Reporting All assets and hedges marked-to-market with changes in fair value reported through earnings. Quarterly distribution of a comprehensive Supplemental Earnings presentation. Actively Managed Portfolio Actively and selectively manage and reposition assets, liabilities and hedges. CYS has one of the lowest weighted average cost, CPRs and net unamortized premium as % of equity among Agency MREIT peers.
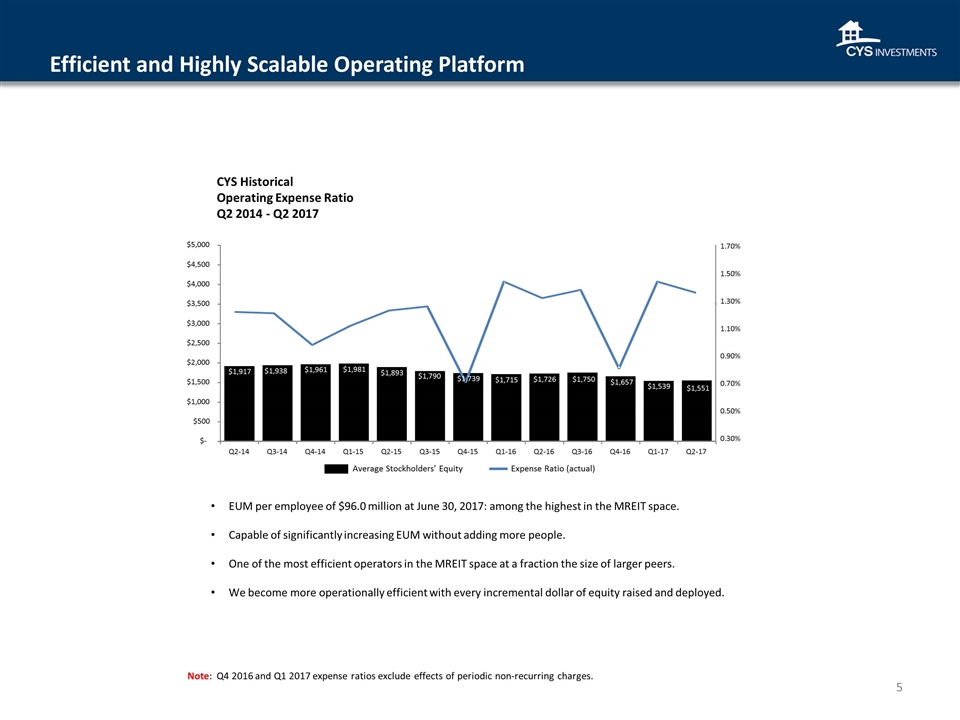
Efficient and Highly Scalable Operating Platform 5 $1,917 $1,938 $1,961 $1,981 $1,893 $1,790 $1,715 $1,726 $1,750 $1,657 $1,539 $1,551 $- $500 $1,000 $1,500 $2,000 $2,500 $3,000 $3,500 $4,000 $4,500 $5,000 Q2-14 Q3-14 Q4-14 Q1-15 Q2-15 Q3-15 Q4-15 Q1-16 Q2-16 Q3-16 Q4-16 Q1-17 Q2-17 CYS Historical Operating Expense Ratio Q2 2014 - Q2 2017 Note: Q4 2016 and Q1 2017 expense ratios exclude effects of periodic non-recurring charges. Expense Ratio (actual) Average Stockholders' Equity EUM per employee of $96.0 million at June 30, 2017: among the highest in the MREIT space. Capable of significantly increasing EUM without adding more people. One of the most efficient operators in the MREIT space at a fraction the size of larger peers. We become more operationally efficient with every incremental dollar of equity raised and deployed. $1,739 0.30% 0.50% 0.70% 0.90% 1.10% 1.30% 1.50% 1.70%
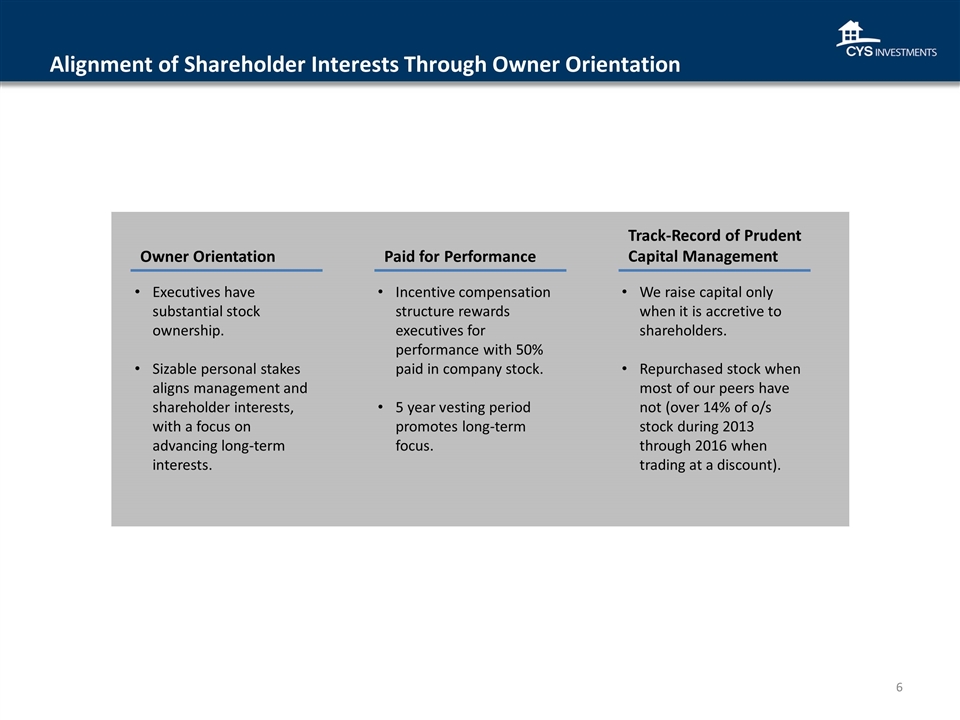
Alignment of Shareholder Interests Through Owner Orientation Owner Orientation Paid for Performance Track-Record of Prudent Capital Management Incentive compensation structure rewards executives for performance with 50% paid in company stock. 5 year vesting period promotes long-term focus. We raise capital only when it is accretive to shareholders. Repurchased stock when most of our peers have not (over 14% of o/s stock during 2013 through 2016 when trading at a discount). Executives have substantial stock ownership. Sizable personal stakes aligns management and shareholder interests, with a focus on advancing long-term interests.
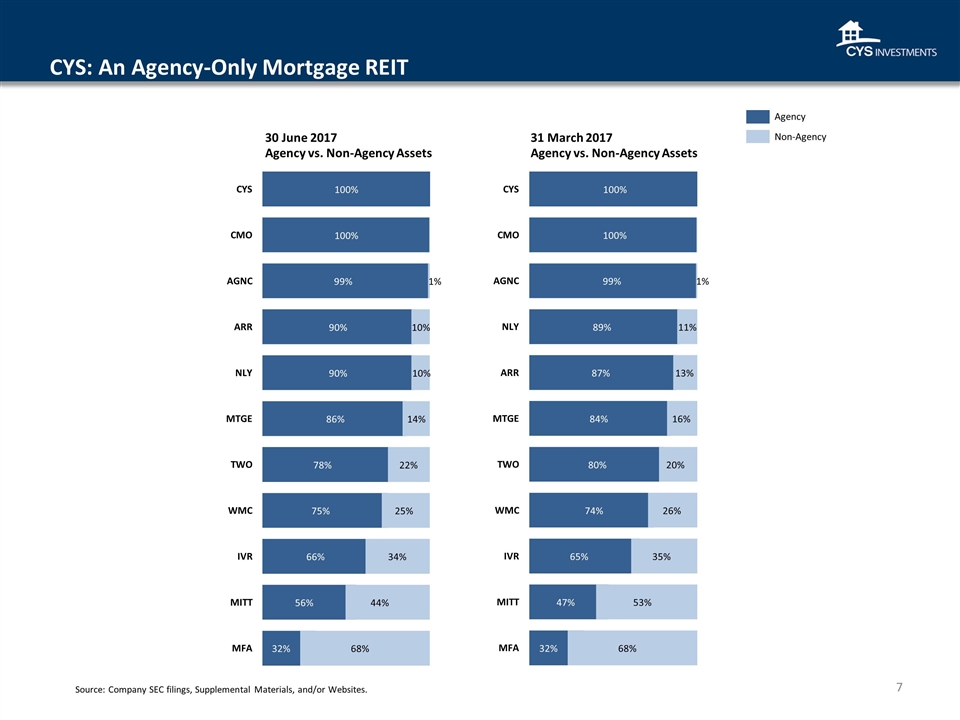
CYS: An Agency-Only Mortgage REIT Agency vs. Non-Agency Assets Agency vs. Non-Agency Assets 32% 56% 66% 75% 78% 86% 90% 90% 99% 100% 100% 68% 44% 34% 25% 22% 14% 10% 10% 1% MFA MITT IVR WMC TWO MTGE NLY ARR AGNC CMO CYS 32% 47% 65% 74% 80% 84% 87% 89% 99% 100% 100% 68% 53% 35% 26% 20% 16% 13% 11% 1% MFA MITT IVR WMC TWO MTGE ARR NLY AGNC CMO CYS Source: Company SEC filings, Supplemental Materials, and/or Websites. Agency 30 June 2017 31 March 2017 Non-Agency
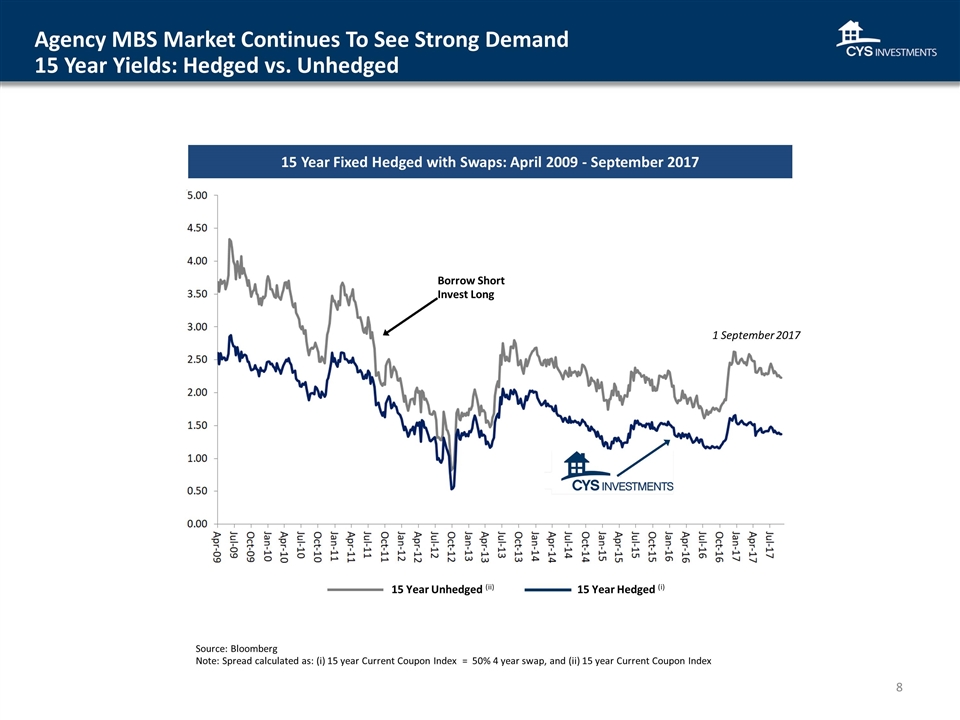
Agency MBS Market Continues To See Strong Demand 15 Year Yields: Hedged vs. Unhedged 15 Year Fixed Hedged with Swaps: April 2009 - September 2017 15 Year Hedged (i) Borrow Short Invest Long Source: Bloomberg Note: Spread calculated as: (i) 15 year Current Coupon Index = 50% 4 year swap, and (ii) 15 year Current Coupon Index 1 September 2017 15 Year Unhedged (ii) 8
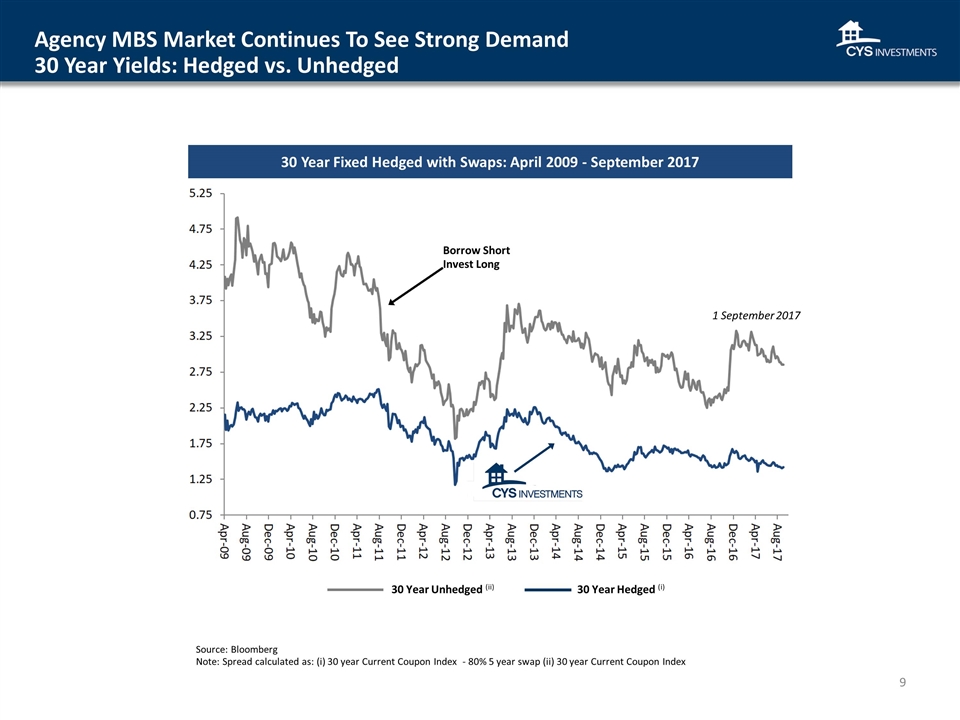
Agency MBS Market Continues To See Strong Demand 30 Year Yields: Hedged vs. Unhedged 30 Year Fixed Hedged with Swaps: April 2009 - September 2017 30 Year Hedged (i) Borrow Short Invest Long 1 September 2017 30 Year Unhedged (ii) Source: Bloomberg Note: Spread calculated as: (i) 30 year Current Coupon Index - 80% 5 year swap (ii) 30 year Current Coupon Index
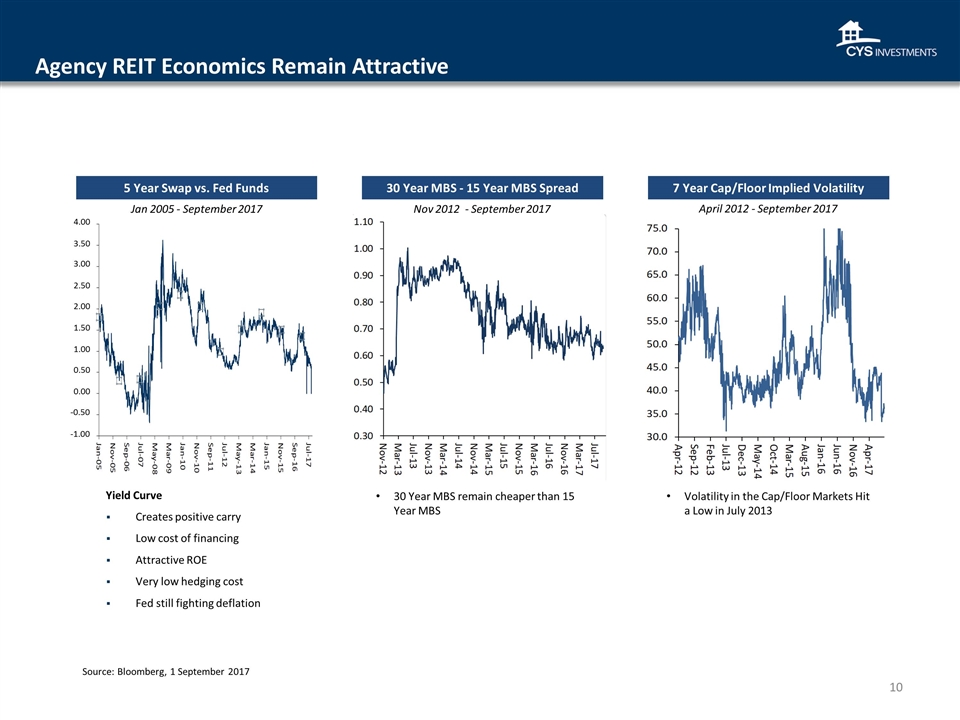
Volatility in the Cap/Floor Markets Hit a Low in July 2013 April 2012 - September 2017 30 Year MBS remain cheaper than 15 Year MBS 5 Year Swap vs. Fed Funds Jan 2005 - September 2017 Yield Curve Creates positive carry Low cost of financing Attractive ROE Very low hedging cost Fed still fighting deflation Agency REIT Economics Remain Attractive Nov 2012 - September 2017 Source: Bloomberg, 1 September 2017 7 Year Cap/Floor Implied Volatility 30 Year MBS - 15 Year MBS Spread -1.00 -0.50 0.00 0.50 1.00 1.50 2.00 2.50 3.00 3.50 4.00
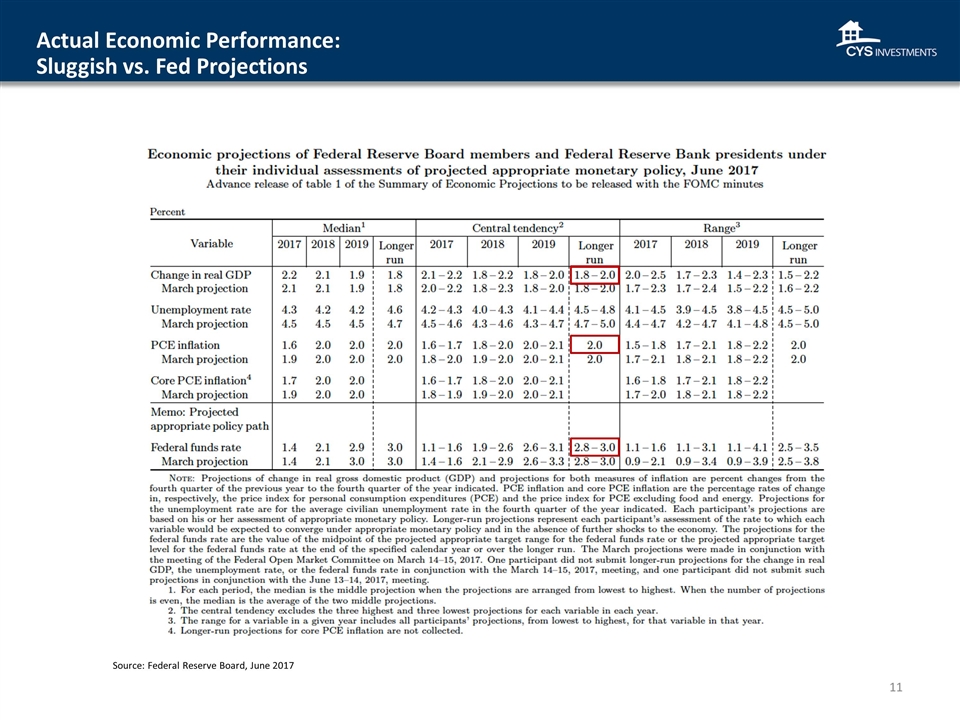
Source: Federal Reserve Board, June 2017 Actual Economic Performance: Sluggish vs. Fed Projections
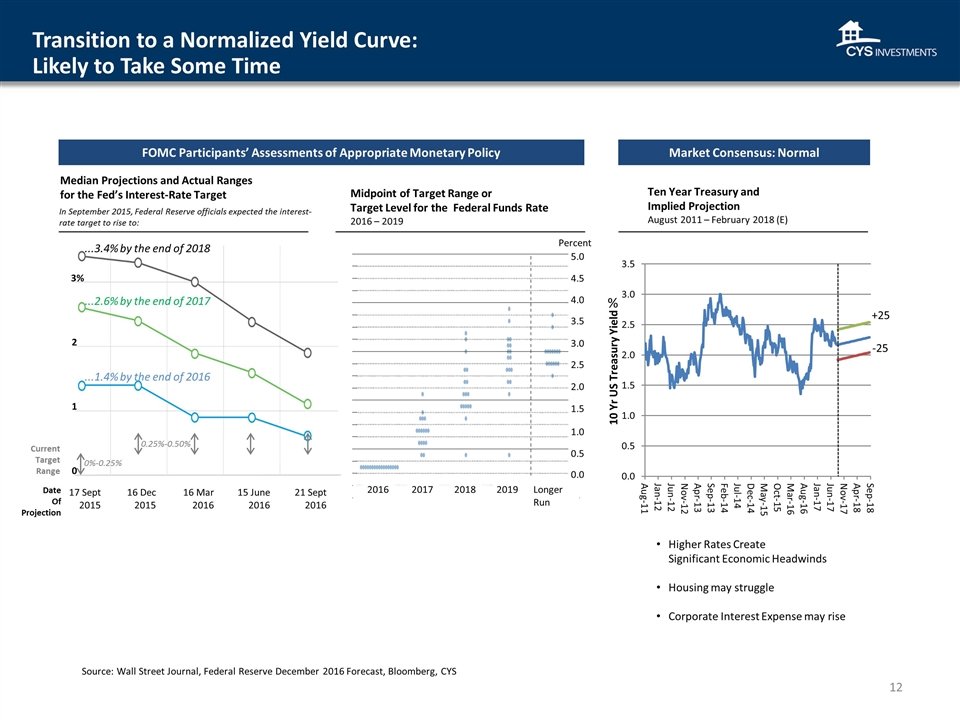
Midpoint of Target Range or Target Level for the Federal Funds Rate 2016 – 2019 Market Consensus: Normal Transition to a Normalized Yield Curve: Likely to Take Some Time Ten Year Treasury and Implied Projection August 2011 – February 2018 (E) % 10 Yr US Treasury Yield +25 -25 Median Projections and Actual Ranges for the Fed’s Interest-Rate Target 17 Sept 2015 16 Mar 2016 15 June 2016 21 Sept 2016 16 Dec 2015 0 2 3% 1 ...3.4% by the end of 2018 ...2.6% by the end of 2017 ...1.4% by the end of 2016 0%-0.25% 0.25%-0.50% Date Of Projection Current Target Range Percent 2016 2018 2017 0.0 2.0 2.5 3.0 3.5 4.0 4.5 5.0 0.5 1.0 1.5 2019 Longer Run Higher Rates Create Significant Economic Headwinds Housing may struggle Corporate Interest Expense may rise FOMC Participants’ Assessments of Appropriate Monetary Policy Source: Wall Street Journal, Federal Reserve December 2016 Forecast, Bloomberg, CYS In September 2015, Federal Reserve officials expected the interest-rate target to rise to:
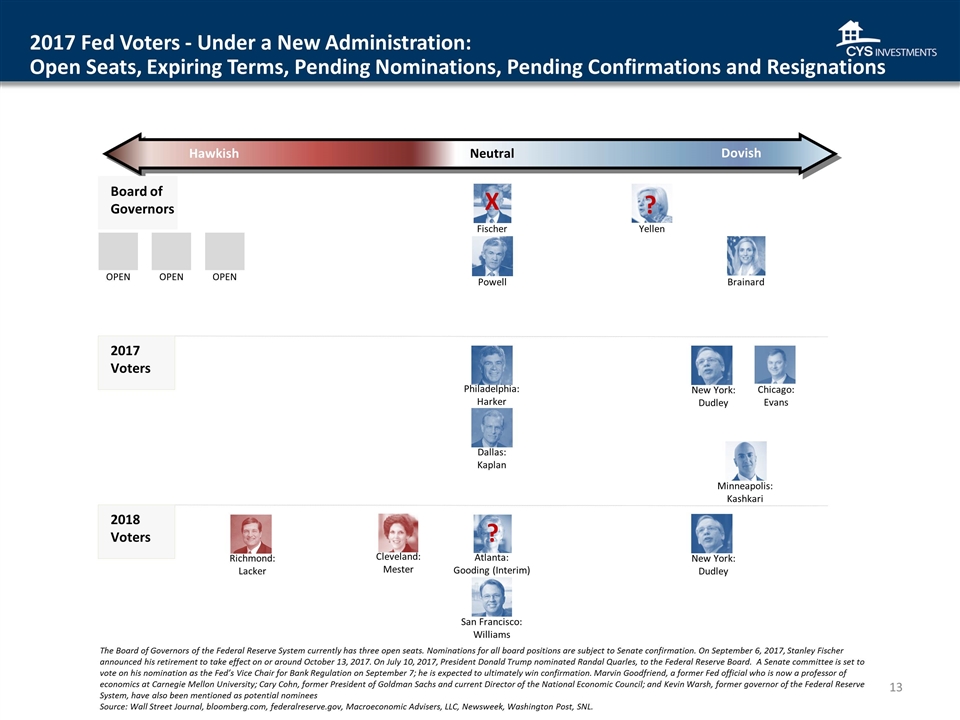
Powell The Board of Governors of the Federal Reserve System currently has three open seats. Nominations for all board positions are subject to Senate confirmation. On September 6, 2017, Stanley Fischer announced his retirement to take effect on or around October 13, 2017. On July 10, 2017, President Donald Trump nominated Randal Quarles, to the Federal Reserve Board. A Senate committee is set to vote on his nomination as the Fed’s Vice Chair for Bank Regulation on September 7; he is expected to ultimately win confirmation. Marvin Goodfriend, a former Fed official who is now a professor of economics at Carnegie Mellon University; Cary Cohn, former President of Goldman Sachs and current Director of the National Economic Council; and Kevin Warsh, former governor of the Federal Reserve System, have also been mentioned as potential nominees Source: Wall Street Journal, bloomberg.com, federalreserve.gov, Macroeconomic Advisers, LLC, Newsweek, Washington Post, SNL. Hawkish Dovish Neutral Board of Governors Brainard 2017 Voters 2018 Voters New York: Dudley Chicago: Evans Philadelphia: Harker Dallas: Kaplan Minneapolis: Kashkari New York: Dudley Cleveland: Mester Richmond: Lacker Atlanta: Gooding (Interim) San Francisco: Williams 2017 Fed Voters - Under a New Administration: Open Seats, Expiring Terms, Pending Nominations, Pending Confirmations and Resignations Fischer Yellen ? OPEN OPEN X ? OPEN
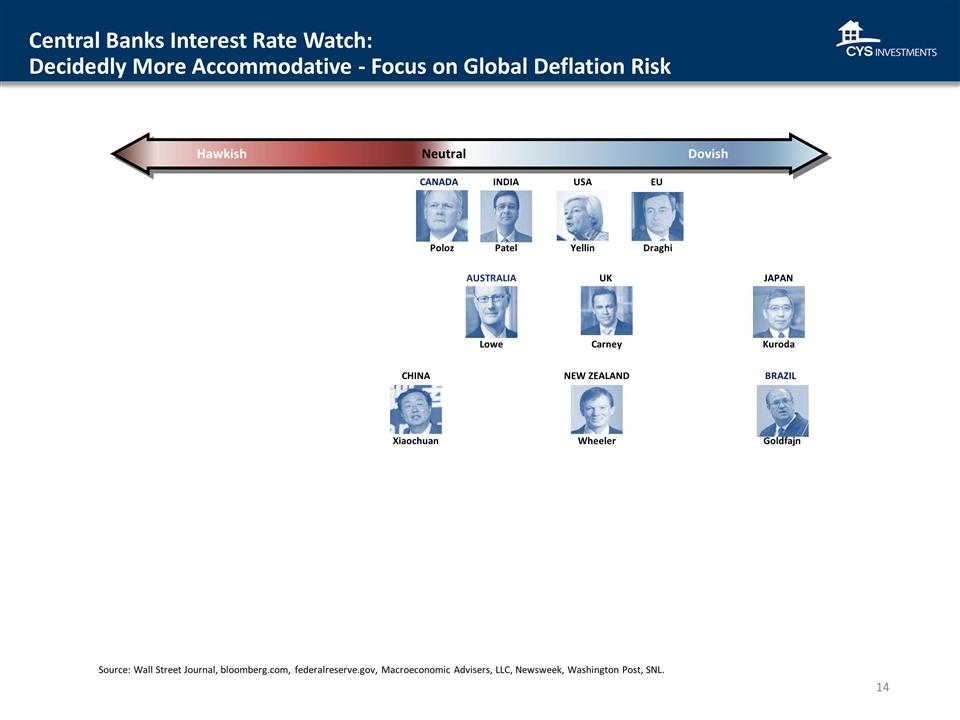
Central Banks Interest Rate Watch: Decidedly More Accommodative - Focus on Global Deflation Risk Draghi EU NEW ZEALAND Wheeler Yellin USA Patel INDIA Goldfajn BRAZIL CANADA Poloz Kuroda JAPAN Carney UK AUSTRALIA Lowe Xiaochuan CHINA Source: Wall Street Journal, bloomberg.com, federalreserve.gov, Macroeconomic Advisers, LLC, Newsweek, Washington Post, SNL. Hawkish Dovish Neutral
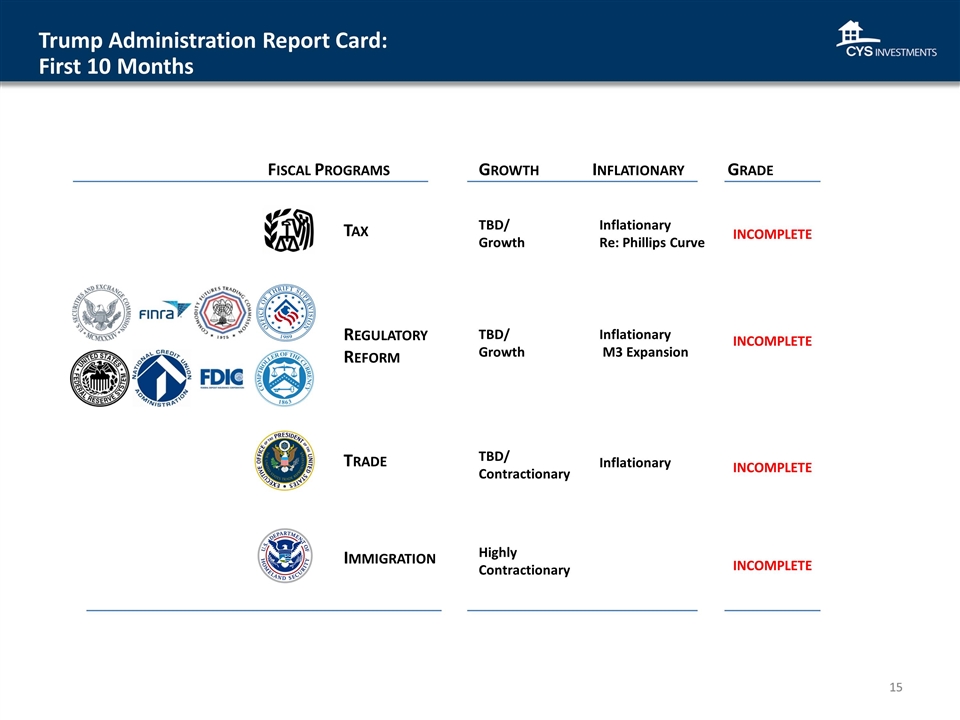
Trump Administration Report Card: First 10 Months Growth Inflationary TBD/ Growth Trade Immigration Tax Regulatory Reform TBD/ Growth TBD/ Contractionary Highly Contractionary Inflationary Re: Phillips Curve Inflationary M3 Expansion Inflationary Fiscal Programs Grade INCOMPLETE INCOMPLETE INCOMPLETE INCOMPLETE
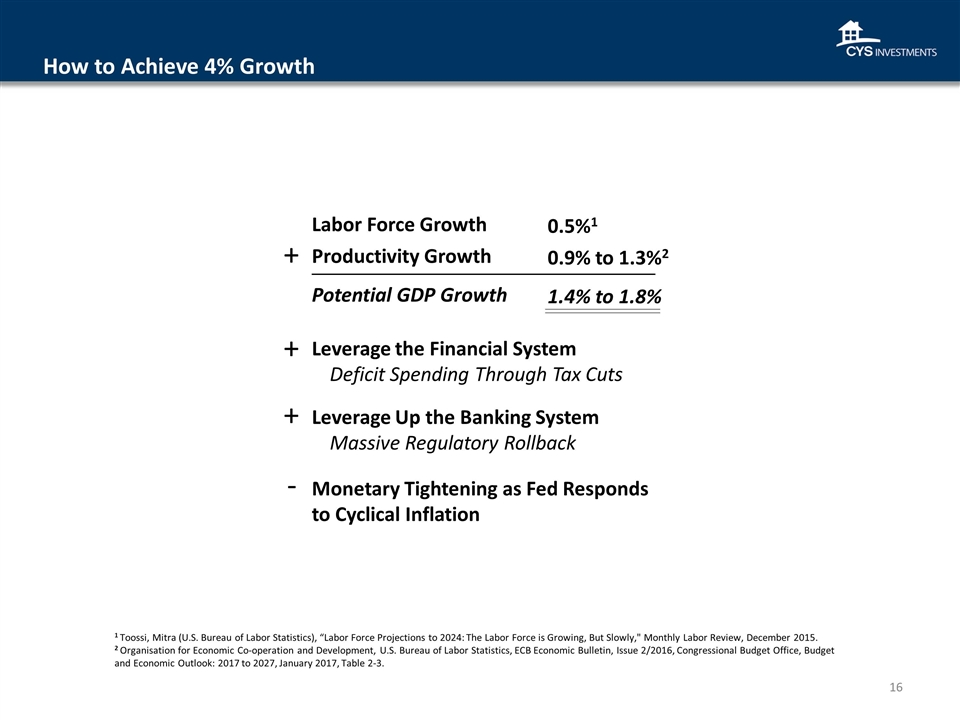
How to Achieve 4% Growth Labor Force Growth 0.5%1 Productivity Growth Potential GDP Growth 0.9% to 1.3%2 1.4% to 1.8% + Leverage the Financial System Deficit Spending Through Tax Cuts + Leverage Up the Banking System Massive Regulatory Rollback + Monetary Tightening as Fed Responds to Cyclical Inflation - 1 Toossi, Mitra (U.S. Bureau of Labor Statistics), “Labor Force Projections to 2024: The Labor Force is Growing, But Slowly," Monthly Labor Review, December 2015. 2 Organisation for Economic Co-operation and Development, U.S. Bureau of Labor Statistics, ECB Economic Bulletin, Issue 2/2016, Congressional Budget Office, Budget and Economic Outlook: 2017 to 2027, January 2017, Table 2-3.
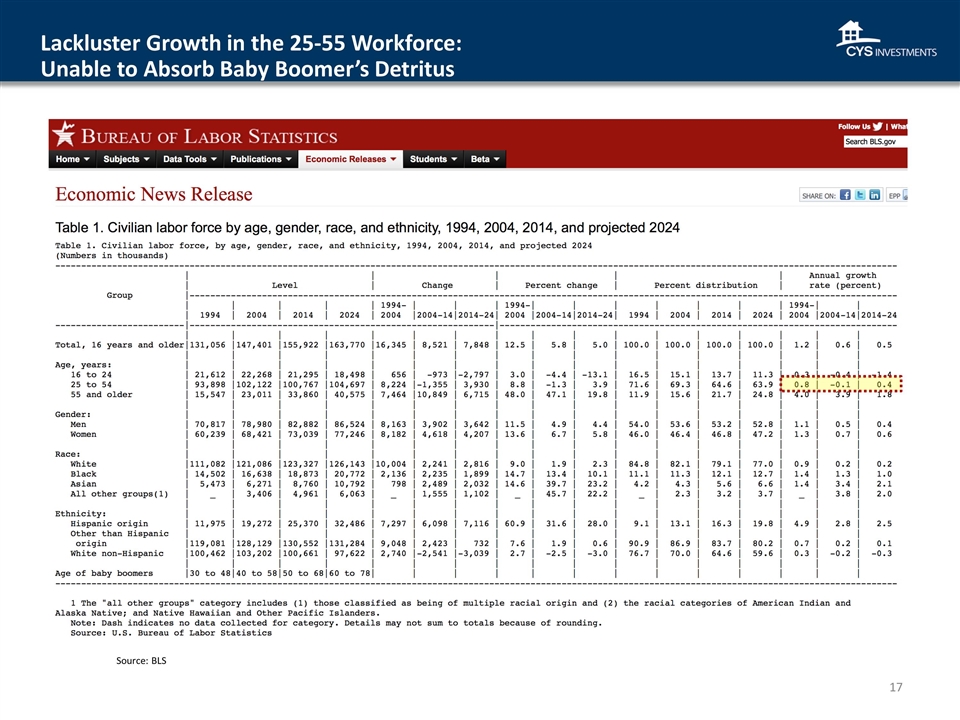
Source: BLS Lackluster Growth in the 25-55 Workforce: Unable to Absorb Baby Boomer’s Detritus
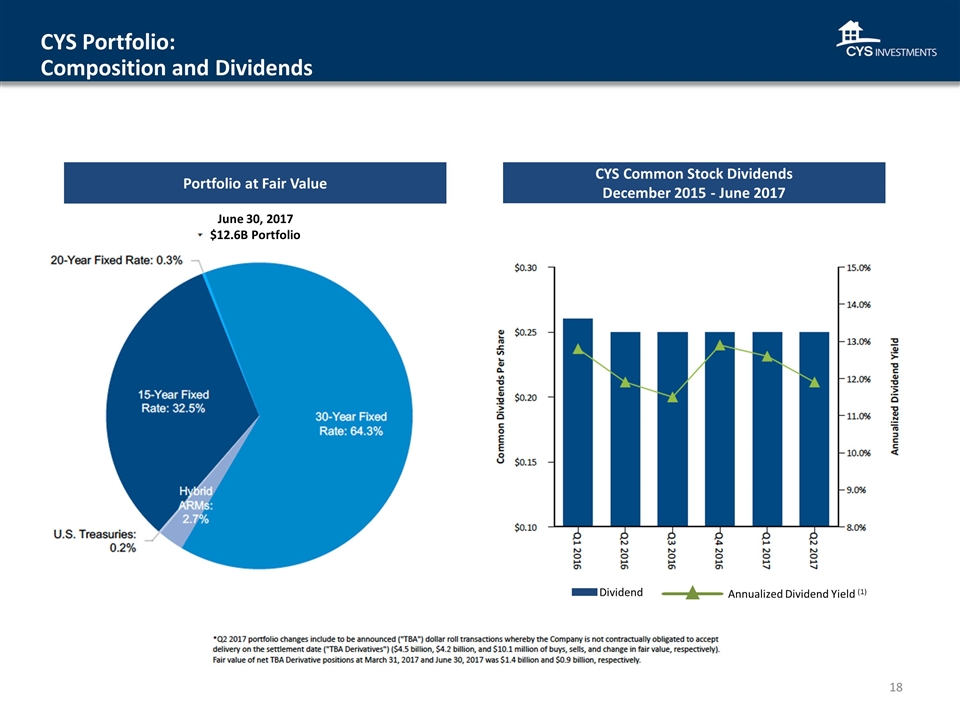
CYS Common Stock Dividends December 2015 - June 2017 Portfolio at Fair Value CYS Portfolio: Composition and Dividends Dividend Annualized Dividend Yield (1) June 30, 2017 $12.6B Portfolio
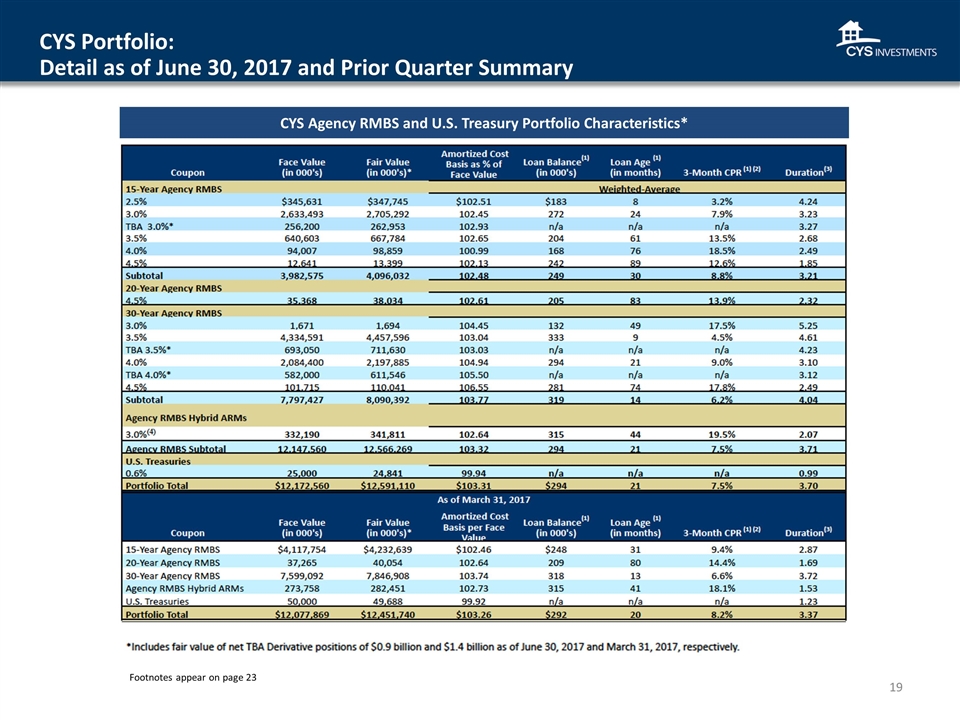
CYS Portfolio: Detail as of June 30, 2017 and Prior Quarter Summary CYS Agency RMBS and U.S. Treasury Portfolio Characteristics* * Footnotes appear on page 23
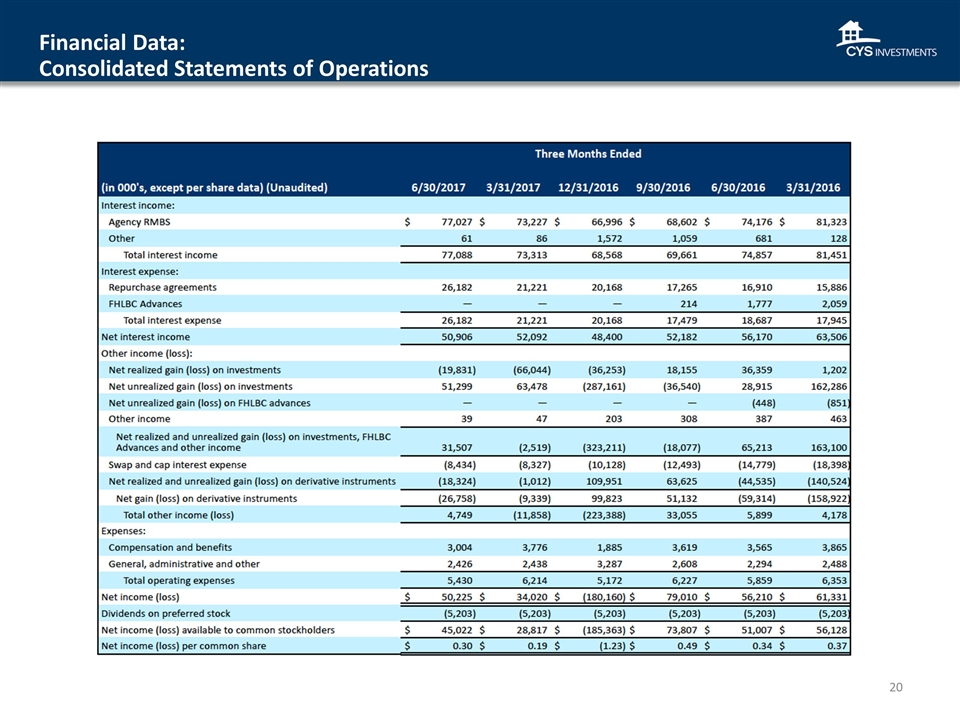
Financial Data: Consolidated Statements of Operations
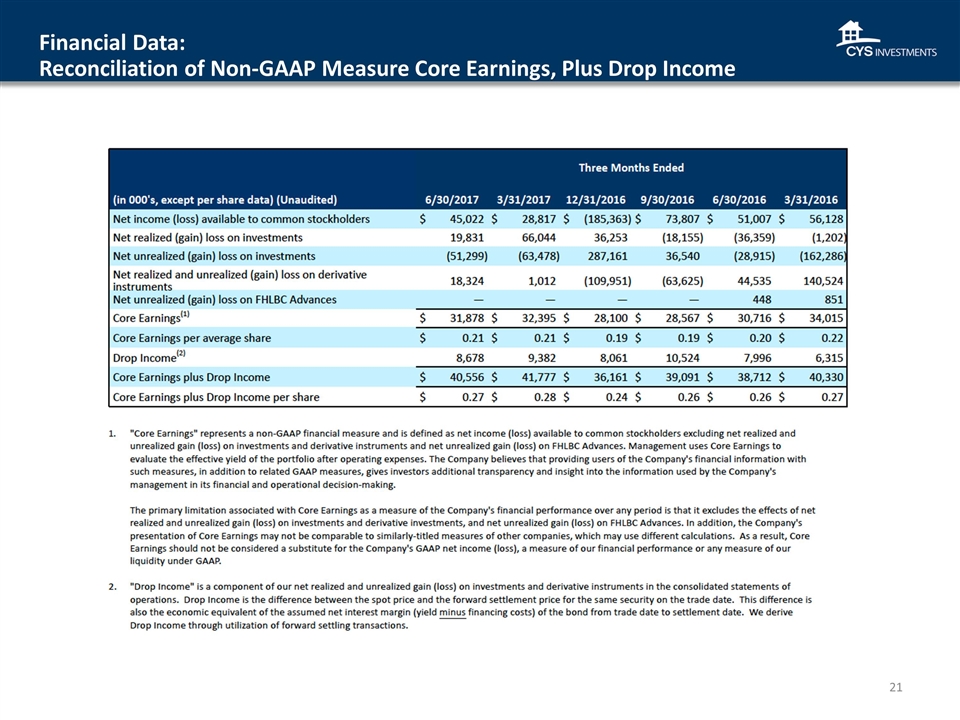
Financial Data: Reconciliation of Non-GAAP Measure Core Earnings, Plus Drop Income
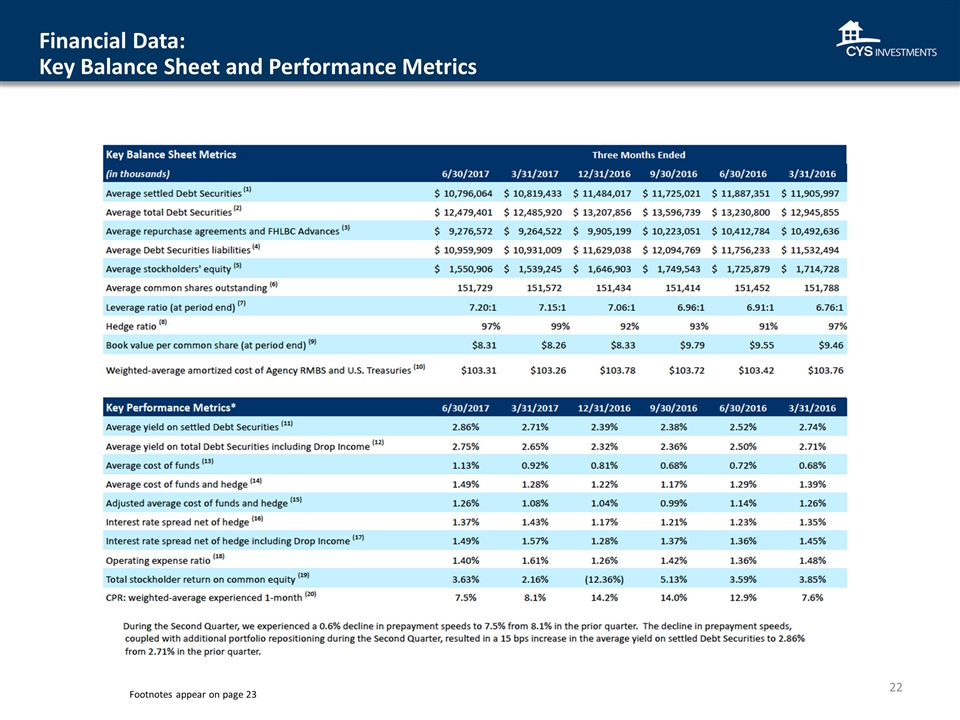
Financial Data: Key Balance Sheet and Performance Metrics Footnotes appear on page 23
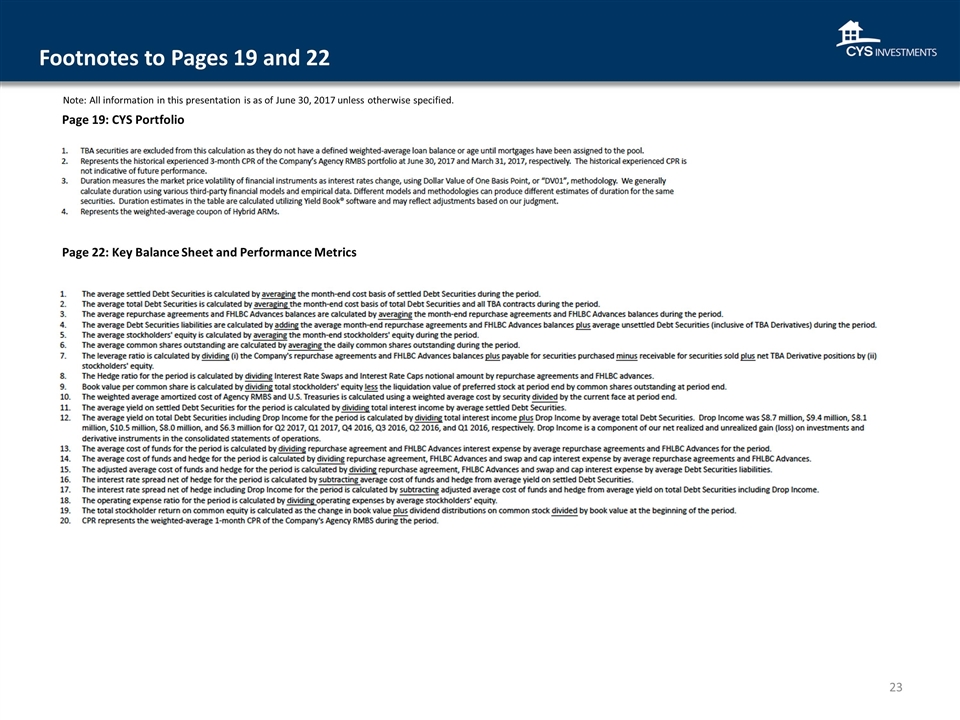
Footnotes to Pages 19 and 22 Page 22: Key Balance Sheet and Performance Metrics Page 19: CYS Portfolio Note: All information in this presentation is as of June 30, 2017 unless otherwise specified.
Investment Outlook September 2017 Barclays Global Financial Services Conference September 11, 2017 Kevin E. Grant, CFA Chief Executive Officer and President
