Attached files
| file | filename |
|---|---|
| 8-K - 8-K - 99 CENTS ONLY STORES LLC | a17-21447_28k.htm |
|
|
Forward Looking Statements This presentation contains forward looking statements under the Private Securities Litigation Reform Act of 1995. The words expect, estimate, anticipate, plan, predict, believe, intend, and similar expressions and variations thereof are intended to identify forward looking statements. Such statements include comments regarding the intent, belief, or current expectations of the Company with respect to, among other things, trends affecting the financial condition or results of operations of the Company; the business and growth strategies of the Company, including new store openings; the results of the Company’s operational and other initiatives, including pursuant to the Company’s profit improvement plans; the results of operations for future periods and potential uses of capital. These statements do not guarantee future performance and therefore, undue reliance should not be placed upon them. For a more detailed discussion of the factors that can cause actual results to differ materially from those projected in any forward-looking statements, the Company refers you to 99 Cents Only Stores’ most recent 10-Q and 10-K filed with the SEC or posted on the Company’s website. Please note that this presentation will refer to certain financial information of the Company that can be found at the end of the earnings release issued earlier today, September 7, 2017, and is presented on a non-GAAP basis. The Company cautions that these non-GAAP financial measures should be viewed in addition and not as an alternative to the Company’s complete consolidated financial statements and financial notes prepared in accordance with GAAP. Definitions and reconciliation of these non-GAAP measures to their most directly comparable GAAP measure are included in the earnings release. |
|
|
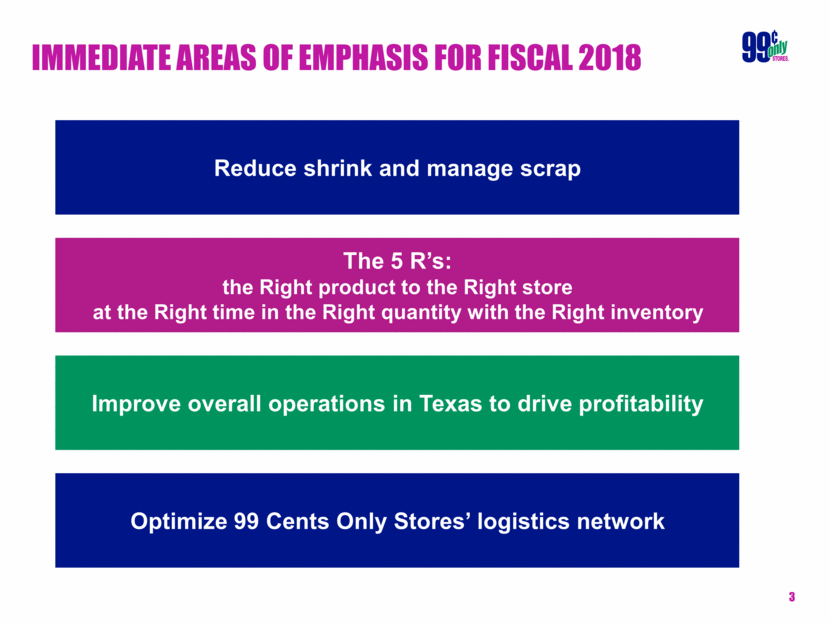
Immediate areas of emphasis for fiscal 2018 Reduce shrink and manage scrap Optimize 99 Cents Only Stores’ logistics network The 5 R’s: the Right product to the Right store at the Right time in the Right quantity with the Right inventory Improve overall operations in Texas to drive profitability |
|
|
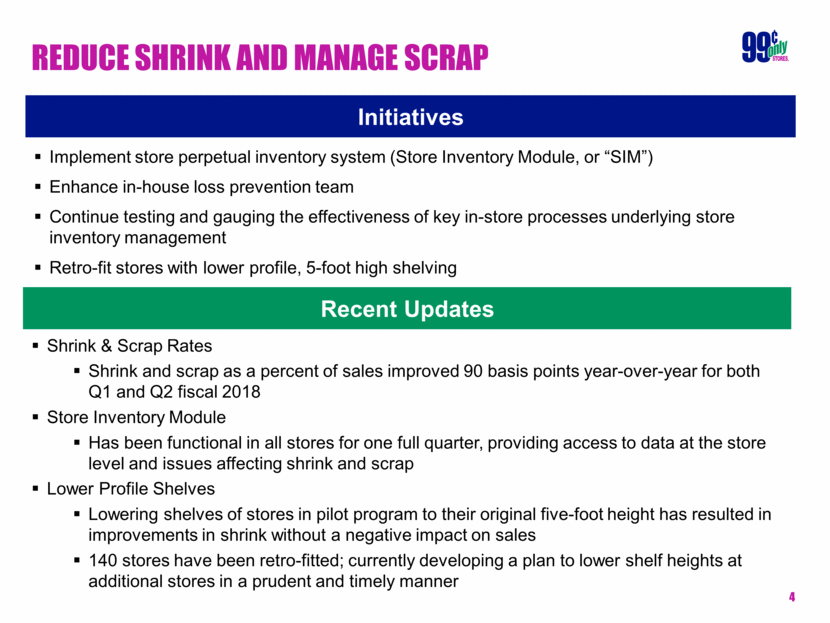
Reduce shrink and manage scrap Initiatives Implement store perpetual inventory system (Store Inventory Module, or “SIM”) Enhance in-house loss prevention team Continue testing and gauging the effectiveness of key in-store processes underlying store inventory management Retro-fit stores with lower profile, 5-foot high shelving Recent Updates Shrink & Scrap Rates Shrink and scrap as a percent of sales improved 90 basis points year-over-year for both Q1 and Q2 fiscal 2018 Store Inventory Module Has been functional in all stores for one full quarter, providing access to data at the store level and issues affecting shrink and scrap Lower Profile Shelves Lowering shelves of stores in pilot program to their original five-foot height has resulted in improvements in shrink without a negative impact on sales 140 stores have been retro-fitted; currently developing a plan to lower shelf heights at additional stores in a prudent and timely manner |
|
|
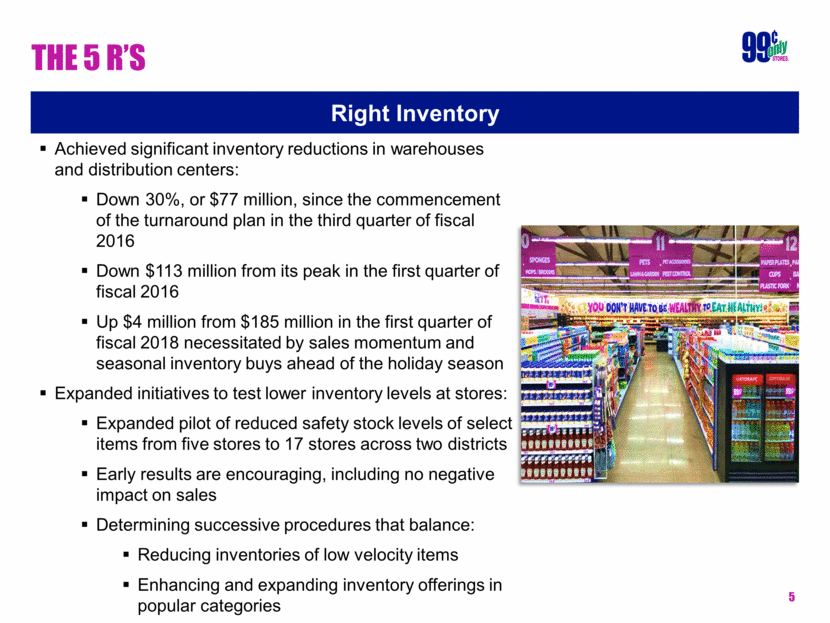
The 5 r’s Achieved significant inventory reductions in warehouses and distribution centers: Down 30%, or $77 million, since the commencement of the turnaround plan in the third quarter of fiscal 2016 Down $113 million from its peak in the first quarter of fiscal 2016 Up $4 million from $185 million in the first quarter of fiscal 2018 necessitated by sales momentum and seasonal inventory buys ahead of the holiday season Expanded initiatives to test lower inventory levels at stores: Expanded pilot of reduced safety stock levels of select items from five stores to 17 stores across two districts Early results are encouraging, including no negative impact on sales Determining successive procedures that balance: Reducing inventories of low velocity items Enhancing and expanding inventory offerings in popular categories Right Inventory |
|
|
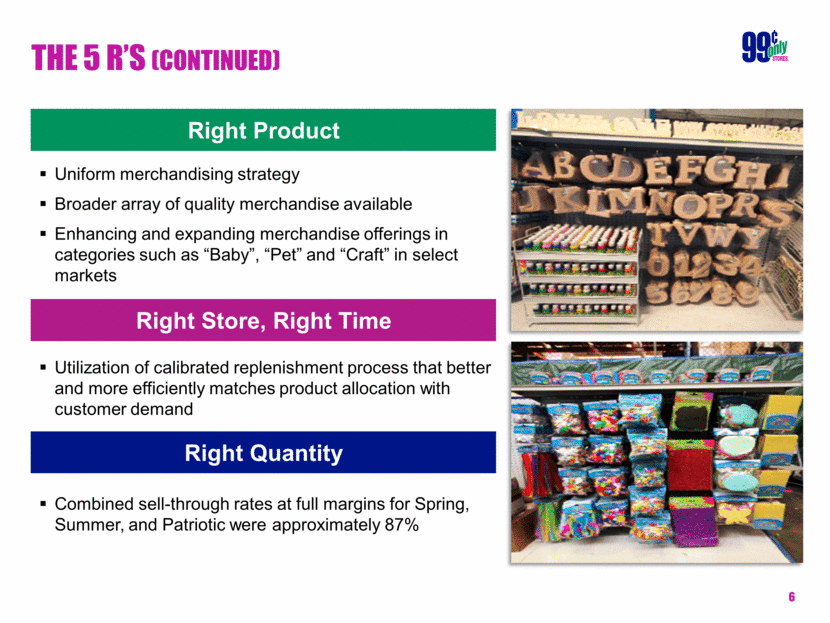
The 5 r’s (continued) Right Product Uniform merchandising strategy Broader array of quality merchandise available Enhancing and expanding merchandise offerings in categories such as “Baby”, “Pet” and “Craft” in select markets Right Store, Right Time Utilization of calibrated replenishment process that better and more efficiently matches product allocation with customer demand Right Quantity Combined sell-through rates at full margins for Spring, Summer, and Patriotic were approximately 87% |
|
|
Improve overall operations in Texas Initiatives Began efforts in Texas market in late fiscal 2017 Key initiatives: Enhance the customer experience through physical clean-ups that reduce clutter and expand shopping space Improve merchandise assortment through: A Texas based buying team, focused on region-specific merchandise; and Improvements to allocation and replenishment processes, specifically for fresh and perishable items Optimize Texas logistics through: Inbounding import merchandise through the Port of Houston; and Directly shipping merchandise from suppliers to the Katy, TX distribution center Recent Results Increased traffic and larger basket drove a 15.4% same store sales comp for Q2 fiscal 2018 Refined in-stock levels of merchandise are better aligned with local preferences |
|
|
Optimize chain-wide logistics network Optimized transportation and distribution capabilities with third-party transportation provider Expanded store delivery schedule to seven days per week During the first quarter of fiscal 2018, commenced a sizable investment in the Garfield distribution center, which primarily handles general merchandise and re-orderable items Recent Results Transportation and distribution: Better timeliness for store deliveries Expanded store delivery schedule has improved the flow of merchandise and efficiencies in the supply chain Believe seven day delivery schedule will also benefit Sunday & Monday store in-stocks, traffic, and sales Garfield distribution center: Installation of four-level high racking completed last week, in time for the high-volume holiday season Expect new racking to provide 2.5x the current capacity of the facility while improving operational efficiencies Initiatives |
|
|
‘Maintain progress mode’ initiatives Improving the Customer Experience Update Expanded refresh initiative from San Diego and Phoenix to Las Vegas earlier this year The 18 Las Vegas stores are undergoing physical clean-ups, installation of additional refrigeration equipment, and improvements to the allocation & replenishment processes Working to update product mix in stores to drive higher-margin general merchandise sales, including the introduction of SKUs in the “Baby”, “Craft”, and “Pet” categories Expect to complete the refresh by mid-October Culture of Safety Update Through the first half of fiscal 2018, workers’ compensation claims were down 17% year-over-year, on top of the 20% reduction achieved during fiscal 2017 |
|
|
Q2 fiscal 2018 Financial Review |
|
|
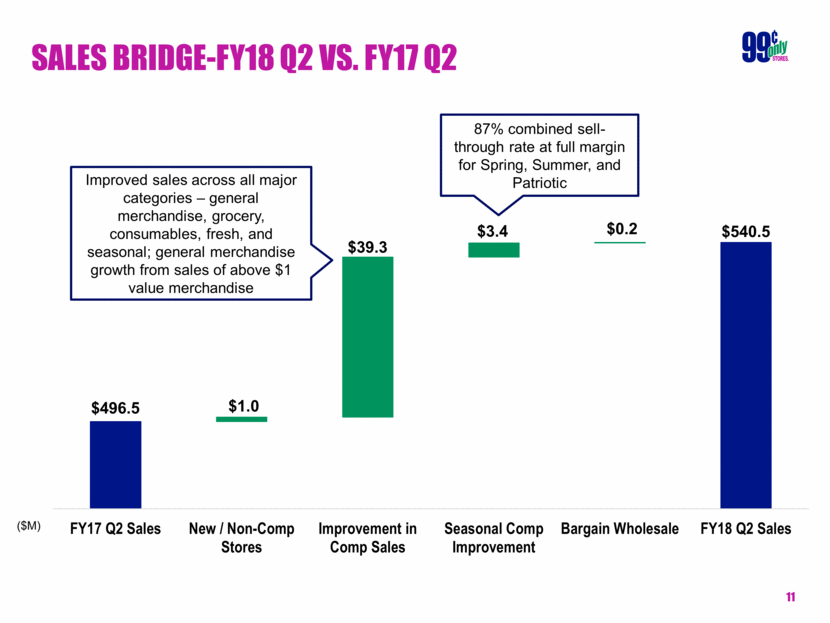
Sales bridge-FY18 Q2 vs. FY17 Q2 Improved sales across all major categories – general merchandise, grocery, consumables, fresh, and seasonal; general merchandise growth from sales of above $1 value merchandise ($M) 87% combined sell-through rate at full margin for Spring, Summer, and Patriotic $496.5 $540.5 $1.0 $39.3 $3.4 $0.2 FY17 Q2 Sales New / Non-Comp Stores Improvement in Comp Sales Seasonal Comp Improvement Bargain Wholesale FY18 Q2 Sales |
|
|
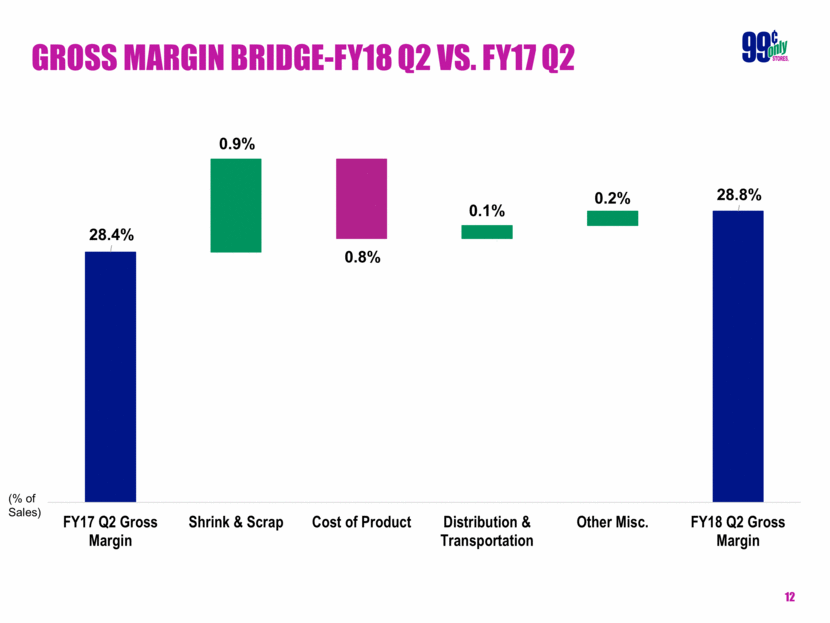
Gross Margin Bridge-FY18 Q2 vs. FY17 Q2 (% of Sales) 28.4% 28.8% 0.9% 0.8% 0.1% 0.2% FY17 Q2 Gross Margin Shrink & Scrap Cost of Product Distribution & Transportation Other Misc. FY18 Q2 Gross Margin |
|
|
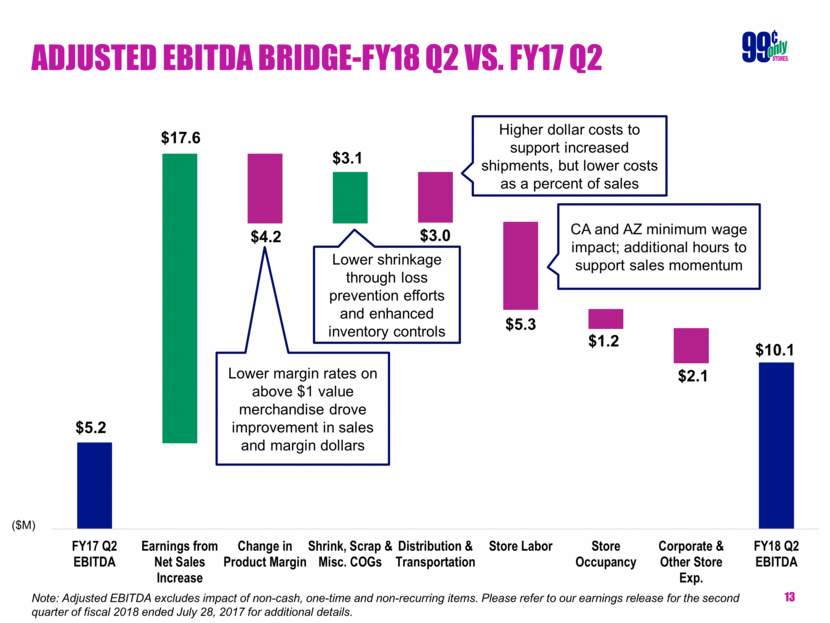
Adjusted EBITDA Bridge-FY18 Q2 vs. FY17 Q2 Note: Adjusted EBITDA excludes impact of non-cash, one-time and non-recurring items. Please refer to our earnings release for the second quarter of fiscal 2018 ended July 28, 2017 for additional details. Lower shrinkage through loss prevention efforts and enhanced inventory controls CA and AZ minimum wage impact; additional hours to support sales momentum ($M) Lower margin rates on above $1 value merchandise drove improvement in sales and margin dollars Higher dollar costs to support increased shipments, but lower costs as a percent of sales $5.2 $10.1 $17.6 $4.2 $3.1 $3.0 $5.3 $1.2 $2.1 FY17 Q2 EBITDA Earnings from Net Sales Increase Change in Product Margin Shrink, Scrap & Misc. COGs Distribution & Transportation Store Labor Store Occupancy Corporate & Other Store Exp. FY18 Q2 EBITDA |
|
|
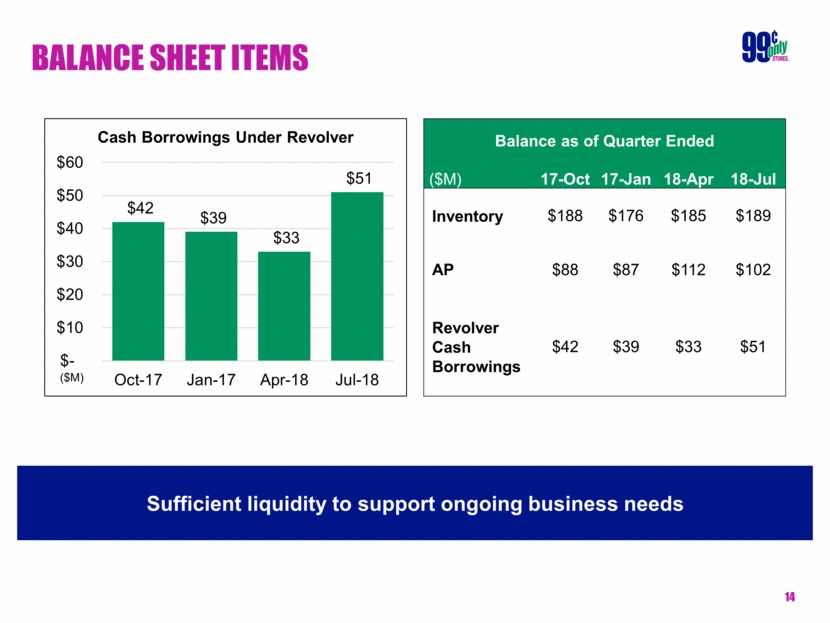
BALANCE SHEET ITEMS ($M) Balance as of Quarter Ended ($M) 17-Oct 17-Jan 18-Apr 18-Jul Inventory $188 $176 $185 $189 AP $88 $87 $112 $102 Revolver Cash Borrowings $42 $39 $33 $51 Sufficient liquidity to support ongoing business needs $42 $39 $33 $51 $- $10 $20 $30 $40 $50 $60 Oct-17 Jan-17 Apr-18 Jul-18 Cash Borrowings Under Revolver |
|
|
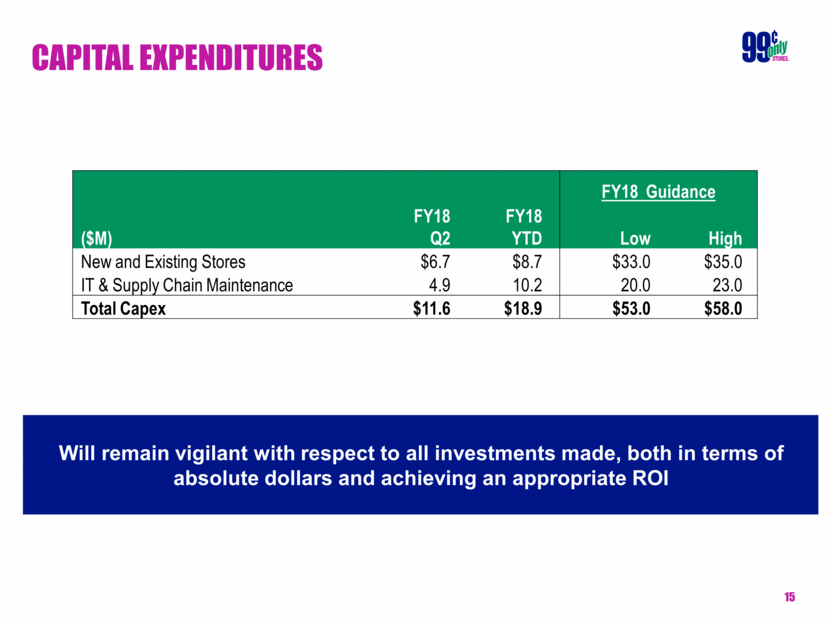
CAPITAL EXPENDITURES Will remain vigilant with respect to all investments made, both in terms of absolute dollars and achieving an appropriate ROI FY18 Guidance ($M) FY18 Q2 FY18 YTD Low High New and Existing Stores $6.7 $8.7 $33.0 $35.0 IT & Supply Chain Maintenance 4.9 10.2 20.0 23.0 Total Capex $11.6 $18.9 $53.0 $58.0 |
|
|
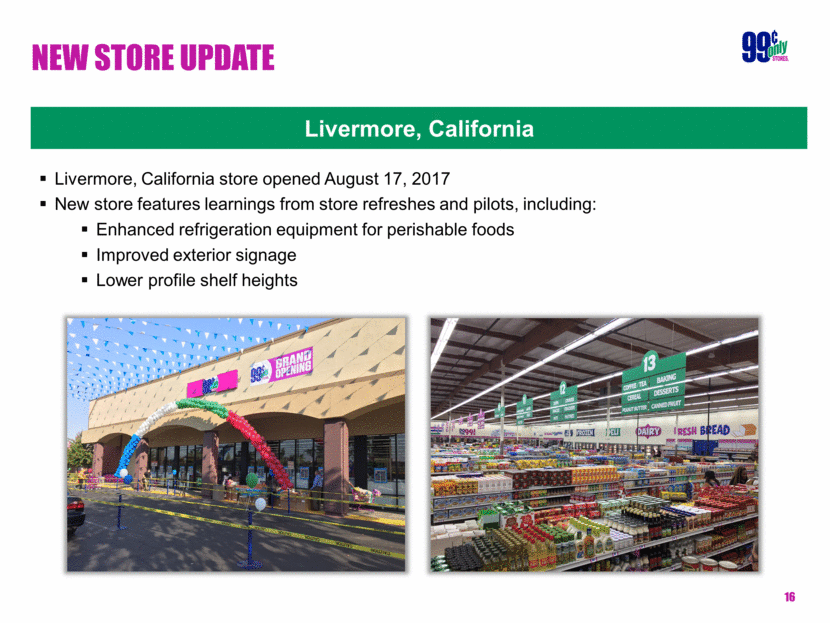
NEW STORE UPDATE Livermore, California Livermore, California store opened August 17, 2017 New store features learnings from store refreshes and pilots, including: Enhanced refrigeration equipment for perishable foods Improved exterior signage Lower profile shelf heights |
|
|
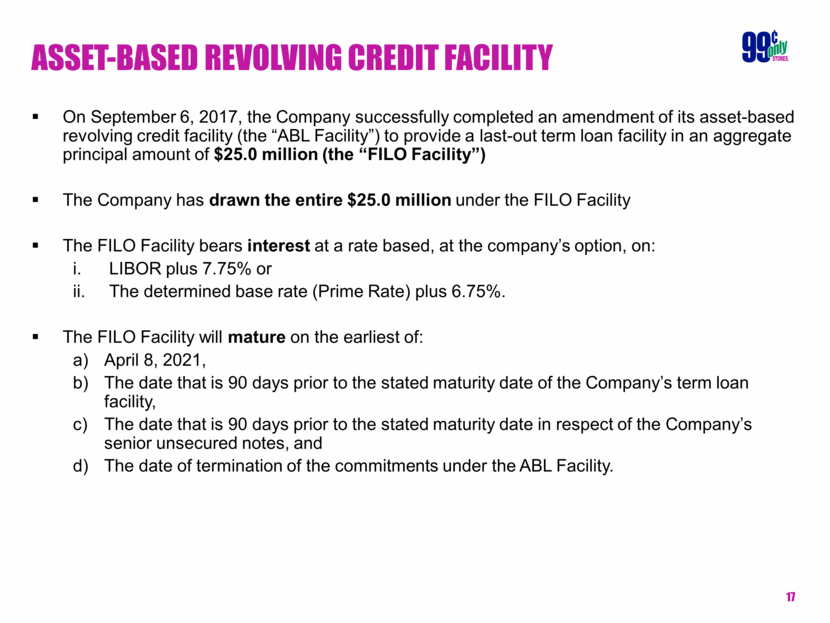
asset-based revolving credit facility On September 6, 2017, the Company successfully completed an amendment of its asset-based revolving credit facility (the “ABL Facility”) to provide a last-out term loan facility in an aggregate principal amount of $25.0 million (the “FILO Facility”) The Company has drawn the entire $25.0 million under the FILO Facility The FILO Facility bears interest at a rate based, at the company’s option, on: LIBOR plus 7.75% or The determined base rate (Prime Rate) plus 6.75%. The FILO Facility will mature on the earliest of: April 8, 2021, The date that is 90 days prior to the stated maturity date of the Company’s term loan facility, The date that is 90 days prior to the stated maturity date in respect of the Company’s senior unsecured notes, and The date of termination of the commitments under the ABL Facility. |
|
|
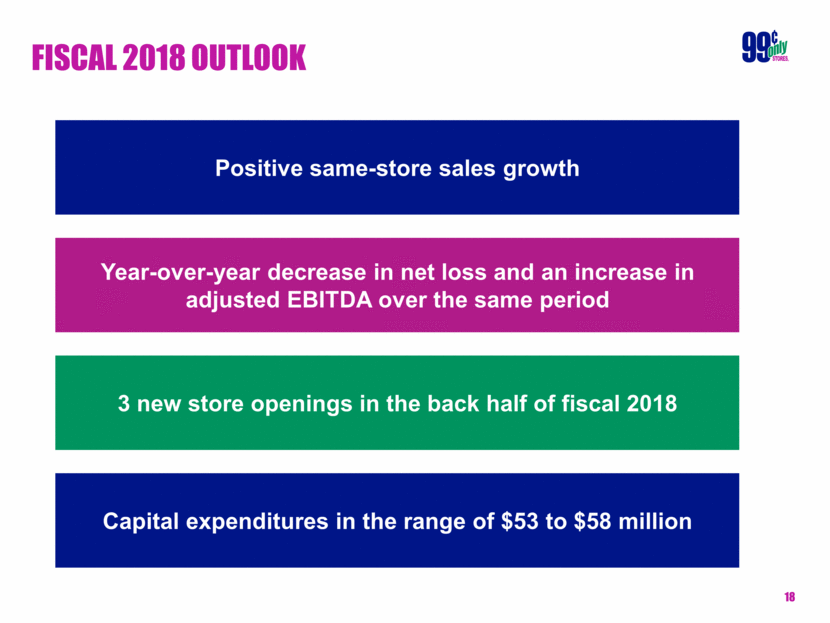
fiscal 2018 Outlook Positive same-store sales growth Capital expenditures in the range of $53 to $58 million Year-over-year decrease in net loss and an increase in adjusted EBITDA over the same period 3 new store openings in the back half of fiscal 2018 |
|
|
[LOGO] |