Attached files
| file | filename |
|---|---|
| EX-99.1 - EXHIBIT 99.1 - ABM INDUSTRIES INC /DE/ | t1702510_ex99-1.htm |
| 8-K - FORM 8-K - ABM INDUSTRIES INC /DE/ | t1702510_8k.htm |
Exhibit 99.2

Cover Slide Title (20pt. Bold) Third Quarter 2017 Teleconference September 7, 2017
Agenda 2 2 3 Capital Structure Acquisition of GCA Services Group Forward - Looking Statements and Non - GAAP Financial Information: Our discussions during this conference call and in this presentation will include forward - looking statements. Actual results co uld differ materially from those projected in the forward - looking statements. Some of the factors that could cause actual results to differ are discussed in the Company’s 2 016 Annual Report on Form 10 - K and in our 2017 reports on Form 10 - Q and Form 8 - K. These reports are available on our website at http://investor.abm.com under “Company In formation”. A description of other factors that could cause actual results to differ is also set forth at the end of this presentation. Also, the discussion during this conference call and in this presentation will include certain financial measures that were n ot prepared in accordance with U.S. generally accepted accounting principles (“U.S. GAAP”). Please see the Appendix for reconciliations of those historical non - GAAP financia l measures and for information relating to the use of certain other non - GAAP financial measures. Reconciliations of certain non - GAAP financial measures can also be found on the Investor Relations portion of our website at http://investor.abm.com. 1 Third Quarter 2017 Review

$1,296.9 $1,318.4 2016 2017 Q3FY17 Revenue Third Quarter 2017 Review 3 Note: Excluding the impact of currency translation and Government, organic revenue growth for Q3 FY17 was 2 .8% • Q3 FY17 revenue increase of 1.7% y - o - y, reflecting the sale of Government Services in May 2017 • Q3 FY17 2.3% organic growth, excluding Government
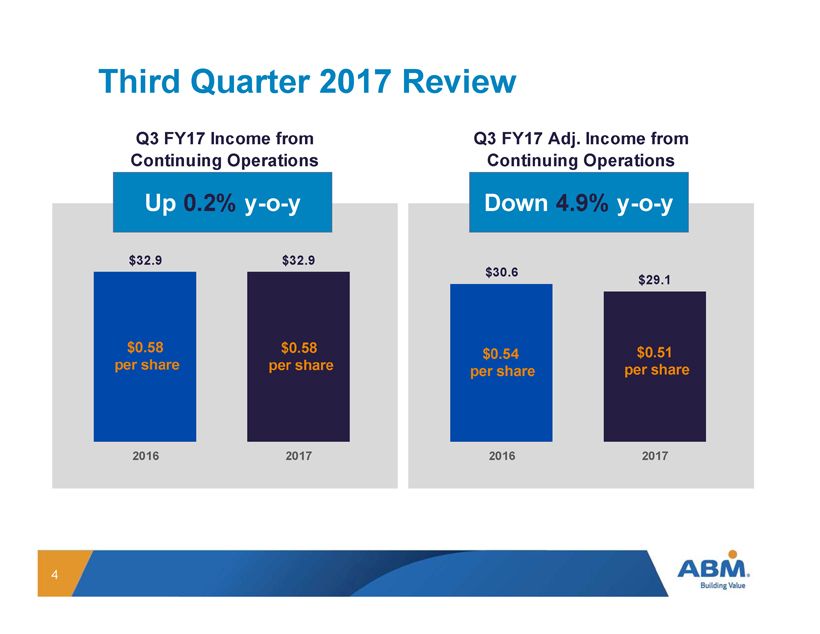
Q3 FY17 Income from Continuing Operations Q3 FY17 Adj. Income from Continuing Operations $32.9 $32.9 2016 2017 Up 0.2% y - o - y $30.6 $29.1 2016 2017 Down 4.9% y - o - y Third Quarter 2017 Review 4 $0.58 per share $0.51 per share $0.54 per share $0.58 per share
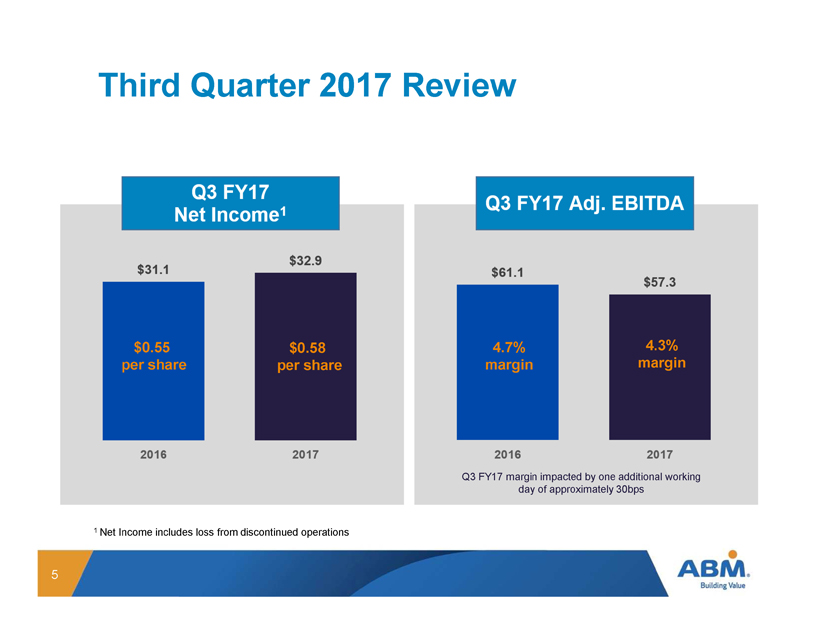
Third Quarter 2017 Review 5 1 Net Income includes loss from discontinued operations Q3 FY17 margin impacted by one additional working day of approximately 30bps 4.7% margin 4 .3% margin $0.58 per share $0.55 per share
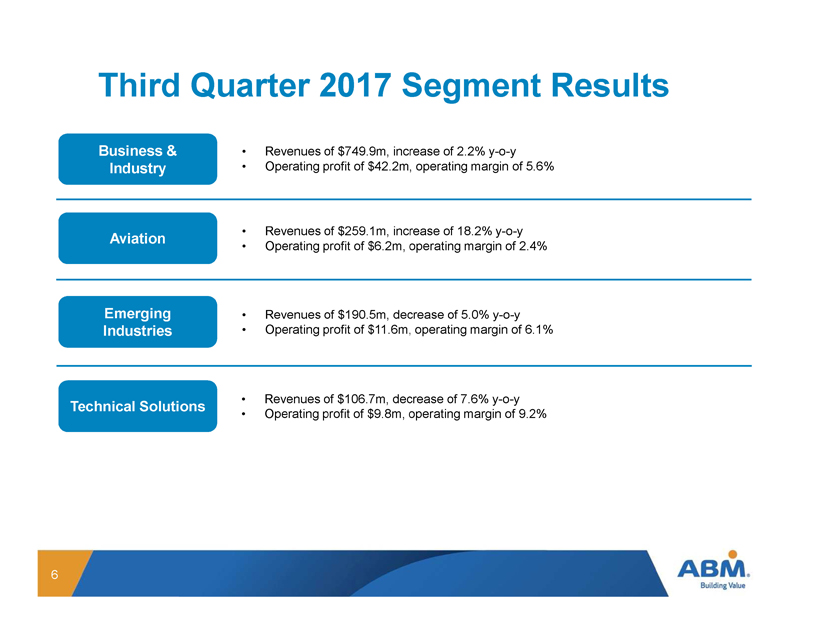
Third Quarter 2017 Segment Results 6 Business & Industry • Revenues of $749.9m, increase of 2.2% y - o - y • Operating profit of $42.2m, operating margin of 5.6% Aviation • Revenues of $259.1m, increase of 18.2% y - o - y • Operating profit of $6. 2 m, operating margin of 2 .4 % Emerging Industries • Revenues of $190.5m, decrease of 5.0% y - o - y • Operating profit of $ 11.6 m, operating margin of 6.1 % Technical Solutions • Revenues of $106.7m, decrease of 7.6% y - o - y • Operating profit of $9 .8 m, operating margin of 9.2%
Acquisition of GCA Services Group
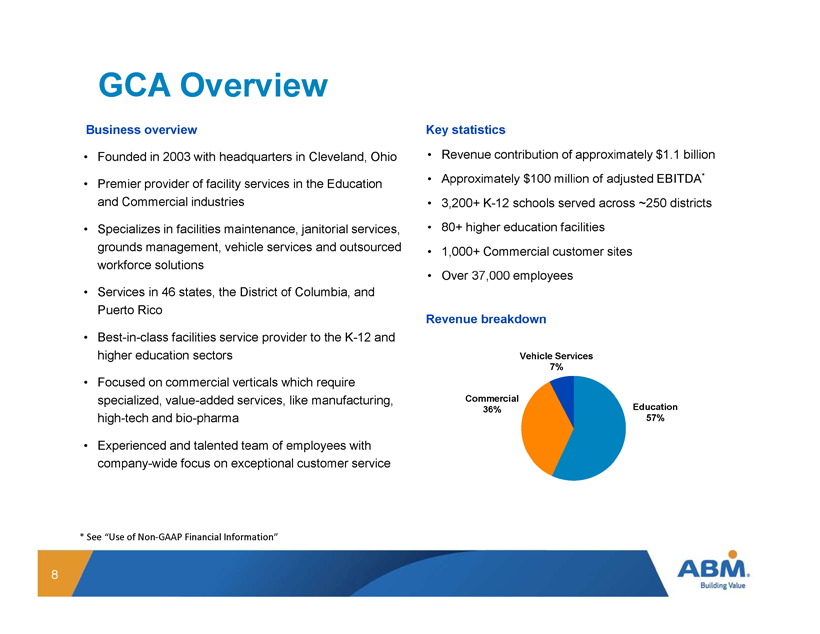
Education Division 56% $573mm Commercial Division 43% $436mm Vehicle Services 7% Education 57% Commercial 36% Revenue breakdown Key statistics • Revenue contribution of approximately $1.1 billion • Approximately $100 million of adjusted EBITDA * • 3,200+ K - 12 schools served across ~250 districts • 80+ higher education facilities • 1,000+ Commercial customer sites • Over 37,000 employees • Founded in 2003 with headquarters in Cleveland, Ohio • Premier provider of facility services in the Education and Commercial industries • Specializes in facilities maintenance, janitorial services, grounds management, vehicle services and outsourced workforce solutions • Services in 46 states, the District of Columbia, and Puerto Rico • Best - in - class facilities service provider to the K - 12 and higher education sectors • Focused on commercial verticals which require specialized, value - added services, like manufacturing, high - tech and bio - pharma • Experienced and talented team of employees with company - wide focus on exceptional customer service Business overview GCA Overview * See “Use of Non - GAAP Financial Information” 8
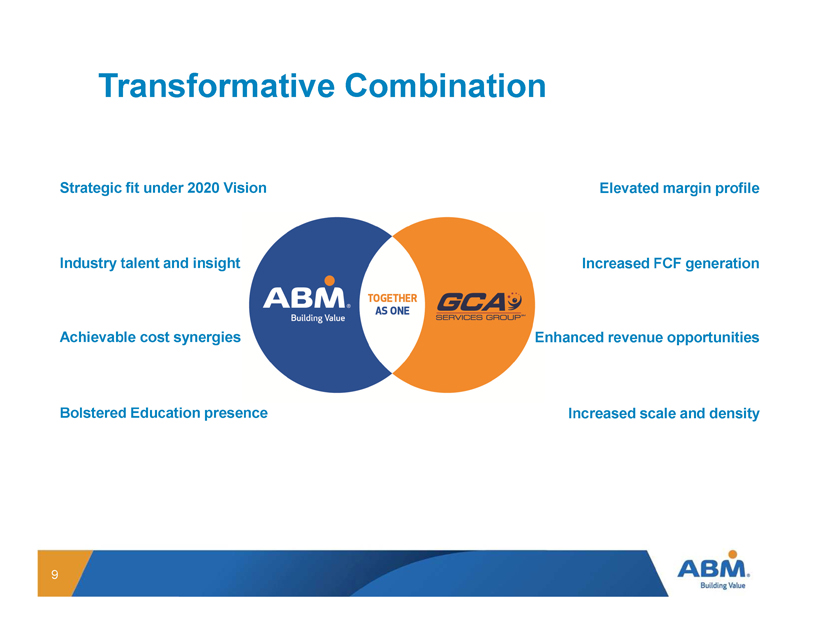
Transformative Combination 9 Strategic fit under 2020 Vision Industry talent and insight Achievable cost synergies Bolstered Education presence Elevated margin profile Increased FCF generation Enhanced revenue opportunities Increased scale and density
Forward - Looking Statements This presentation contains both historical and forward - looking statements regarding ABM Industries Incorporated (“ABM”) and its subsidiaries (collectively referred to as “ABM,” “we,” “us,” “our,” or the “Company”). We make forward - looking statements related to future expectations, estimates, and p rojections that are uncertain and often contain words such as “anticipate,” “believe,” “could,” “estimate,” “expect,” “forecast,” “intend,” “likely,” “may,” “outlook ,” “plan,” “predict,” “should,” “target,” or other similar words or phrases. These statements are not guarantees of future performance and are subject to known and unknown risk s, uncertainties, and assumptions that are difficult to predict. For us, particular risks and uncertainties that could cause our actual results to be materiall y d ifferent from those expressed in our forward - looking statements include the following: (1) we may not realize the growth opportunities and cost synergies that are antici pat ed from the acquisition of GCA Services Group (“GCA”); (2) we have incurred a substantial amount of debt to complete the acquisition of GCA, and to service our debt we will require a significant amount of cash; (3) changes to our businesses, operating structure, financial reporting structure, or personnel relating to the impleme nta tion of our 2020 Vision strategic transformation initiative; (4) unfavorable developments in our class and representative actions and other lawsuits alleging v ari ous claims; (5) increases in estimates of ultimate insurance losses; (6) our risk management and safety programs may not be successful in achieving anticipated improve men ts; (7) challenges preserving long - term client relationships, passing through costs to clients, responding to competitive pressures, and retaining qualified per son nel; (8) unexpected tax liabilities or changes in tax laws; (9) the impact of Hurricane Harvey on our business is currently unknown as the flooding it caused has dis rupted operations at our Shared Services Center in Sugar Land, TX and impacted services we provide to clients in the Houston area and the time frame to resum e o perations and provision of services to impacted clients is uncertain; (10) deterioration of general economic conditions and resulting reductions in commercial of fic e building occupancy; (11) impairment of goodwill and long - lived assets; (12) changes in immigration laws, or enforcement actions or investigations under such laws; (13 ) failure of our joint venture partners to perform their obligations; (14) losses or other incidents at facilities in which we operate; (15) difficulty responding to cy ber - security incidents and business interruptions; (16) liabilities associated with participation in multiemployer pension plans; (17) actions of activist investors; and (18) w eat her conditions, catastrophic events, and terrorist attacks. Additional information regarding these and other risks and uncertainties we face is contained in our Annual Report on Form 10 - K for the year ended October 31, 2016 and in other reports we file from time to time with the Securities and Exchange Commission (including all amendments to those re ports). We urge readers to consider these risks and uncertainties in evaluating our forward - looking statements. We caution readers not to place undue reliance upon any such forward - looking statements, which speak only as of the date made. We undertake no obligation to publicly update any forward - looking statements, whether as a result of new information, future events, or otherwise, except as required by law. 10

Appendix
Use of Non - GAAP Financial Information The discussion during this conference call and the accompanying presentation will include certain financial measures that were not prepared in accordance with U . S . generally accepted accounting principles (“U . S . GAAP”) . Reconciliations of historical non - GAAP financial measures to the most directly comparable U . S . GAAP financial measures can be found on the Investor Relations portion of our website at http : //investor . abm . com and in this Appendix . Our discussion and presentation will also include an estimate of GCA’s adjusted EBITDA contribution and total debt to pro forma lender - adjusted EBITDA, which includes an estimate for adjusted EBITDA related to GCA . Adjusted EBITDA is a non - GAAP financial measure which represents earnings before interest, taxes, depreciation, amortization and other adjustments . Lender - adjusted EBITDA is a non - GAAP financial measure utilized in the financial covenants contained in the Company’s credit agreement . GCA uses adjusted EBITDA as a measurement of financial results and as an indication of the relative strength of operating performance . The Company's estimate of GCA’s adjusted EBITDA and lender - adjusted EBITDA are based only on projected financial information . These non - GAAP financial measures are not intended to replace the presentation of financial results in accordance with U . S . GAAP . These non - GAAP financial measures may not be comparable to similar measures used by other companies and may exclude certain nondiscretionary expenses and reflect other adjustments . Reconciliations of these forward - looking non - GAAP financial measures to the most directly comparable GAAP financial measures are not provided because the Company is unable to provide such reconciliations without unreasonable effort, due to the uncertainty and inherent difficulty of predicting the occurrence and the financial impact of information concerning amounts of certain items excluded from adjusted EBITDA and lender - adjusted EBITDA, such as amortization and taxes and items impacting comparability, which are not determinable on a forward - looking basis at this time . 12
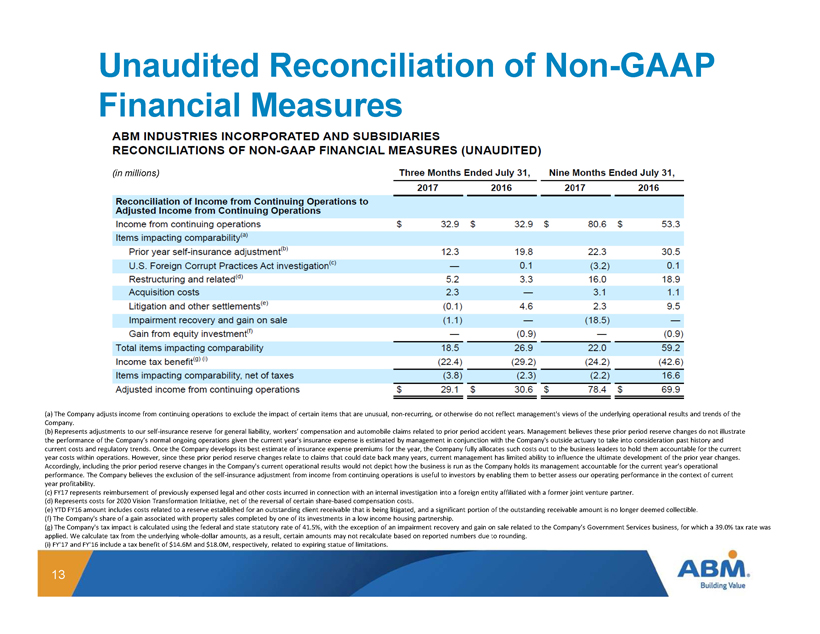
Unaudited Reconciliation of Non - GAAP Financial Measures 13 (a) The Company adjusts income from continuing operations to exclude the impact of certain items that are unusual, non - recurring , or otherwise do not reflect management's views of the underlying operational results and trends of the Company. (b) Represents adjustments to our self - insurance reserve for general liability, workers’ compensation and automobile claims rela ted to prior period accident years. Management believes these prior period reserve changes do not illustrate the performance of the Company’s normal ongoing operations given the current year's insurance expense is estimated by managem ent in conjunction with the Company's outside actuary to take into consideration past history and current costs and regulatory trends. Once the Company develops its best estimate of insurance expense premiums for the year, the Company fully allocates such costs out to the business leaders to hold them accountable for the current year costs within operations. However, since these prior period reserve changes relate to claims that could date back many ye ars , current management has limited ability to influence the ultimate development of the prior year changes. Accordingly, including the prior period reserve changes in the Company's current operational results would not depict how the bu siness is run as the Company holds its management accountable for the current year’s operational performance. The Company believes the exclusion of the self - insurance adjustment from income from continuing operations is usefu l to investors by enabling them to better assess our operating performance in the context of current year profitability. (c) FY17 represents reimbursement of previously expensed legal and other costs incurred in connection with an internal invest iga tion into a foreign entity affiliated with a former joint venture partner. (d) Represents costs for 2020 Vision Transformation Initiative, net of the reversal of certain share - based compensation costs. (e) YTD FY16 amount includes costs related to a reserve established for an outstanding client receivable that is being litiga ted , and a significant portion of the outstanding receivable amount is no longer deemed collectible. (f) The Company's share of a gain associated with property sales completed by one of its investments in a low income housing par tnership. (g) The Company's tax impact is calculated using the federal and state statutory rate of 41.5%, with the exception of an impa irm ent recovery and gain on sale related to the Company’s Government Services business, for which a 39.0% tax rate was applied. We calculate tax from the underlying whole - dollar amounts, as a result, certain amounts may not recalculate based on re ported numbers due to rounding. ( i ) FY'17 and FY'16 include a tax benefit of $14.6M and $18.0M, respectively, related to expiring statue of limitations. (in millions)
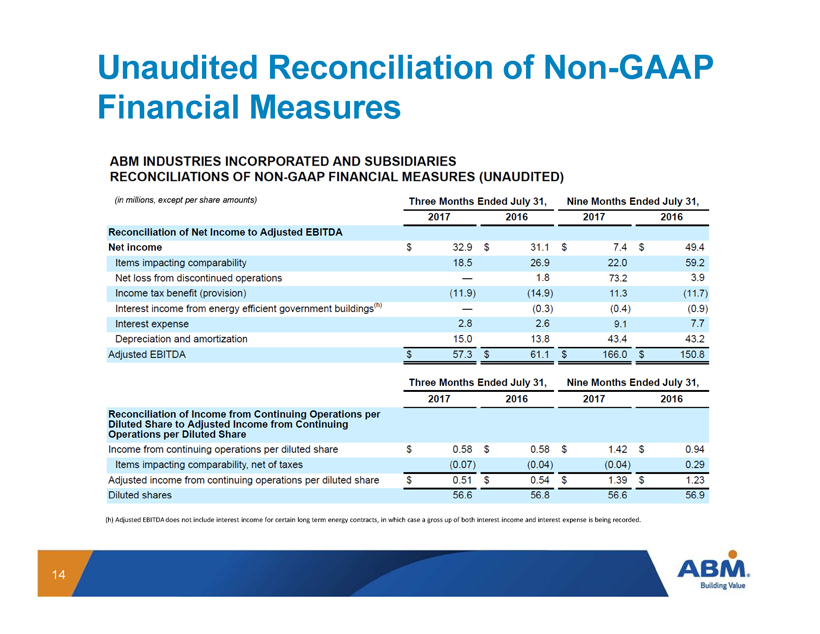
Unaudited Reconciliation of Non - GAAP Financial Measures 14 (h) Adjusted EBITDA does not include interest income for certain long term energy contracts, in which case a gross up of both in terest income and interest expense is being recorded. (in millions, except per share amounts)