Attached files
| file | filename |
|---|---|
| 8-K - 8-K - Acacia Communications, Inc. | d444523d8k.htm |

Investor Presentation August 30, 2017 CONNECTING AT THE SPEED OF LIGHT Exhibit 99.1
Safe Harbor Statement This presentation contains forward-looking statements that involve substantial risks and uncertainties. All statements, other than statements of historical facts, contained in this presentation, including statements regarding our strategy, future operations, future financial position, future revenues, projected costs, prospects, plans and objectives of management, are forward-looking statements. The words “anticipate,” “believe,” “estimate,” “expect,” “intend,” “may,” “plan,” “predict,” “project,” “target,” “potential,” “will,” “would,” “could,” “should,” “continue,” and similar expressions are intended to identify forward-looking statements, although not all forward-looking statements contain these identifying words. We may not actually achieve the plans, intentions or expectations disclosed in our forward-looking statements, and you should not place undue reliance on our forward-looking statements. Actual results or events could differ materially from the plans, intentions and expectations disclosed in the forward-looking statements we make. The forward-looking statements contained in this presentation reflect our current views with respect to future events, and we assume no obligation to update any forward-looking statements. Forward-looking statements represent our management’s beliefs and assumptions only as of the date of this presentation, and our actual future results may be materially different from what we expect. We have included important factors in the cautionary statements included in our Quarterly Report on Form 10-Q for the three month period ended June 30, 2017 and other documents we have filed with the SEC, particularly in the Risk Factors section, that we believe could cause actual results or events to differ materially from the forward-looking statements that we make. Except as required by law, we assume no obligation to update these forward-looking statements publicly, or to update the reasons why actual results could differ materially from those anticipated in the forward-looking statements, even if new information becomes available in the future. Non-GAAP Financial Measures This presentation includes measures defined by the SEC as non-GAAP financial measures. We believe that these non-GAAP financial measures can provide useful supplemental information to investors when read in conjunction with our GAAP results. Reconciliations of these non-GAAP financial measures to their most directly comparable GAAP financial measures are available in the Appendix to this presentation, and descriptions of these non-GAAP financial measures can be found in our earnings release with respect to our second quarter 2017 results.
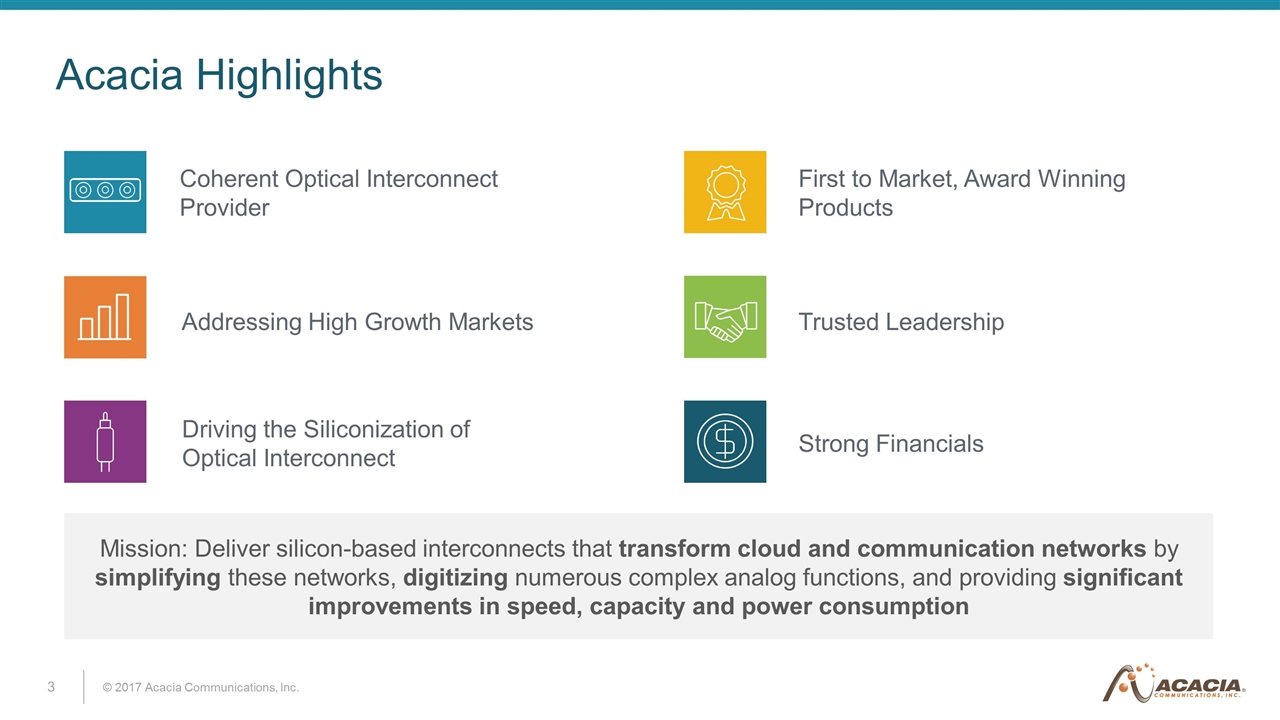
Acacia Highlights Mission: Deliver silicon-based interconnects that transform cloud and communication networks by simplifying these networks, digitizing numerous complex analog functions, and providing significant improvements in speed, capacity and power consumption Coherent Optical Interconnect Provider Addressing High Growth Markets Driving the Siliconization of Optical Interconnect First to Market, Award Winning Products Trusted Leadership Strong Financials
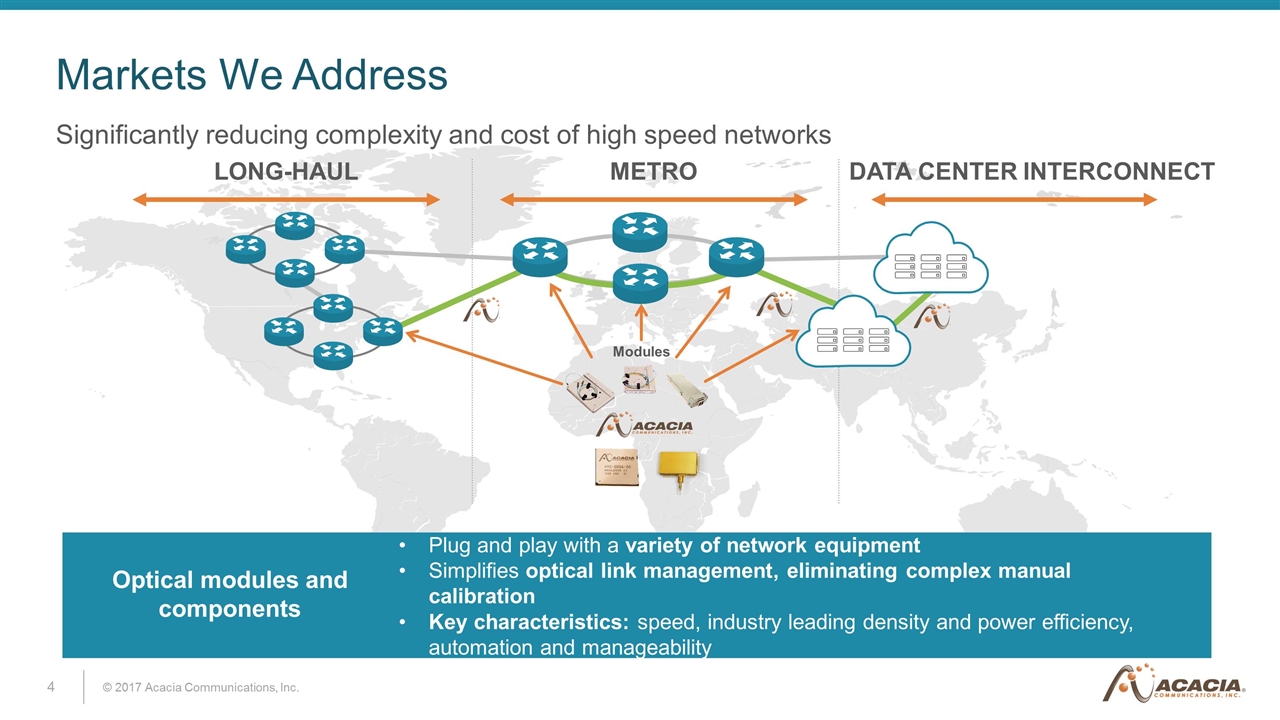
Significantly reducing complexity and cost of high speed networks Markets We Address METRO LONG-HAUL DATA CENTER INTERCONNECT Modules Plug and play with a variety of network equipment Simplifies optical link management, eliminating complex manual calibration Key characteristics: speed, industry leading density and power efficiency, automation and manageability Optical modules and components
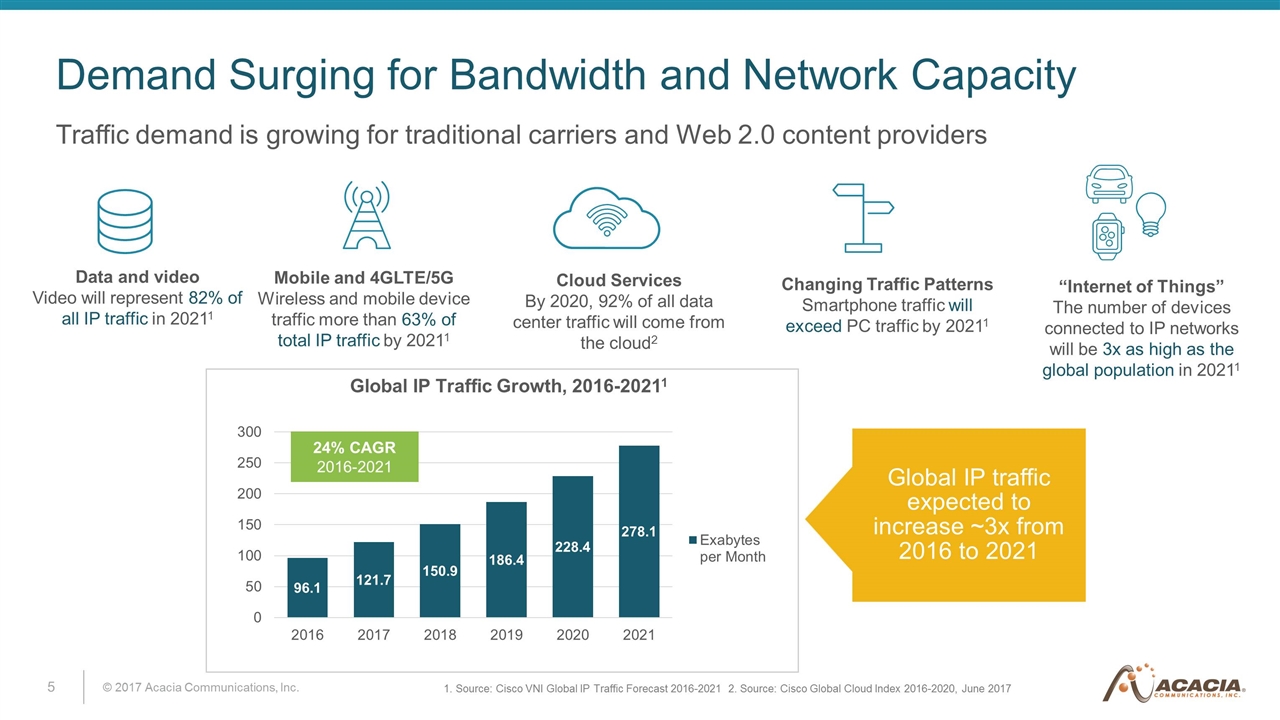
Traffic demand is growing for traditional carriers and Web 2.0 content providers Demand Surging for Bandwidth and Network Capacity Data and video Video will represent 82% of all IP traffic in 20211 Mobile and 4GLTE/5G Wireless and mobile device traffic more than 63% of total IP traffic by 20211 Cloud Services By 2020, 92% of all data center traffic will come from the cloud2 “Internet of Things” The number of devices connected to IP networks will be 3x as high as the global population in 20211 Changing Traffic Patterns Smartphone traffic will exceed PC traffic by 20211 Global IP Traffic Growth, 2016-20211 1. Source: Cisco VNI Global IP Traffic Forecast 2016-2021 2. Source: Cisco Global Cloud Index 2016-2020, June 2017 24% CAGR 2016-2021 Global IP traffic expected to increase ~3x from 2016 to 2021
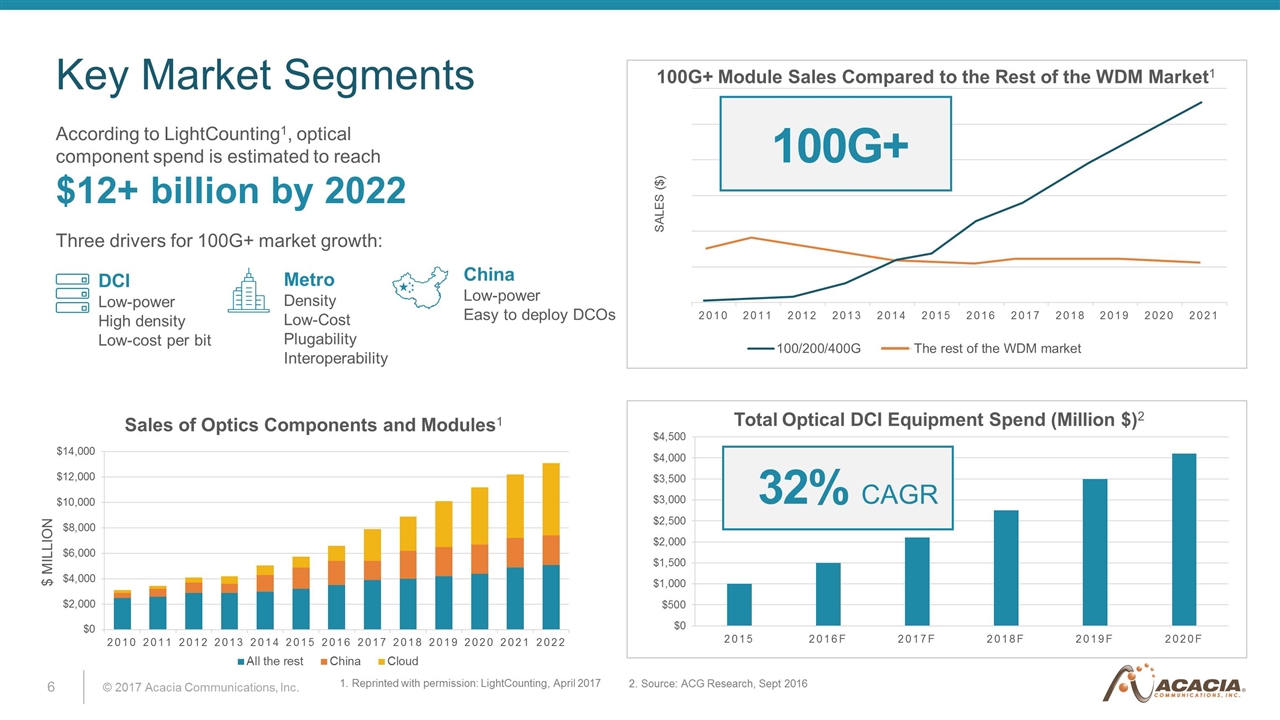
Key Market Segments According to LightCounting1, optical component spend is estimated to reach $12+ billion by 2022 Total Optical DCI Equipment Spend (Million $)2 Three drivers for 100G+ market growth: DCI Low-power High density Low-cost per bit Metro Density Low-Cost Plugability Interoperability China Low-power Easy to deploy DCOs Sales of Optics Components and Modules1 100G+ 32% CAGR 2. Source: ACG Research, Sept 2016 1. Reprinted with permission: LightCounting, April 2017 100G+ Module Sales Compared to the Rest of the WDM Market1
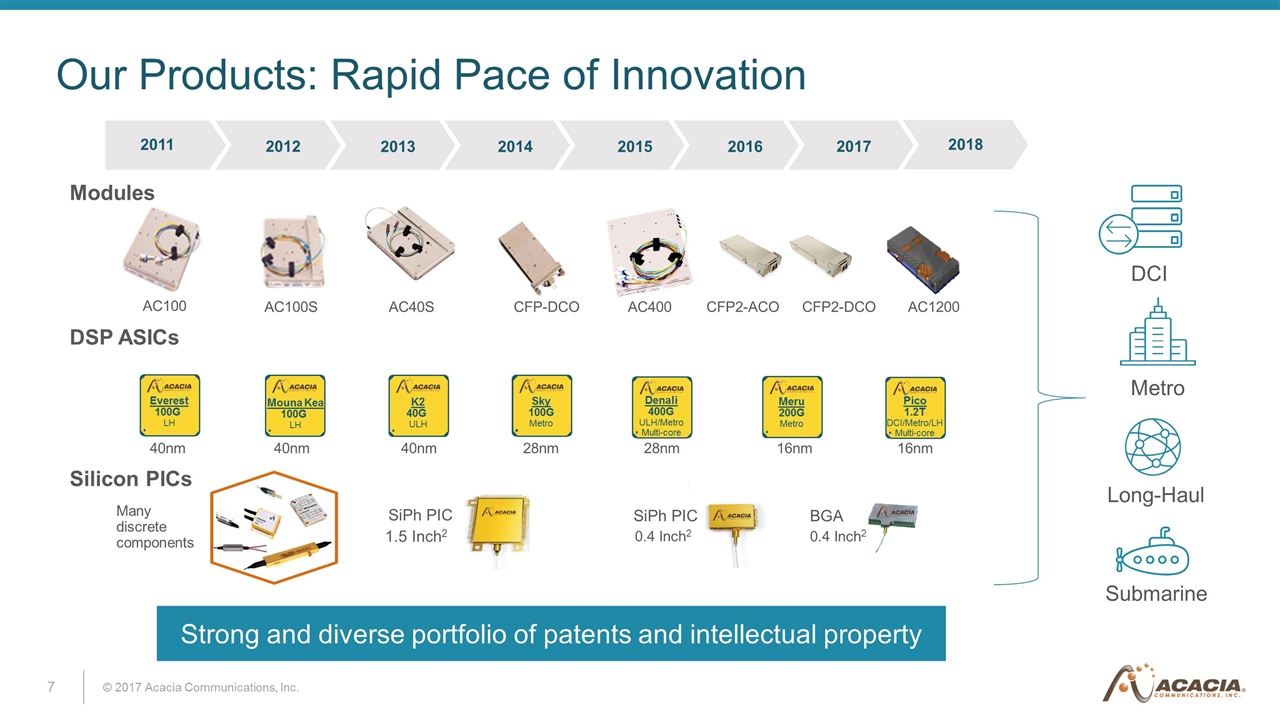
Our Products: Rapid Pace of Innovation DSP ASICs Everest 100G LH BGA 0.4 Inch2 Many discrete components 1.5 Inch2 SiPh PIC 0.4 Inch2 SiPh PIC 2011 2012 2013 2014 2015 2016 2017 Silicon PICs 2018 Modules 40nm 40nm 40nm 28nm 28nm 16nm 16nm AC100 AC100S AC40S CFP-DCO AC400 CFP2-ACO CFP2-DCO AC1200 Strong and diverse portfolio of patents and intellectual property Long-Haul DCI Metro Submarine Mouna Kea 100G LH K2 40G ULH Sky 100G Metro Denali 400G ULH/Metro Multi-core Meru 200G Metro Pico 1.2T DCI/Metro/LH Multi-core
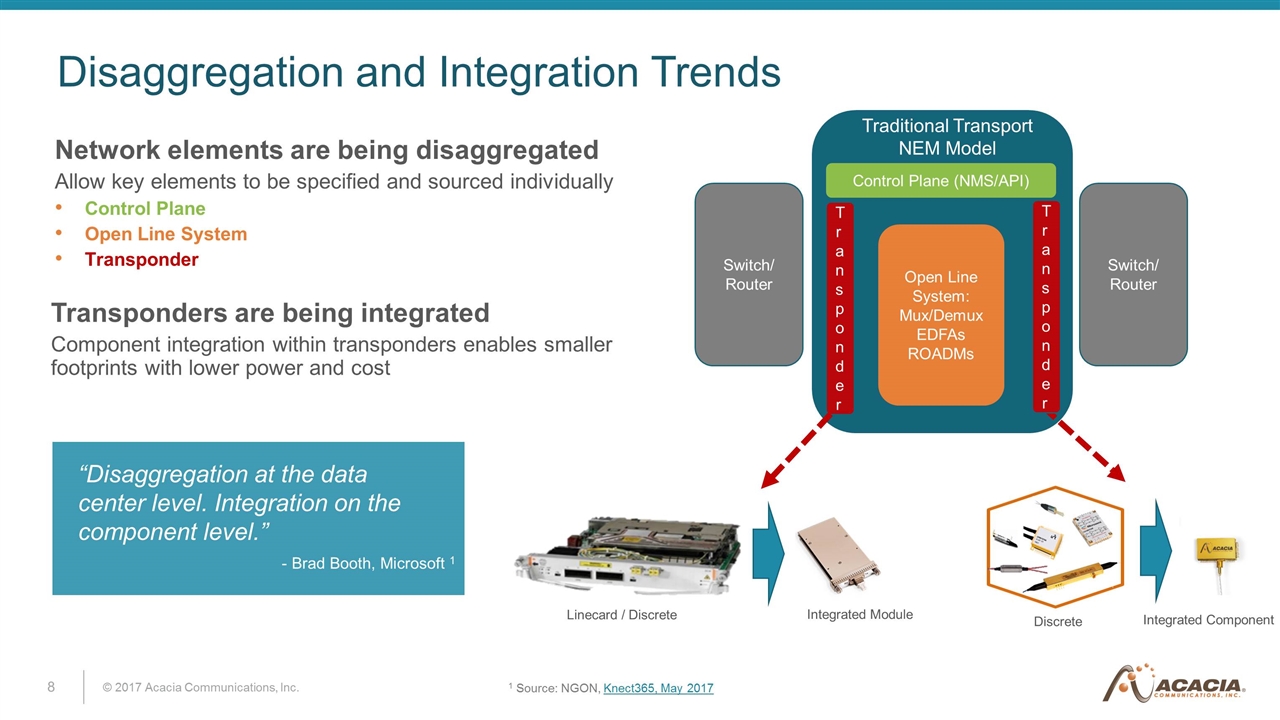
Network elements are being disaggregated Allow key elements to be specified and sourced individually Control Plane Open Line System Transponder Disaggregation and Integration Trends Switch/ Router Open Line System: Mux/Demux EDFAs ROADMs Switch/ Router Control Plane (NMS/API) Transponder Traditional Transport NEM Model Integrated Module Linecard / Discrete Discrete Integrated Component Transponders are being integrated Component integration within transponders enables smaller footprints with lower power and cost 1 Source: NGON, Knect365, May 2017 “Disaggregation at the data center level. Integration on the component level.” - Brad Booth, Microsoft 1 Transponder
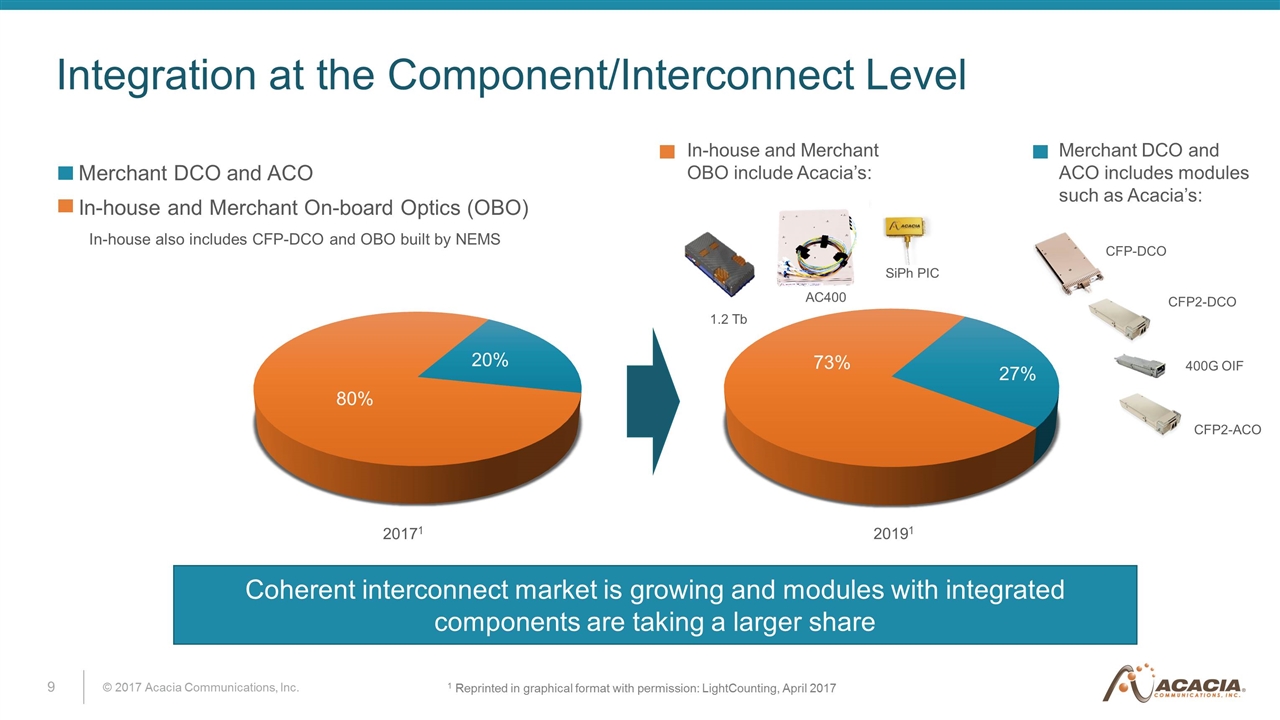
Integration at the Component/Interconnect Level Merchant DCO and ACO In-house and Merchant On-board Optics (OBO) 20171 80% 20% 20191 73% 27% 1 Reprinted in graphical format with permission: LightCounting, April 2017 CFP2-ACO CFP2-DCO Merchant DCO and ACO includes modules such as Acacia’s: 1.2 Tb 400G OIF CFP-DCO AC400 SiPh PIC Coherent interconnect market is growing and modules with integrated components are taking a larger share In-house also includes CFP-DCO and OBO built by NEMS In-house and Merchant OBO include Acacia’s:
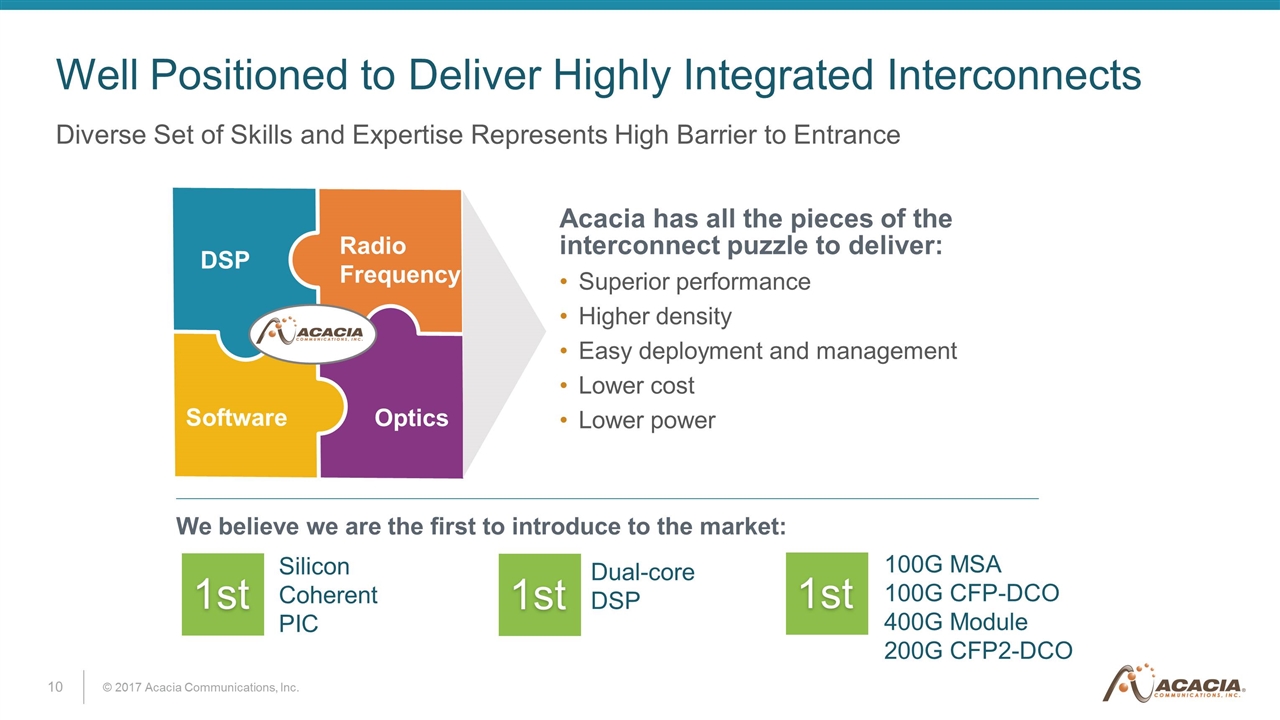
Well Positioned to Deliver Highly Integrated Interconnects Diverse Set of Skills and Expertise Represents High Barrier to Entrance Acacia has all the pieces of the interconnect puzzle to deliver: Superior performance Higher density Easy deployment and management Lower cost Lower power DSP Radio Frequency Software Optics Silicon Coherent PIC Dual-core DSP 100G MSA 100G CFP-DCO 400G Module 200G CFP2-DCO 1st 1st 1st We believe we are the first to introduce to the market:
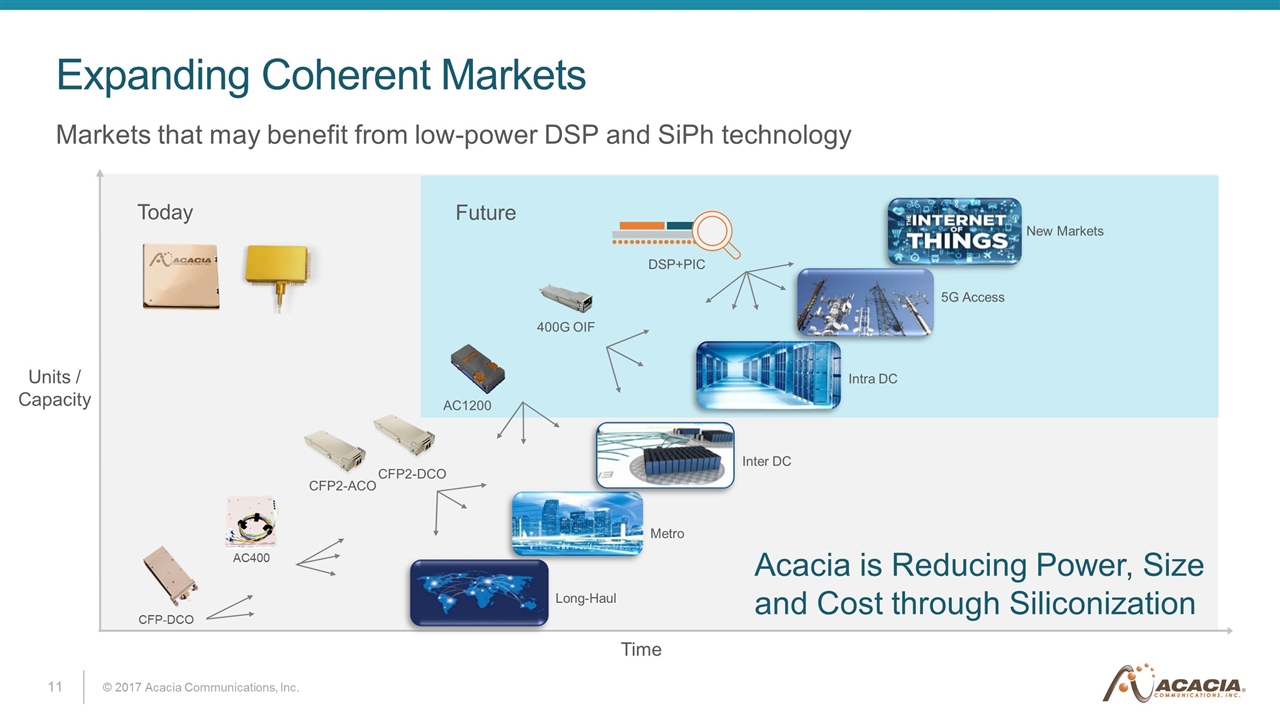
Expanding Coherent Markets Markets that may benefit from low-power DSP and SiPh technology Time Units / Capacity Acacia is Reducing Power, Size and Cost through Siliconization 400G OIF AC1200 AC400 Today Future DSP+PIC CFP2-DCO CFP2-ACO Intra DC Inter DC Metro New Markets 5G Access Long-Haul CFP-DCO
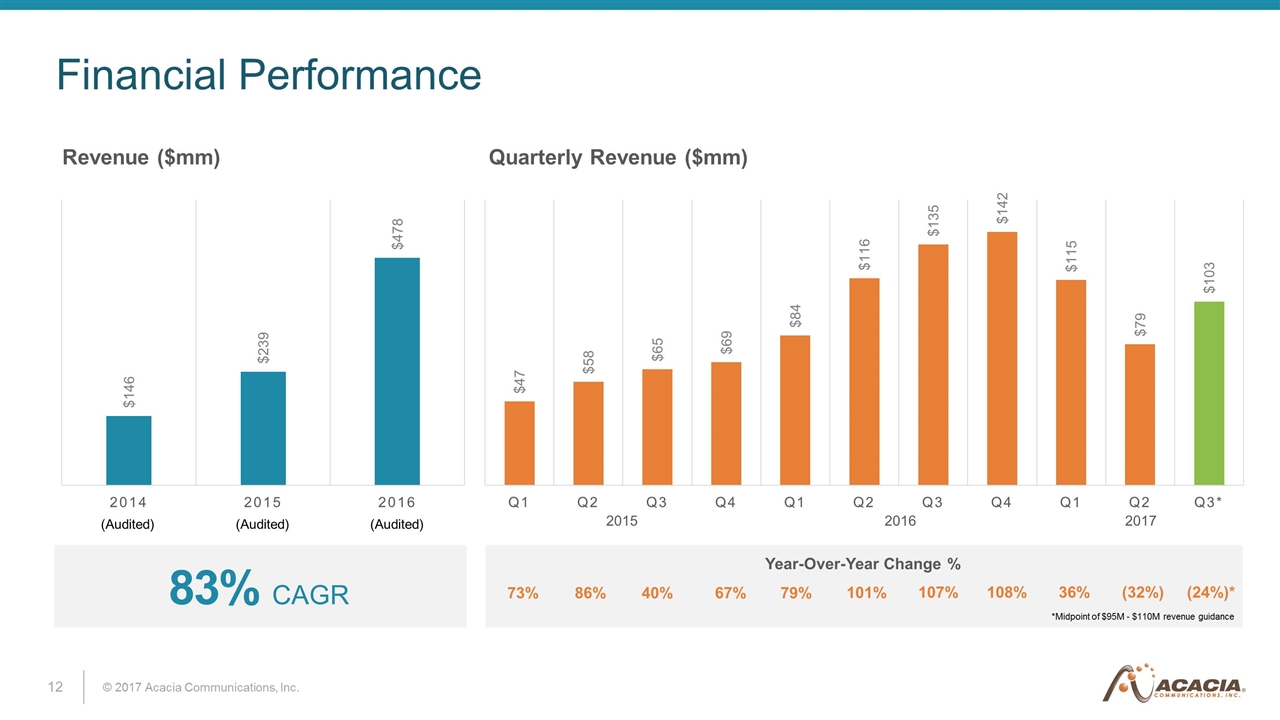
Financial Performance Year-Over-Year Change % Revenue ($mm) Quarterly Revenue ($mm) *Midpoint of $95M - $110M revenue guidance 73% 86% 40% 67% 79% 101% 107% 108% 36% (32%) 2015 2016 2017 83% CAGR (24%)* (Audited) (Audited) (Audited)
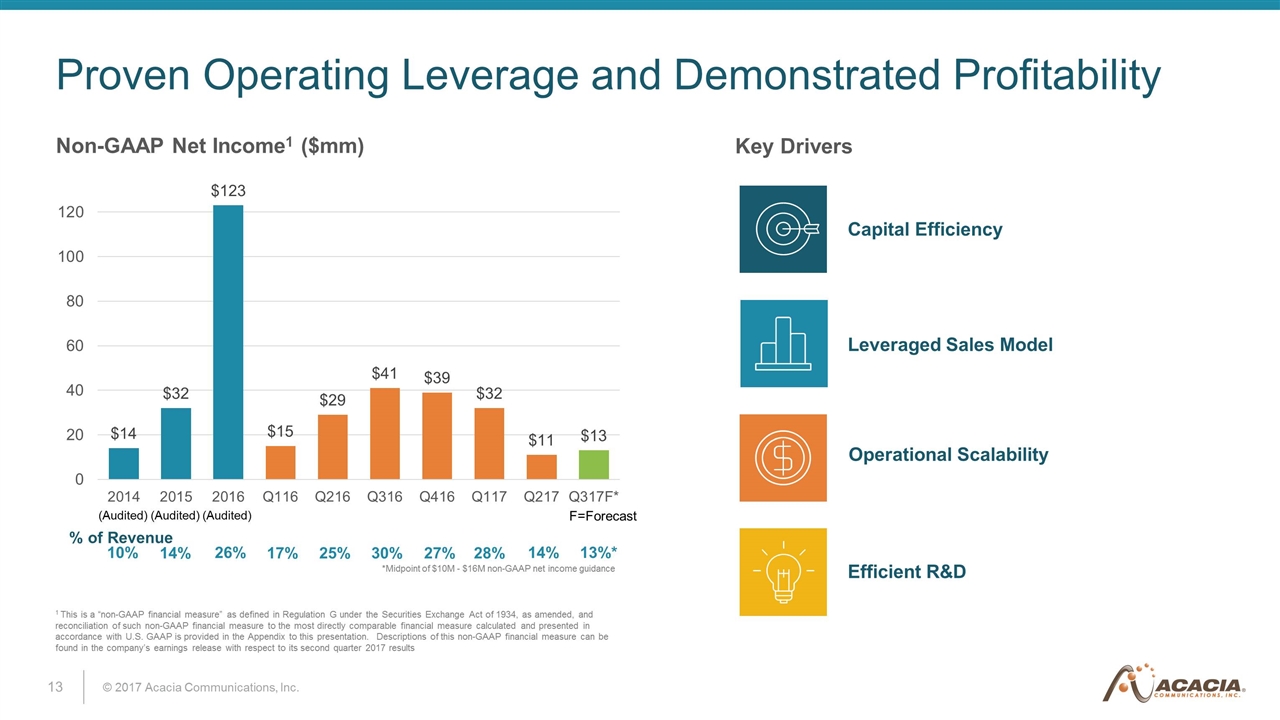
Proven Operating Leverage and Demonstrated Profitability Operational Scalability Leveraged Sales Model Capital Efficiency Efficient R&D Non-GAAP Net Income1 ($mm) Key Drivers *Midpoint of $10M - $16M non-GAAP net income guidance 1 This is a “non-GAAP financial measure” as defined in Regulation G under the Securities Exchange Act of 1934, as amended, and reconciliation of such non-GAAP financial measure to the most directly comparable financial measure calculated and presented in accordance with U.S. GAAP is provided in the Appendix to this presentation. Descriptions of this non-GAAP financial measure can be found in the company’s earnings release with respect to its second quarter 2017 results % of Revenue 10% 14% 26% 17% 25% 30% 27% 28% 14% 13%* (Audited) (Audited) (Audited) F=Forecast
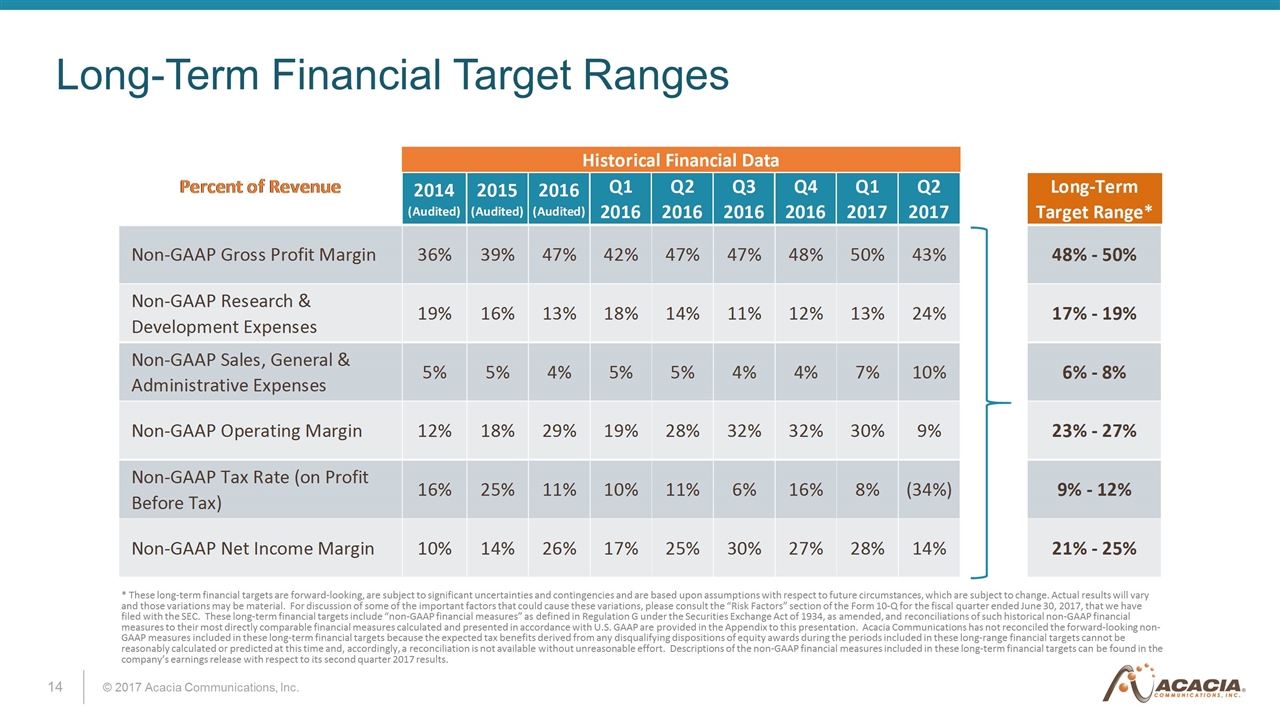
Long-Term Financial Target Ranges * These long-term financial targets are forward-looking, are subject to significant uncertainties and contingencies and are based upon assumptions with respect to future circumstances, which are subject to change. Actual results will vary and those variations may be material. For discussion of some of the important factors that could cause these variations, please consult the “Risk Factors” section of the Form 10-Q for the fiscal quarter ended June 30, 2017, that we have filed with the SEC. These long-term financial targets include “non-GAAP financial measures” as defined in Regulation G under the Securities Exchange Act of 1934, as amended, and reconciliations of such historical non-GAAP financial measures to their most directly comparable financial measures calculated and presented in accordance with U.S. GAAP are provided in the Appendix to this presentation. Acacia Communications has not reconciled the forward-looking non-GAAP measures included in these long-term financial targets because the expected tax benefits derived from any disqualifying dispositions of equity awards during the periods included in these long-range financial targets cannot be reasonably calculated or predicted at this time and, accordingly, a reconciliation is not available without unreasonable effort. Descriptions of the non-GAAP financial measures included in these long-term financial targets can be found in the company’s earnings release with respect to its second quarter 2017 results. Historical Financial Data Percent of Revenue 2014 (Audited) 2015 (Audited) 2016 (Audited) Q1 2016 Q2 2016 Q3 2016 Q4 2016 Q1 2017 Q2 2017 Long-Term Target Range* Non-GAAP Gross Profit Margin 0.36 0.39 0.47 0.42 0.47 0.47 0.48 0.495 0.43 48% - 50% Non-GAAP Research & Development Expenses 0.19 0.16 0.13 0.18 0.14000000000000001 0.11 0.12 0.13 0.24 17% - 19% Non-GAAP Sales, General & Administrative Expenses 0.05 0.05 0.04 0.05 0.05 0.04 0.04 6.5000000000000002E-2 0.1 6% - 8% Non-GAAP Operating Margin 0.12 0.18 0.28999999999999998 0.19 0.28000000000000003 0.32 0.32 0.3 0.09 23% - 27% Non-GAAP Tax Rate (on Profit Before Tax) 0.16 0.25 0.11 0.1 0.11 0.06 0.16 8.2000000000000003E-2 -0.34 9% - 12% Non-GAAP Net Income Margin 0.1 0.14000000000000001 0.26 0.17 0.25 0.3 0.27 0.28000000000000003 0.14000000000000001 21% - 25%

Appendix
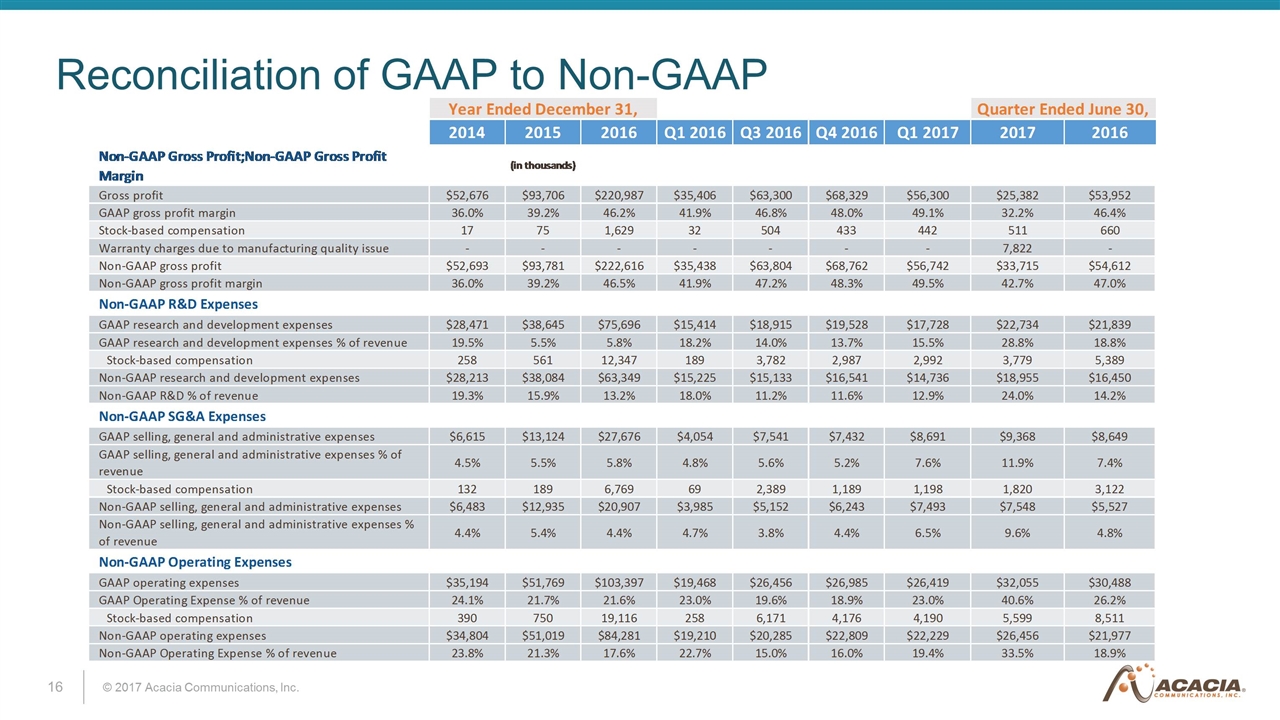
Reconciliation of GAAP to Non-GAAP Quarter Ended June 30, 2014 2015 2016 Q1 2016 Q3 2016 Q4 2016 Q1 2017 2017 2016 Non-GAAP Gross Profit;Non-GAAP Gross Profit Margin Gross profit $52,676 $93,706 $,220,987 $35,406 $63,300 $68,329 $56,300 $25,382 $53,952 GAAP gross profit margin 0.36 0.3919834683086808 0.46191776126016904 0.41906046941021907 0.46783539289304088 0.47974751978206381 0.49098694480539301 0.32170650713579557 0.46433489396860367 Stock-based compensation 17 75 1629 32 504 433 442 511 660 Warranty charges due to manufacturing quality issue - - - - - - - 7822 - Non-GAAP gross profit $52,693.36 $93,781.391983468304 $,222,616.46191776125 $35,438.419060469409 $63,804.46783539289 $68,762.479747519785 $56,742.490986944802 $33,715.321706507137 $54,612.464334893972 Non-GAAP gross profit margin 0.36 0.39200000000000002 0.46500000000000002 0.41943921693948327 0.47156033820138354 0.48278767368546693 0.49484158476283502 0.42699999999999999 0.47 Non-GAAP R&D Expenses GAAP research and development expenses $28,471 $38,645 $75,696 $15,414 $18,915 $19,528 $17,728 $22,734 $21,839 GAAP research and development expenses % of revenue 0.1946 5.5% 5.8% 0.18243795050243228 0.13979631053036126 0.13710883470128557 0.1546042017319717 0.28814418616441484 0.18795614155879922 Stock-based compensation 258 561 12347 189 3782 2987 2992 3779 5389 Non-GAAP research and development expenses $28,213 $38,084 $63,349 $15,225 $15,133 $16,541 $14,736 $18,955 $16,450 Non-GAAP R&D % of revenue 0.19289999999999999 0.15930995247975369 0.13241515681044791 0.18020097290771581 0.11184443918878968 0.11613668756626201 0.12851125432774904 0.24024690106213084 0.14157601211787385 Non-GAAP SG&A Expenses GAAP selling, general and administrative expenses $6,615 $13,124 $27,676 $4,054 $7,541 $7,432 $8,691 $9,368 $8,649 GAAP selling, general and administrative expenses % of revenue 4.5% 5.5% 5.8% 4.8% 5.6% 5.2% 7.6% 0.11873558265101777 7.4% Stock-based compensation 132 189 6769 69 2389 1189 1198 1820 3122 Non-GAAP selling, general and administrative expenses $6,483 $12,935 $20,907 $3,985 $5,152 $6,243 $7,493 $7,548 $5,527 Non-GAAP selling, general and administrative expenses % of revenue 4.4% 5.4% 4.4% 4.7% 3.8% 4.4% 6.5% 9.6% 4.8% Non-GAAP Operating Expenses GAAP operating expenses $35,194 $51,769 $,103,397 $19,468 $26,456 $26,985 $26,419 $32,055 $30,488 GAAP Operating Expense % of revenue 0.24060000000000001 0.21655595341677264 0.21612543163633019 0.23042052811608613 0.19553006562998876 0.1894654805619721 0.23039758605352892 0.40628406296737563 0.26239328008813001 Stock-based compensation 390 750 19116 258 6171 4176 4190 5599 8511 Non-GAAP operating expenses $34,804 $51,019 $84,281 $19,210 $20,285 $22,809 $22,229 $26,456 $21,977 Non-GAAP Operating Expense % of revenue 0.23799999999999999 0.21341861321196706 0.17616823992709213 0.22736687616139378 0.1499216578962928 0.16014519718873529 0.19385699460175987 0.33531901949352327 0.18914383090057835 Non-GAAP Income from Operations (Loss) income from operations $17,482 $41,937 $,117,590 $15,938 $36,844 $41,344 $29,881 $-6,673 $23,464 GAAP operating margin % of revenue 0.1195 0.17542751489190817 0.24579232962383887 0.18863994129413297 0.27230532726305207 0.29028203922009171 0.26058935875186412 -8.5% 0.20194161388047369 Stock-based compensation 407 825 20745 290 6675 4609 4632 6110 9171 Warranty charges due to manufacturing quality issue - - - - - - - 7822 - Non-GAAP income from operations $17,889.119500000001 $42,762.175427514892 $,138,335.2457923296 $16,228.188639941294 $43,519.272305327264 $45,953.290282039219 $34,513.260589358753 $7,258.9154224441681 $32,635.201941613879 Non-GAAP operating margin % of revenue 0.12230000000000001 0.17887858911719429 0.28915453625745174 0.19207234077808946 0.32163868030509074 0.32264247649673167 0.30098459016107509 9.2% 0.28087131644175156 Non-GAAP Net Income Net (loss) income $13,520 $40,520 $,131,577 $14,598 $34,888 $64,493 $35,709 $4,664 $17,598 GAAP net income % of revenue 9.2% 0.16950003346496217 0.27502863640544134 0.17277988850619608 0.2578489918997221 0.45281442423136065 0.31141479239885933 5.9% 0.15145621041035529 Stock-based compensation 407 825 20745 290 6675 4609 4632 6110 9171 Warranty charges due to manufacturing quality issue - - - - - - - 7822 - Change in fair value of preferred stock warrant liability 483 2154 3361 -248 - - - - 3609 Reversal of valuation allowance - -11142 - - - - - - - Tax effect of excluded items - -47 -32324 -69 -650 -30109 -8297 -7788 -1496 Non-GAAP net income $14,410 $32,310 $,123,359 $14,571 $40,913 $38,993 $32,044 $10,808 $28,882 Non-GAAP net income % of revenue 9.9% 0.1351566160230239 0.25785097363778503 0.17246032027837943 0.3023783480163188 0.27377533754133698 0.27945267600966278 0.13698699586808283 0.24857133021206279 Non-GAAP Effective Tax Rate GAAP Effective Tax Rate 0.17799999999999999 -1.7999999999999999 -0.14799999999999999 9.7000000000000003 5.7000000000000002 -0.55000000000000004 -0.17898177496038034 -1.798 0.112 Total adjustments to GAAP provision for income taxes -0.89999999999999993 0.26300000000000001 0.25900000000000001 .40000000000000001 .60000000000000001 0.70599999999999996 0.26100000000000001 1.4610000000000001 2 Non-GAAP effective tax rate 0.16899999999999998 0.24500000000000002 0.11100000000000002 0.10100000000000001 6.3 0.157 8.2018225039619669 -0.33699999999999997 0.114 Adjusted EBITDA GAAP Net (loss) income $13,520 $40,520 $,131,577 $14,598 $34,888 $64,493 $35,709 $4,664 $17,598 Depreciation 2662 4576 9168 1666 2716 2632 2877 2964 2154 Interest expense(income), net 390 135 -453 -9 -156 -268 -445 -827 -20 Provision(benefit) for income taxes 2933 -715 -16956 1577 2122 -22874 -5421 -10511 2219 EBITDA $19,505 $44,516 $,123,336 $17,832 $39,570 $43,983 $32,720 $-3,710 $21,951 Stock-based compensation 407 825 20745 290 6675 4609 4632 6110 9171 Change in fair value of preferred stock warrant liability 483 2154 3361 -248 - - - - 3609 Warranty charges due to manufacturing quality issue - - - - - - - 7822 - Adjusted EBITDA $20,395 $47,495 $,147,442 $17,874 $46,245 $48,592 $37,352 $10,222 $34,731
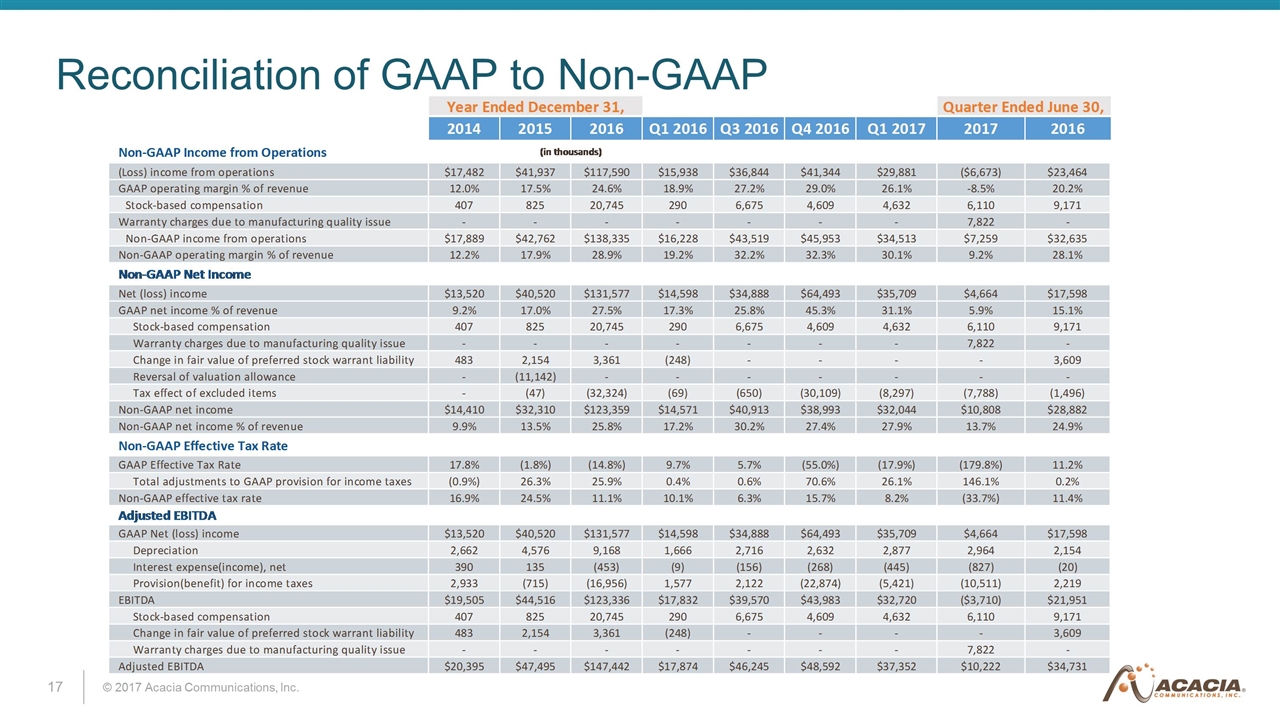
Reconciliation of GAAP to Non-GAAP Quarter Ended June 30, 2014 2015 2016 Q1 2016 Q3 2016 Q4 2016 Q1 2017 2017 2016 Non-GAAP Income from Operations (in thousands) (Loss) income from operations $17,482 $41,937 $,117,590 $15,938 $36,844 $41,344 $29,881 $-6,673 $23,464 GAAP operating margin % of revenue 0.1195 0.17542751489190817 0.24579232962383887 0.18863994129413297 0.27230532726305207 0.29028203922009171 0.26058935875186412 -8.5% 0.20194161388047369 Stock-based compensation 407 825 20745 290 6675 4609 4632 6110 9171 Warranty charges due to manufacturing quality issue - - - - - - - 7822 - Non-GAAP income from operations $17,889.119500000001 $42,762.175427514892 $,138,335.2457923296 $16,228.188639941294 $43,519.272305327264 $45,953.290282039219 $34,513.260589358753 $7,258.9154224441681 $32,635.201941613879 Non-GAAP operating margin % of revenue 0.12230000000000001 0.17887858911719429 0.28915453625745174 0.19207234077808946 0.32163868030509074 0.32264247649673167 0.30098459016107509 9.2% 0.28087131644175156 Non-GAAP Net Income Net (loss) income $13,520 $40,520 $,131,577 $14,598 $34,888 $64,493 $35,709 $4,664 $17,598 GAAP net income % of revenue 9.2% 0.16950003346496217 0.27502863640544134 0.17277988850619608 0.2578489918997221 0.45281442423136065 0.31141479239885933 5.9% 0.15145621041035529 Stock-based compensation 407 825 20745 290 6675 4609 4632 6110 9171 Warranty charges due to manufacturing quality issue - - - - - - - 7822 - Change in fair value of preferred stock warrant liability 483 2154 3361 -248 - - - - 3609 Reversal of valuation allowance - -11142 - - - - - - - Tax effect of excluded items - -47 -32324 -69 -650 -30109 -8297 -7788 -1496 Non-GAAP net income $14,410 $32,310 $,123,359 $14,571 $40,913 $38,993 $32,044 $10,808 $28,882 Non-GAAP net income % of revenue 9.9% 0.1351566160230239 0.25785097363778503 0.17246032027837943 0.3023783480163188 0.27377533754133698 0.27945267600966278 0.13698699586808283 0.24857133021206279 Non-GAAP Effective Tax Rate GAAP Effective Tax Rate 0.17799999999999999 -1.7999999999999999 -0.14799999999999999 9.7000000000000003 5.7000000000000002 -0.55000000000000004 -0.17898177496038034 -1.798 0.112 Total adjustments to GAAP provision for income taxes -0.89999999999999993 0.26300000000000001 0.25900000000000001 .40000000000000001 .60000000000000001 0.70599999999999996 0.26100000000000001 1.4610000000000001 2 Non-GAAP effective tax rate 0.16899999999999998 0.24500000000000002 0.11100000000000002 0.10100000000000001 6.3 0.157 8.2018225039619669 -0.33699999999999997 0.114 Adjusted EBITDA GAAP Net (loss) income $13,520 $40,520 $,131,577 $14,598 $34,888 $64,493 $35,709 $4,664 $17,598 Depreciation 2662 4576 9168 1666 2716 2632 2877 2964 2154 Interest expense(income), net 390 135 -453 -9 -156 -268 -445 -827 -20 Provision(benefit) for income taxes 2933 -715 -16956 1577 2122 -22874 -5421 -10511 2219 EBITDA $19,505 $44,516 $,123,336 $17,832 $39,570 $43,983 $32,720 $-3,710 $21,951 Stock-based compensation 407 825 20745 290 6675 4609 4632 6110 9171 Change in fair value of preferred stock warrant liability 483 2154 3361 -248 - - - - 3609 Warranty charges due to manufacturing quality issue - - - - - - - 7822 - Adjusted EBITDA $20,395 $47,495 $,147,442 $17,874 $46,245 $48,592 $37,352 $10,222 $34,731
