Attached files
| file | filename |
|---|---|
| EX-32.2 - EXHIBIT 32.2 - PAREXEL INTERNATIONAL CORP | exhibit322_2017.htm |
| EX-32.1 - EXHIBIT 32.1 - PAREXEL INTERNATIONAL CORP | exhibit321_2017.htm |
| EX-31.2 - EXHIBIT 31.2 - PAREXEL INTERNATIONAL CORP | exhibit312_2017.htm |
| EX-31.1 - EXHIBIT 31.1 - PAREXEL INTERNATIONAL CORP | exhibit311_2017.htm |
| EX-23.1 - EXHIBIT 23.1 - PAREXEL INTERNATIONAL CORP | exhibit231_eyconsentx2017.htm |
| EX-21.1 - EXHIBIT 21.1 - PAREXEL INTERNATIONAL CORP | exhibit211_listofsubsidiar.htm |
| EX-10.40 - EXHIBIT 10.40 - PAREXEL INTERNATIONAL CORP | prxl-secondamendedcicsever.htm |
| EX-10.39 - EXHIBIT 10.39 - PAREXEL INTERNATIONAL CORP | amendmenttoharfordchangein.htm |
UNITED STATES
SECURITIES AND EXCHANGE COMMISSION
Washington, D.C. 20549
FORM 10-K
ý | ANNUAL REPORT PURSUANT TO SECTION 13 OR 15(d) OF THE SECURITIES EXCHANGE ACT OF 1934 |
For the fiscal year ended June 30, 2017
OR
¨ | TRANSITION REPORT PURSUANT TO SECTION 13 OR 15 (d) OF THE SECURITIES EXCHANGE ACT OF 1934 |
For the transition period from to
Commission File Number: 000-21244
PAREXEL INTERNATIONAL CORPORATION
(Exact name of registrant as specified in its charter)
Massachusetts | 04-2776269 | |
(State or other jurisdiction of incorporation or organization) | (I.R.S. Employer Identification Number) | |
195 West Street, Waltham, Massachusetts | 02451 | |
(Address of principal executive offices) | (Zip Code) | |
Registrant’s telephone number, including area code: (781) 487-9900
Securities Registered Pursuant to Section 12(b) of the Act:
Title of each class: | Name of each exchange on which registered: | |
Common Stock, $.01 par value per share | Nasdaq Global Select Market | |
Securities Registered Pursuant to Section 12(g) of the Act:
None
Indicate by check mark if the registrant is a well-known seasoned issuer, as defined in Rule 405 of the Securities Act. Yes ý No ¨
Indicate by check mark if the registrant is not required to file reports pursuant to Section 13 or Section 15(d) of the Act. Yes ¨ No ý
Indicate by check mark whether the registrant (1) has filed all reports required to be filed by Section 13 or 15(d) of the Securities Exchange Act of 1934 during the preceding 12 months (or for such shorter period that the registrant was required to file such reports), and (2) has been subject to such filing requirements for the past 90 days. Yes ý No ¨
Indicate by check mark whether the registrant has submitted electronically and posted on its corporate Web site, if any, every Interactive Data File required to be submitted and posted pursuant to Rule 405 of Regulation S-T (§232.405 of this chapter) during the preceding 12 months (or for such shorter period that the registrant was required to submit and post such files). Yes ý No ¨
Indicate by check mark if disclosure of delinquent filers pursuant to Item 405 of Regulation S-K is not contained herein, and will not be contained, to the best of registrant’s knowledge, in definitive proxy or information statements incorporated by reference in Part III of this Form 10-K or any amendment to this Form 10-K. ¨
Indicate by check mark whether the registrant is a large accelerated filer, an accelerated filer, a non-accelerated filer, or a smaller reporting company. See definitions of “large accelerated filer,” “accelerated filer” and “smaller reporting company” in Rule 12b-2 of the Exchange Act.
Large Accelerated Filer | ý | Accelerated Filer | ¨ | |||
Non-accelerated Filer | ¨ (Do not check if smaller reporting company) | Smaller Reporting Company | ¨ | |||
Indicate by check mark whether the registrant is a shell company (as defined in Rule 12b-2 of the Exchange Act). Yes ¨ No ý
The aggregate market value of common stock, $0.01 par value per share, held by non-affiliates as of December 31, 2016 was approximately $3.3 billion based on the closing price of the registrant’s Common Stock as reported on the Nasdaq Global Select Market on December 31, 2016, the last business day of the registrant’s most recently completed second fiscal quarter. The registrant has assumed that all holders of 10% or more of its Common Stock, if any, are affiliates solely for purposes of calculating the aggregate market value of Common Stock held by non-affiliates. As of August 25, 2017 there were 51,115,310 shares of common stock, $0.01 par value per share, outstanding.
DOCUMENTS INCORPORATED BY REFERENCE
Portions of the registrant’s definitive proxy statement, which will be issued in connection with the 2017 Annual Meeting of Stockholders, are incorporated by reference in Part III of this Annual Report on Form 10-K.
1
INDEX
i
PART I
ITEM 1. BUSINESS
GENERAL
PAREXEL International Corporation (“PAREXEL,” “the Company,” or “we”) is a leading biopharmaceutical outsourcing services company, providing a broad range of expertise in clinical research, clinical logistics, medical communications, consulting, commercialization and advanced technology products and services to the worldwide pharmaceutical, biotechnology, and medical device industries. Our primary objective is to provide quality solutions for managing the biopharmaceutical product lifecycle with the goal of reducing the time, risk, and cost associated with the development and commercialization of new therapies. Since our incorporation in 1983, we have developed significant expertise in processes and technologies supporting this strategy. Our product and service offerings include: clinical trials management, observational studies and patient/disease registries, data management, biostatistical analysis, epidemiology, health economics/outcomes research, pharmacovigilance, medical communications, clinical pharmacology, patient recruitment, clinical supply and drug logistics, post-marketing surveillance, regulatory and product development and commercialization consulting, health policy and reimbursement and market access consulting, medical imaging services, regulatory information management (“RIM”) solutions, ClinPhone randomization and trial supply management services (“RTSM”), electronic data capture systems (“EDC”), clinical trial management systems (“CTMS”), web-based portals, systems integration, patient diary applications, and other product development tools and services. We believe that our comprehensive services, depth of therapeutic area expertise, global footprint and related access to patients, and sophisticated information technology, along with our experience in global drug development and product launch services, represent key competitive strengths.
On June 19, 2017, PAREXEL entered into an Agreement and Plan of Merger pursuant to which West Street Merger Sub, Inc., a Massachusetts corporation and a wholly-owned subsidiary of West Street Parent, LLC, a Delaware limited liability company (which we refer to as Parent) and affiliate of Pamplona Capital Management, LLP, will be merged with and into us, with PAREXEL surviving as a subsidiary of West Street Parent, LLC, which we refer to as the merger will acquire all of the outstanding shares of PAREXEL for $88.10 per share in cash in a transaction valued at approximately $5.5 billion, including PAREXEL’s net debt. Consummation of the merger is subject to various customary conditions, including adoption of the merger agreement by the Company’s stockholders and receipt of required regulatory approvals, the closing is expected to be completed late in the third or early in the fourth quarter of calendar year 2017.
Immediately prior to, and contingent upon, the closing of the merger, each outstanding Company stock option, restricted stock unit, restricted share and performance restricted stock unit (collectively, the “Company Equity Awards”) will vest in full (in the case of performance restricted stock units, at target level regardless of the actual achievement of the applicable performance metric). Such fully vested Company Equity Awards will be canceled and converted into the right to receive an amount in cash equal to $88.10 per share for each share of our common stock underlying such Company Equity Awards (net of any applicable exercise price and subject to any applicable withholding taxes).
On August 15, 2017, the Company announced a special meeting of the shareholders of PAREXEL to be held on September 15, 2017. At the shareholder meeting, shareholders will be asked to consider and vote on a proposal to approve the Agreement and Plan of Merger, dated as of June 19, 2017, by and among PAREXEL, West Street Parent, LLC (“Parent”) and West Street Merger Sub, Inc. (“Merger Sub, providing for the acquisition of the Company by an affiliate of the private equity investment firm Pamplona. Subject to the terms and conditions of the Merger Agreement, the acquisition will occur by means of a merger of Merger Sub, a wholly-owned subsidiary of Parent, with and into the Company, with the Company surviving the merger as a wholly-owned subsidiary of Parent in accordance with the Massachusetts Business Corporation Act (the “MBCA”).
In connection with the consummation of the Merger, West Street Merger Sub, Inc expects to finance the transaction by borrowing of $2.065 billion under a new senior secured term loan facility and the entry into a new $300 million senior secured revolving credit facility, issue $770 million of notes and contribute approximately $2.633 billion of common equity
Our services complement the research and development (“R&D”) and marketing functions of pharmaceutical, biotechnology, diagnostics, and medical device companies. Through our clinical research and product launch and commercialization services, we seek to help clients maximize the return on their significant investments in research and development by reducing the time, risk, and cost of clinical development and launch of new therapies. For large pharmaceutical and biotechnology companies, outsourcing these services to us provides those companies with a high-quality, variable cost alternative to the fixed costs associated with internal drug development. In addition, these large companies can benefit from our technical resource pool, broad therapeutic area expertise, other advisory services, and global infrastructure, all of which are designed to expedite parallel, multi-country clinical trials and accelerate time-to-market. For smaller bio-pharma companies, we provide access to expertise and a virtual and global network that enables these companies to develop their new products. Our vision is to strive to be the premier provider to the biopharmaceutical and medical device industries for the development and commercialization of new medical therapies worldwide. Our goal is to provide significant benefits to sponsor clients through this strategy, namely, a faster and less expensive development and launch process, as well as a clinical development strategy and expertise that support the marketing strategy for new medical products. We believe that the outsourcing of these services has increased in the past and should continue to increase
1
in the future because of several factors, which are placing increased pressure on clients. These factors include the need to more tightly manage costs, capacity limitations, expirations of drug patent exclusivity periods, the desire to speed up patient recruitment and reduce development time, increased globalization of clinical trials, productivity issues, more stringent government regulations, and pricing pressure. With increased levels of investment continuing to be required, we believe these trends will continue to create opportunities for companies like us that are focused on improving the efficiency of the bio-pharma product development and commercialization processes. Moreover, many of our clients are reassessing how they conduct their R&D activities and are now engaging in outsourcing at a more strategic level. One consequence of this reassessment is higher concentrations of their outsourced clinical development activities with a smaller number of providers. We have been successful in winning many strategic partnerships. We believe that our broad range of offerings, our global presence, our information technology solutions, and our expertise in clinical drug development position us well to continue to participate in these strategic partnerships.
We are one of the largest biopharmaceutical services companies in the world, based upon annual service revenue. Headquartered near Boston, Massachusetts, we have offices in 85 locations and have approximately 18,900 employees throughout 52 countries around the world. We conduct business in healthcare markets around the world, including the United States (“U.S.”), Argentina, Australia, Austria, Belarus, Belgium, Bosnia, Brazil, Canada, Chile, China, Colombia, Croatia, Czech Republic, Denmark, Estonia, Finland, France, Georgia, Germany, Hungary, India, Indonesia, Ireland, Israel, Italy, Japan, Korea, Latvia, Lithuania, Malaysia, Mexico, the Netherlands, Norway, Peru, the Philippines, Poland, Romania, Russia, Serbia, Singapore, Slovakia, South Africa, Spain, Sweden, Switzerland, Taiwan, Thailand, Turkey, Ukraine, the United Kingdom (“U.K.”), and Vietnam. During our fiscal year ended June 30, 2017 (“Fiscal Year 2017”), we derived 44% of our service revenue from our U.S. operations and 56% from our non-U.S. operations. Breakdowns of service revenue by geographic region for previous years can be found in Note 16 to the consolidated financial statements included in Item 8 of this annual report.
We were incorporated in 1983 as a regulatory affairs consulting firm and are a Massachusetts corporation. Josef H. von Rickenbach, our Chairman of the Board and Chief Executive Officer, was a co-founder. Since our inception, we have executed a focused growth strategy embracing internal expansion as well as strategic acquisitions to expand or enhance our portfolio of services, geographic presence, therapeutic area knowledge, information technology capabilities, and client relationships.
We have completed six acquisitions over the past three fiscal years which included the acquisitions of The Medical Affairs Company, LLC ("TMAC") in March 2017, ExecuPharm, Inc. ("ExecuPharm"), in October 2016, Health Advances LLC (“Health Advances”) in February 2016, Quantum Solutions India (“QSI”) in April 2015, ClinIntel Limited (“ClinIntel”) in October 2014, and ATLAS Medical Services (“ATLAS”) in July 2014.
• | TMAC is a leading provider of outsourced medical affairs services to the pharmaceutical, biotechnology, and medical device industries. TMAC is part of our Clinical Research Services ("CRS") business segment. |
• | ExecuPharm is a leading functional service provider that provides clinical monitoring or study management, along with associated operational activities such as onboarding, training, line management, performance management and policy administration. ExecuPharm is included in our CRS business segment. |
• | Health Advances is an independent life sciences strategic consulting firm that combines clinical, scientific and business expertise to provide strategic advice to executives leading life sciences companies and to investors. Health Advances is part of the PAREXEL Consulting Services (“PC”) segment. |
• | QSI is a leader in providing outsourced safety management solutions, or pharmacovigilance, and has been integrated into our PAREXEL Access business unit, which is a part of CRS business segment. Our acquisition of QSI strengthens and creates greater scale in our pharmacovigilance capabilities, enabling us to provide a more comprehensive, efficient, and economical solution to clients around the world. |
• | ClinIntel, a provider of clinical randomization and trial supply management (“RTSM”) services, which are designed to make patient randomization and clinical supply chain solutions more efficient, has been combined into our ClinPhone® RTSM suite. ClinIntel's capabilities include advanced RTSM technologies for planning, forecasting and managing supply chain logistics. ClinIntel has been integrated into our PAREXEL Informatics ("PI") business segment. |
• | Our acquisition of ATLAS, a clinical research service provider in Turkey, the Middle East and North Africa, strengthens our presence in these geographic regions. |
DESCRIPTION OF BUSINESS
We provide broad expertise in clinical research, medical communications, consulting, commercialization and advanced technology services to the worldwide pharmaceutical, biotechnology, and medical device industries. We have three reporting segments: CRS, PC, and PI.
2
CRS constitutes our core business and includes all phases of clinical research from Early Phase (encompassing the early stages of clinical testing that range from first-in-man through proof-of-concept studies) to Phase II-III and Phase IV, which we include in our PAREXEL Access product offering. Our services include clinical trials management and biostatistics, data management and clinical pharmacology, as well as related medical advisory, patient recruitment, pharmacovigilance, and investigator site services. CRS also includes our clinical supply and drug logistics business. We have aggregated Early Phase and PAREXEL Access with Phase II-III for the purposes of segment reporting due to economic similarities in these operating segments.
PC provides technical expertise and advice in such areas as drug development, regulatory affairs, product pricing and reimbursement, commercialization, and strategic compliance. It also provides a full spectrum of market development, product development, and targeted communications services in support of product launch. Our PC consultants identify alternatives and propose solutions to address client issues associated with product development, registration, and commercialization.
PI provides information technology solutions designed to help improve clients’ product development and regulatory submission processes. PI offers a portfolio of products and services that includes medical imaging services, ClinPhone® RTSM, IMPACT® CTMS, DataLabs® EDC, web-based portals, systems integration, electronic clinical outcome assessments (“eCOA”). and LIQUENT InSight® RIM platform. These services are often bundled together and integrated with other applications to provide an eClinical solution for our clients. In addition, PI's portfolio of services is increasingly being embedded with that of CRS to provide our clients with a more integrated service offering.
The revenue generated by each of our business segments for each of the last three fiscal years is described below under the heading for each segment. The gross profit of each segment for each of the last three fiscal years is described in Note 17 to the consolidated financial statements included in Item 8 of this annual report. We have a global infrastructure supporting our business segments and, therefore, assets are not identified by reportable segment.
CLINICAL RESEARCH SERVICES (CRS)
Our CRS business segment generated service revenue of $1,626.6 million, or 76.8% of our consolidated service revenue in Fiscal Year 2017, service revenue of $1,626.0 million, or 77.6% of our consolidated service revenue in our fiscal year ended June 30, 2016 (“Fiscal Year 2016”), and service revenue of $1,599.1 million, or 79.4% of our consolidated service revenue in our fiscal year ended June 30, 2015 (“Fiscal Year 2015”).
CRS offers complete services for the design, initiation, and management of clinical trial programs, a critical element in obtaining regulatory approval for biopharmaceutical products. We have performed services in connection with clinical trials in most therapeutic areas, including Oncology, Cardiology, Infectious Diseases, Neurology, Allergy/Immunology, Endocrinology/Metabolism, Gastroenterology, Obstetrics/Gynecology, Orthopedics, Pediatrics, Psychiatry, Pulmonology, Rheumatology, Dermatology, Genitourinary, Ophthalmology, and Transplantation. Our multi-disciplinary clinical trials group examines a product’s existing preclinical and clinical data to design clinical trials to provide evidence of the product’s safety and efficacy.
CRS can manage many aspects of clinical trials including project management, study protocol design, Case Report Form (“CRF”) design, site and investigator recruitment, patient enrollment, study monitoring and data collection, data management, biostatistics and programming, report writing, medical services, and clinical logistics.
Clinical trials and observational studies are monitored and conducted by CRS in adherence with Good Clinical Practice (“GCP”) and Good Pharmacoepidemiological Practice (“GPP”), respectively. The design of efficient CRFs, detailed operations manuals, and site monitoring by our clinical research associates is undertaken to ensure that clinical investigators and their staff follow established study protocols. We have adopted standard operating procedures (“SOPs”) that are intended to satisfy regulatory requirements and serve as a tool for controlling and enhancing the quality of our worldwide clinical services.
Clinical trials represent one of the most expensive and time-consuming parts of the overall biopharmaceutical product development process. The information generated during these trials is critical to gaining marketing approval from the United States Food and Drug Administration (the “FDA”), the European Medicines Agency (the “EMA”), the Committee for Medicinal Products for Human Use (the “CHMP”), and other comparable regulatory agencies around the world. The data may also be used to gain market acceptance by clinicians, patients, and third-party payers. CRS clinical trial management services involve many phases of clinical trials, including Phases I, II, III, and IV. See “Government Regulations” below for additional information regarding processes involved in clinical trials.
Early Phase – The Early Phase business unit of CRS encompasses the early stages of clinical testing, when a product is first evaluated in humans to assess the potential safety and efficacy of the product. These tests vary from “first-in-man” to “dose-ranging” to “proof of concept” studies in Phases I and IIa of development. The Early Phase business unit of CRS offers clients a one-stop service where studies are performed in healthy volunteers as well as in patients from various disease populations. The support services include project and program management, drug development consulting, medical writing, handling of investigational products, data management, and biostatistical and bioanalytical services. Our international network of Clinical Pharmacology Units are located in Berlin, Germany; Baltimore, Maryland (U.S.); Glendale, California (U.S.); Bloemfontein,
3
South Africa; and Harrow, U.K. Our network also includes a bioanalytical laboratory in Bloemfontein, which performs drug analyses in accordance with Good Laboratory Practices (“GLP”), a system of managed controls for laboratory and research organizations to ensure the consistency and reliability of results. With these locations, the Early Phase business unit offers clinical pharmacology services (including bioanalytical services) on three continents. In addition to the PAREXEL Clinical Pharmacology Units, our Early Product Development (EPD) service is mainly focused on proof-of-concept studies conducted at sites around the globe.
Phase II-III – The Phase II-III business unit of CRS encompasses the later stages of clinical testing. CRS assists clients with one or more of the aspects of clinical trials and observational studies described below. CRS performs both full-service and single- or multi-service projects. We support our clients on a full service and functional basis. As a result, our involvement may range from participating in just one aspect of a clinical trial or observational study to participating in all aspects. These services include the following, the majority of which are also provided by our Early Phase business unit:
• | Study Protocol Design – The protocol defines, among other things, the medical issues a study seeks to examine and the statistical tests that will be conducted. Accordingly, the protocol specifies the frequency and type of laboratory and clinical measures that are to be tracked and analyzed, the number of patients required to produce a statistically valid result, the period of time over which such patients must be tracked and the frequency and dosage of drug administration. |
• | CRF Design – Once the study protocol has been finalized, a paper or electronic CRF must be developed. The CRF is the critical document for collecting the necessary clinical data as dictated by the study protocol. It may change at different stages of a trial. |
• | Site and Investigator Recruitment – The product under investigation is administered to patients usually by third-party physicians, serving as independent contractors (referred to as investigators) at hospitals, clinics, or other locations, referred to as clinical sites. Medical devices are implemented or tested by investigators in similar settings. Potential investigators may be identified and solicited by the product sponsor. A significant portion of a trial’s success depends on the identification and recruitment of experienced investigators with an adequate base of patients who satisfy the requirements of the study protocol. We have access to thousands of investigators who have conducted clinical trials for us. We provide additional services at the clinical site to assist physicians and expedite the clinical research process. |
• | Patient Enrollment – The investigators, usually with our assistance, find and enroll patients suitable for the study. The speed with which trials can be completed is significantly affected by the rate at which patients are enrolled. Prospective patients are required to review information about the clinical trial and the investigational product and its possible side effects, and they sign an informed consent form to record their knowledge and acceptance of potential side effects. Patients also undergo a medical examination to determine whether they meet the requirements of the study protocol. Patients then receive the product under investigation or a control (for example, a placebo) and are examined by the investigator as specified by the study protocol. Investigators are responsible for administering the products to patients, as well as examining patients and conducting necessary tests. |
• | Study Monitoring and Data Collection – As patients are examined and tests are conducted in accordance with the study protocol and applicable regulatory requirements, data are recorded on CRFs, either electronically or paper-based. CRFs are transmitted electronically from study sites or collected by specially trained persons known as clinical monitors. To ensure that the CRFs are completed correctly and the study has been conducted in compliance with the protocol and regulatory requirements, we manage the sites closely over the telephone/internet and through monitoring visits as needed. We offer several EDC technologies, which significantly enhance both the quality and timeliness of clinical data capture and collection while achieving significant efficiency savings. Our study monitoring and data collection services are designed to comply with the adverse events reporting guidelines and related regulatory requirements of the FDA and other relevant regulatory agencies. |
• | Data Management – Our data management professionals provide a broad array of services to support the accurate collection, organization, validation, and analysis of clinical data. For instance, they assist in the design of CRFs and investigator training manuals to ensure that data are collected in an organized and consistent format in compliance with the study protocol and applicable regulatory requirements. Databases are designed according to the analytical specifications of the project and the particular needs of the client. The use of EDC technologies to gather and report clinical data and the use of scanning and imaging of the CRFs expedites data exchange while minimizing data collection errors by permitting the verification of data integrity in a more timely manner. After the data is entered, the data management team performs an array of services, including data abstraction, data review, medical coding, serious adverse event reconciliations, loading of electronic data (such as laboratory data), database verification, and editing and resolution of data problems. The data is then submitted in a format prescribed by the client. Our CRS business segment has extensive experience throughout the world in the creation of scientific databases for all phases of the drug development process, including the creation of customized databases to meet client-specific formats, integrated databases to support New Drug |
4
Application (“NDA”) and equivalent submissions and databases created and maintained in compliance with FDA, European, Asian, and other regulatory specifications and requirements.
• | Biostatistics and Programming – Our biostatistics professionals assist clients with all phases of drug development, including biostatistical consulting, database design, data analysis, and statistical reporting. These professionals develop and review protocols, design appropriate analysis plans, and design report formats to address the objectives of the study protocol as well as the client’s individual objectives. Working with programming staff, biostatisticians/epidemiologists perform appropriate analysis and produce tables, graphs, listings, and other applicable displays of results according to an analysis plan. Our biostatisticians/epidemiologists may also represent clients during panel hearings at the FDA and other regulatory agencies. |
• | Report Writing – A description of the study conducted and the statistical analysis of data collected during the trial and other clinical data are presented and summarized in a final report generated for inclusion in a regulatory document. |
• | Medical Services – Throughout the course of a development program, our physicians provide a wide range of medical research and consulting services to improve the efficiency and quality of clinical research, including medical supervision of clinical trials, medical monitoring of patient safety, review and reporting of adverse events, medical writing, and strategy and product development. Our medical services professionals also provide lifecycle drug safety services combining operational pharmacovigilance and pharmacovigilance consulting. Operational pharmacovigilance capabilities and pharmacovigilance consulting cover all phases of clinical development and drug safety for marketed products. |
• | Project Management – Throughout the entire spectrum of activities described above, our CRS segment provides project management services. These services entail providing overall leadership to our project team, acting as the main client liaison, project planning, managing progress against study goals and deliverables, budget management, progress and metrics reporting, and issue resolution. These project management services are offered on all types of studies – single-service, multi-service, or full-service. |
PAREXEL Access – The PAREXEL Access business unit of CRS encompasses many services listed within the Phase II-III business unit description. However, the PAREXEL Access business unit also offers a range of additional capabilities to support lifecycle management activities:
• | Observational Research – Observational research encompasses several study designs in which groups of patients are observed within routine clinical practice. We help our clients define the needs of their target audience(s) and to develop the best study design to meet their research objectives; define the optimal regulatory authority and ethics committee submission strategies in each country or region; and implement a study management and resourcing model created to collect the required data in the most efficient manner and to agreed-upon standards of quality. |
• | Pragmatic Studies - Interventional studies that utilize many of the approaches developed for observational research. |
• | Patient-Reported Outcomes – Patient reported outcome measures are developed to evaluate the impact of disease and interventions on emotional, social and physical functioning from the patient's perspective. We help our clients by advising them on the multiple variations of available tools and their appropriateness, acceptability, interpretability, precision, reliability, validity and responsiveness. |
• | Pharmacovigilance - Our patient safety services have been specifically designed to comprehensively assist biopharmaceutical companies in meeting increasing pharmacovigilance obligations. We have established global infrastructure in drug safety management, extensive safety consulting expertise, standalone drug safety processing and leading capabilities in post-marketing authorization safety studies. |
• | Managed Access Programs - We have the global infrastructure, multi-disciplinary expertise, and integrated technologies to help clients design, implement, and support managed access programs that help patients access new medical technologies prior to formal marketing authority via a range of regulatory pathways. |
• | Medical Communications Services (“MedCom”) – Our MedCom group assists biopharmaceutical clients in their efforts to achieve optimal market penetration for their products worldwide through expert medical communications and publications services. MedCom utilizes its expertise in strategic consultancy, market and competitive landscaping, publications planning, scientific writing, managed markets, and regulatory compliance to provide effective and compliant scientific communications to a diverse audience of provider, payer, and patient advocacy group stakeholders. An integrated communications plan can detail external and internal strategies, including communications objectives, target audiences, communications priorities and timing, key messages, key meetings and events, and target publications and media. MedCom supports marketing communication objectives across a broad spectrum of media from publications through interactive technologies. Other services include planning of meetings and exhibits in premier scientific conferences and symposia. |
5
• | Commercialization Consulting Services – Our Commercialization Consulting Services (formerly HERON) group provides commercialization strategies and deliverables that assist clients in understanding how changing marketplace dynamics may impact product development, product reimbursement, patient access and commercial success. We identify, gather, analyze, and communicate data that is critical to maximizing product value and commercial success. Our service lines include strategic market access planning, systematic reviews for evidence development, economic modeling and evaluation, pricing, reimbursement strategies, global value dossier writing, and engagement with health technology assessment authorities. Our acquisition of HERON has strengthened our ability to offer our clients a full spectrum of services that aid in developing products through reimbursement and market access strategies. We help our clients better prepare their products for the market, better prepare the market for their products and demonstrate product value in the marketplace. |
• | Medical Science Liaisons - PAREXEL, via the acquisition of The Medical Affairs Company (TMAC), is a leading provider of contract Medical Science Liaison services and related staffing solutions. In addition, PAREXEL provides Medical Affairs strategy expertise and related ancillary activities including Medical Information Call Center services. |
Clinical Trial Supplies & Logistics (“CTSL”) - The CTSL business unit of CRS encompasses a full range of end-to-end clinical trial supplies and laboratory logistics services associated with clinical trials. This unit was specifically formed to help sponsors mitigate the risks associated with global supply chains for clinical studies. Our experts address the logistical challenges of complying with the rules and regulations required by different countries in the handling and shipment conditions of Investigational Medicinal Products (IMPs), medical devices, point-of-care devices, bedside diagnostics and the purchasing and distribution of other study specific documents and equipment. PAREXEL ensures that the right supplies are in the right places at the right time to avoid costly trial delays and risks to patients.
PAREXEL manages clients' global supply chain of clinical trial materials end-to-end. These services extend from demand forecasting, sourcing, secondary packaging, and labeling to global storage and distribution through management of inventory and depots, and import/export management including customs clearance all the way to return and destruction management. Additional services also include ancillary printing, storage and distribution of paper documents, lab kit production, lab sample logistics as well as return management and destruction of unused clinical trial materials.
PAREXEL CONSULTING SERVICES (PC)
Service revenue from the PC business segment represented $210.3 million, or 9.9% of consolidated service revenue in Fiscal Year 2017, $190.4 million, or 9.1% of consolidated service revenue in Fiscal Year 2016, and $152.2 million, or 7.5% of consolidated service revenue in Fiscal Year 2015.
We conduct our PC operations through three groups:
• | Integrated Product Development (“IPD”) Consulting – Our IPD consulting group provides comprehensive product development and regulatory consulting services for pharmaceutical, biotechnology, and medical device companies around the world. These services include drug and device development and regulatory strategy design; scientific and technical evaluation; writing and review services; expert liaison with the FDA, EMA, and PMDA; and the preparation, review, and submission of regulatory applications (both for clinical trials and for marketing authorizations) to regulatory authorities in more than 75 countries. Our IPD consulting group works closely with clients to design product development and regulatory strategies and comprehensive registration programs. Our product development and regulatory experts include individuals who have joined us from the biopharmaceutical industry and from regulatory agencies such as the FDA in the U.S. and agencies in the United Kingdom, Germany, The Netherlands, Sweden, South Korea, and France. Our experts review existing published literature and regulatory precedents, evaluate the client's scientific and technical data for a product (Non-Clinical, Clinical, Chemistry, Manufacturing and Controls (“CMC”); and Regulatory) based on their individual and collective expertise and experience, assess the competitive and regulatory environments in relation to our clients’ specific products and business goals, identify deficiencies in client product documentation (“gap analysis”), and define the steps necessary to obtain regulatory approvals in the most expeditious manner. Through these services, we aim to help our clients obtain regulatory approval for particular products or product lines in markets around the world. |
• | Strategic Compliance Consulting – Our Strategic Compliance Consulting group offers a range of specialized clinical and manufacturing compliance consulting services designed to help pharmaceutical, biotechnology, and medical device companies achieve and maintain regulatory compliance, product quality, and process excellence. These services include clinical and manufacturing compliance strategy, assistance addressing regulatory agency enforcement issues, risk management, GCP, GLP, Good Tissue Practice and current GMP audits, consent decrees, pre-approval inspection readiness, process optimization, organizational alignment, and training. Our Strategic Compliance Consulting group offers its clients experienced regulatory and industry professionals – who formerly worked at the FDA or the quality departments of major biotech, pharmaceutical, and medical device companies. |
6
• | Regulatory Outsourcing Services - Our Regulatory Outsourcing Services group combines enabling technology, operational expertise and global regulatory intelligence to deliver high-quality cost-effective regulatory affairs and regulatory operations solutions as a functional outsourced service. These services include both pre-approval and post-approval activities ranging from compilation, publishing and dispatching of large regulatory dossiers to the authoring of routine product variations and annual reports and other product lifecycle maintenance tasks. These services are used by our clients to provide a flexible outsourcing model that yields predictable year-over-year savings and addresses regulatory complexities, increased workloads, and limited budgets facing the industry. |
PAREXEL INFORMATICS (PI)
Service revenue from our PI business represented $280.7 million, or 13.3% of consolidated service revenue, in Fiscal Year 2017; $277.9 million, or 13.3% of consolidated service revenue, in Fiscal Year 2016, and $264.7 million or 13.1% of consolidated service revenue in Fiscal Year 2015.
We conduct our PI operations through seven groups, within two categories of service, offering patient technology solutions and regulatory and clinical solutions:
Patient Technology Solutions
• | ClinPhone Randomization and Trial Supply Management (“ClinPhone® RTSM”) – PI provides automated randomization and logistics management through its ClinPhone® RTSM solutions. PI services include both Interactive Voice Response (“IVR”) and Interactive Web Response (“IWR”) technologies. The ClinPhone® RTSM solutions are used in clinical trials to achieve treatment group balance, eliminate selection bias, and limit the predictability of treatment allocations, all of which are designed to comply with applicable regulatory requirements. ClinPhone® RTSM allows effective real-time implementation of randomization algorithm modifications required for adaptive trial designs. In addition, supply chain experts use this technology to automate the restocking of sites and depots across the supply chain. We can apply advanced methods to solve difficult supply issues such as managing adaptive trial designs, titration regimens or medication pooling across multiple protocols. |
• | Medical Imaging Services – PI offers products and services that allow our clients to apply and manage medical imaging in clinical trials. Clinical trial sponsors increasingly rely on imaging as a surrogate endpoint in support of efficacy and safety. Our therapeutic and imaging experts provide a range of capabilities in the application of imaging techniques from early clinical development through peri-approval studies. These services include: |
◦ | standardization of imaging and image management at investigative sites |
◦ | image collection at a central location |
◦ | development of independent review charters for review and approval by regulatory authorities |
◦ | employing directly or subcontracting independent reviewers and training these reviewers on the assessment criteria and reviewer roles and responsibilities; and |
◦ | management of the logistical processes involved in the independent review |
• | Clinical Technologies - PI services include the coordination, collection, and centralized assessment of technology endpoints performed in clinical research and post approval observational studies. These services include protocol design, technology selection and support, device management, and data collection. Specific services include: |
• | Electronic clinical outcome assessments (eCOA) using internet and mobile applications |
• | Clinical trial development and support for a wide range of wearables and sensors for collecting data directly from research subjects. |
Regulatory and Clinical Solutions
• | Platform Solutions (“PS”) - PS provides leading solutions consulting and services to integrate systems and processes to help companies simplify the concurrent use of the multiple technologies involved in clinical trials all with the purpose of giving clients better visibility and faster access to their data. We utilize a range of technologies including our Clinical Technology Integration Platform, which is a proprietary environment designed to facilitate seamless two-way exchange of data across different systems via reliable and repeatable integrations, our proprietary user environment which includes sophisticated reporting, analytics and visualizations, and our security technologies to manage user access to systems. PS’ services are delivered by our dedicated experts who have an in-depth understanding of advanced technologies, clinical development processes and validated system integrations. |
7
• | Clinical Trial Management System (“CTMS”) – We offer CTMS solutions to assist biopharmaceutical companies with the complex process of planning and managing clinical trials. Our IMPACT® solution provides pharmaceutical companies and service organizations with flexible options that include hosted or on-premise solutions. |
• | Electronic Data Capture (“EDC”) – DataLabs® EDC is a data management system that unifies the functionality of paper data entry with the flexibility of electronic data capture (EDC). DataLabs® EDC is able to combine data collected on paper with data collected electronically into one easy-to-use electronic clinical data management platform. The collected information feeds into a single database providing clients with fully integrated data. With DataLabs® EDC, users are able to design a study, collect data using either method and then clean and manage that data using a single system. |
• | LIQUENT Regulatory Information Management (“RIM”) –We offer software and professional service solutions designed to support the regulatory business processes of our life science clients. Our product suite, LIQUENT InSight®, is an end-to-end, integrated RIM platform. LIQUENT InSight® provides our clients with regulatory submission planning, publishing, viewing and registration management capabilities necessary to get their products to market and effectively maintain them throughout their lifespan. We also provide a full complement of flexible regulatory affairs consulting and regulatory operational outsourcing services to help our clients meet the demands of a dynamic regulatory landscape. |
INFORMATION TECHNOLOGY
We have invested in information technology designed to help us to provide high quality services, competitive and cost-effective client-facing solutions, and well-managed internal resources. We have built our solutions by developing proprietary technology as well as purchasing and integrating commercially available technology that addresses critical aspects of our business. The proprietary technology we use supports project proposals/budget generation, time information management, revenue and resource forecasting, clinical data entry and management, clinical trial management, project management, quality management, and procurement/expense processing.
We maintain an internal information technology group that is responsible for technological planning, applications development, program management, technical operations, and management of our worldwide computer infrastructure and voice and data networks. Our information systems are designed to support and reinforce all of our policies and procedures while enabling us to respond to the multiple needs of our different clients and regulatory systems. Our systems also enable us to respond quickly to client inquiries regarding progress on projects and, in some cases, to gain direct access to client data on client owned systems.
SALES AND MARKETING
Our sales and marketing personnel carry out our global business development activities. In addition to significant selling experience, most of these individuals have technical and/or scientific backgrounds. Our senior executives and project team leaders also participate in maintaining key client relationships and engaging in business development activities.
Each of our three reporting segments has a business development team that focuses on its particular market segment. In many cases, however, the reporting segment selling teams work together in order to provide clients with the most appropriate service offering to meet their needs. Moreover, we have developed strategic account management teams to provide clients with a single point of contact and to facilitate cross-selling opportunities.
Each business development employee is responsible for a specific client segment or group of clients and for strengthening and expanding an effective relationship with that client. Each individual is responsible for developing his or her client base on our behalf, responding to client requests for information, developing and defending proposals, and making presentations to clients.
Our business development group is supported by our marketing team. Our marketing activities consist primarily of market information development and analysis, strategic planning, competitive analysis, brand management, collateral development, participation in industry conferences, advertising, e-marketing, publications, and website development and maintenance. The marketing team focuses both on supporting the individual business development teams for their specific market segments as well as promoting an integrated marketing strategy and communications plan for PAREXEL as a whole.
CLIENTS
We have derived in the past, and may derive in the future, a significant portion of our service revenue from both an individual client and a core group of clients. Concentrations of business in the biopharmaceutical services industry are common and we expect to continue to experience such concentration in future years due to our increasing number of strategic partnerships. Our five largest clients accounted for 37%, 40% and 44% of our consolidated service revenue in the aggregate for Fiscal Year 2017, Fiscal Year 2016, and Fiscal Year 2015, respectively. For Fiscal Year 2017, Fiscal Year 2016, and Fiscal Year 2015, one client, Pfizer Inc. (“Pfizer”) individually accounted for 12%, 13% and 14% of our consolidated service revenue, respectively.
8
BACKLOG
During Fiscal Year 2017, PAREXEL started reporting backlog based on executed contract awards, in line with emerging practice in our industry. Like other industry leaders, we are moving away from prior industry practice of including pre-contract awards in net new business and backlog. We will continue to track pre-contract written awards internally, as we believe a substantial portion will result in contracts, be added to backlog, and generate revenue. Backlog at June 30, 2017 was approximately $3.97 billion, compared with approximately $4.57 billion at June 30, 2016 calculated on a consistent method, a decrease of 13.1%. Subject to the matters addressed in the following paragraph, we anticipate that approximately $1.6 billion of the backlog will be recognized as revenue in our fiscal year ending June 30, 2018 (“Fiscal Year 2018”).
We believe that our backlog as of any date is not necessarily a meaningful predictor of future results. Projects included in backlog are subject to cancellation, revision, or delay. As detailed more fully in the “Risk Factors” section of this annual report, clients terminate, delay, or change the scope of projects for a variety of reasons including, among others, the failure of products being tested to satisfy safety requirements, unexpected or undesirable clinical results of the product, client decisions to forego a particular study, insufficient patient enrollment or investigator recruitment, or production problems resulting in shortages of the drug. Additionally, our backlog dynamic may be impacted by our strategic partnerships, which generally represent our largest customers. As a result, any delay or cancellation related to these partnerships could significantly impact the conversion of backlog into revenue. Generally, our contracts can be terminated at any time upon thirty to one hundred twenty days' notice by the client.
COMPETITION
We compete with other biopharmaceutical outsourcing services companies and other clinical research organizations (“CROs”) that provide one or more of the services currently being offered by us. Some of the large biopharmaceutical services companies, such as QuintilesIMS, Laboratory Corporation of America, Pharmaceutical Product Development Inc., INC Research/inVentiv Health, PRA Health Sciences, Inc. and Icon plc, offer services that compete directly with our services at many levels.
We believe that the synergies arising from integrating the products and services offered by our different business units, coupled with our global infrastructure (and resulting rapid access to diverse patient populations and markets), technology products and services, and depth of expertise and experience differentiate us from our competitors. Although there are no guarantees that we will continue to do so, we believe that we compete favorably in all of our business areas and segments, as more fully described below.
CRS
The clinical outsourcing services industry is very fragmented, with several hundred providers offering varying levels of service, skills, and capabilities. Our CRS group primarily competes against in-house departments of pharmaceutical companies, other full service biopharmaceutical outsourcing services companies, small specialty CROs, and to a small extent, universities, teaching hospitals, and other site organizations. The primary competitors for our CRS business include QuintilesIMS, Laboratory Corporation of America, Pharmaceutical Product Development Inc., and Icon plc.
CRS generally competes on the basis of:
• | a broad international presence with strategically located facilities and access to end markets; |
• | the ability to organize and manage large-scale clinical trials on a global basis; |
• | the ability to recruit investigators and patients expeditiously; |
• | medical and scientific expertise in a specific therapeutic area; |
• | quality of services; |
• | breadth of services; |
• | the ability to integrate information technology with systems to improve the efficiency of clinical research; |
• | previous experience with a client or a specific therapeutic area; |
• | the ability to manage large and complex medical databases; |
• | the ability to provide statistical and regulatory services; |
• | financial strength and stability; and |
• | price. |
We believe that the key competitive strengths of our CRS business are its global footprint and related rapid access to diverse patient populations, therapeutic expertise, technological expertise, commercialization expertise and its experience in global drug development.
9
PC
Our PC segment competes with a large and diverse group of specialty service providers, including major consulting firms with pharmaceutical industry practices, large and small biopharmaceutical services companies, individual consultants, specialty medical communications services companies, and medical communication subsidiaries of large international advertising companies.
We believe that a key differentiator of our PC service offering is our combination of scientific and regulatory expertise. We consider PC’s key competitive strengths to include a combination of deep global expertise in early and late stage drug development, regulatory strategy and submissions and GMP compliance. We believe that this broad range of capabilities enables us to help our clients achieve their regulatory and marketing objectives.
Our Health Advances business is a strategy consulting group that focuses exclusively on the healthcare industry. Health Advances helps clients realize growth opportunities worldwide for healthcare technologies, products and services. Health Advances consultants partner with senior executives and investors on their highest-stakes strategic decisions. As a result of deep knowledge of the complexities of the healthcare sector, they provide clients with innovative perspectives and actionable insights that help them make more confident strategic business decisions that capitalize on their company’s growth potential.
PI
Our PI business competes primarily with biopharmaceutical services companies, information technology companies, and software companies. Companies in this segment compete based on the strength and usability of their technology offerings, their expertise and experience, and their understanding of the clinical development process. PI’s key competitive strength is its combination of technological expertise and knowledge of clinical development. Additionally, PI’s offerings and CRS services provide substantial synergies to our customers.
INTELLECTUAL PROPERTY
Our trademark “PAREXEL®” is of material importance to us. This and other trademarks have been registered in the United States and many foreign countries. The duration of trademark registrations varies from country to country. However, trademarks generally may be renewed indefinitely as long as they are in use and/or their registrations are properly maintained, and as long as they have not been found to have become generic.
EMPLOYEES
As of June 30, 2017, we had approximately 18,900 full-time equivalent employees. Approximately 26% of our employees are located in the United States and approximately 74% are located internationally. We believe that we have good relationships with our employees.
The success of our business depends upon our ability to attract and retain qualified professional, scientific, and technical staff. The level of competition among employers in the U.S. and overseas for skilled personnel, particularly those with Ph.D., M.D., or equivalent degrees, is high. We believe that our position as one of the recognized leaders in our industry and, in particular, the breadth-and-depth of our expertise are advantages in attracting qualified candidates. In addition, we believe that the wide range of clinical trials in which we participate allows us to offer broad experience to clinical researchers.
GOVERNMENT REGULATIONS
We provide clinical trial services and diverse consulting solutions to the pharmaceutical, biotechnology, and medical device industries worldwide. Lack of success in obtaining approval for the conduct of clinical trials in the countries in which we manage clinical trials on behalf of our clients can adversely affect us. We make no guarantees to our clients with regard to successful outcomes of the regulatory process, including the success of clinical trial applications or marketing authorization applications.
The clinical research services we provided in the U.S. are subject to established and evolving FDA regulations. We are obligated to comply with FDA requirements governing activities such as obtaining Institutional Review Board (“IRB”) approval and patient informed consents, verifying qualifications of investigators, reporting patients’ adverse reactions to products, and maintaining thorough and accurate records. We are also required to ensure that the computer systems we use to process human data from clinical trials are validated in accordance with the FDA’s electronic records regulations, 21 Code of Federal Regulations Part 11, which apply to the pharmaceutical and CRO industries when companies choose to use electronic records in lieu of paper records or electronic signatures in lieu of traditional signatures. We must maintain source documents for each trial for specified periods, and such documents may be reviewed according to GCP or GPP standards by the study sponsors and the FDA and other regulatory agencies (for example the EMA and the Japanese Pharmaceutical and Medical Devices Agency) during audits and inspections. Non-compliance with GCP or GPP can result in the disqualification of data collected during a clinical study and in non-approval or non-clearance of a product application submitted to the FDA or other regulatory agencies around the world.
The clinical investigation of new drugs, biologics, and medical devices is highly regulated by government agencies around the world. The standard for the conduct of clinical research and development studies is embodied in GCP, a set of international standards and guidelines, which stipulate procedures designed to ensure the quality and integrity of data obtained from clinical testing, and
10
to protect the rights and safety of clinical trial participants. The FDA and many other regulatory authorities require that study results submitted to such authorities be based on studies conducted in compliance with GCP. The European Union (“EU”) enacted the Clinical Trials Directive (the “Directive”) in 2004 in attempt to harmonize the requirements of the members of the EU regarding the conduct of clinical trials. The EU released in April 2014 a new legislation to repeal the Directive in a stepwise approach between mid-2016 and 2019 to increase the attractiveness for the conduct of clinical trials in its territory by reducing the bureaucratic burden. The regulation will not require adoption by each member country thus ensuring greater harmonization. The Directive requires sponsors of clinical trials to submit formal applications to national ethics committees and regulatory authorities prior to the initiation of clinical trials in any of the 28 Member States of the EU, and the new legislation will require submission through a portal at the EMA. The regulatory landscape in Asia and Latin America is heterogeneous, with each country independently enforcing its unique regulatory policies. This has improved with more cooperation between countries and a deeper awareness of regional and global differences in regulatory policies and practice, especially in Asia. As in the United States, clinical trials in the EU are expected to be carried out in compliance with detailed requirements for GCP. The revised ICH GCP E6 R2 guideline, strengthening especially risk management and oversight, is being implemented progressively (came into effect in June 2017 in the European Union). PAREXEL maintains an agile Quality Management System that anticipated the changes that would be required by the revised guideline and preemptively adjusted. As a result minimal changes to existing processes were required. The international regulatory approval process, in the EU as well as many other countries, includes all of the risks and potential delays associated with the FDA approval process.
Because the FDA’s regulatory requirements have served as the model for much of the regulation of new drug development worldwide, regulatory requirements similar to those of the FDA exist in the other countries in which we operate. Our regulatory capabilities include knowledge of the specific regulatory requirements of numerous countries. For more than ten years, we have managed successful regulatory submissions for life science companies around the world. Beginning in 1990, the FDA and corresponding regulatory agencies of the EU and Japan commenced discussions to develop harmonized standards for preclinical and clinical studies and the format and content of applications for new drug approvals through a process known as the International Conference on Harmonisation (“ICH”) of Technical Requirements for Registration of Pharmaceuticals for Human Use. Data from multinational studies adhering to GCP are now generally acceptable to the FDA and regulators in Australia, Canada, the EU, Japan and Latin American countries, although there can be no advance assurance that the submission of such data to any regulatory authority will result in regulatory approval for marketing of the product. The ICH process has sanctioned a single common format for drug and biologic marketing authorization applications, known as the Common Technical Document (“CTD”) in the U.S., Europe, Japan and Canada. On July 1, 2003 the CTD format became mandatory in Europe and Japan and highly recommended by the FDA in the United States and by the Canadian regulatory authorities. We have developed the expertise to prepare CTDs for our clients in both paper and electronic form.
REGULATION OF DRUGS AND BIOLOGICS
Before a new drug or biologic may be approved and marketed, the drug or biologic must undergo extensive testing and regulatory review in order to determine that the drug or biologic is safe and effective. It is not possible to estimate the time in which preclinical and Phase I, II and III studies will be completed with respect to a given product, although the time period may last many years. Using the U.S. regulatory environment as an example, the stages of this development process are generally as follows:
Preclinical Research (approximately 1 to 3.5 years) – In vitro (“test tube”) and animal studies must be conducted in accordance with GLP to establish the relative toxicity of the drug or biologic over a wide range of doses and to detect any potential to cause a variety of adverse conditions or diseases, including birth defects or cancer. If results warrant continuing development of the drug or biologic, the results of the studies are submitted to the FDA by the manufacturer as part of an Investigational New Drug Application (“IND”), which must be submitted to the FDA before proposed clinical testing can begin. An IND must include, among other things, preclinical data, CMC information, and an investigational plan, and must become effective before such trials may begin. An IND automatically becomes effective 30 days after receipt by the FDA, unless the FDA, within the 30-day time period, raises concerns or questions relating to one or more proposed clinical trials. In such a case, the IND sponsor and the FDA must resolve any outstanding concerns before the clinical trial can begin. In addition, clinical trials cannot begin at a particular study site until approved by the site's IRB, which is an independent expert body charged with protecting patient safety and privacy. As a result, there can be no assurance that submission of an IND will result in the ability to commence clinical trials.
Clinical Trials (approximately 3.5 to 6 years)
Phase I consists of basic safety and pharmacology testing in approximately 20 to 80 human subjects, usually healthy volunteers or stable patients, and includes studies to evaluate the metabolic and pharmacologic action of the product in humans, how the drug or biologic works, how it is affected by other drugs, how it is tolerated and absorbed, where it goes in the body, how long it remains active, and how it is broken down and eliminated from the body.
Phase II includes basic efficacy (effectiveness) and dose-range testing in a limited patient population (usually 100 to 200 patients) afflicted with a specific disease or condition for which the product is intended for use, further safety testing, evaluation of
11
effectiveness, and determination of optimal dose levels, dose schedules, and routes of administration. If Phase II studies yield satisfactory results and no hold is placed on further studies by the FDA, Phase III studies can commence.
Phase III includes larger scale, multi-center, comparative clinical trials conducted with patients afflicted by a target disease, in order to provide enough data for a valid statistical test of safety and efficacy required by the FDA and others, and to provide an adequate basis for product labeling.
The FDA receives reports on the progress of each phase of clinical testing and may require the modification, suspension, or termination of clinical trials if, among other things, an unreasonable risk is presented to patients or if the design of the trial is insufficient to meet its stated objective. In addition, information about certain clinical trials must be submitted to, and made available to the public on, the government website www.clinicaltrials.gov.
NDA or Biologic License Application (“BLA”) Preparation and Submission – Upon completion of Phase III trials, the sponsor assembles the statistically analyzed data from all phases of development, along with the chemistry and manufacturing and pre-clinical data and the proposed labeling, among other things, into a single large document, the NDA or BLA in CTD format as of July 1, 2003, which today comprises, on average, roughly 100,000 pages. Typically, an NDA or BLA must be accompanied by payment of a statutory fee.
FDA Review of NDA or BLA – The FDA carefully scrutinizes data from all phases of development to confirm that the manufacturer has complied with regulations and that the drug or biologic is safe and effective for the specific use (or “indication”) under study. The FDA may refuse to accept the NDA or BLA for filing and substantive review if certain administrative and content criteria are not satisfied. Even after accepting the submission for review, the FDA may also require additional testing or information before approval of an NDA or BLA. The FDA must deny approval of an NDA or BLA if applicable regulatory requirements are not satisfied.
Post-Marketing Surveillance and Phase IV Studies – Regulatory authorities require companies to collect and periodically report additional safety and, where appropriate, benefit data on the drug or biologic for as long as the manufacturer markets the product. The FDA and other major regulatory agencies require sponsor companies to prepare risk management plans as part of their approval requirements for marketed drugs and biologics, aimed at monitoring areas of drug risk and implementing plans for minimizing their occurrence. In addition, global agencies may impose additional post-marketing study requirements as a condition of a product’s approval to confirm the safety profile or verify clinical benefit in the “real-world” clinical setting or after a product's approval if safety issues are identified. Regulated post marketing surveillance studies are imposed by a number of national agencies for all new products launched into their market and the data used to re-evaluate the continuation of the product license. Product approval may be withdrawn if compliance with regulatory requirements is not maintained or if a significant safety issue is identified that brings into question the clinical benefit relative to the emerging risks.
REGULATION OF MEDICAL DEVICES
Unless a medical device is exempted from pre-market approval or clearance requirements, which are described below, or is eligible for de novo review, FDA approval or clearance of the device is required before the product may be marketed in the United States. In order to obtain pre-market clearance for marketing, a manufacturer must demonstrate substantial equivalence to a similar legally marketed product by submitting a pre-market notification, or 510(k), to the FDA. The FDA may require preclinical and clinical data to support a substantial equivalence determination, and there can be no assurance the FDA will find a device substantially equivalent. Clinical trials can take extended periods of time to complete. In addition, if the FDA requires an approved Investigational Device Exemption (“IDE”) before clinical device trials may commence, there can be no guarantee that the agency will approve the IDE. The IDE approval process could also result in significant delays.
After submission of a pre-market notification containing, among other things, any data collected, the FDA may find the device substantially equivalent and the device may be marketed. After a device receives 510(k) clearance, any modification that could significantly affect its safety or effectiveness, or that would constitute a major change in its intended use, requires a new 510(k) clearance or could require approval of a pre-market approval application (“PMA”). If the FDA finds that a device is not substantially equivalent, the manufacturer may request that the FDA make a risk-based classification to place the device in Class I or Class II. However, if a timely request for risk-based classification is not made, or if the FDA determines that a Class III designation is appropriate, a PMA will be required before the device may be marketed.
If there is no legally marketed predicate device, a manufacturer can seek to have a device classified into Class I or Class II through the de novo review process. As a result of statutory revisions made in 2012, the de novo process can be used without first going through the 510(k) process.
The PMA approval process is lengthy, expensive, and typically requires, among other things, extensive data from preclinical testing and a well-controlled clinical trial or trials that demonstrate a reasonable assurance of safety and effectiveness. There can be no assurance that review will result in timely, or any, PMA approval. There may also be significant conditions associated with the approval, including limitations on labeling and advertising claims and the imposition of post-market testing, tracking, or surveillance requirements. Even after approval, a new PMA or PMA supplement is required in the event of a modification to the device, its
12
labeling or its manufacturing process. Typically, a PMA or 510(k) must be accompanied by payment of a statutory fee. In addition, information about certain clinical trials must be submitted to the government website www.clinicaltrials.gov, where it may be made publicly available.
REGULATION OF PATIENT INFORMATION
The confidentiality, security, use and disclosure of patient-specific information are subject to governmental regulation. Regulations to protect the safety and privacy of human subjects who participate in or whose data are used in clinical research generally require clinical investigators to obtain legally effective informed consent from identifiable research subjects before research is undertaken. Under the Health Insurance Portability and Accountability Act of 1996 (“HIPAA”), as amended by the Health Information Technology for Economics and Clinical Health (“HITECH”) Act of 2009, the U.S. Department of Health and Human Services has issued regulations mandating privacy and data security standards and breach notification requirements for certain types of individually identifiable health information, or protected health information, when used or disclosed by health care providers and other HIPAA-covered entities or business associates that provide services to or perform functions on behalf of these covered entities. HIPAA regulations generally require individuals’ written authorization before identifiable health information may be used for research, in addition to any required informed consent. HIPAA regulations also specify standards for de-identifying health information so that information can be handled outside of the HIPAA requirements and for creating limited data sets that can be used for research purposes under less stringent HIPAA restrictions.
Outside of the United States, many countries have enacted laws to safeguard the privacy and security of personal information, including individually identifiable health information. The member states of the European Union have adopted a rigorous system of data protection regulations, based upon a framework imposed by the 1995 European Commission Directive on Data Protection. These rules provide broad protections for personal information, including, among other things, notice requirements, limits on the scope and duration for which personal information may be maintained and processed, restrictions on disclosures of personal information, standards for providing individuals with control over the manner in which personal information is processed, and restrictions on transfers of such data to the United States and other countries that the European Union finds to lack “adequate” data protection laws of their own. Health-related information is recognized as a special, sensitive category of personal information, which may generally be processed only pursuant to the affirmative, or opt-in, consent of the individual to whom the information pertains. Violations of these data protection regulations are subject to administrative penalties, civil money penalties, and criminal prosecution, including corporate fines and personal liability.
In order to comply with these laws and regulations, we must maintain internal compliance policies and procedures, and we may need to implement new privacy and security measures, which may require us to make substantial expenditures or cause us to limit the products and services we offer. In addition, if we violate applicable laws, regulations, contractual commitments, or other duties relating to the use, privacy or security of health information, we could be subject to civil liability or criminal penalties and it may be necessary to modify our business practices.
REGULATION OF HEALTH INDUSTRY ARRANGEMENTS
Since the United States Medicare program will pay for certain costs of qualifying clinical drug trials, as well as certain reasonable and necessary items and services used to diagnose and treat complications arising from participation in clinical trials, the conduct of such trials may be subject to laws and regulations that are intended to prevent misuse of such government health care program funding. In the U.S., these laws include, among others, the False Claims Act, which prohibits submitting or causing the submission of false statements or improper claims for government health care program payments; the so-called Stark physician self-referral law, which prohibits physicians from referring or billing for certain designated health services performed or provided by an entity from which the physician or an immediate family member receives financial compensation, or in which the physician or an immediate family member has a financial compensation, investment, or ownership interest; and the health care anti-kickback law, which prohibits paying, offering to pay, or receiving payment in exchange for the referral of services or devices that are covered under a federal health care program, and which therefore restrict the permissibility of financial and promotional arrangements with patients, physicians, investigators, and study sites, such as, for example, financial incentives for physicians to enroll study participants or for patients, investigators or study sites to participate in a trial. Violations of these restrictions are subject to potentially severe administrative, civil and criminal penalties that could have a substantial and material adverse effect on our business, our reputation, and our continued ability to offer our biopharmaceutical outsourcing services.
POTENTIAL LIABILITIES AND INSURANCE
Our clinical research services focus on the testing of experimental drugs and devices on human volunteers pursuant to study protocols and in accordance with laws and regulations which govern clinical trials. Clinical research involves a risk of liability for personal injury or death to patients due to, among other reasons, possible unforeseen adverse side effects or improper administration of the new drug or medical device. We do not generally provide health care services directly to patients. Rather, our physicians or third party physician investigators are responsible for administering drugs and evaluating the study patients. Many of the patients enrolled in clinical trials are already seriously ill and are at risk of further illness or death.
13
We believe that the risk of liability to patients in clinical trials is mitigated by various regulatory requirements, including the role of IRBs, the need to obtain each patient’s informed consent, and the oversight by applicable regulatory authorities. The FDA, the Medicines and Healthcare products Regulatory Agency in the United Kingdom, and regulatory authorities in other countries require each human clinical trial to be reviewed and approved by the IRB at each study site. An IRB is an independent ethics committee that includes both medical and non-medical personnel and is obligated to protect the interests of patients enrolled in the trial. The IRB approves and monitors the protocol and the measures designed to protect patients, such as the requirement to obtain informed consents.
To reduce our potential liability, we generally seek to incorporate indemnity provisions into our contracts with clients to protect us from liability for adverse reactions to the study drug as well as any negligent acts by the study sponsor and/or third party physician investigators. These indemnity provisions do not, however, protect us against certain of our own actions, such as those involving negligence. Moreover, these indemnities are contractual arrangements that are subject to negotiation with individual clients, and the terms and scope of such indemnities can vary from client to client and from study to study. Finally, the financial performance of these indemnities is not secured; therefore we bear the risk that an indemnifying party may not have the financial ability to fulfill its indemnification obligations. We could be materially and adversely affected if we were required to pay damages or incur defense costs in connection with an uninsured claim that is outside the scope of an indemnity or where an indemnification obligation, although applicable, is not performed in accordance with its terms.
We currently maintain a portfolio of insurance coverage, including a professional liability insurance policy, subject to deductibles and coverage limits. There can be no assurance that this insurance coverage will be adequate, or that insurance coverage will continue to be available on terms acceptable to us.
AVAILABLE INFORMATION
Our Internet website is http://www.parexel.com. We make available through this website our annual reports on Form 10-K, quarterly reports on Form 10-Q, current reports on Form 8-K and amendments to those reports filed pursuant to Sections 13(a) and 15(d) of the Securities Exchange Act of 1934 (the “Exchange Act”). We make these reports available free of charge through our website as soon as reasonably practicable after they have been electronically filed with, or furnished to, the Securities and Exchange Commission (“SEC”). Any materials we file with the SEC may also be read and copied at the SEC’s public reference room located at 100 F Street, N.E. Washington, D.C. 20549. Please call the SEC at 1-800-SEC-0330 for further information on the public reference room. Our SEC filings are also available to the public on the SEC’s website at www.sec.gov.
FORWARD-LOOKING STATEMENTS
This Annual Report on Form 10-K and, in particular, the description of our Business set forth in Part I, Item 1 and our Management’s Discussion and Analysis of Financial Condition and Results of Operations set forth in Part II, Item 7 (“MD&A”) contain or incorporate a number of forward-looking statements within the meaning of Section 27A of the Securities Act of 1933 and Section 21E of the Exchange Act.
Any statements contained in or incorporated by reference into this report that are not statements of historical fact should be considered forward-looking statements. You can identify these forward-looking statements by use of the words “believes,” “expects,” “anticipates,” “plans,” “may,” “will,” “would,” “intends,” “estimates”, and other similar expressions, whether in the negative or affirmative. These forward-looking statements are based on current expectations, estimates, forecasts and projections about the industry and markets in which we operate and management’s beliefs and assumptions and should be read in conjunction with our MD&A and our consolidated financial statements and notes to consolidated financial statements. We cannot guarantee that we actually will achieve the plans, intentions or expectations disclosed in the forward-looking statements made. There are a number of important risks and uncertainties that could cause our actual results to differ materially from those indicated by such forward-looking statements. These risks and uncertainties include, without limitation, those set forth in this annual report under the heading “Risk Factors” as well as risks that emerge from time to time that are not possible for us to predict. Forward-looking statements, like all statements in this annual report, speak only as of the date of this annual report (unless another date is indicated). We disclaim any obligation to update publicly any forward-looking statements whether as a result of new information, future events or otherwise.
14
ITEM 1A. RISK FACTORS
In addition to other information in this report, the following risk factors should be considered carefully in evaluating our company and our business. Additional risks not currently known to us or other factors not perceived by us to present significant risk to our business at this time also may impair our business operations.
Risks Associated with the Merger
We may not complete the merger within the time frame we anticipate or at all, which could have an adverse effect on our business, financial results and/or operations.
In June of 2017, we entered into an Agreement and Plan of Merger pursuant to which West Street Merger Sub, Inc., a Massachusetts corporation and a wholly-owned subsidiary of West Street Parent, LLC, a Delaware limited liability company (which we refer to as Parent) and affiliate of Pamplona Capital Management, LLP, will be merged with and into us, with PAREXEL surviving as a subsidiary of West Street Parent, LLC, which we refer to as the merger. Completion of the merger is subject to a number of closing conditions, including obtaining approval of our stockholders and receipt of required regulatory approvals. Each party’s obligation to consummate the merger is also subject to the accuracy of the representations and warranties of the other party (subject to certain qualifications and exceptions) and the performance in all material respects of the other party’s covenants under the merger agreement, including, with respect to us, covenants regarding operation of our business prior to closing. In addition, the merger agreement may be terminated under certain specified circumstances, including, but not limited to, by Parent in connection with a change in the recommendation of our Board of Directors or by us to enter into an agreement for a “Superior Proposal,” as defined in the merger agreement. As a result, we cannot assure you that the merger will be completed, even if our stockholders approve the merger, or that, if completed, it will be exactly on the terms set forth in the merger agreement or within the expected time frame.
If the merger is not completed within the expected time frame or at all, we may be subject to a number of material risks. The price of our common stock may decline to the extent that current market prices reflect a market assumption that the merger will be completed. We could be required to reimburse certain expenses of Parent or pay Parent a termination fee of $138 million if the merger agreement is terminated under specific circumstances described in the merger agreement. The failure to complete the merger may result in negative publicity and negatively affect our relationship with our stockholders, employees and clients. We may also be required to devote significant time and resources to litigation related to any failure to complete the merger or related to any enforcement proceeding commenced against us to perform our obligations under the merger agreement.
The merger agreement provides us with limited remedies in the event of a breach by Parent that results in termination of the merger agreement, including the right to a reverse termination fee payable under certain specified circumstances, as described in the merger agreement. We cannot assure you that a remedy will be available to us in the event of such a breach or that the damages we incur in connection with such breach will not exceed the amount of the reverse termination fee. In addition, Parent requires significant third-party debt financing to complete the merger and in the event that the Parent’s lenders do not provide such debt financing, we may only be entitled to receive the reverse termination fee as provided under the merger agreement.
The announcement and pendency of the merger could adversely affect our business, financial results and/or operations.
Our efforts to complete the merger could cause substantial disruptions in, and create uncertainty surrounding, our business, which may materially adversely affect our results of operation and our business. Uncertainty as to whether the merger will be completed may affect our ability to recruit prospective employees or to retain and motivate existing employees. Employee retention may be particularly challenging while the merger is pending because employees may experience uncertainty about their roles following the merger. A substantial amount of our management’s and employees’ attention is being directed toward the completion of the merger and thus is being diverted from our day-to-day operations. Uncertainty as to our future could adversely affect our business and our relationship with clients and potential clients. For example, clients and other counterparties may defer decisions concerning working with us, or seek to change existing business relationships with us. Changes to or termination of existing business relationships could adversely affect our revenue, earnings and financial condition, as well as the market price of our common stock. The adverse effects of the pendency of the merger could be exacerbated by any delays in completion of the merger or termination of the merger agreement.
While the merger agreement is in effect, we are subject to restrictions on our business activities.
While the merger agreement is in effect, we are subject to restrictions on our business activities, including, among other things, restrictions on our ability to acquire other businesses and assets, dispose of our assets, make investments, enter into certain contracts, repurchase or issue securities, pay dividends, make capital expenditures, take certain actions relating to intellectual property, amend our organizational documents and incur indebtedness. These restrictions could prevent us from pursuing strategic business opportunities, taking actions with respect to our business that we may consider advantageous and responding effectively and/or timely to competitive pressures and industry developments, and may as a result materially adversely affect our business, results of operations and financial condition.
15
In certain instances, the merger agreement requires us to pay a termination fee to Parent, which could affect the decisions of a third party considering making an alternative acquisition proposal.
Under the terms of the merger agreement, we may be required to pay Parent a termination fee of $138 million under specified conditions including in the event we terminate the merger agreement to enter into a “Superior Proposal,” as defined in the merger agreement or in the event Parent terminates the merger agreement following a change in the recommendation of our Board of Directors that our shareholders approve the merger. This payment could affect the structure, pricing and terms proposed by a third party seeking to acquire or merge with us and could discourage a third party from making a competing acquisition proposal, including a proposal that would be more favorable to our stockholders than the merger.
We have incurred, and will continue to incur, direct and indirect costs as a result of the merger.
We have incurred, and will continue to incur, significant costs and expenses, including fees for professional services and other transaction costs, in connection with the merger. We must pay substantially all of these costs and expenses whether or not the merger is completed. There are a number of factors beyond our control that could affect the total amount or the timing of these costs and expenses.
Legal proceedings in connection with the merger, the outcomes of which are uncertain, could delay or prevent the completion of the merger.
Since the announcement of the merger, putative class actions have been filed in the United States District Court for the District of Massachusetts in connection with the proposed merger against us, other parties to the merger, and the members of our Board of Directors. The lawsuits allege that the preliminary that the proxy statement violates Section 14(a) and Section 20(a) of the Securities Exchange Act by materially omitting material information related to Company’s projections and the explanation of the analysis of the Company’s financial advisor, among other claims. Among other remedies, the plaintiffs in these lawsuits seek to enjoin the merger. This and other potential legal proceedings could delay or prevent the merger from becoming effective.
Risks Associated with our Business and Operations
The loss, modification, or delay of large or multiple contracts or a strategic partner may negatively impact our financial performance.
Our clients generally can terminate their contracts with us upon 30 to 120 days' notice or can delay the execution of services. The loss or delay of a large contract or the loss or delay of multiple contracts could adversely affect our operating results, possibly materially. We have in the past experienced large contract cancellations and delays, which have adversely affected our operating results. The loss of a strategic partner could potentially have a material adverse effect on our business and financial statements.
Clients may terminate or delay their contracts for a variety of reasons, including:
• | failure of products being tested to satisfy safety requirements; |
• | failure of products being tested to satisfy efficacy criteria; |
• | products having unexpected or undesired clinical results; |
• | client cost reductions as a result of budgetary limits or changing priorities; |
• | client decisions to forego a particular study, perhaps for economic reasons; |
• | merger or potential merger related activities involving the client; |
• | insufficient patient enrollment in a study; |
• | insufficient investigator recruitment; |
• | clinical drug manufacturing problems resulting in shortages of the product; |
• | product withdrawal following market launch; and |
• | shut down of manufacturing facilities. |
Unfavorable economic and financial market conditions could negatively affect our business, operating results and financial condition.
Our ability to attract and retain clients, invest in and grow our business and meet our financial obligations depends on our operating and financial performance, which, in turn, is subject to numerous factors. In addition to factors specific to our business, prevailing economic conditions and financial, business, political and other factors beyond our control can also affect us. For example, if global economic and market conditions, or economic conditions in the United States, Europe or other key markets remain uncertain or deteriorate, demand for our services could decline, and we may experience material adverse impacts on our business, operating results, and financial condition. In this regard, we are exposed to risks associated with any reduced profitability and the potential
16
financial instability of our clients resulting from disruptions to the demand for health care services and pharmaceuticals and/or in the credit and capital markets. These conditions could cause clients to experience reduced profitability and/or cash flow problems that could lead them to modify, delay, cancel or fail to make payment under contracts with us, including contracts included in our current backlog, which could, in turn, have a negative effect on our business, operating results and financial condition. Our business is also affected by local economic environments, including inflation, recession, financial liquidity and currency volatility or devaluation. Political changes, some of which may be disruptive, could interfere with our clients and our activities in a particular location. We cannot anticipate all the ways in which unfavorable economic and financial market conditions could adversely impact our business.
We face risks arising from the restructuring of our operations.
On January 6, 2017, we approved a plan to restructure our operations to improve the productivity and efficiency of the company, simplify the organization, and streamline decision-making, thereby enhancing client engagement. In May 2017, the Company approved an expansion of the 2017 Restructuring Program. The restructuring initiatives are company-wide. For Fiscal Years 2017 we recorded $41.2 million in restructuring charges, substantially related to the 2017 Restructuring Program, which consisted of employee separation benefits and facility exit costs. The remainder of the charges are expected to be incurred by the end of the fiscal year ending June 30, 2018 (“Fiscal Year 2018”). These actions are expected to result in pre-tax savings in the range of $85.0 million to $95.0 million, all of which are anticipated to be cash expenditures.
In June 2015, we adopted the Margin Acceleration Program and in January 2017, we approved a plan to further restructure our operations to improve the productivity and efficiency of the Company, simplify the organization, and streamline decision-making, thereby enhancing client engagement. For Fiscal Years 2017 and 2016, we recorded $0.5 million and $27.8 million, respectively, in restructuring charges related to the Margin Acceleration Program, which consisted of employee separation benefits and facility exit costs. If we incur additional restructuring charges, our financial condition and results of operations may be adversely impacted.
Restructuring presents significant potential risks of events occurring that could adversely affect us, including a decrease in employee morale, the failure to achieve targeted cost savings and the failure to meet operational targets and customer requirements due to the loss of employees and any work stoppages that might occur.
The fixed price nature of our contracts or failure to document changes to work orders could hurt our operating results.
The majority of our contracts are fixed price. If we fail to accurately price our contracts, if we experience significant cost overruns that are not recovered from our clients, or if we do not properly document changes to work orders under existing contracts, our gross margins on the contracts would be reduced and we could lose money on contracts. In the past, we have had to commit unanticipated resources to complete projects, resulting in lower gross margins on those projects. We might experience similar situations in the future.
If we are unable to attract suitable investigators and volunteers for our clinical trials, our clinical development business might suffer.
The clinical research studies we run in our CRS segment rely upon the ready accessibility and willing participation of physician investigators and volunteer subjects. Investigators are typically located at hospitals, clinics or other sites and supervise administration of the study drug to patients during the course of a clinical trial. Volunteer subjects generally include people from the communities in which the studies are conducted, and the rate of completion of clinical trials is significantly dependent upon the rate of participant enrollment.
Our clinical research development business could be adversely affected if we were unable to attract suitable and willing investigators or volunteers on a consistent basis. If we are unable to obtain sufficient patient enrollment or investigators to conduct clinical trials as planned, we might need to expend substantial additional funds to obtain access to resources or else be compelled to delay or modify our plans significantly. These considerations might result in our inability to successfully achieve projected development timelines as agreed with trial sponsors. In rare cases, it potentially may even lead us to recommend that trial sponsors terminate ongoing clinical trials or development of a product for a particular indication.
We rely on third parties and the transportation industry for important services.
We depend on third parties to provide us with products and services critical to our business. The failure of any of these third parties to adequately provide the needed products and services including, without limitation, transportation services, could have a material adverse effect on our business. Our clinical logistics services and other businesses are also heavily reliant on air travel for transport of clinical trial kits and other material, research products, and people, and a significant disruption to the air travel system, or our access to it, could have a material adverse effect on our business.
17
If our business, including PI, is unable to maintain continuous, effective, reliable and secure operation of its computer hardware, software and internet applications and related tools and functions, its business will be harmed.
Our business, including PI, involves collecting, managing, manipulating and analyzing large amounts of data and communicating data via the Internet. In our business, we depend on the continuous, effective, reliable and secure operation of computer hardware, software, networks, telecommunication networks, Internet servers and related infrastructure. If the hardware or software malfunctions or access to data by internal research personnel or customers through the Internet is interrupted, our business could suffer. In addition, any sustained disruption in Internet access provided by third parties could adversely impact our business.
Unauthorized disclosure of sensitive or confidential data, whether through systems failure or employee negligence, cyber-attacks, fraud or misappropriation, could damage our reputation and cause us to lose customers. Similarly, we could be subject to attempts to gain unauthorized access to or through our information systems, including a cyber-attack by computer programmers and hackers who may develop and deploy viruses, worms or other malicious software programs, process breakdowns, denial-of-service attacks, malicious social engineering or other malicious activities, or any combination of the foregoing. These concerns about security are increased when information is transmitted over the Internet. Threats include cyber-attacks such as computer viruses, worms or other destructive or disruptive software, and any of these could result in a degradation or disruption of our services or damage to our properties, equipment and data. They could also compromise data security. If such attacks are not detected immediately, their effect could be compounded. Successful attacks in the future could result in negative publicity, significant remediation and recovery costs, legal liability and damage to our reputation and could have a material adverse effect on our financial condition, results of operations and cash flows.
Although the computer and communications hardware used in our business is protected through physical and software safeguards, it is still vulnerable to fire, storm, flood, power loss, earthquakes, telecommunications failures, physical or software break-ins, and similar events. And while certain of our operations have appropriate disaster recovery plans in place, we currently do not have redundant facilities everywhere in the world to provide IT capacity in the event of a system failure. In addition, many of the software applications we use, including the PI software products are complex and sophisticated, and could contain data, design or software errors that could be difficult to detect and correct. If PI fails to maintain and further develop the necessary computer capacity and data to support the needs of our PI customers, it could result in a loss of or a delay in revenue and market acceptance. Additionally, significant delays in the planned delivery of system enhancements or inadequate performance of the systems once they are completed could damage our reputation and harm our business.
Finally, long-term disruptions to infrastructure caused by events such as natural disasters, the outbreak of war, the escalation of hostilities, and acts of terrorism (particularly in areas where we have offices) could adversely affect our businesses. Although we carry property and business interruption insurance, our coverage may not be adequate to compensate us for all losses that may occur.
Our business is subject to international economic, political, and other risks that could negatively affect our results of operations or financial position.
We provide most of our services on a worldwide basis. Our service revenue from non-U.S. operations represented approximately 56% and 57% of total consolidated service revenue for Fiscal Year 2017 and Fiscal Year 2016, respectively. More specifically, for Fiscal Year 2017 and Fiscal Year 2016, our service revenue from operations in Europe, the Middle East and Africa represented 37% and 39%, respectively, of total consolidated service revenue. Our service revenue from operations in the Asia/Pacific region represented 16% and 14% of total consolidated service revenue for the respective periods. Accordingly, our business is subject to risks associated with doing business internationally, including:
• | changes in a specific country’s or region’s political or economic conditions, including Western Europe, in particular; |
• | the outbreak of war or hostilities in specific geographic regions, including the Ukraine, Russia, the Middle East and North Korea; |
• | potential negative impact from changes in tax laws affecting any repatriation of profits; |
• | difficulty in staffing and managing widespread operations; |
• | unfavorable labor regulations applicable to our European or other international operations; |
• | changes in foreign currency exchange rates; and |
• | the need to ensure compliance with the numerous regulatory and legal requirements applicable to our business in each jurisdiction and to maintain an effective compliance program to ensure compliance. |
Our operating results are impacted by the health of the global and local economies in which we operate. Our business and financial performance may be adversely affected by current and future economic conditions that cause a decline in business and consumer spending, including a reduction in the availability of credit, rising interest rates, financial market volatility and recession.
18
On June 23, 2016, the United Kingdom (“U.K.”) held a referendum in which voters approved a withdrawal from the European Union (“E.U.”), commonly referred to as “Brexit.” 1.9% and 2.3% of our consolidated service revenue was denominated in the Great Britain Pound (“GBP”) in Fiscal Year 2017 and Fiscal Year 2016, respectively. It is expected that the U.K. will initiate a process to leave the E.U. and begin negotiating the terms of the U.K.’s future relationship with the E.U. At this time, it is uncertain what impact this process will have on the economy in Europe, including in the U.K. or on the “GBP” or other European exchange rates. Adverse consequences such as deterioration in economic conditions, volatility in currency exchange rates or adverse changes in regulation could have a negative impact on our results of operations or financial position.
If we cannot retain our highly qualified management and technical personnel, our business would be harmed.
We rely on the expertise of our Chairman and Chief Executive Officer, Josef H. von Rickenbach, and our President and Chief Operating Officer, Mark A. Goldberg, and it would be difficult and expensive to find qualified replacements who have a comparable level of specialized knowledge of our products and services and the biopharmaceutical outsourcing services industry. While we are a party to an employment agreement with Mr. von Rickenbach, it may be terminated by either party at any time upon notice to the counterparty.
In addition, in order to compete effectively, we must attract and retain qualified sales, professional, scientific, and technical operating personnel. Competition for these skilled personnel, particularly those with a medical degree, a Ph.D. or equivalent degrees, or industry specific expertise, is intense. We may not be successful in attracting or retaining key personnel.
We have only a limited ability to protect our intellectual property rights, and these rights are important to our success.
The proprietary methodologies, analytics, systems, technologies and other intellectual property we develop is important to our success. Existing laws of the various countries in which we provide services or solutions offer only limited protection of our intellectual property rights, and the protection in some countries may be very limited. We rely upon a combination of trade secrets, confidentiality policies, nondisclosure agreements, and other contractual arrangements, and copyright and trademark laws, to protect our intellectual property rights. These laws are subject to change at any time and certain agreements might not be fully enforceable, which could further restrict our ability to protect our innovations. Furthermore, our intellectual property rights might not prevent competitors from independently developing services similar to or duplicative of ours or alleging infringement by us of their intellectual property rights in certain jurisdictions. The steps we take in this regard might not be adequate to prevent or deter infringement or misappropriation of our intellectual property or claims against us for alleged infringement or misappropriation by competitors, former employees or other third parties, and we might not be able to detect unauthorized use of, or take appropriate and timely steps to enforce, our intellectual property rights. Enforcing our rights might also require considerable time, money and oversight, and we might not be successful in enforcing our rights.
Risks Associated with our Financial Results
Our operating results have fluctuated between quarters and years and may continue to fluctuate in the future, which could affect the price of our common stock.
Our quarterly and annual operating results have varied and will continue to vary in the future as a result of a variety of factors. For example, our income from operations totaled $48.0 million for the fiscal quarter ended June 30, 2017, $29.9 million for the fiscal quarter ended March 31, 2017, $60.0 million for the fiscal quarter ended December 31, 2016 and $53.3 million for the fiscal quarter ended September 30, 2016. Our income from operations for the Fiscal Years ended June 30, 2017, 2016 and 2015 respectively, totaled $191.2 million, $224.0 million and $199.9 million. Factors that cause these variations include:
• | the level of new business authorizations in particular quarters or years; |
• | the timing of the initiation, progress, or cancellation of significant projects; |
• | foreign currency exchange rate fluctuations between quarters or years; |
• | restructuring charges; |
• | the mix of services offered in a particular quarter or year; |
• | the timing of the opening of new offices or internal expansion; |
• | timing, costs and the related financial impact of acquisitions; |
• | the timing and amount of costs associated with integrating acquisitions; |
• | the timing and amount of startup costs incurred in connection with the introduction of new products, services or subsidiaries; |
• | the dollar amount of changes in contract scope finalized during a particular period; and |
• | the amount of any reserves we are required to record. |
19
We do not control many of these factors, such as the timing of cancellations of significant projects and foreign currency exchange rate fluctuations between quarters or years.
If our operating results do not match the expectations of securities analysts and investors, the trading price of our common stock will likely decrease.
Backlog may not result in revenue.
Our backlog is not necessarily a meaningful predictor of future results because backlog can be affected by a number of factors, including the size and duration of contracts, many of which are performed over several years. Additionally, as described above, contracts relating to our clinical development business are subject to early termination by the client, and clinical trials can be delayed or canceled for many reasons, including unexpected test results, safety concerns, regulatory developments or economic issues. Also, the scope of a contract can be reduced significantly during the course of a study. If the scope of a contract is revised, the adjustment to backlog occurs when the revised scope is approved by the client. For these and other reasons, we do not fully realize our entire backlog as service revenue.
Our revenue and earnings are exposed to exchange rate fluctuations, which have substantially affected our operating results.
Our financial statements are denominated in U.S. dollars. Because we conduct a significant portion of our operations in foreign countries, changes in foreign currency exchange rates could have and have had a significant effect on our operating results. Exchange rate fluctuations between local currencies and the U.S. dollar create risk in several ways, including:
• | Foreign Currency Translation Risk. The revenue and expenses of our foreign operations are generally denominated in local currencies, primarily the Euro and the pound sterling, and are translated into U.S. dollars for financial reporting purposes. For Fiscal Year 2017 and Fiscal Year 2016, our Euro denominated service revenue accounted for approximately 12.1% and 9.8% of consolidated service revenue, respectively. Accordingly, changes in exchange rates between relevant foreign currencies and the U.S. dollar will affect the translation of foreign results into U.S. dollars for purposes of reporting our consolidated financial results. |
• | Foreign Currency Transaction Risk. We may be subjected to foreign currency transaction risk when our foreign subsidiaries enter into contracts or incur liabilities denominated in a currency other than the foreign subsidiary's functional (local) currency. We also may be subject to foreign currency transaction risk based upon our internal contracts and the extent of work performed in a particular region. To the extent that we are unable to shift the effects of currency fluctuations to our clients, foreign currency exchange losses as a result of foreign currency exchange rate fluctuations could have a material adverse effect on our results of operations. |
Although we try to limit these risks through the inclusion of exchange rate fluctuation provisions stated in our service contracts or by hedging transaction risk with foreign currency exchange contracts, we do not succeed in all cases. Even in those cases in which we are successful, we may still experience fluctuations in financial results from our operations outside of the United States, and we may not be able to reduce the currency transaction risk associated with our service contracts.
Our effective income tax rate may fluctuate from quarter to quarter, which may affect our earnings and earnings per share.
Our quarterly effective income tax rate is influenced by our annual projected profitability in the various taxing jurisdictions in which we operate. Changes in the distribution of profits and losses among taxing jurisdictions may have a significant impact on our effective income tax rate, which in turn could have a material adverse effect on our net income and earnings per share. Factors that affect the effective income tax rate include, but are not limited to:
• | the requirement to exclude from our quarterly worldwide effective income tax calculations losses in jurisdictions in which no tax benefit can be recognized; |
• | the repatriation of foreign earnings to the United States; |
• | actual and projected full-year pretax income; |
• | changes in tax laws in various taxing jurisdictions; |
• | audits by taxing authorities; and |
• | the establishment of valuation allowances against deferred tax assets if it is determined that it is more likely than not that future tax benefits will not be realized. |
These changes may cause fluctuations in our effective income tax rate that could cause fluctuation in our earnings and earnings per share, which could affect our stock price.
20
Our results of operations may be adversely affected by the results of regulatory tax examinations.
We are subject to value added tax, customs tax, sales and use tax, withholding tax, payroll tax, income tax, and other taxes as a result of the operations of our business. The regulators from the various jurisdictions in which we operate periodically perform audits. In the conduct of such audits, we may be required to disclose information of a sensitive nature and, in general, to modify the way we conduct business with our vendors and customers, and our intercompany transfer pricing, as compared to our prior practices, which may affect our business in an adverse manner. We are also regularly subject to, and are currently undergoing, audits by tax authorities in the United States and foreign jurisdictions for prior tax years. Although we believe our tax estimates are reasonable and we intend to defend our positions through litigation if necessary, the final outcome of tax audits and related litigation is inherently uncertain and could be materially different than that reflected in our historical income tax provisions and accruals. Moreover, we could be subject to assessments of substantial additional taxes and/or fines or penalties relating to ongoing or future audits. The adverse resolution of any audits or litigation could have an adverse effect on our financial position and results of operations.
Our results of operations may be adversely affected if our goodwill or intangible assets are impaired.
As of June 30, 2017, our total assets included $676.1 million of goodwill and net intangible assets. We assess the realizability of our indefinite-lived intangible assets and goodwill annually as well as whenever events or changes in circumstances indicate that these assets may be impaired. These events or changes in circumstances generally include operating losses or a significant decline in earnings associated with the acquired business or asset. Our ability to realize the value of the goodwill and indefinite-lived intangible assets will depend on the future cash flows of the underlying businesses. These cash flows may be impacted by how well we have integrated these businesses. If we are not able to realize the value of the goodwill and indefinite-lived intangible assets, we may be required to incur material charges relating to the impairment of those assets.
Changes to our computer operating systems, programs or software could adversely impact our business.
We may make changes to our existing computer operating systems, programs and/or software in an effort to increase our operating efficiency and/or deliver better value to our clients. Such changes may cause disruptions to our operations and have an adverse impact on our business in the short term.
Our business has experienced substantial expansion in the past and such expansion and any future expansion could strain our resources if not properly managed.
We have expanded our business substantially in the past. Future rapid expansion could strain our operational, human and financial resources. In order to manage expansion, we must:
• | continue to improve operating, administrative, and information systems; |
• | accurately predict future personnel and resource needs to meet client contract commitments; |
• | track the progress of ongoing client projects; and |
• | attract and retain qualified management, sales, professional, scientific and technical operating personnel. |
If we do not take these actions and are not able to manage the expanded business, the expanded business may be less successful than anticipated. We may be required to allocate existing or future resources to the expanded business, that in either case, we would have otherwise allocated to another part of our business.
If we are unable to successfully execute our acquisition strategies and successfully integrate acquired businesses, our business, results of operations and financial condition could be adversely impacted.
Historically our growth strategy has been based in part on our ability to acquire existing businesses, services or technologies. We do not know whether in the future we will be able to:
• | identify suitable businesses or technologies to buy; |
• | complete the purchase of any such businesses or technologies on terms acceptable to us; |
• | successfully integrate the operations of acquired businesses into our own; |
• | obtain financing necessary for an acquisition at all or on commercially acceptable terms; or |
• | retain key personnel and customers of acquired businesses. |
We compete with other potential buyers for the acquisition of existing businesses and technology. This competition may result in fewer opportunities to purchase companies that are for sale. It may also result in higher purchase prices for the businesses that we want to purchase. We may also spend time and money investigating and negotiating with potential acquisition targets but not complete the transaction. Any future acquisition could involve other risks, including the assumption of additional liabilities and
21
expenses, issuances of potentially dilutive securities or interest-bearing debt, transaction costs, and diversion of management's attention from other business concerns.
In addition, if we are unable to successfully integrate an acquired company, the acquisition could lead to disruptions to our business. In July 2014, we acquired ATLAS Medical Services, a provider of clinical research services in Turkey, the Middle East, and North Africa. In October 2014, we acquired ClinIntel, a provider of clinical RTSM services, based in the United Kingdom. In April 2015, we acquired Quantum Solutions India, a provider of specialized pharmacovigilance services, based in Chandigarh, India. In February 2016, we acquired Health Advances, an independent life sciences strategy consulting firm, based in Boston, Massachusetts. On October 3, 2016, we acquired all of the capital stock of privately owned ExecuPharm, Inc. ("ExecuPharm"), a leading global functional service provider, based in Pennsylvania. On March 1, 2017, we acquired all of the membership interests of privately owned The Medical Affairs Company, LLC ("TMAC"), a leading provider of outsourced medical affairs services to the pharmaceutical, biotechnology, and medical device industries. If we fail to integrate any of these businesses, or any businesses that we acquire in the future, it could disrupt our business and result in a material adverse effect on our business, financial condition and results of operations.
The success of our acquisition strategy will depend upon, among other things, our ability to:
• | assimilate the operations and services or products of the acquired company; |
• | integrate acquired personnel; |
• | retain and motivate key employees; |
• | retain customers; |
• | identify and manage risks facing the acquired company; and |
• | minimize the diversion of management’s attention from other business concerns. |
Acquisitions of companies outside of the United States may also involve additional risks, including assimilating differences in foreign business practices and overcoming language and cultural barriers.
In the event that the operations of an acquired business do not meet our performance expectations, we may have to restructure the acquired business or write-off the value of some or all of the assets of the acquired business.
Our failure to execute our acquisition strategies, including the identification of potential acquisitions, completing targeted acquisitions, and integrating completed acquisitions, could have a material adverse effect on our business, financial condition and results of operations.
Risks Associated with our Industry
We depend on the pharmaceutical and biotechnology industries, either or both of which may suffer in the short or long term.
Our revenues depend greatly on the expenditures made by the pharmaceutical and biotechnology industries in research and development. In some instances, companies in these industries are reliant on their ability to raise capital in order to fund their research and development projects. Accordingly, economic factors and industry trends that affect our clients in these industries also affect our business. If companies in these industries were to reduce the number of research and development projects they conduct or outsource, our business could be materially adversely affected.
In addition, we are dependent upon the ability and willingness of pharmaceutical and biotechnology companies to continue to spend on research and development and to outsource the services that we provide. We are therefore subject to risks, uncertainties and trends that affect companies in these industries. We have benefited to date from the tendency of pharmaceutical and biotechnology companies to outsource clinical research projects, but any downturn in these industries or reduction in spending or outsourcing could adversely affect our business. For example, if these companies expanded upon their in-house clinical or development capabilities, they would be less likely to utilize our services.
Pharmaceutical and biotechnology companies have been entering into strategic partnerships with clinical research organizations in recent years. To the extent we are not selected or do not otherwise enter into a strategic partnership with a pharmaceutical or biotechnology company, future business with that company may be limited.
Because we depend on a small number of industries and there is a concentration of large clients in those industries, the loss of business from a significant client could harm our business, revenue and financial condition.
The loss of, or a material reduction in the business of, a significant client could cause a substantial decrease in our revenue and adversely affect our business and financial condition, possibly materially. In Fiscal Years 2017, 2016, and 2015, our five largest clients accounted for approximately 37%, 40%, and 44% of our consolidated service revenue, respectively. In Fiscal Year 2017, our largest client individually accounted for 12% of our consolidated service revenue, and in Fiscal Year 2016, our largest client individually accounted for 13% of our consolidated service revenue. In Fiscal Year 2017, we expect that a small number of clients
22
will continue to represent a significant part of our consolidated revenue. This concentration may increase as a result of the increasing number of strategic partnerships into which we have been entering with sponsors. Our contracts with these clients generally can be terminated at any time on short notice. We have in the past experienced contract cancellations with significant clients. If we lose clients, we may not be able to attract new ones, and if we lose individual projects, we may not be able to replace them.
In addition, the portion of our backlog that consists of large, multi-year awards from strategic partnerships has grown in recent years and this trend may continue in the future. A higher concentration of backlog from strategic partnerships may result in an imbalance across our project portfolio among projects in the start-up phase, which typically generate lower revenue, and projects in later stages, which typically generate higher revenue. This in turn may cause fluctuations in our revenue and profitability from period to period.
We face intense competition in many areas of our business; if we do not compete effectively, our business will be harmed.
The biopharmaceutical services industry is highly competitive, and we face numerous competitors in many areas of our business. If we fail to compete effectively, we may lose clients, which would cause our business to suffer.
We primarily compete against in-house departments of pharmaceutical companies, other full service CROs, small specialty CROs, and, to a lesser extent, universities, teaching hospitals, and other site organizations. Some of the larger CROs against which we compete include QuintilesIMS, Laboratory Corporation of America, Pharmaceutical Product Development Inc., INC research, PRA Health Sciences and Icon plc. In addition, our PC business competes with a large and fragmented group of specialty service providers, including advertising/promotional companies, major consulting firms with pharmaceutical industry groups and smaller companies with pharmaceutical industry focus. PI competes primarily with CROs, information technology companies and other software companies. Some of these competitors, including the in-house departments of pharmaceutical companies, have greater capital, technical and other resources than we have. In addition, our competitors that are smaller specialized companies may compete effectively against us because of their concentrated size and focus.
In recent years, a number of the large pharmaceutical companies have established formal or informal alliances with one or more CROs relating to the provision of services for multiple trials over extended time periods. Our success depends in part on successfully establishing and maintaining these alliances. If we fail to do so, our revenue and results of operations could be adversely affected, possibly materially.
If we do not keep pace with rapid technological changes, our products and services may become less competitive or obsolete, especially in our PI business.
The biotechnology, pharmaceutical and medical device industries generally, and clinical research specifically, are subject to increasingly rapid technological changes. Our competitors or others might develop technologies, products or services that are more effective or commercially attractive than our current or future technologies, products or services, or render our technologies, products or services less competitive or obsolete. If our competitors introduce superior technologies, products or services and we cannot make enhancements to our technologies, products and services necessary to remain competitive, our competitive position would be harmed. If we are unable to compete successfully, we may lose clients or be unable to attract new clients, which could lead to a decrease in our revenue.
Risks Associated with Regulation or Legal Liabilities
If governmental regulation of the drug, medical device and biotechnology industry changes, the need for our services could decrease.
Governmental regulation of the drug, medical device and biotechnology product development process is complicated, extensive, and demanding. A large part of our business involves assisting pharmaceutical, biotechnology and medical device companies through the regulatory approval process. Changes in regulations that, for example, streamline procedures or relax approval standards, could eliminate or reduce the need for our services. If companies regulated by the FDA or similar foreign regulatory authorities needed fewer of our services, we would have fewer business opportunities and our revenues would decrease, possibly materially.
In the United States, the FDA and the Congress have attempted to streamline the regulatory process by providing for industry user fees that fund the hiring of additional reviewers and better management of the regulatory review process. In Europe, governmental authorities have approved common standards for clinical testing of new drugs throughout the European Union by adopting standards for GCP and by making the clinical trial application and approval process more uniform across member states. The FDA has had GCP in place as a regulatory standard and requirement for new drug approval for many years, and Japan adopted GCP in 1998.
The United States, Europe and Japan have also collaborated for over 15 years on the International Conference on Harmonisation (“ICH”), the purpose of which is to eliminate duplicative or conflicting regulations in the three regions. The ICH partners have agreed on a common format (the Common Technical Document) for new drug marketing applications that reduces the need to tailor the format to each region. Such efforts and similar efforts in the future that streamline the regulatory process may reduce the demand for our services. The revised ICH GCP E6 R2 guideline, strengthening especially risk management and oversight, is
23
being implemented progressively (came into effect in June 2017 in the European Union). PAREXEL maintains an agile Quality Management System that anticipated the changes that would be required by the revised guideline and preemptively adjusted. As a result minimal changes to existing processes were required.
Parts of our PC business advise clients on how to satisfy regulatory standards for manufacturing and clinical processes and on other matters related to the enforcement of government regulations by the FDA and other regulatory bodies. Any reduction in levels of review of manufacturing or clinical processes or levels of regulatory enforcement, generally, would result in fewer opportunities for our business in this area.
If we fail to comply with existing regulations, and ethics standards our reputation and operating results would be harmed.
Our business is subject to numerous governmental regulations, and ethics standards, primarily relating to worldwide pharmaceutical and medical device product development and regulatory approval, the conduct of clinical trials, and limitations on activities relating to delivery of health care items or services that are paid for with government health care program funding. In addition, we may be contractually obligated to assist our clients in complying with regulations that apply to our clients, including the Physician Payment Sunshine Act, which requires manufacturers and group purchasing organizations to report all payments or transfers of value to health care providers and teaching hospitals. If we fail to comply with these governmental regulations and ethics standards, such non-compliance could result in the termination of our ongoing research, development or sales and marketing projects, or the disqualification of data for submission to regulatory authorities. We also could be barred from providing clinical trial services in the future or could be subjected to civil monetary penalties or, in certain cases, criminal fines and penalties. Any of these consequences would harm our reputation, our prospects for future work and our operating results. In addition, we may have to repeat research or redo trials. If we are required to repeat research or redo trials, we may be contractually required to do so at no further cost to our clients, but at substantial cost to us.
We may lose business opportunities as a result of healthcare reform and the expansion of managed-care organizations.
Numerous governments, including the U.S. government, have undertaken efforts to control growing healthcare costs through legislation, regulation and voluntary agreements with medical care providers and drug companies. In March 2010, the United States Congress enacted healthcare reform legislation intended over time to expand health insurance coverage and impose health industry cost containment measures. The continuing implementation of this legislation may significantly impact the pharmaceutical industry. In addition, this legislation and its implementation continue to face challenges in Congress and federal courts, and from certain state governments, opposition advocacy groups and some small business organizations, and we are uncertain as to the effects of this legislation on our business and are unable to predict what legislative proposals will be adopted in the future. The U.S. Congress has also considered and may adopt legislation that could have the effect of putting downward pressure on the prices that pharmaceutical and biotechnology companies can charge for prescription drugs. In addition, various state legislatures and European and Asian governments may consider various types of healthcare reform in order to control growing healthcare costs. We are presently uncertain as to the effects of the enacted legislation on our business and are unable to predict what legislative proposals will be adopted in the future, if any.
If these efforts are successful, drug, medical device and biotechnology companies may react by spending less on research and development. If this were to occur, we would have fewer business opportunities and our revenue could decrease, possibly materially. In addition, new laws or regulations may create a risk of liability, increase our costs or limit our service offerings.
In addition to healthcare reform proposals, the expansion of managed-care organizations in the healthcare market and managed-care organizations’ efforts to cut costs by limiting expenditures on pharmaceuticals and medical devices could result in pharmaceutical, biotechnology and medical device companies spending less on research and development. If this were to occur, we would have fewer business opportunities and our revenue could decrease, possibly materially.
We may have substantial exposure to payment of personal injury claims and may not have adequate insurance to cover such claims.
Our CRS business primarily involves the testing of experimental drugs and medical devices on consenting human volunteers pursuant to a study protocol. Clinical research involves a risk of liability for a number of reasons, including, but not limited to:
• | personal injury or death to patients who participate in the study or who use a product approved by regulatory authorities after the clinical research has concluded; |
• | general risks associated with our Early Phase facilities, including professional malpractice of physicians, nurses and other medical care providers; and |
• | errors and omissions during a trial that may undermine the usefulness of a trial or data from the trial or study. |
In order to mitigate the risk of liability, we seek to include indemnification provisions in our CRS contracts with clients and with investigators. However, we are not able to include indemnification provisions in all of our contracts. In addition, even if we are able to include an indemnification provision in our contracts, the indemnification provisions may not cover our exposure if:
24
• | we had to pay damages or incur defense costs in connection with a claim that is outside the scope of an indemnification agreement; or |
• | a client failed to indemnify us in accordance with the terms of an indemnification agreement because it did not have the financial ability to fulfill its indemnification obligation or for any other reason. |
In addition, contractual indemnifications generally do not protect us against liability arising from certain of our own actions, such as negligence or misconduct.
We also carry insurance to cover our risk of liability. However, our insurance is subject to deductibles and coverage limits and may not be adequate to cover claims. In addition, liability coverage is expensive. In the future, we may not be able to maintain or obtain the same levels of coverage on reasonable terms, at a reasonable cost, or in sufficient amounts to protect us against losses due to claims.
Existing and proposed laws and regulations regarding confidentiality of patients’ and other individuals’ personal information could result in increased risks of liability or increased cost to us or could limit our product and service offerings.
The confidentiality, security, use and disclosure of patient-specific information are subject to governmental regulation. Regulations to protect the safety and privacy of human subjects who participate in or whose data are used in clinical research generally require clinical investigators to obtain legally effective informed consent from identifiable research subjects before research is undertaken. Under the Health Insurance Portability and Accountability Act of 1996 (“HIPAA”), as amended by the Health Information Technology for Economic and Clinical Health (“HITECH”) Act of 2009, the U.S. Department of Health and Human Services has issued regulations mandating privacy and data security standards and breach notification requirements for certain types of individually identifiable health information, or protected health information, when used or disclosed by health care providers and other HIPAA-covered entities or business associates that provide services to or perform functions on behalf of these covered entities. HIPAA regulations generally require individuals’ written authorization before identifiable health information may be used for research, in addition to any required informed consent. HIPAA regulations also specify standards for de-identifying health information so that information can be handled outside of the HIPAA requirements and for creating limited data sets that can be used for research purposes under less stringent HIPAA restrictions.
The European Union and its member states, as well as other countries, such as Canada, Argentina, Japan and other Asian countries, and state governments in the United States, have adopted and continue to implement new medical privacy and general data protection laws and regulations. In those countries, collecting, processing, using and transferring an individual’s personal data is subject to specific requirements, such as obtaining explicit consent, processing the information for limited purposes and restrictions with respect to cross-border transfers. Many countries and almost all states in the United States have adopted data security breach laws that require the user of such data to inform the affected individuals and, in some cases, government authorities and the general public of security breaches. In order to comply with these laws and regulations and corresponding contractual demands from our clients, we must maintain internal compliance policies and procedures, and we may need to implement new privacy and security measures, which may require us to make substantial expenditures or cause us to limit the products and services we offer. In addition, if we violate applicable laws, regulations, contractual commitments, or other duties relating to the use, privacy or security of health information, we could be subject to civil liability or criminal penalties and it may be necessary to modify our business practices.
Failure to achieve and maintain effective internal control in accordance with Section 404 of the Sarbanes-Oxley Act of 2002, and delays in completing our internal control audit and financial audit, could have a material adverse effect on our business and stock price.
Management assessments have identified a material weakness in our internal control over financial reporting due to ineffective controls associated with revenue recognition in our CRS reporting segment. A material weakness is defined as a deficiency, or a combination of deficiencies, in internal control over financial reporting, such that there is a reasonable possibility that a material misstatement of the company's annual or interim financial statements will not be prevented or detected on a timely basis. Management is continuing to execute a remediation plan intended to address the control deficiencies which resulted in the material weakness. During the course of our testing, we may identify other significant deficiencies or material weaknesses, in addition to the one already identified, which we may not be able to remediate in a timely manner. If we continue to have one or more material weaknesses in our internal control over financial reporting, we will not be able to conclude that we have effective internal control over financial reporting in accordance with Section 404 of the Sarbanes-Oxley Act of 2002. Failure to achieve and maintain an effective internal control environment, or delays in completing our internal control audit and financial audit, could cause investors to lose confidence in our reported financial information, which could result in a decline in the market price of our common stock, and cause us to fail to meet our reporting obligations in the future, which in turn could impact our ability to raise equity financing if needed in the future. While we believe our reported revenue is accurate, until this deficiency is substantially remediated, it is possible that internal control over financial reporting may not prevent or detect material misstatements in revenue reflected in our financial statements.
25
We operate in many different jurisdictions and we could be adversely affected by violations of the U.S. Foreign Corrupt Practices Act and similar worldwide anti-corruption laws.
The U.S. Foreign Corrupt Practices Act (FCPA) and similar worldwide anti-corruption laws, including the U.K. Bribery Act of 2010, generally prohibit companies and their intermediaries from making improper payments to foreign officials for the purpose of obtaining or retaining business. Our internal policies mandate compliance with these anti-corruption laws. We operate in many parts of the world that have experienced governmental corruption to some degree, and in certain circumstances, anti-corruption laws have appeared to conflict with local customs and practices. Despite our training and compliance programs, we cannot assure that our internal control policies and procedures always will protect us from reckless or criminal acts committed by persons associated with PAREXEL. Our continued global expansion, including in developing countries, could increase such risk in the future. Violations of these laws, or even allegations of such violations, could disrupt our business and result in a material adverse effect on our results of operations or financial condition.
Risks Associated with Indebtedness
Our indebtedness may limit cash flow available to invest in the ongoing needs of our business.
As of June 30, 2017, we had $671.5 million principal amount of debt, excluding debt issuance cost of $2.7 million, outstanding and remaining borrowing availability of $170.0 million under our credit arrangements. We may incur additional debt in the future. Our leverage could have significant adverse consequences, including:
• | requiring us to dedicate a substantial portion of any cash flow from operations to the payment of interest on, and principal of, our debt, which will reduce the amounts available to fund working capital and capital expenditures, and for other general corporate purposes; |
• | increasing our vulnerability to general adverse economic and industry conditions; |
• | limiting our flexibility in planning for, or reacting to, changes in our business and the industry in which we compete; and |
• | placing us at a competitive disadvantage to our competitors that have less debt. |
Under the terms of our various credit facilities, interest rates are fixed based on market indices at the time of borrowing and, depending upon the interest mechanism selected by us, may float thereafter. Some of our other smaller credit facilities also bear interest at floating rates. As a result, the amount of interest payable by us on our borrowings may increase if market interest rates change.
We may not have sufficient funds, our business may not generate sufficient cash flow from operations, or we may be unable to arrange for additional financing, to pay the amounts due under our existing or any future debt, or any other liquidity needs. In addition, a failure to comply with the covenants under our existing credit facilities could result in an event of default under those credit facilities. In the event of an acceleration of amounts due under our credit facilities as a result of an event of default, we may not have sufficient funds or may be unable to arrange for additional financing to repay our indebtedness or to make any required accelerated payments.
In addition, the terms of the 2016 Credit Agreement and the Note Purchase Agreement provide that upon the occurrence of a change in control, as defined in the 2016 Credit Agreement and the Note Purchase Agreement, all outstanding indebtedness under the 2016 Credit Agreement and the Notes would become due. This provision may delay or prevent a change in control that our stockholders may consider desirable.
Our existing credit facilities contain covenants that limit our flexibility and prevent us from taking certain actions.
The agreements in connection with our 2016 Credit Agreement and in our short term debt facilities include a number of restrictive covenants. These covenants could adversely affect us by limiting our ability to plan for or react to market conditions, meet our capital needs and execute our business strategy. These covenants, among other things, limit our ability and the ability of our restricted subsidiaries to:
• | incur additional debt; |
• | buy back our common stock; |
• | make certain investments; |
• | enter into certain types of transactions with affiliates; |
• | make specified restricted payments; and |
• | sell certain assets or merge with or into other companies. |
26
These covenants may limit our operating and financial flexibility and limit our ability to respond to changes in our business or competitive activities. Our failure to comply with these covenants could result in an event of default, which, if not cured or waived, could result in our being required to repay these borrowings before their scheduled due date.
Risks Associated with our Common Stock
Our corporate governance structure, including provisions of our articles of organization, by-laws, as well as Massachusetts law, may delay or prevent a change in control or management that stockholders may consider desirable.
Provisions of our articles of organization, and by-laws, as well as provisions of Massachusetts law, may enable our management to resist an acquisition of us by a third party, or may discourage a third party from acquiring us. These provisions include the following:
• | we have divided our board of directors into three classes of directors that serve staggered three-year terms; |
• | we are subject to Section 8.06 of the Massachusetts Business Corporation Law, which provides that directors may only be removed by stockholders for cause, vacancies in our Board of Directors may only be filled by a vote of our board of directors, and the number of directors may be fixed only by our board of directors; |
• | we are subject to Chapter 110F of the Massachusetts General Laws, which may limit the ability of some interested stockholders to engage in business combinations with us; and |
• | our stockholders are limited in their ability to call or introduce proposals at stockholder meetings. |
These provisions could have the effect of delaying, deferring, or preventing a change in control of us or a change in our management that our stockholders may consider favorable or beneficial. These provisions could also discourage proxy contests and make it more difficult for stockholders to elect directors and take other corporate actions. These provisions could also limit the price that investors might be willing to pay in the future for shares of our stock.
In addition, our board of directors may issue preferred stock in the future without stockholder approval. If our board of directors issues preferred stock, the rights of the holders of common stock would be subordinate to the rights of the holders of preferred stock. Our board of directors’ ability to issue the preferred stock could make it more difficult for a third party to acquire, or discourage a third party from acquiring, a majority of our stock.
Our stock price has been, and may in the future be volatile, which could lead to losses by investors.
The market price of our common stock has fluctuated widely in the past and may continue to do so in the future. On August 25, 2017, the closing sales price of our common stock on the Nasdaq Global Select Market was $87.70 per share. During the period from June 30, 2012 to June 30, 2017, our common stock traded at prices ranging from a high of $86.50 per share to a low of $15.26 per share. Investors in our common stock must be willing to bear the risk of such fluctuations in stock price and the risk that the value of an investment in our common stock could decline.
Our stock price can be affected by quarter-to-quarter variations in a number of factors including, but not limited to:
• | operating results; |
• | earnings estimates by industry analysts; |
• | market conditions in our industry or the pharmaceutical and biotechnology industries; |
• | prospects of healthcare reform; |
• | changes in government regulations; |
• | general economic conditions, and |
• | our effective income tax rate. |
In addition, the stock market has from time to time experienced significant price and volume fluctuations that are not related to the operating performance of particular companies. These market fluctuations may adversely affect the market price of our common stock. Although our common stock has traded in the past at a relatively high price-earnings multiple, due in part to analysts’ expectations of earnings growth, the price of our common stock could quickly and substantially decline as a result of even a relatively small shortfall in earnings from, or a change in, analysts’ expectations.
We do not expect to pay any cash dividends for the foreseeable future.
We do not anticipate that we will pay any dividends to holders of our common stock for the foreseeable future. Any payment of cash dividends will be at the discretion of our Board of Directors and will depend on our financial condition, capital requirements, legal requirements, earnings and other factors. Our ability to pay dividends is restricted by the terms of our 2016 Credit Agreement and might be restricted by the terms of any indebtedness that we incur in the future. Consequently, you should not rely on dividends
27
in order to receive a return on your investment. For additional information on our dividend policy, see Part II, Item 5 "Market for Registrant's Common Equity, Related Stockholder Matters and Issuer Purchases of Equity Securities" in this Annual Report on Form 10-K.
ITEM 1B. UNRESOLVED STAFF COMMENTS
None.
ITEM 2. PROPERTIES
As of June 30, 2017, we leased approximately 2,935,200 square feet of building space, primarily office space, in 85 locations in 41 countries under various leases that expire between 2017 and 2035. Total square feet by region is summarized below:
Region | Square Feet | |
The Americas | 844,600 | |
Europe, Middle East & Africa | 1,267,000 | |
Asia/Pacific | 823,600 | |
Total | 2,935,200 | |
Our largest facilities are located in (a) the USA, where we lease approximately 758,700 square feet, (b) Germany, where we lease approximately 520,600 square feet, (c) India, where we lease approximately 424,300 square feet, (d) the United Kingdom, where we lease approximately 242,500 square feet, and (e) China, where we lease approximately 119,000 square feet. Our principal facilities are set forth below:
Facility | Sq. Ft. | Use of Facility | Lease Expirations | |||
Headquarters in Waltham, MA | 64,000 | CRS, PC and Corporate | 2019 | |||
Berlin, Germany | 496,000 | All Business Segments and General & Administrative | 2019-2035 | |||
Billerica, MA | 265,000 | All Business Segments and General & Administrative | 2025 | |||
Hyderabad, India | 204,000 | All Business Segments and General & Administrative | 2017-2021 | |||
Durham, NC | 104,000 | CRS, PC and General & Administrative | 2026 | |||
Uxbridge, UK | 88,000 | CRS, PC and General & Administrative | 2022 | |||
Nottingham, UK | 68,000 | PI, CRS and General & Administrative | 2018-2030 | |||
Dublin, Ireland | 28,000 | CRS, PC and General & Administrative | 2025 | |||
In June 2015, we adopted a plan (the “Margin Acceleration Program”) to restructure our operations to improve the productivity and efficiency of the Company, simplify the organization, and streamline decision-making, thereby enhancing client engagement. Due to restructuring initiatives, we have vacated approximately 113,000 square feet of our leased properties. The vacated space has either been sublet or is being actively marketed for sublease or disposition. See Note 7 to our consolidated financial statements included in this annual report for more information.
We believe that our facilities are adequate for our operations and that additional space will be available at satisfactory terms, if needed.
ITEM 3. LEGAL PROCEEDINGS
On July 24, 2017, a putative class action lawsuit was filed in the United States District Court of Massachusetts by a shareholder of PAREXEL against the Company, members of the Board of Directors, Pamplona, Parent and Merger Sub, captioned Louis Scarantino v. PAREXEL International Corporation, et al., 1:17-cv-11360. On July 25, 2017, a second putative class action lawsuit was filed in the United States District Court of Massachusetts by a shareholder of PAREXEL against the Company and members of the Board of Directors, captioned Catherine Fischer v. PAREXEL International Corporation, et al., 1:17-cv-11364. On July 27, 2017, a third putative class action lawsuit was filed in the United States District Court of Massachusetts by another shareholder of PAREXEL against the Company and members of the Board of Directors, captioned Peter Manning v. PAREXEL International Corporation, et al., 1:17-cv-11376. All three complaints allege that the preliminary proxy statement violates Section 14(a) and Section 20(a) of the Securities Exchange Act by materially omitting material information related to the Company’s projections and the explanation of the analysis of the Company’s financial advisor, among other claims. All of the complaints seek, among other things, equitable relief to enjoin the consummation of the merger, rescission of the merger or rescissory damages, compensatory damages, and attorneys’ fees and costs. The Company, the Board of Directors, Pamplona, Parent and Merger Sub believe that the claims asserted against them are without merit and intend to vigorously defend against these lawsuits.
28
ITEM 4. MINE SAFETY DISCLOSURES
Not applicable.
29
PART II
ITEM 5. MARKET FOR REGISTRANT’S COMMON EQUITY, RELATED STOCKHOLDER MATTERS, AND ISSUER PURCHASES OF EQUITY SECURITIES
MARKET INFORMATION AND HOLDERS
Our common stock is traded on the Nasdaq Global Select Market under the symbol “PRXL.” The table below shows the high and low sales prices of the common stock for each quarter of the Fiscal Years 2017 and 2016.
2017 | 2016 | |||||||
High | Low | High | Low | |||||
First Quarter | $71.13 | $60.70 | $76.17 | $60.76 | ||||
Second Quarter | $71.10 | $51.16 | $69.49 | $57.01 | ||||
Third Quarter | $72.32 | $60.60 | $70.24 | $56.00 | ||||
Fourth Quarter | $87.50 | $60.51 | $68.77 | $57.04 | ||||
As of August 25, 2017, there were approximately 350 stockholders of record of our common stock. The number does not include stockholders for which shares were held in a “nominee” or “street” name.
DIVIDENDS
We have never declared or paid any cash dividends on our capital stock, nor do we anticipate paying any cash dividends in the foreseeable future. We intend to retain future earnings for the development and expansion of our business.
Under the terms of the 2016 Credit Agreement, which are described in “Credit Agreements” in Part II, Item 7 of this annual report, neither we nor any of our subsidiaries may pay any dividend or make any other distribution with respect to any shares of capital stock except that (a) we and our subsidiaries may declare and pay dividends with respect to equity interests payable solely in additional shares of common stock, (b) our subsidiaries may declare and pay dividends and other distributions ratably with respect to their equity interests, (c) we may make restricted payments pursuant to and in accordance with stock option plans or other benefit plans for management or employees of PAREXEL and our subsidiaries, and (d) we may make certain permitted stock repurchases.
STOCK REPURCHASE PROGRAM
Fiscal Year 2017 Share Repurchase
On October 26, 2016, we announced that our Board of Directors approved a share repurchase program (the “2017 Program”) authorizing the repurchase of up to $200.0 million of our common stock to be financed with cash on hand, cash generated from operations, existing credit facilities, or new financing. On November 21, 2016, we entered into an agreement (the “2017 Agreement”) to purchase shares of our common stock from HSBC, National Association (“HSBC”), for an aggregate purchase price of $200.0 million pursuant to an accelerated share purchase program. Pursuant to the 2017 Agreement, in November 2016, we paid $200.0 million to HSBC and received from HSBC 2.8 million shares of our common stock, representing 80% of the estimated shares to be repurchased by us under the 2017 Agreement. The shares were repurchased at a price of $57.51 per share, which was the closing price of our common stock on the Nasdaq Global Select Market on November 21, 2016. These shares were canceled and restored to the status of authorized and unissued shares. We recorded a $160.0 million payment, which represents the 80% of the shares we repurchased, as a decrease to equity in our consolidated balance sheet, consisting of decreases in common stock and additional paid-in capital. As additional paid-in capital was reduced to zero, the remainder was applied as a reduction in retained earnings. The remaining $40.0 million, which is an advanced payment accounted for as a forward share repurchase contract, was recorded within other current assets within the condensed consolidated balance sheet. During the twelve months ended June 30, 2017, the fair value of the forward accelerated share repurchase contract decreased by $20.7 million.
On March 20, 2017, we received 0.3 million shares representing the final settlement of the 2017 Agreement and the 2017 Program was completed. We applied the $19.3 million against equity as additional paid-in capital, which was reduced to zero and the remainder was applied as a reduction in retained earnings. Pursuant to the 2017 Program, we repurchased 3.1 million shares of our common stock at an average price of $64.04 per share from November 2016 to March 2017.
Fiscal Year 2016 Share Repurchase
On September 14, 2015, we announced that our Board of Directors approved a share repurchase program (the “2016 Program”) authorizing the repurchase of up to $200.0 million of our common stock to be financed with cash on hand, cash generated from operations, existing credit facilities, or new financing. On September 15, 2015, we entered into an agreement (the “2016 Agreement”) to purchase shares of our common stock from Wells Fargo Bank, National Association (“WF”), for an aggregate purchase price of $200.0 million pursuant to an accelerated share purchase program. Pursuant to the 2016 Agreement, in September
30
2015, we paid $200.0 million to WF and received from WF 2.3 million shares of our common stock, representing 80% of the shares to be repurchased by us under the 2016 Agreement. The shares were repurchased at a price of $70.35 per share, which was the closing price of our common stock on the Nasdaq Global Select Market on September 16, 2015. These shares were canceled and restored to the status of authorized and unissued shares.
On February 10, 2016 we received 0.9 million shares representing the final settlement of the 2016 Agreement and the 2016 Program was completed. Pursuant to the 2016 Program, we repurchased 3.2 million shares of our common stock at an average price of $62.92 per share from September 2015 to February 2016.
In Fiscal Year 2016, we recorded the $200.0 million payment to WF as a decrease to equity in our consolidated balance sheet, consisting of decreases in common stock and additional paid-in capital. As additional paid-in capital was reduced to zero, the remainder was applied as a reduction in retained earnings.
31
COMPANY STOCK PERFORMANCE GRAPH
Our common stock is listed for trading on the Nasdaq Global Select Market under the symbol “PRXL.” The Stock Price Performance Graph set forth below compares the cumulative total stockholder return on our common stock for the period from June 30, 2012 through June 30, 2017, with the cumulative total return of the Nasdaq Composite Index and the Nasdaq Health Care Index over the same period. The comparison assumes $100 was invested on June 30, 2012 in PAREXEL’s common stock, in the Nasdaq Composite Index, and in the Nasdaq Health Care Index and assumes reinvestment of dividends, if any.
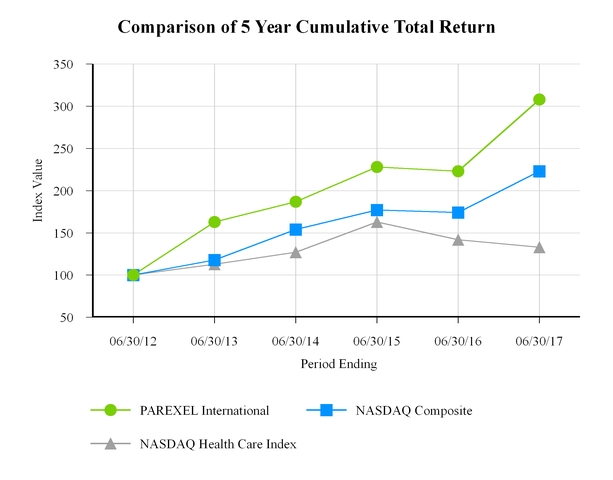
Fiscal Years Ended June 30, | ||||||||||||
Total Return Index For: | 2012 | 2013 | 2014 | 2015 | 2016 | 2017 | ||||||
PAREXEL International Stock | $100 | $163 | $187 | $228 | $223 | $308 | ||||||
Nasdaq Composite Index | $100 | $118 | $154 | $177 | $174 | $223 | ||||||
Nasdaq Health Care Index | $100 | $113 | $127 | $163 | $142 | $133 | ||||||
The stock price performance shown on the graph above is not necessarily indicative of future price performance. Information used in the graph was obtained from The Nasdaq Stock Market, a source believed to be reliable, but we are not responsible for any errors or omissions in such information.
The information included under the heading “Company Stock Performance Graph” is “furnished” and not “filed” for purposes of Section 18 of the Exchange Act, or otherwise subject to the liabilities of that section, nor shall it be deemed to be “soliciting material” subject to Regulation 14A or incorporated by reference in any filing under the Securities Act of 1933, as amended, or the Exchange Act.
32
ITEM 6. SELECTED FINANCIAL DATA
The following selected consolidated financial data of PAREXEL for the five years ended June 30, 2017 are derived from our consolidated financial statements. The information set forth below should be read in conjunction with “Management’s Discussion and Analysis of Financial Condition and Results of Operations” included as Item 7 in this annual report and the consolidated financial statements and related footnotes included as Item 8 in this annual report.
For the Fiscal Years Ended June 30, | |||||||||||||||||||||
(dollars in millions, except per share data and number of employees) | 2017 | 2016 | 2015 | 2014 | 2013 | ||||||||||||||||
OPERATIONS | |||||||||||||||||||||
Service revenue | $ | 2,117.6 | $ | 2,094.3 | $ | 2,016.0 | $ | 1,939.4 | $ | 1,734.4 | |||||||||||
Income from operations | $ | 191.2 | $ | 224.0 | $ | 199.9 | $ | 199.5 | $ | 136.1 | |||||||||||
Net income | $ | 107.3 | $ | 154.9 | $ | 147.8 | $ | 129.1 | $ | 96.0 | |||||||||||
Basic earnings per share | $ | 2.08 | $ | 2.90 | $ | 2.69 | $ | 2.28 | $ | 1.64 | |||||||||||
Diluted earnings per share | $ | 2.06 | $ | 2.86 | $ | 2.65 | $ | 2.25 | $ | 1.61 | |||||||||||
FINANCIAL POSITION | |||||||||||||||||||||
Cash and marketable securities | $ | 302.7 | $ | 248.6 | $ | 207.4 | $ | 283.8 | $ | 274.2 | |||||||||||
Working capital | $ | 400.0 | $ | 411.8 | $ | 352.5 | $ | 350.9 | $ | 403.2 | |||||||||||
Total assets | $ | 2,313.4 | $ | 2,036.2 | $ | 1,865.0 | $ | 1,834.0 | $ | 1,779.6 | |||||||||||
Short-term debt | $ | 29.2 | $ | 16.6 | $ | 8.9 | $ | 12.5 | $ | 20.4 | |||||||||||
Long-term debt * | $ | 645.0 | $ | 487.8 | $ | 348.2 | $ | 337.5 | $ | 427.5 | |||||||||||
Stockholders’ equity | $ | 634.5 | $ | 633.4 | $ | 665.3 | $ | 577.7 | $ | 538.9 | |||||||||||
OTHER DATA | |||||||||||||||||||||
Purchases of property and equipment | $ | 72.6 | $ | 95.5 | $ | 80.2 | $ | 72.6 | $ | 81.1 | |||||||||||
Depreciation and amortization | $ | 106.4 | $ | 96.9 | $ | 84.9 | $ | 81.3 | $ | 73.2 | |||||||||||
Number of employees | 18,900 | 18,600 | 18,660 | 15,560 | 14,690 | ||||||||||||||||
Weighted average shares | |||||||||||||||||||||
Basic | 51.5 | 53.5 | 54.9 | 56.5 | 58.4 | ||||||||||||||||
Diluted | 52.2 | 54.2 | 55.8 | 57.5 | 59.4 | ||||||||||||||||
* Excludes debt issuance cost of $2.7 million, $3.0 million, $2.8 million, $3.1 million and $3.4 million as of June 30, 2017, 2016, 2015, 2014 and 2013, respectively
33
ITEM 7. MANAGEMENT’S DISCUSSION AND ANALYSIS OF FINANCIAL CONDITION AND RESULTS OF OPERATIONS
OVERVIEW
We are a leading biopharmaceutical services outsourcing company, providing a broad range of expertise in clinical research, clinical logistics, medical communications, consulting, commercialization and advanced technology products and services to the worldwide pharmaceutical, biotechnology, and medical device industries. Our primary objective is to provide quality solutions for managing the biopharmaceutical product lifecycle with the goal of reducing the time, risk, and cost associated with the development and commercialization of new therapies. Since our incorporation in 1983, we have developed significant expertise in processes and technologies supporting this strategy. Our product and service offerings include: clinical trials management, observational studies and patient/disease registries, data management, biostatistical analysis, epidemiology, health economics/outcomes research, pharmacovigilance, medical communications, clinical pharmacology, patient recruitment, clinical supply and drug logistics, post-marketing surveillance, regulatory and product development and commercialization consulting, health policy and reimbursement and market access consulting, medical imaging services, regulatory information management (“RIM”) solutions, ClinPhone randomization and trial supply management services (“RTSM”), electronic data capture systems (“EDC”), clinical trial management systems (“CTMS”), web-based portals, systems integration, patient diary applications, and other product development tools and services. We believe that our comprehensive services, depth of therapeutic area expertise, global footprint and related access to patients, and sophisticated information technology, along with our experience in global drug development and product launch services, represent key competitive strengths.
On June 19, 2017, PAREXEL entered into an Agreement and Plan of Merger pursuant to which West Street Merger Sub, Inc., a Massachusetts corporation and a wholly-owned subsidiary of West Street Parent, LLC, a Delaware limited liability company (which we refer to as Parent) and affiliate of Pamplona Capital Management, LLP, will be merged with and into us, with PAREXEL surviving as a subsidiary of West Street Parent, LLC, which we refer to as the merger will acquire all of the outstanding shares of PAREXEL for $88.10 per share in cash in a transaction valued at approximately $5.5 billion, including PAREXEL’s net debt. Consummation of the merger is subject to various customary conditions, including adoption of the merger agreement by the Company’s stockholders and receipt of required regulatory approvals. The closing of the merger is expected to be completed late in the third or early in the fourth quarter of calendar year 2017.
Immediately prior to, and contingent upon, the closing of the merger, each outstanding Company stock option, restricted stock unit, restricted share and performance restricted stock unit (collectively, the “Company Equity Awards”) will vest in full (in the case of performance restricted stock units, at target level regardless of the actual achievement of the applicable performance metric). Such fully vested Company Equity Awards will be canceled and converted into the right to receive an amount in cash equal to $88.10 per share for each share of our common stock underlying such Company Equity Awards (net of any applicable exercise price and subject to any applicable withholding taxes).
On August 15, 2017, the Company announced a special meeting of the shareholders of PAREXEL to be held on September 15, 2017. At the shareholder meeting, shareholders will be asked to consider and vote on a proposal to approve the Agreement and Plan of Merger, dated as of June 19, 2017, by and among PAREXEL, West Street Parent, LLC (“Parent”) and West Street Merger Sub, Inc. (“Merger Sub, providing for the acquisition of the Company by an affiliate of the private equity investment firm Pamplona. Subject to the terms and conditions of the Merger Agreement, the acquisition will occur by means of a merger of Merger Sub, a wholly-owned subsidiary of Parent, with and into the Company, with the Company surviving the merger as a wholly-owned subsidiary of Parent in accordance with the Massachusetts Business Corporation Act (the “MBCA”).
In connection with the consummation of the Merger, West Street Merger Sub, Inc expects to finance the transaction by borrowing of $2.065 billion under a new senior secured term loan facility and the entry into a new $300 million senior secured revolving credit facility, issue $770 million of notes and contribute approximately $2.633 billion of common equity.
We have incurred $7.7 million as of June 30, 2017, and will continue to incur significant costs and expenses, including fees for professional services and other transaction costs, in connection with the merger.
We have three reporting segments: Clinical Research Services ("CRS"), PAREXEL Consulting Services (“PC”), and PAREXEL Informatics ("PI").
• | CRS constitutes our core business and includes all phases of clinical research from Early Phase (encompassing the early stages of clinical testing that range from first-in-man through proof-of-concept studies) to Phase II-III and Phase IV, which we call PAREXEL Access, formerly known as Peri/Post-Approval Services. Our services include clinical trials management and biostatistics, data management and clinical pharmacology, as well as related medical advisory, patient recruitment, pharmacovigilance, and investigator site services. CRS also includes our clinical supply and drug logistics business. We have aggregated Early Phase and PAREXEL Access with Phase II-III due to economic similarities in these operating segments. |
34
• | PC provides technical expertise and advice in such areas as drug development, regulatory affairs, product pricing and reimbursement, commercialization and strategic compliance. It also provides a full spectrum of market development, product development, and targeted communications services in support of product launch. Our PC consultants identify alternatives and propose solutions to address client issues associated with product development, registration, and commercialization. |
• | PI provides information technology solutions designed to help improve clients’ product development and regulatory submission processes. PI offers a portfolio of products and services that includes medical imaging services, ClinPhone® RTSM, IMPACT® CTMS, DataLabs® EDC, web-based portals, systems integration, electronic patient reported outcomes (“ePRO”) and the LIQUENT InSight® RIM platform. These services are often bundled together and integrated with other applications to provide an eClinical solution for our clients. In addition, PI's portfolio of services is increasingly being embedded with that of CRS to provide our clients with an integrated offering. |
We conduct a significant portion of our operations in countries outside of the United States. Approximately 56% and 57% of our consolidated service revenue for the fiscal year ended June 30, 2017 (“Fiscal Year 2017”) and the fiscal year ended June 30, 2016 (“Fiscal Year 2016”), respectively, were from non-U.S. operations. Because our financial statements are denominated in U.S. dollars, changes in foreign currency exchange rates can have a significant effect on our operating results. For Fiscal Year 2017, approximately 12.1% of total consolidated service revenue was from euro-denominated contracts, approximately 3.6% of total consolidated service revenue was from yen-denominated contracts, and approximately 1.9% of total consolidated service revenue was from pound sterling-denominated contracts. For Fiscal Year 2016, approximately 9.8% of total consolidated service revenue was from euro-denominated contracts, approximately 2.4% of total consolidated service revenue was from yen-denominated contracts and approximately 2.3% of total consolidated service revenue was from pounds sterling-denominated contracts.
The majority of our contracts are fixed price, with some variable components, and range in duration from a few months to several years. Cash flows from these contracts typically consist of a down payment required at the time of contract execution with the balance due in installments over the contract’s duration, usually on a milestone achievement basis. Revenue from these contracts is recognized generally as work is performed. As a result, the timing of client billing and cash receipts do not necessarily correspond to costs incurred and revenue recognized on contracts.
Generally, our clients can either terminate their contracts with us upon notice of thirty to one hundred twenty days or can delay the execution of services. Clients may terminate or delay contracts for a variety of reasons, including: merger or potential merger-related activities involving the client, the failure of products being tested to satisfy safety requirements or efficacy criteria, unexpected or undesired clinical results of the product, client cost reductions as a result of budgetary limits or changing priorities, the client’s decision to forego a particular study, insufficient patient enrollment or investigator recruitment, or clinical drug manufacturing problems resulting in shortages of the product. In the cases where the contracts are canceled, services delivered through the cancellation date are due and payable by the client, including certain costs to conclude the trial or study.
CRITICAL ACCOUNTING POLICIES AND ESTIMATES
This discussion and analysis of our financial condition and results of operations are based on our consolidated financial statements, which have been prepared in accordance with accounting principles generally accepted in the U.S. The preparation of these financial statements requires us to make estimates and assumptions that affect the reported amounts of assets and liabilities, revenues and expenses, and other financial information. On an ongoing basis, we evaluate our estimates and judgments. We base our estimates on historical experience and on various other factors that we believe to be reasonable under the circumstances. Actual results may differ from these estimates under different assumptions or conditions.
We regard an accounting estimate underlying our financial statements as a “critical accounting estimate” if the nature of the estimate or assumption is material due to the level of subjectivity and judgment involved, or the susceptibility of such matter to change, and if the impact of the estimate or assumption on financial condition or operating performance is material. We believe that the following accounting policies are most critical to aid in fully understanding and evaluating our reported financial results:
REVENUE RECOGNITION
We derive revenue from the delivery of services or software solutions to clients in the worldwide pharmaceutical, biotechnology, and medical device industries. We recognize revenue as services are performed when all of the following conditions are satisfied: (1) there is persuasive evidence of an arrangement; (2) the service offering has been delivered to the client; (3) the collection of fees is probable; and (4) the amount of fees to be paid by the client is fixed or determinable.
Our client arrangements in CRS generally involve multiple service deliverables, where bundled service deliverables are accounted for in accordance with Financial Accounting Standards Board (“FASB”) Accounting Standards Codification (“ASC”) 605-25, “Multiple-Element Arrangements.” We determined that standalone value exists for each of our service deliverables and we allocate contract (arrangement) value to each of our service deliverables based on the relative selling price of each service deliverable in the arrangement. We use best estimated selling price (“BESP”) in our allocation of arrangement consideration. Our determination of BESP involves the consideration of several factors based on the specific facts and circumstances of each arrangement.
35
Specifically, we consider the cost to provide services, the anticipated margin on those deliverables, our ongoing pricing strategy and policies, and the characteristics of the varying markets in which the services are provided. We allocate arrangement consideration at the inception of the arrangement using the relative selling prices of the deliverables within the contract based on BESP.
Within PI’s Clinphone® RTSM business, we offer selected software solutions through a hosted application delivered through a standard web-browser. We recognize revenue from application hosting services in accordance with ASC 985-605, “Software” and ASC 605-25 as our customers do not have the right to take possession of the software. Revenue resulting from these hosting services is recognized over the service period.
Critical management estimates may be involved in the determination of the customer relationship period, and other revenue elements. Changes to these elements could affect the amount and timing of revenue recognition.
BILLED AND UNBILLED ACCOUNTS RECEIVABLE
Billed accounts receivable represent amounts for which invoices have been sent to clients based upon contract terms. Unbilled accounts receivable represent amounts recognized as revenue for which invoices have not yet been sent to clients due to contract terms. We maintain a provision for losses on receivables based on historical collectability and specific identification of potential problem accounts. Critical management estimates may be involved in the determination of “collectability” and the amounts required to be recorded as provisions for losses on receivables.
INCOME TAXES
Our global provision for corporate income taxes is determined in accordance with ASC 740, “Income Taxes,” which requires that deferred tax assets and liabilities be recognized for the effect of temporary differences between the book and tax basis of recorded assets and liabilities. A valuation allowance is established if it is more likely than not that future tax benefits from the deferred tax assets will not be realized. Income tax expense is based on the distribution of profit before tax among the various taxing jurisdictions in which we operate, adjusted as required by the tax laws of each taxing jurisdiction. Changes in the distribution of profits and losses among taxing jurisdictions may have a significant impact on our effective tax rate.
We account for uncertain tax positions in accordance with the provisions of ASC 740, which requires financial statement reporting of the expected future tax consequences of uncertain tax return reporting positions on the presumption that all relevant tax authorities possess full knowledge of those tax reporting positions, as well as all of the pertinent facts and circumstances. In addition, ASC 740 requires financial statement disclosure about uncertainty in income tax reporting positions.
We are subject to ongoing audits by federal, state and foreign tax authorities that may result in proposed assessments. Our estimate of the potential outcome for any uncertain tax issue is based on judgment. We believe we have adequately provided for any uncertain tax positions. However, future results may include favorable or unfavorable adjustments to our estimated tax liabilities in the period assessments are made or resolved or when statutes of limitation on potential assessments expire.
GOODWILL AND INDEFINITE-LIVED INTANGIBLES
Goodwill represents the excess of the cost of an acquired business over the fair value of the related net assets at the date of acquisition and is subject to annual impairment testing or more frequent testing if an event occurs or circumstances change that would more likely than not reduce the fair value below its carrying value. We have an option to make a qualitative assessment of a reporting unit’s goodwill and of indefinite-lived intangible assets for impairment. If we choose to perform a qualitative assessment and determine the fair value more likely than not exceeds the carrying value, no further evaluation is necessary. If we fail the qualitative assessment or choose to bypass the qualitative assessment, we assess our goodwill and indefinite-lived intangible asset using a two-step process.
We used the qualitative assessment option for our impairment testing in Fiscal Year 2017 for goodwill and determined that the fair values of the reporting units and the indefinite-lived intangible more likely than not exceeded their carrying values and that there was no evidence of impairment as of June 30, 2017. Our assessment of our indefinite-lived intangible, the ClinPhone RTSM tradename, for impairment uses a relief from royalty approach to determine fair value. Under the relief from royalty approach, the fair value of the indefinite-lived intangible is based on after tax royalty rate and discount rate applied to future forecasted sales. Based on our assessment of the ClinPhone RTSM tradename, there was no evidence of impairment as of June 30, 2017.
For our Fiscal Year 2016 assessment, we performed the two-step process, which uses a market approach analysis and a discounted cash flow analysis at the reporting unit level to determine fair value. The discounted cash flow analysis included significant judgment regarding the assumptions used, such as our weighted average cost of capital, revenue growth rates, profit margins, capital expenditures, and other factors that were all based on current strategic forecasts and other financial metrics. The assessment for our indefinite-lived intangible uses a relief from royalty approach to determine fair value. Under the relief from royalty approach, the fair value of the indefinite-lived intangible is based on the after tax royalty rate and discount rate applied to future forecasted sales. Based on our Fiscal Year 2016 assessment of impairment for goodwill and our ClinPhone RTSM tradename, there was no evidence of impairment as of June 30, 2016.
36
BUSINESS COMBINATIONS
Business combinations are accounted for under the acquisition method of accounting. Allocating the purchase price requires us to estimate the fair value of various assets acquired and liabilities assumed, including contingent consideration to be paid if specific financial targets are achieved. We are responsible for determining the appropriate valuation model and estimated fair values, and in doing so, we consider a number of factors, including information provided by an outside valuation advisor. We primarily establish fair value using the income approach based upon a discounted cash flow model. The income approach requires the use of many assumptions and estimates including future revenues and expenses, as well as discount factors and income tax rates.
Contingent consideration liabilities are remeasured to fair value each reporting period using projected financial targets, discount rates, probabilities of payment, and projected payment dates. Projected contingent payment amounts are discounted back to the current period using a discounted cash flow model. Increases or decreases in projected financial targets and probabilities of payment may result in significant changes in the fair value measurements. Increases in discount rates and the time to payment may result in lower fair value measurements. Increases or decreases in any of those inputs in isolation may result in a significantly lower or higher fair value measurement.
37
RESULTS OF OPERATIONS
Note 18 to our consolidated financial statements included in this annual report provides a summary of our unaudited quarterly results of operations for Fiscal Years 2017 and 2016.
ANALYSIS BY SEGMENT
We evaluate our segment performance and allocate resources based on service revenue and gross profit (service revenue less direct costs), while other operating costs are allocated and evaluated on a geographic basis. Accordingly, we do not include the impact of selling, general, and administrative expenses, depreciation and amortization expense, interest income (expense), other income (loss), and income tax expense (benefit) in segment profitability. We attribute revenue to individual countries based upon the cost of services performed in the respective countries and inter-segment transactions are not included in service revenue. Furthermore, we have a global infrastructure supporting our business segments and therefore, assets are not identified by reportable segment. Service revenue, direct costs, and gross profit on service revenue for Fiscal Years 2017, 2016, and 2015 were as follows:
(dollars in millions) | Years Ended | Increase/Decrease $ | Increase/Decrease % | ||||||||||||
June 30, 2017 | June 30, 2016 | ||||||||||||||
Service revenue | |||||||||||||||
CRS | $ | 1,626.6 | $ | 1,626.0 | $ | 0.6 | — | % | |||||||
PC | 210.3 | 190.4 | 19.9 | 10.5 | % | ||||||||||
PI | 280.7 | 277.9 | 2.8 | 1.0 | % | ||||||||||
Total service revenue | $ | 2,117.6 | $ | 2,094.3 | $ | 23.3 | 1.1 | % | |||||||
Direct costs | |||||||||||||||
CRS | $ | 1,111.9 | $ | 1,111.0 | $ | 0.9 | 0.1 | % | |||||||
PC | 120.5 | 102.2 | 18.3 | 17.9 | % | ||||||||||
PI | 145.1 | 147.1 | (2.0 | ) | (1.4 | )% | |||||||||
Total direct costs | $ | 1,377.5 | $ | 1,360.3 | $ | 17.2 | 1.3 | % | |||||||
Gross profit | |||||||||||||||
CRS | $ | 514.7 | $ | 515.0 | $ | (0.3 | ) | (0.1 | )% | ||||||
PC | 89.8 | 88.2 | 1.6 | 1.8 | % | ||||||||||
PI | 135.6 | 130.8 | 4.8 | 3.7 | % | ||||||||||
Total gross profit | $ | 740.1 | $ | 734.0 | $ | 6.1 | 0.8 | % | |||||||
(dollars in millions) | Years Ended | Increase/Decrease $ | Increase/Decrease % | ||||||||||||
June 30, 2016 | June 30, 2015 | ||||||||||||||
Service revenue | |||||||||||||||
CRS | $ | 1,626.0 | $ | 1,599.1 | $ | 26.9 | 1.7 | % | |||||||
PC | 190.4 | 152.2 | 38.2 | 25.1 | % | ||||||||||
PI | 277.9 | 264.7 | 13.2 | 5.0 | % | ||||||||||
Total service revenue | $ | 2,094.3 | $ | 2,016.0 | $ | 78.3 | 3.9 | % | |||||||
Direct costs | |||||||||||||||
CRS | $ | 1,111.0 | $ | 1,126.5 | $ | (15.5 | ) | (1.4 | )% | ||||||
PC | 102.2 | 80.5 | 21.7 | 27.0 | % | ||||||||||
PI | 147.1 | 137.2 | 9.9 | 7.2 | % | ||||||||||
Total direct costs | $ | 1,360.3 | $ | 1,344.2 | $ | 16.1 | 1.2 | % | |||||||
Gross profit | |||||||||||||||
CRS | $ | 515.0 | $ | 472.6 | $ | 42.4 | 9.0 | % | |||||||
PC | 88.2 | 71.7 | 16.5 | 23.0 | % | ||||||||||
PI | 130.8 | 127.5 | 3.3 | 2.6 | % | ||||||||||
Total gross profit | $ | 734.0 | $ | 671.8 | $ | 62.2 | 9.3 | % | |||||||
38
FISCAL YEAR ENDED JUNE 30, 2017 COMPARED WITH THE FISCAL YEAR ENDED JUNE 30, 2016
Revenue
Our service revenue by segment is as follows:
Year Ended June 30, | ||||||||||
(dollar amounts in millions) | 2017 | 2016 | Increase/(Decrease)% | |||||||
Service revenue | ||||||||||
CRS | $ | 1,626.6 | $ | 1,626.0 | — | % | ||||
PC | 210.3 | 190.4 | 10.5 | % | ||||||
PI | 280.7 | 277.9 | 1.0 | % | ||||||
Total service revenue | $ | 2,117.6 | $ | 2,094.3 | 1.1 | % | ||||
On a segment basis, CRS service revenue remained flat in Fiscal Year 2017 compared to Fiscal Year 2016. Revenue in Fiscal Year 2017 included $86.0 million and $10.6 million related to the acquisition of ExecuPharm and TMAC, respectively, offset by organic decline mostly driven by Phase II-III business due to cancellations and studies reaching completion across several strategic partners.
PC service revenue increased by 10.5% in Fiscal Year 2017 compared to Fiscal Year 2016. Higher service revenue is primarily driven by the Health Advances acquisition in the fourth quarter of Fiscal Year 2016, which resulted in a $22.2 million increase in service revenue. This impact was slightly offset by organic decline mostly due to projects reaching completion.
PI service revenue increased by 1.0% in Fiscal Year 2017 compared to Fiscal Year 2016. The increase was due primarily to growth in Medical Imaging and Regulatory Information Management Solutions.
Reimbursement revenue consists of reimbursable out-of-pocket expenses incurred on behalf of, and reimbursable by, clients. Reimbursement revenue does not yield any gross profit to us, nor does it have an impact on net income.
Direct Costs
Our direct costs and service gross profit by segment are as follows:
Year Ended June 30, | ||||||||||
(dollar amounts in millions) | 2017 | 2016 | Increase/(Decrease)% | |||||||
Direct costs | ||||||||||
CRS | $ | 1,111.9 | $ | 1,111.0 | 0.1 | % | ||||
PC | 120.5 | 102.2 | 17.9 | % | ||||||
PI | 145.1 | 147.1 | (1.4 | )% | ||||||
Total direct costs | $ | 1,377.5 | $ | 1,360.3 | 1.3 | % | ||||
Gross profit | ||||||||||
CRS | $ | 514.7 | $ | 515.0 | (0.1 | )% | ||||
PC | 89.8 | 88.2 | 1.8 | % | ||||||
PI | 135.6 | 130.8 | 3.7 | % | ||||||
Total gross profit | $ | 740.1 | $ | 734.0 | 0.8 | % | ||||
Direct costs increased by 1.3% in Fiscal Year 2017 compared to Fiscal Year 2016. As a percentage of total service revenue, direct costs remained at 65.1% for the respective periods. The gross margin was relatively flat due to more efficient staff utilization and savings from our Restructuring Programs
On a segment basis, CRS direct costs increased by 0.1% in Fiscal Year 2017 compared to Fiscal Year 2016. As a percentage of service revenue, CRS direct costs increased to 68.4% for Fiscal Year 2017 from 68.3% for Fiscal Year 2016. This increase resulted primarily from the business mix as well as the unfavorable impact of hedging.
PC direct costs increased by 17.9% in Fiscal Year 2017 compared to Fiscal Year 2016. This increase is primarily driven by the acquisition of Health Advances. As a percentage of service revenue, PC direct costs increased to 57.3% from 53.7% for the respective periods as a result of an increase in both fixed and variable cost and change in business mix.
39
PI direct costs decreased by 1.4% in Fiscal Year 2017 compared to Fiscal Year 2016.As result of cost control measures, PI direct costs, as percentage of service revenue, decreased to 51.7% for Fiscal Year 2017 from 52.9% for Fiscal Year 2016 due primarily to lower headcount and savings driven by restructuring programs.
Selling, General and Administrative (“SG&A”)
SG&A expense is summarized as follows:
Year Ended June 30, | ||||||||||
(dollar amounts in millions) | 2017 | 2016 | Increase/(Decrease)% | |||||||
Selling, general and administrative | $ | 401.3 | $ | 385.3 | 4.2 | % | ||||
% of service revenues | 19.0 | % | 18.4 | % | ||||||
SG&A expense increased by 4.2% in Fiscal Year 2017 compared to Fiscal Year 2016. This increase was due primarily to an increase in pay raises offset by decrease in MIP, and an increase in professional fees related to the announced merger. This increase was partially offset by the savings in rent due to the Company restructuring program. As a percentage of service revenue, SG&A is slightly higher at 19.0% in Fiscal Year 2017 compared to 18.4% in Fiscal Year 2016.
Depreciation and Amortization (“D&A”)
D&A expense is summarized as follows:
Year Ended June 30, | ||||||||||
(dollar amounts in millions) | 2017 | 2016 | Increase/(Decrease)% | |||||||
Depreciation and amortization | $ | 106.4 | $ | 96.9 | 9.8 | % | ||||
% of service revenues | 5.0 | % | 4.6 | % | ||||||
D&A expense increased by 9.8% in Fiscal Year 2017 compared to Fiscal Year 2016, due primarily to higher intangible assets amortization expense of $5.4 million attributed to the acquisitions of ExecuPharm and TMAC during Fiscal Year 2017 and Health Advances in second half of Fiscal Year 2016. The remaining increase in depreciation expense was due to an increase in capital spending. As a percentage of service revenue, D&A was 5.0% in Fiscal Year 2017, up from 4.6% in Fiscal Year 2016.
Restructuring Charge
Restructuring charge is summarized as follows:
Year Ended June 30, | ||||||||||
(dollar amounts in millions) | 2017 | 2016 | Increase/(Decrease)% | |||||||
Restructuring charge | $ | 41.2 | $ | 27.8 | 48.2 | % | ||||
In January 2017, we approved a plan to restructure our operations to improve the productivity and efficiency of the company, simplify the organization, and streamline decision-making, thereby enhancing client engagement. In May 2017, the Company approved an expansion of the 2017 Restructuring Program. The restructuring initiatives are company-wide. These actions are expected to result in pre-tax charges in the range of $50.0 million to $64.0 million, all of which are anticipated to be cash expenditures. For Fiscal Year 2017 we recorded a $40.7 million restructuring charge for the new program, of which employee separation benefits amounted to $39.7 million, the remaining $1.0 million relates to facilities separation costs. We expect the remainder of the charges to be incurred by the end of the fiscal year ending June 30, 2018 (“Fiscal Year 2018”). The charges will include approximately $8.0 million to $20.0 million in employee separation costs and approximately $1.0 million to $3.0 million in other costs. We anticipate completing restructuring activities by the end of Fiscal Year 2018, and the charges resulted in pre-tax savings of approximately $9.5 million over the course of Fiscal Year 2017 and we estimate approximately $85.0 million to $95.0 million on an annual basis when fully completed.
40
Income from Operations
Year Ended June 30, | ||||||||||
(dollar amounts in millions) | 2017 | 2016 | Increase/(Decrease)% | |||||||
Income from operations | $ | 191.2 | $ | 224.0 | (14.6 | )% | ||||
Operating margin | 9.0 | % | 10.7 | % | ||||||
The decline in income from operations and income from operations as a percentage of service revenue (“operating margin”) was driven by an increase in restructuring charges as well as by higher direct costs as the result of additional expenses incurred relating to the Pamplona merger and additional restructuring programs.
Other Expense, Net
Other expense, net is summarized as follows:
Year Ended June 30, | ||||||||||
(dollar amounts in millions) | 2017 | 2016 | Increase/(Decrease)% | |||||||
Interest expense, net | $ | (12.3 | ) | $ | (8.6 | ) | 43.0 | % | ||
Miscellaneous expense | (22.7 | ) | (0.2 | ) | >1000% | |||||
Other expense, net | $ | (35.0 | ) | $ | (8.8 | ) | >1000% | |||
The $26.2 million increase in net expenses was driven primarily by a $22.5 million increase in miscellaneous expense, due primarily to a loss on a forward accelerated share repurchase contract amounting to $20.7 million and further impacted by the net foreign currency exchange losses recorded during Fiscal Year 2017, compared to the net foreign currency exchange gains recorded during Fiscal Year 2016 and $3.7 million increase in net interest expense related to a higher average debt balance in Fiscal Year 2017.
Taxes
The following table presents the provision for income taxes and our effective tax rate for the years ended June 30, 2017 and 2016:
Year Ended June 30, | ||||||||||
(dollar amounts in millions) | 2017 | 2016 | Increase/(Decrease)% | |||||||
Provision for income taxes | $ | 48.9 | $ | 60.3 | (18.9 | )% | ||||
Effective tax rate | 31.3 | % | 28.0 | % | ||||||
The increase in the Fiscal Year 2017 tax rate was primarily attributable to the non-deductibility of the unrealized loss in connection with the accelerated share repurchase program, as well as certain R&D tax benefits being recorded outside of the provision for income taxes during Fiscal Year 2017 due to a change in law, offset by a benefit from the adoption of ASU 2016-09.
FISCAL YEAR ENDED JUNE 30, 2016 COMPARED WITH THE FISCAL YEAR ENDED JUNE 30, 2015
Revenue
Our service revenue by segment is as follows:
Year Ended June 30, | ||||||||||
(dollar amounts in millions) | 2016 | 2015 | Increase/(Decrease)% | |||||||
Service revenue | ||||||||||
CRS | $ | 1,626.0 | $ | 1,599.1 | 1.7 | % | ||||
PC | 190.4 | 152.2 | 25.1 | % | ||||||
PI | 277.9 | 264.7 | 5.0 | % | ||||||
Total service revenue | $ | 2,094.3 | $ | 2,016.0 | 3.9 | % | ||||
On a segment basis, CRS service revenue increased by 1.7% in Fiscal Year 2016 compared to Fiscal Year 2015. The increase was attributable to growth in both the Phase II-III and the Early Phase businesses. Compared to the prior year period growth was slower
41
due to the increasing complexity of clinical trials and certain large late-phase studies reaching completion. Within the Phase II-III business, revenue increased due primarily to study ramp-up across several strategic partners. The Early Phase business increases were due primarily to growth and new capabilities.
PC service revenue increased by 25.1% in Fiscal Year 2016 compared to Fiscal Year 2015. Higher service revenue was due primarily to an increase in revenues from expanded client relationships and new business wins. Revenue in Fiscal Year 2016 included $12.2 million related to the acquisition of Health Advances.
PI service revenue increased by 5.0% in Fiscal Year 2016 compared to Fiscal Year 2015. The increase was due primarily to growth in Medical Imaging and Regulatory Information Management Solutions.
Reimbursement revenue consists of reimbursable out-of-pocket expenses incurred on behalf of and reimbursable by clients. Reimbursement revenue does not yield any gross profit to us, nor does it have an impact on net income.
Direct Costs
Our direct costs and service gross profit by segment are as follows:
Year Ended June 30, | ||||||||||
(dollar amounts in millions) | 2016 | 2015 | Increase/(Decrease)% | |||||||
Direct costs | ||||||||||
CRS | $ | 1,111.0 | $ | 1,126.5 | (1.4 | )% | ||||
PC | 102.2 | 80.5 | 27.0 | % | ||||||
PI | 147.1 | 137.2 | 7.2 | % | ||||||
Total direct costs | $ | 1,360.3 | $ | 1,344.2 | 1.2 | % | ||||
Gross profit | ||||||||||
CRS | $ | 515.0 | $ | 472.6 | 9.0 | % | ||||
PC | 88.2 | 71.7 | 23.0 | % | ||||||
PI | 130.8 | 127.5 | 2.6 | % | ||||||
Total gross profit | $ | 734.0 | $ | 671.8 | 9.3 | % | ||||
Direct costs increased by 1.2% in Fiscal Year 2016 compared to Fiscal Year 2015. As a percentage of total service revenue, direct costs decreased to 65.0% from 66.7% for the respective periods. The gross margin increase primarily related to more efficient staff utilization and savings from our Margin Acceleration Program (“MAP”).
On a segment basis, CRS direct costs decreased by 1.4% in Fiscal Year 2016 compared to Fiscal Year 2015. This decrease resulted primarily from decreased labor costs. As a percentage of service revenue, CRS direct costs decreased to 68.3% for Fiscal Year 2016 from 70.4% for Fiscal Year 2015. The decrease as a percentage of service revenue was primarily related to our MAP.
PC direct costs increased by 27.0% in Fiscal Year 2016 compared to Fiscal Year 2015. As a percentage of service revenue, PC direct costs increased to 53.7% from 52.9% for the respective periods as a result of an increase in both fixed and variable compensation costs.
PI direct costs increased by 7.2% in Fiscal Year 2016 compared to Fiscal Year 2015. As a percentage of service revenue, PI direct costs increased to 52.9% for Fiscal Year 2016 from 51.8% for Fiscal Year 2015 due primarily to revenue growth in our Medical Imaging and Regulatory Solutions business.
SG&A
SG&A expense is summarized as follows:
Year Ended June 30, | ||||||||||
(dollar amounts in millions) | 2016 | 2015 | Increase/(Decrease)% | |||||||
Selling, general and administrative | $ | 385.3 | $ | 367.2 | 4.9 | % | ||||
% of service revenues | 18.4 | % | 18.2 | % | ||||||
SG&A expense increased by 4.9% in Fiscal Year 2016 compared to Fiscal Year 2015. This increase was due primarily to an increase in fixed and variable compensation costs, an increase in costs incurred to support our information technology infrastructure and
42
a $16.1 million change for the fair value adjustment of contingent consideration related to acquisitions. This increase was partially offset by the favorable impact of foreign currency exchange rate movements and savings from our MAP. As a percentage of service revenue, SG&A remained relatively flat at 18.4% in Fiscal Year 2016 compared to 18.2% in Fiscal Year 2015.
D&A
D&A expense is summarized as follows:
Year Ended June 30, | ||||||||||
(dollar amounts in millions) | 2016 | 2015 | Increase/(Decrease)% | |||||||
Depreciation and amortization | $ | 96.9 | $ | 84.9 | 14.1 | % | ||||
% of service revenues | 4.6 | % | 4.2 | % | ||||||
D&A expense increased by 14.1% in Fiscal Year 2016 compared to Fiscal Year 2015, due primarily to higher amortization expense, $9.4 million of which related to the acquisitions of QSI and Health Advances, as well as higher depreciation expense related to increased capital spending. As a percentage of service revenue, D&A was 4.6% in Fiscal Year 2016, up from 4.2% in Fiscal Year 2015.
Restructuring Charge
Restructuring charge is summarized as follows:
Year Ended June 30, | ||||||||||
(dollar amounts in millions) | 2016 | 2015 | Increase/(Decrease)% | |||||||
Restructuring charge | $ | 27.8 | $ | 19.8 | 40.4 | % | ||||
For Fiscal Year 2016 we recorded a net $27.8 million restructuring charge related to MAP, announced in June 2015. In Fiscal Year 2015, we recorded a net $19.8 million restructuring charge, substantially all of which related to our MAP. We recorded $47.8 million in restructuring charges related to the MAP program since its announcement in June 2015, which consisted of $38.5 million of employee separation benefits and $9.3 million of facility exit and other costs.
Income from Operations
Year Ended June 30, | ||||||||||
(dollar amounts in millions) | 2016 | 2015 | Increase/(Decrease)% | |||||||
Income from operations | $ | 224.0 | $ | 199.9 | 12.1 | % | ||||
Operating margin | 10.7 | % | 9.9 | % | ||||||
The increase in income from operations and income from operations as a percentage of service revenue (“operating margin”) was due primarily to higher service revenue and relatively flat direct costs due primarily to savings from our MAP that were partially offset by increased incentive compensation costs, contingent consideration and higher D&A.
Other Expense, Net
Other (expense) income, net is summarized as follows:
Year Ended June 30, | ||||||||||
(dollar amounts in millions) | 2016 | 2015 | Increase/(Decrease)% | |||||||
Interest expense, net | $ | (8.6 | ) | $ | (7.1 | ) | 21.1 | % | ||
Miscellaneous (expense) income | (0.2 | ) | 7.4 | (102.7 | )% | |||||
Other income, net | $ | (8.8 | ) | $ | 0.3 | >1000% | ||||
The $9.1 million increase in net expenses was driven primarily by a $7.6 million increase in miscellaneous expense, due primarily to net foreign currency exchange losses recorded during Fiscal Year 2016 compared to the net foreign currency exchange gains recorded during Fiscal Year 2015. Additionally, the increase was attributable in part to a $1.5 million increase in net interest expense related to a higher average debt balance in Fiscal Year 2016.
43
Taxes
The following table presents the provision for income taxes and our effective tax rate for the years ended June 30, 2016 and 2015:
Year Ended June 30, | ||||||||||
(dollar amounts in millions) | 2016 | 2015 | Increase/(Decrease)% | |||||||
Provision for income taxes | $ | 60.3 | $ | 52.4 | 15.1 | % | ||||
Effective tax rate | 28.0 | % | 26.2 | % | ||||||
The increase in the Fiscal Year 2016 tax rate was primarily attributable to the reduction of tax credits and incentives in various jurisdictions compared to the prior year period, offset by a benefit from favorable changes in the jurisdictional distribution of our profits.
LIQUIDITY AND CAPITAL RESOURCES
Since our inception, we have financed our operations and growth with cash flow from operations, proceeds from the sale of equity securities, and credit facilities to fund business acquisitions and working capital. Investing activities primarily reflect capital expenditures for information systems enhancements, leasehold improvements and business combinations. As of June 30, 2017, we had cash and cash equivalents of approximately $302.7 million, of which $276.4 million is held in countries which are outside of the U.S. since excess cash generated in the U.S. is primarily used to repay our debt obligations. As of June 30, 2017 we did not hold any marketable securities. Foreign cash includes unremitted foreign earnings, which are invested indefinitely outside of the U.S. Our cash and cash equivalents are primarily held in deposit accounts which provide us with immediate and unlimited access to the funds. Repatriation of funds to the U.S. from non-U.S. entities may be subject to taxation or certain legal restrictions. Nevertheless, most of our cash resides in countries with few or no such restrictions.
DAYS SALES OUTSTANDING
Our operating cash flow is heavily influenced by changes in the levels of billed and unbilled receivables and deferred revenue. These account balances as well as days sales outstanding (“DSO”) in accounts receivable, net of deferred revenue, can vary based on contractual milestones and the timing and size of cash receipts. We calculate DSO by adding end-of-period balances for billed and unbilled account receivables, net of deferred revenue (short-term and long term) and the provision for losses on receivables, then dividing the resulting amount by the sum of total revenue plus investigator fees billed for the most recent quarter, and multiplying the resulting fraction by the number of days in the quarter. The following table presents the DSO, account receivables balances, and deferred revenue as of June 30, 2017 and June 30, 2016.
(dollars in millions) | June 30, 2017 | June 30, 2016 | ||||||
Billed accounts receivable, net | $ | 588.2 | $ | 506.1 | ||||
Unbilled accounts receivable, net | 306.4 | 327.9 | ||||||
Total accounts receivable | 894.6 | 834.0 | ||||||
Deferred revenue | (522.9 | ) | (458.5 | ) | ||||
Net receivables | $ | 371.7 | $ | 375.5 | ||||
DSO (in days) | 45 | 48 | ||||||
The decrease in DSO for the quarter ended June 30, 2017 compared to the quarter ended June 30, 2016, is due to better cash collections and contractual billing terms. This resulted in a higher deferred revenue and lower unbilled accounts receivables, offset by an increase in billed accounts receivables in quarter ending June 30, 2017.
44
CASH FLOWS
Sources and uses of cash flows are summarized as follows:
Year Ended June 30, | % Change | |||||||||||||||||
(dollar amounts in millions) | 2017 | 2016 | 2015 | 2017 Compared to 2016 | 2016 Compared to 2015 | |||||||||||||
Net cash provided by operating activities | $ | 306.4 | $ | 261.3 | $ | 157.8 | 17.3 | % | 65.6 | % | ||||||||
Net cash used in investing activities | (257.2 | ) | (162.8 | ) | (96.1 | ) | 58.0 | % | 69.4 | % | ||||||||
Net cash (used in) provided by financing activities | 4.0 | (45.5 | ) | 26.2 | (108.8 | )% | (273.7 | )% | ||||||||||
Effect of exchange rate changes on cash and cash equivalents | 0.9 | (11.8 | ) | (68.7 | ) | (107.6 | )% | (82.8 | )% | |||||||||
Net increase in cash and cash equivalents | $ | 54.1 | $ | 41.2 | $ | 19.2 | 31.3 | % | 114.6 | % | ||||||||
Operating Activities
The cash flows provided by operating activities for Fiscal Year 2017 primarily resulted from $107.3 million in net income, $106.4 million in depreciation and amortization, and offset by changes in working capital. The changes in working capital were primarily driven by a $23.6 million increase in billed and unbilled accounts receivable, excluding accounts receivable arising from acquisitions, offset by a $67.8 million increase in deferred revenue, and a $23.6 million decrease in accrued expenses and other current liabilities. The increase in billed accounts receivable was due to increased revenue. The decrease in unbilled accounts receivable was due to the timing of the achievement of billing milestones compared with the delivery of units for revenue recognition purposes. The increase in deferred revenue was due primarily to a higher amount of deposits from key sponsors for reimbursable costs and investigator payments. The increase in our accrued expenses and other current liabilities was due primarily to the increased severance provision.
The cash flows provided by operating activities for Fiscal Year 2016 primarily resulted from $154.9 million in net income, $96.9 million in depreciation and amortization, and offset by changes in working capital. The changes in working capital were primarily driven by a $122.1 million increase in billed and unbilled accounts receivable, offset by a $58.2 million increase in deferred revenue, and a $32.7 million increase in accrued expenses and other current liabilities. The increase in billed accounts receivable was due to increased revenue. The increase in unbilled accounts receivable was due to the timing of the achievement of billing milestones compared with the delivery of units for revenue recognition purposes. The increase in deferred revenue was due primarily to a higher amount of deposits from key sponsors for reimbursable costs and investigator payments. The increase in our accrued expenses and other current liabilities was due primarily to the increase in variable compensation costs.
The cash flows provided by operating activities for Fiscal Year 2015 primarily resulted from $147.8 million in net income, $84.9 million in depreciation and amortization, and changes in working capital. The changes in working capital were primarily driven by a $33.7 million decrease in deferred revenue, and a $19.0 million increase in accounts payable, offset in part by a $24.5 million increase in billed and unbilled accounts receivable. The decrease in deferred revenue was due primarily to a lower amount of deposits from key sponsors for reimbursable costs and investigator payments. The increase in billed and unbilled accounts receivable was due to the timing of the achievement of billing milestones compared with the delivery of units for revenue recognition purposes. The increase in our accounts payable was due primarily to the timing of invoice receipts and payments.
Investing Activities
Net cash used for investing activities was $257.2 million for Fiscal Year 2017 as compared with $162.8 million for Fiscal Year 2016 and $96.1 million for Fiscal Year 2015.
During Fiscal Year 2017, we spent $184.6 million for business acquisitions and made $72.6 million in capital expenditures.
During Fiscal Year 2016, we spent $67.3 million for business acquisitions and made $95.5 million in capital expenditures.
During Fiscal Year 2015, we spent $104.5 million for business acquisitions and made $80.2 million in capital expenditures, which was partially offset by our receipt of $88.6 million in proceeds we received from the sale of marketable securities.
Financing Activities
Net cash provided by financing activities was $4.0 million for Fiscal Year 2017, as compared with net cash used in financing activities of $45.5 million for Fiscal Year 2016 and $26.2 million of net cash provided by financing activities for Fiscal Year 2015.
45
During Fiscal Year 2017, we paid $200.0 million as part of the accelerated share repurchase program and borrowed a net $163.4 million under the 2016 Credit Agreement (as defined below). In addition we received $34.3 million proceeds related to employee stock purchases and $6.4 million related to borrowing proceeds under a factoring agreement and accounted for as our debt.
During Fiscal Year 2016, we paid $200.0 million as part of the accelerated share repurchase program and borrowed a net $147.3 million under the 2016 Credit Agreement (as defined below). In addition we paid $9.9 million related to the contingent consideration for a previous acquisition and had debt issuance costs of $1.0 million related to the 2016 Credit Agreement (as defined below), partially offset by $18.1 million in proceeds related to employee stock purchases.
During Fiscal Year 2015, we received $7.1 million under the Master Financing Agreement (as defined below) and received $19.8 million in proceeds related to employee stock purchases. These amounts were partially offset by debt issuance costs of $0.7 million related to the 2014 Credit Agreement.
CREDIT AGREEMENTS
2016 Credit Agreement
On March 11, 2016, PAREXEL, certain subsidiaries of PAREXEL; Bank of America, N.A. (“Bank of America”), as Administrative Agent, Swingline Lender and L/C Issuer; Merrill Lynch, Pierce, Fenner & Smith Incorporated (“MLPFS”); HSBC Bank USA, National Association (“HSBC”); U.S. Bank, National Association (“US Bank”); TD Securities (USA) LLC (“TD Securities”) and Wells Fargo Securities, LLC (“Wells Fargo Securities”) as Joint Lead Arrangers and Joint Book Managers, HSBC, US Bank, TD Bank, N.A. (“TD Bank”) and Wells Fargo Bank, National Association (“Wells Fargo Bank”) as Joint Syndication Agents, and the other lenders party thereto entered into an amended and restated credit agreement (the “2016 Credit Agreement”) providing for a five-year term loan and revolving credit facility in the principal amount of up to $750.0 million (collectively, the “Loan Amount”), plus additional amounts of up to $300.0 million of loans to be made available upon request of the Company subject to specified terms and conditions.
The 2016 Credit Agreement amends and restates the amended and restated credit agreement dated as of October 15, 2014, (the “2014 Credit Agreement”), by and among the Company, certain subsidiaries of the Company, Bank of America, as Administrative Agent, Swingline Lender and L/C Issuer; MLPFS, J.P. Morgan Securities LLC, HSBC; and US Bank, as Joint Lead Arrangers and Joint Book Managers; JPMorgan Chase Bank N.A.; HSBC and US Bank, as Joint Syndication Agents, and the other lenders party thereto.
The 2016 Credit Agreement provides for a revolving credit facility in the principal amount of up to $350.0 million from time to time outstanding. A portion of the revolving credit facility is available for swingline loans of up to a sublimit of $100.0 million and for the issuance of standby letters of credit up to a sublimit of $10.0 million.
The 2016 Credit Agreement is intended to provide funds (i) for stock repurchases, (ii) for the issuance of letters of credit and (iii) for other general corporate purposes of PAREXEL and its subsidiaries, including permitted acquisitions.
On the closing date of March 11, 2016, after giving effect to the amendment and restatement of the 2014 Credit Agreement and the effectiveness of the 2016 Credit Agreement, the Company was obligated under the 2016 Credit Agreement for term loans in the principal amount of $400.0 million and revolving loans in the principal amount of $65.0 million.
As of June 30, 2017, we had $180.0 million principal borrowed under the revolving credit facility and $385.0 million of principal borrowed under the term loan. The outstanding amount is presented net of debt issuance costs of approximately $2.4 million in our consolidated balance sheet at June 30, 2017. As of June 30, 2017, we had borrowing availability of $170.0 million under the revolving credit facility.
PAREXEL’s obligations under the 2016 Credit Agreement are guaranteed by certain material domestic subsidiaries of the Company, and the obligations, if any, of any foreign designated borrower are guaranteed by the Company and certain of its material domestic subsidiaries.
Borrowings (other than swingline loans) under the 2016 Credit Agreement bear interest, at PAREXEL’s determination, at a rate based on either (a) LIBOR plus a margin (not to exceed a per annum rate of 2.0%) based on a ratio of consolidated net funded debt to consolidated earnings before interest, taxes, depreciation and amortization (EBITDA) (the “Consolidated Net Leverage Ratio”) or (b) the highest of (i) prime, (ii) the federal funds rate plus 50 basis points, and (iii) the one month LIBOR rate plus 100 basis points (such highest rate, the “Alternate Base Rate”), plus a margin (not to exceed a per annum rate of 1.0%) based on the Consolidated Net Leverage Ratio. Swingline loans in U.S. dollars bear interest calculated at the Alternate Base Rate plus a margin (not to exceed a per annum rate of 1.0%). Loans outstanding under the 2016 Credit Agreement may be prepaid at any time in whole or in part without premium or penalty, other than customary breakage costs, if any, subject to the terms and conditions contained in the 2016 Credit Agreement. The 2016 Credit Agreement terminates and any outstanding loans under it mature on March 11, 2021.
46
Repayment of the principal borrowed under the revolving credit facility (other than a swingline loan) is due on March 11, 2021. A swingline loan under the 2016 Credit Agreement generally must be paid ten (10) business days after the loan is made. Repayment of principal borrowed under the term loan facility is as follows, with the final payment of all amounts outstanding, plus accrued interest, being due on March 11, 2021:
• | 0.63% by quarterly term loan amortization payments to be made commencing June 30, 2016. and made on or prior to June 30, 2017; |
• | 1.25% by quarterly term loan amortization payments to be made on or after June 30, 2017, but on or prior to March 31, 2019; |
• | 1.88% by quarterly term loan amortization payments to be made on or after June 30, 2019, but on or prior to March 31, 2020; |
• | 2.50% by quarterly term loan amortization payments to be made on or after June 30, 2020, but prior to March 11, 2021; and |
• | 72.50% (or if less, the remaining principal amount of the term loan) on March 11, 2021. |
To the extent not previously paid, all borrowings under the 2016 Credit Agreement must be repaid on March 11, 2021.
Interest due under the revolving credit facility (other than a swingline loan) and the term loan facility must be paid quarterly for borrowings with an interest rate determined with reference to the Alternate Base Rate. Interest must be paid on the last day of the interest period selected by the Company for borrowings determined with reference to LIBOR; provided that for interest periods of longer than three months, interest is required to be paid every three months. Interest under US dollar swingline loans at the alternate base rate is payable quarterly.
The obligations of PAREXEL under the 2016 Credit Agreement may be accelerated upon the occurrence of an event of default under the 2016 Credit Agreement, which includes customary events of default, including payment defaults, defaults in the performance of affirmative and negative covenants, the inaccuracy of representations or warranties, bankruptcy and insolvency related defaults, cross defaults to material indebtedness, defaults relating to such matters as ERISA and judgments, and a change of control default.
The 2016 Credit Agreement contains negative covenants applicable to PAREXEL and its subsidiaries, including financial covenants requiring PAREXEL to comply with a maximum net leverage ratio and a minimum interest coverage ratio, as well as restrictions on liens, investments, indebtedness, fundamental changes, acquisitions, dispositions of property, making specified restricted payments (including cash dividends and stock repurchases that would result in the Company exceeding an agreed to Consolidated Net Leverage Ratio), transactions with affiliates, and other restrictive covenants. As of June 30, 2017, we were in compliance with all covenants under the 2016 Credit Agreement.
Under the terms of the 2016 Credit Agreement, neither we nor any of our subsidiaries may pay any dividend or make any other distribution with respect to any shares of capital stock except that (a) we may declare and pay dividends with respect to equity interests payable solely in additional shares of common stock, (b) our subsidiaries may declare and pay dividends and other distributions ratably with respect to their equity interests, (c) we may make payments pursuant to and in accordance with stock option plans or other benefit plans for management or employees of the Company and our subsidiaries, and (d) the Company and certain of its subsidiaries may make payments in connection with permitted repurchases of their respective capital stock.
In connection with the 2016 Credit Agreement, PAREXEL agreed to pay a commitment fee on the revolving loan commitment calculated as a percentage of the unused amount of the revolving loan commitment at a per annum rate of up to 0.250% (based on the Consolidated Net Leverage Ratio). To the extent there are letters of credit outstanding under the 2016 Credit Agreement, PAREXEL will pay letter of credit fees plus a fronting fee and additional charges. PAREXEL agreed to pay (i) Bank of America for its own account, an arrangement fee, (ii) to each of the lenders on the closing date, an upfront fee, and (iii) to Bank of America for its own account, an annual agency fee.
In May 2013, we entered into a five year interest rate swap agreement and hedged an additional principal amount of $100.0 million under the 2013 Credit Agreement with a fixed interest rate of 0.73%. The interest rate swap agreement now hedges $100.0 million of principal under our 2016 Credit Agreement.
On October 1, 2015, we entered into a two year interest rate swap agreement effective September 30, 2016, which now hedges an additional principal amount of $100.0 million under the 2016 Credit Agreement with a fixed interest rate 1.104%.
On April 26, 2017, we entered into a four year interest rate swap agreement effective April 28, 2017, which now hedges an additional principal amount of $100.0 million under the 2016 Credit Agreement with a fixed interest rate 1.7680%.
All interest rate hedges were deemed to be fully effective in accordance with ASC 815 and, as such, unrealized gains and losses related to these derivatives are recorded as other comprehensive income in our consolidated balance sheets.
47
2014 Credit Agreement
The 2014 Credit Agreement provided for a five-year term loan and revolving credit facility in the principal amount of up to $500.0 million (collectively, the “Loan Amount”), plus additional amounts of up to $300.0 million of loans to be made available upon request of the Company subject to specified terms and conditions. The loan facility available under the 2014 Credit Agreement consisted of a term loan facility and a revolving credit facility. The principal amount of up to $200.0 million of the Loan Amount was available through the term loan facility, and the principal amount of up to $300.0 million of the Loan Amount was available through the revolving credit facility. A portion of the revolving credit facility was available for swingline loans of up to a sublimit of $100.0 million and for the issuance of standby letters of credit of up to a sublimit of $10.0 million.
Our obligations under the 2014 Credit Agreement were guaranteed by certain of our material domestic subsidiaries, and the obligations, if any, of any foreign designated borrower were guaranteed by us and certain of our material domestic subsidiaries.
The 2014 Credit Agreement was superseded by the 2016 Credit Agreement and as of June 30, 2016 all outstanding amounts under the 2014 Credit Agreement were fully repaid.
2016 Term Loan Agreement
On February 10, 2016, PAREXEL entered into a short term unsecured term loan agreement with TD Bank, providing for a loan to the Company in the amount of $75.0 million (the “Loan”). The Loan would have matured on April 30, 2016 unless earlier payment has been required under the terms of the Company loan agreement with TD Bank. The Loan bore interest, at PAREXEL’s determination, at a base rate plus a margin (such margin not to exceed a per annum rate of 0.750%) based on a ratio of consolidated funded debt to consolidated earnings before interest, taxes, depreciation and amortization (EBITDA) for the prior four fiscal quarters (the “Leverage Ratio”), or at a LIBOR rate plus a margin (such margin not to exceed a per annum rate of 1.750%) based on the Leverage Ratio. The Loan could have been prepaid at any time in whole or in part without premium or penalty, other than customary breakage costs, if any, subject to the terms and conditions of the loan agreement.
The proceeds of the Loan were advanced to the Company on February 12, 2016 and were used to repay borrowings under the Company’s 2014 Facility.
The obligations of PAREXEL under the Loan could have been accelerated upon the occurrence of an event of default under the Loan, which included customary events of default, including payment defaults, the inaccuracy of representations or warranties and cross defaults to the 2014 Facility.
As of June 30, 2017, all outstanding amounts under the Loan were fully repaid with the proceeds from the 2016 Credit Agreement.
Master Financing Agreement
On June 12, 2015, we entered into a 3 year, interest free Master Financing Agreement for $7.1 million with General Electric Capital Corporation, (“GECC”), in conjunction with a software term license purchase. On June 30, 2015 we received the gross proceeds of $7.1 million from GECC. Repayment of the principal borrowed under the Master Financing Agreement is due annually on July 1st as follows:
• | $1.4 million made on or prior to July 1, 2015; |
• | $2.8 million made on or prior to July 1, 2016; and |
• | $2.8 million made on or prior to July 1, 2017. |
As of June 30, 2017, we had $2.8 million principal borrowed under the Master Financing Agreement.
Note Purchase Agreement
On July 25, 2013, we issued $100.0 million principal amount of 3.11% senior notes due July 25, 2020 (the “Notes”) for aggregate gross proceeds of $100.0 million in a private placement solely to accredited investors. The Notes were issued pursuant to a Note Purchase Agreement entered into by us with certain institutional investors on June 25, 2013 (the “Note Purchase Agreement”). Proceeds from the Notes were used to pay down $100.0 million of principal borrowed under the revolving credit facility portion of the 2013 Credit Agreement. We will pay interest on the outstanding balance of the Notes at a rate of 3.11% per annum, payable semi-annually on January 25 and July 25 of each year until the principal on the Notes shall have become due and payable. We may, at our option, upon notice and subject to the terms of the Note Purchase Agreement, prepay at any time all or part of the Notes in an amount not less than 10% of the aggregate principal amount of the Notes then outstanding, plus a Make-Whole Amount (as defined in the Note Purchase Agreement). The Notes become due and payable on July 25, 2020, unless payment is required to be made earlier under the terms of the Note Purchase Agreement.
The Note Purchase Agreement includes operational and financial covenants, with which we are required to comply, including, among others, maintenance of certain financial ratios and restrictions on additional indebtedness, liens and dispositions. As of June 30, 2017, we were in compliance with all covenants under the Note Purchase Agreement.
48
In connection with the Note Purchase Agreement, certain subsidiaries of ours entered into a Subsidiary Guaranty, pursuant to which such subsidiaries guaranteed our obligations under the Notes and the Note Purchase Agreement.
As of June 30, 2017, we had $100.0 million of principal borrowed under the Note Purchase Agreement. The outstanding amounts are presented net of debt issuance cost of approximately $0.3 million in our consolidated balance sheets. Our debt under the Note Purchase Agreement carried an average annualized interest rate of 3.05%.
Receivable Purchase Agreement
On February 22, 2017, we entered into a receivables purchase agreement (the “Bank of America Receivable Agreement”) with Bank of America, N.A. (“Bank”). Under the Bank of America Receivable Agreement, we sell to the Bank or other investors on an ongoing basis certain of our trade receivables, together with ancillary rights and the proceeds thereof, which arise under contracts with a client, or its subsidiaries or affiliates. The Bank of America Receivable Agreement includes customary representations and covenants on behalf of us, and may be terminated by either us or the Bank upon thirty business days' advance notice. The Bank of America Receivable Agreement provides a mechanism for accelerating the receipt of cash due on outstanding receivables. We account for the transfer of our receivables with respect to which we have satisfied the applicable revenue recognition criteria in accordance with ASC 860, “Transfers and Servicing.” If we have not satisfied the applicable revenue recognition criteria for the underlying sales transaction, the transfer of the receivable is accounted for as a financing activity in accordance with ASC 470, “Debt.” The accounts receivable and short-term debt balances are derecognized from our consolidated balance sheets at the earlier of the factored receivable’s due date or when all of the revenue recognition criteria are met for those billed services. For Fiscal Year 2017, we transferred approximately $27.6 million of trade receivables. As of June 30, 2017, $6.4 million of the transfers were accounted for as a financing activity.
On February 19, 2013, we entered into a receivables purchase agreement (the “Receivable Agreement”) with JPMorgan Chase Bank, N.A. (“JPMorgan”). Under the Receivable Agreement, we sell to JPMorgan or other investors on an ongoing basis certain of our trade receivables, together with ancillary rights and the proceeds thereof, which arise under contracts with a client of ours, or its subsidiaries or affiliates. The Receivable Agreement includes customary representations and covenants on behalf of us, and may be terminated by either us or JPMorgan upon five business days advance notice. The Receivable Agreement provides a mechanism for accelerating the receipt of cash due on outstanding receivables. We account for the transfer of our receivables with respect to which we have satisfied the applicable revenue recognition criteria in accordance with ASC 860, “Transfers and Servicing.” If we have not satisfied the applicable revenue recognition criteria for the underlying sales transaction, the transfer of the receivable is accounted for as a financing activity in accordance with ASC 470, “Debt.” The accounts receivable and short-term debt balances are derecognized from our consolidated balance sheets at the earlier of the factored receivable’s due date or when all of the revenue recognition criteria are met for those billed services. For Fiscal Year 2017 and 2016, we transferred approximately $0.7 million and $73.6 million of trade receivables, respectively. As of June 30, 2017 and 2016, no transfers were accounted for as a financing activity.
Additional Lines of Credit
On December 23, 2016, we entered into an unsecured line of credit with HSBC Bank, USA in the amount of $100.0 million. The line bears interest, at our determination, at a base rate plus a margin (such margin not to exceed a per annum rate of 1.00%) based on a ratio of consolidated funded debt to consolidated earnings before interest, taxes, depreciation and amortization (EBITDA) for the prior four fiscal quarters (the “Leverage Ratio”), or at a LIBOR rate plus a margin (such margin not to exceed a per annum rate of 2.00%) based on the Leverage Ratio. We entered into this line of credit to facilitate business transactions during the remaining Fiscal Year 2017. This line matured on June 23, 2017, and no borrowings were outstanding as of June 30, 2017.
We have an unsecured line of credit with JP Morgan UK in the amount of $4.5 million that bears interest at an annual rate ranging between 2.00% and 4.00%. We entered into this line of credit to facilitate business transactions. At June 30, 2017, we had $4.5 million available under this line of credit.
We have an unsecured uncommitted overdraft facility with ING Bank NV in the amount of 7.5 million Euros that bears interest at an annual rate ranging between 2.00% and 4.00%. We entered into this line of credit to facilitate business transactions. At June 30, 2017, we had 7.5 million Euros available under this line of credit.
FINANCING NEEDS
Our primary cash needs are for operating expenses (such as salaries and fringe benefits, hiring and recruiting, business development and facilities), business acquisitions, stock buybacks, capital expenditures, and repayment of principal and interest on our borrowings.
49
2016 Credit Agreement, Term Loans and Note Purchase Agreement
In July 2013, we issued $100.0 million principal amount of 3.11% senior notes due July 25, 2020 for aggregate gross proceeds of $100.0 million in a private placement solely to accredited investors.
In March 2016, we entered into the 2016 Credit Agreement, which amended and restated the 2014 Credit Agreement.
Our requirements for cash to pay principal and interest on our borrowings will increase significantly in future periods based on amounts borrowed under our 2016 Credit Agreement and the Notes. Our primary committed external source of funds is the 2016 Credit Agreement. Our principal source of cash is from the performance of services under contracts with our clients. If we are unable to generate new contracts with existing and new clients or if the level of contract cancellations increases, our revenue and cash flow would be adversely affected (see Part II, Item 1A “Risk Factors” for further detail on these risks). Absent a material adverse change in the level of our new business bookings or contract cancellations, we believe that our existing capital resources together with cash flow from operations and borrowing capacity under existing credit facilities will be sufficient to meet our foreseeable cash needs over the next twelve months and on a longer term basis. Depending upon our revenue and cash flow from operations, it is possible that we will require external funds to repay amounts outstanding under our 2016 Credit Agreement upon its maturity in 2021.
We expect to continue to acquire businesses that enhance our service and product offerings, expand our therapeutic expertise, and/or increase our global presence. Depending on their size, any future acquisitions may require additional external financing, and we may from time to time seek to obtain funds from public or private issuances of equity or debt securities. We may be unable to secure such financing at all or on terms acceptable to us, as a result of our outstanding borrowings, including our outstanding borrowings under the 2016 Credit Agreement.
Under the terms of the 2016 Credit Agreement, interest rates are fixed based on market indices at the time of borrowing and, depending upon the interest mechanism selected by us, may float thereafter. As a result, the amount of interest payable by us on our borrowings may increase if market interest rates change. However, we expect to mitigate the risk of increasing market interest rates with our hedging programs described below under Part I, Item 3 “Quantitative and Qualitative Disclosures About Market Risk - Foreign Currency Exchange Rates and Interest Rates.”
On February 10, 2016, we entered into a short term unsecured term loan agreement with TD Bank, providing for a loan to the Company in the amount of $75.0 million. The proceeds of the loan were advanced to us on February 12, 2016 and were used to repay borrowings under our 2014 Facility. As of June 30, 2017, all outstanding amounts under the loan were fully repaid with the proceeds from the 2016 Credit Agreement.
Share Repurchase Programs
In both, Fiscal Year 2017 and Fiscal Year 2016, our Board of Directors approved an accelerated share repurchase program (the “2017 Program”), and a share repurchase program (the “2016 Program”). Refer to Part II, Item 5 Market for Registrants Common Equity, Related Stockholder Matters, and Issuer Purchases of Equity Securities" under the Stock Repurchase Program for further details on both programs.
DEBT, CONTRACTUAL OBLIGATIONS, CONTINGENT LIABILITIES AND GUARANTEES
The following table summarizes our contractual obligations at June 30, 2017:
(dollars in millions) | Less than 1 Year | 2-3 Years | 4-5 Years | More than 5 Years | Total | |||||||||||||||
Debt obligations (principal) | $ | 28.4 | $ | 53.5 | $ | 589.6 | $ | — | $ | 671.5 | ||||||||||
Operating leases | 44.1 | 65.4 | 41.1 | 81.8 | 232.4 | |||||||||||||||
Purchase obligations* | 129.6 | 59.1 | 13.5 | 0.2 | 202.4 | |||||||||||||||
Total | $ | 202.1 | $ | 178.0 | $ | 644.2 | $ | 82.0 | $ | 1,106.3 | ||||||||||
*includes commitments to purchase software, hardware, and services. | ||||||||||||||||||||
The above table does not include approximately $31.0 million of potential tax liabilities from unrecognized tax benefits related to uncertain tax positions. See Note 14 to our consolidated financial statements included in this annual report for more information.
The above table does not include asset retirement obligations due to the uncertainty of the timing of the future cash outflows related to the restoration costs associated with returning certain facilities to their original condition upon termination of our long-term leases. As of June 30, 2017, the obligation expected to be incurred is approximately $3.8 million.
The above table does not include contingent consideration due to the uncertainty regarding the amounts and timing of the future cash outflows related to the potential payments. The potential maximum payout for Health Advances is $22.5 million with a payout
50
date by February 28, 2019. Execupharm has a potential maximum payout of $20 million by June 30, 2018, and TMAC has potential maximum payout of $11 million by December 31, 2019.As of June 30, 2017 we recorded contingent consideration liabilities of $18.0 million. See Note 13 to our consolidated financial statements included in this annual report for more information.
We have letter-of-credit agreements with banks, totaling approximately $9.5 million, guaranteeing performance under various operating leases and vendor agreements. Additionally, the borrowings under the 2016 Credit Agreement and Note Purchase Agreement are guaranteed by certain of our U.S. subsidiaries.
We periodically become involved in various claims and lawsuits that are incidental to our business. In connection with the pending acquisition of the Company by certain investments funds affiliated with Pamplona Capital Management, pursuant to the Agreement and Plan of Merger, three lawsuits were filed by shareholders of PAREXEL against the Company. All three complaints allege that the preliminary proxy statement violates Section 14(a) and Section 20(a) of the Securities Exchange Act by materially omitting material information related to the Company’s projections and the explanation of the analysis of the Company’s financial advisor, among other claims. All of the complaints seek, among other things, equitable relief to enjoin the consummation of the merger, rescission of the merger or rescissory damages, compensatory damages, and attorneys’ fees and costs. The Company believes that the claims asserted against them are without merit and intend to vigorously defend against these lawsuits.
If the merger is not completed within the expected time frame or at all, we may be subject to a number of material risks. The price of our common stock may decline to the extent that current market prices reflect a market assumption that the merger will be completed. We could be required to reimburse certain expenses of Parent or pay Parent a termination fee of $138 million if the merger agreement is terminated under specific circumstances described in the merger agreement.
We will continue incurring additional cost till the Merger is completed.
We are also regularly subject to, and are currently undergoing, audits by tax authorities in the United States and foreign jurisdictions for prior tax years relating to indirect taxes. Although we believe our accruals for non-income tax related tax exposures to be appropriately estimated, and we intend to defend our positions through litigation if necessary, the final outcome of tax audits and related litigation is inherently uncertain and could be materially different than that reflected in our accruals. Adverse outcomes of tax audits could also result in assessments of substantial additional taxes and/or fines or penalties relating to ongoing or future audits. For indirect tax-related matters we estimate our reasonably possible loss in excess of amounts accrued as probable and estimable to be up to approximately $9.2 million as of June 30, 2017.
OFF-BALANCE SHEET ARRANGEMENTS
We have no off-balance sheet arrangements that have, or are reasonably likely to have a current or future effect on our financial position, changes in financial position, revenue or expenses, results of operations, liquidity, capital expenditures or capital resources that are material to our investors.
INFLATION
We believe the effects of inflation generally do not have a material adverse impact on our operations or financial condition.
RECENTLY ISSUED ACCOUNTING STANDARDS
See Note 2 in Item 8 to our consolidated financial statements included in this Annual Report on Form 10-K for more information on recently implemented and issued accounting standards.
51
ITEM 7A. QUANTITATIVE AND QUALITATIVE DISCLOSURES ABOUT MARKET RISK
MARKET RISK
Market risk is the potential loss arising from adverse changes in market rates and prices, such as foreign currency exchange rates, interest rates, and other relevant market rates or price changes. In the ordinary course of business, we are exposed to market risk resulting from changes in foreign currency exchange rates and interest rates, and we regularly evaluate our exposure to such changes. Our overall risk management strategy seeks to balance the magnitude of the exposure and the costs and availability of appropriate financial instruments.
FOREIGN CURRENCY EXCHANGE RATES AND INTEREST RATES
We derived approximately 56% of our consolidated service revenue for Fiscal Year 2017 from operations outside of the United States and 57% of our consolidated service revenue for Fiscal Year 2016 from operations outside of the United States. In addition, 12.1% of our consolidated revenue was denominated in Euros, 3.6% of our consolidated revenue was denominated in Yen and 1.9% was denominated in pounds sterling for Fiscal Year 2017, while 9.8% of our consolidated revenue was denominated in Euros, 2.4% was denominated in Yen and 2.3% was denominated in pounds sterling for Fiscal Year 2016. We have no significant operations in any country in which the economy is considered to be highly inflationary. Our financial statements are denominated in U.S. dollars. Accordingly, changes in exchange rates between foreign currencies and the U.S. dollar will affect the translation of financial results into U.S. dollars for purposes of reporting our consolidated financial results.
It is our policy to mitigate the risks associated with fluctuations in foreign exchange rates and interest rates. Accordingly, we have instituted foreign currency hedging programs and an interest rate swap program. See Note 4 to our consolidated financial statements included in this annual report for more information on our hedging programs and interest rate swap program.
As of June 30, 2017, we had programs with derivatives designated as hedging instruments under ASC 815 and the related notional values of the derivatives were approximately $449.1 million, including three interest rate swap agreements with a total notional value of $300.0 million executed to hedge our borrowings under our 2016 Credit Agreement. Under certain circumstances, such as the occurrence of significant differences between actual cash payments and forecasted cash payments, the ASC 815 programs could be deemed ineffective. In that event, the unrealized gains and losses related to these derivatives, which are currently reported in accumulated other comprehensive income, would be recognized in earnings. As of June 30, 2017, the estimated amount that could be recognized in earnings was a gain of approximately $8.6 million, net of tax.
As of June 30, 2017, the notional value of derivatives that were not designated as hedging instruments under ASC 815 was approximately $155.7 million.
During Fiscal Year 2017 and Fiscal Year 2016, we recorded foreign currency exchange losses of $4.0 million and $0.5 million, respectively. We also have exposure to additional foreign exchange rate risk as it relates to assets and liabilities that are not part of the economic hedge or designated hedging programs, but quantification of this risk is difficult to assess at any given point in time.
Our exposure to interest rate changes relates primarily to the amount of our short-term and long-term debt. Short-term debt was $29.2 million at June 30, 2017 and $16.6 million at June 30, 2016. Long-term debt before financing cost was $645.0 million at June 30, 2017 and $487.8 million at June 30, 2016. Based on average short-term and long-term debt for Fiscal Year 2017, an increase in the average interest rate of 100 basis points would decrease our pre-tax earnings and cash flows by approximately $6.7 million on an annual basis.
52
Item 8. FINANCIAL STATEMENTS AND SUPPLEMENTARY DATA
PAREXEL INTERNATIONAL CORPORATION
CONSOLIDATED STATEMENTS OF INCOME AND COMPREHENSIVE INCOME
(in millions, except per share data)
For the Years ended June 30, | ||||||||||||
2017 | 2016 | 2015 | ||||||||||
Service revenue | $ | 2,117.6 | $ | 2,094.3 | $ | 2,016.0 | ||||||
Reimbursement revenue | 323.9 | 332.0 | 314.3 | |||||||||
Total revenue | 2,441.5 | 2,426.3 | 2,330.3 | |||||||||
Costs and expenses: | ||||||||||||
Direct costs | 1,377.5 | 1,360.3 | 1,344.2 | |||||||||
Reimbursable out-of-pocket expenses | 323.9 | 332.0 | 314.3 | |||||||||
Selling, general and administrative | 401.3 | 385.3 | 367.2 | |||||||||
Depreciation | 78.7 | 74.6 | 69.3 | |||||||||
Amortization | 27.7 | 22.3 | 15.6 | |||||||||
Restructuring charge | 41.2 | 27.8 | 19.8 | |||||||||
Total costs and expenses | 2,250.3 | 2,202.3 | 2,130.4 | |||||||||
Income from operations | 191.2 | 224.0 | 199.9 | |||||||||
Interest expense, net | (12.3 | ) | (8.6 | ) | (7.1 | ) | ||||||
Miscellaneous (expense) income, net | (22.7 | ) | (0.2 | ) | 7.4 | |||||||
Total other (expense) income, net | (35.0 | ) | (8.8 | ) | 0.3 | |||||||
Income before provision for income taxes | 156.2 | 215.2 | 200.2 | |||||||||
Provision for income taxes | 48.9 | 60.3 | 52.4 | |||||||||
Net income | $ | 107.3 | $ | 154.9 | $ | 147.8 | ||||||
Earnings per share: | ||||||||||||
Basic | $ | 2.08 | $ | 2.90 | $ | 2.69 | ||||||
Diluted | $ | 2.06 | $ | 2.86 | $ | 2.65 | ||||||
Weighted average shares: | ||||||||||||
Basic | 51.5 | 53.5 | 54.9 | |||||||||
Diluted | 52.2 | 54.2 | 55.8 | |||||||||
Comprehensive income: | ||||||||||||
Net income | $ | 107.3 | $ | 154.9 | $ | 147.8 | ||||||
Unrealized gain (loss) on derivative instruments, net of taxes | 8.6 | (5.8 | ) | (3.9 | ) | |||||||
Foreign currency translation adjustment | 7.2 | (34.3 | ) | (94.1 | ) | |||||||
Total comprehensive income | $ | 123.1 | $ | 114.8 | $ | 49.8 | ||||||
The accompanying notes are an integral part of the consolidated financial statements.
53
PAREXEL INTERNATIONAL CORPORATION
CONSOLIDATED BALANCE SHEETS
(in millions, except per share data)
June 30, 2017 | June 30, 2016 | |||||||
ASSETS | ||||||||
Current assets: | ||||||||
Cash and cash equivalents | $ | 302.7 | $ | 248.6 | ||||
Billed accounts receivable, net | 588.2 | 506.1 | ||||||
Unbilled accounts receivable, net | 306.4 | 327.9 | ||||||
Prepaid expenses | 20.6 | 23.3 | ||||||
Income taxes receivable | 9.6 | 25.2 | ||||||
Other current assets | 52.9 | 50.1 | ||||||
Total current assets | 1,280.4 | 1,181.2 | ||||||
Property and equipment, net | 252.1 | 259.3 | ||||||
Goodwill | 476.3 | 389.2 | ||||||
Other intangible assets, net | 199.8 | 130.7 | ||||||
Non-current deferred tax assets | 35.1 | 27.1 | ||||||
Long-term income taxes receivable | 31.6 | 10.4 | ||||||
Other assets | 38.1 | 38.3 | ||||||
Total assets | $ | 2,313.4 | $ | 2,036.2 | ||||
LIABILITIES AND STOCKHOLDERS’ EQUITY | ||||||||
Current liabilities: | ||||||||
Notes payable and current portion of long-term debt | $ | 29.2 | $ | 16.6 | ||||
Accounts payable | 102.6 | 62.6 | ||||||
Deferred revenue | 485.0 | 420.2 | ||||||
Accrued expenses | 47.6 | 35.0 | ||||||
Accrued restructuring charges, current portion | 32.1 | 14.6 | ||||||
Accrued employee benefits and withholdings | 143.3 | 176.4 | ||||||
Income taxes payable | 27.6 | 21.6 | ||||||
Other current liabilities | 13.0 | 22.4 | ||||||
Total current liabilities | 880.4 | 769.4 | ||||||
Long-term debt, net of current portion | 642.3 | 484.8 | ||||||
Non-current deferred tax liabilities | 12.6 | 19.3 | ||||||
Long-term income tax liabilities | 34.0 | 31.5 | ||||||
Long-term deferred revenue | 37.9 | 38.3 | ||||||
Other liabilities | 71.7 | 59.5 | ||||||
Total liabilities | 1,678.9 | 1,402.8 | ||||||
Commitments and contingencies (Note 15) | ||||||||
Stockholders’ equity: | ||||||||
Preferred stock - $0.01 par value; 5.0 million shares authorized, no shares issued and outstanding at June 30, 2016 and June 30, 2015, respectively. | — | — | ||||||
Common stock - $0.01 par value; 150.0 million shares authorized; 51.1 million and 52.9 million shares issued and outstanding at June 30, 2017 and June 30, 2016, respectively. | 0.5 | 0.5 | ||||||
Additional paid-in capital | 22.0 | 31.4 | ||||||
Retained earnings | 732.2 | 737.5 | ||||||
Accumulated other comprehensive loss | (120.2 | ) | (136.0 | ) | ||||
Total stockholders’ equity | 634.5 | 633.4 | ||||||
Total liabilities and stockholders’ equity | $ | 2,313.4 | $ | 2,036.2 | ||||
The accompanying notes are an integral part of the consolidated financial statements.
54
PAREXEL INTERNATIONAL CORPORATION
CONSOLIDATED STATEMENTS OF STOCKHOLDERS’ EQUITY
(in millions, except per share data)
Common Stock | Retained Earnings | Accumulated Other Comprehensive Income (Loss) | Total Stockholders’ Equity | ||||||||||||||||||||
Number of Shares | Par Value | Additional Paid-in Capital | |||||||||||||||||||||
Balance at June 30, 2014 | 54.7 | $ | 0.5 | $ | — | $ | 575.1 | $ | 2.1 | $ | 577.7 | ||||||||||||
Shares issued under stock option/restricted stock/employee stock purchase plans, net | 0.9 | 0.1 | 12.6 | — | — | 12.7 | |||||||||||||||||
Stock-based compensation | — | — | 17.9 | — | — | 17.9 | |||||||||||||||||
Excess tax benefit related to employee equity awards | — | — | 7.2 | — | — | 7.2 | |||||||||||||||||
Share repurchase | (0.4 | ) | — | — | — | — | — | ||||||||||||||||
Unrealized loss on derivative instruments, net of taxes | — | — | — | — | (3.9 | ) | (3.9 | ) | |||||||||||||||
Foreign currency translation adjustment | — | — | — | — | (94.1 | ) | (94.1 | ) | |||||||||||||||
Net income | — | — | — | 147.8 | — | 147.8 | |||||||||||||||||
Balance at June 30, 2015 | 55.2 | $ | 0.6 | $ | 37.7 | $ | 722.9 | $ | (95.9 | ) | $ | 665.3 | |||||||||||
Shares issued under stock option/restricted stock/employee stock purchase plans, net | 0.9 | — | 13.9 | — | — | 13.9 | |||||||||||||||||
Stock-based compensation | — | — | 20.1 | — | — | 20.1 | |||||||||||||||||
Excess tax benefit related to employee equity awards | — | — | 4.0 | 15.3 | — | 19.3 | |||||||||||||||||
Share repurchase | (3.2 | ) | (0.1 | ) | (44.3 | ) | (155.6 | ) | — | (200.0 | ) | ||||||||||||
Unrealized loss on derivative instruments, net of taxes | — | — | — | — | (5.8 | ) | (5.8 | ) | |||||||||||||||
Foreign currency translation adjustment | — | — | — | — | (34.3 | ) | (34.3 | ) | |||||||||||||||
Net income | — | — | — | 154.9 | — | 154.9 | |||||||||||||||||
Balance at June 30, 2016 | 52.9 | $ | 0.5 | $ | 31.4 | $ | 737.5 | $ | (136.0 | ) | $ | 633.4 | |||||||||||
Shares issued under stock option/restricted stock/employee stock purchase plans, net | 1.3 | — | 34.2 | — | — | 34.2 | |||||||||||||||||
Stock-based compensation | 22.1 | — | — | 22.1 | |||||||||||||||||||
Share repurchase | (3.1 | ) | — | (67.3 | ) | (112.0 | ) | (179.3 | ) | ||||||||||||||
Excess tax benefit related to employee equity awards | — | — | 1.0 | — | — | 1.0 | |||||||||||||||||
Adoption of ASU 2016-09 | — | — | 0.6 | (0.6 | ) | — | — | ||||||||||||||||
Unrealized gain on derivative instruments, net of taxes | — | — | — | — | 8.6 | 8.6 | |||||||||||||||||
Foreign currency translation adjustment | — | — | — | — | 7.2 | 7.2 | |||||||||||||||||
Net income | — | — | — | 107.3 | — | 107.3 | |||||||||||||||||
Balance at June 30, 2017 | 51.1 | $ | 0.5 | $ | 22.0 | $ | 732.2 | $ | (120.2 | ) | $ | 634.5 | |||||||||||
The accompanying notes are an integral part of the consolidated financial statements.
55
PAREXEL INTERNATIONAL CORPORATION
CONSOLIDATED STATEMENTS OF CASH FLOWS
(dollars in millions)
For the Years ended June 30, | ||||||||||||
2017 | 2016 | 2015 | ||||||||||
Cash flow from operating activities: | ||||||||||||
Net income | $ | 107.3 | $ | 154.9 | $ | 147.8 | ||||||
Adjustments to reconcile net income to net cash provided by operating activities: | ||||||||||||
Depreciation and amortization | 106.4 | 96.9 | 84.9 | |||||||||
Stock-based compensation | 22.1 | 20.1 | 17.9 | |||||||||
Change in fair value | 20.7 | — | — | |||||||||
Deferred income taxes | (14.8 | ) | 24.0 | (16.1 | ) | |||||||
Impairment charges | 5.7 | — | — | |||||||||
Fair value adjustment of contingent consideration | (2.9 | ) | 8.7 | (7.4 | ) | |||||||
Excess tax benefit from stock-based compensation | — | (4.2 | ) | (7.1 | ) | |||||||
Other non-cash items | (0.7 | ) | (0.1 | ) | 2.1 | |||||||
Changes in assets and liabilities, net of the effect from acquisitions: | ||||||||||||
Billed and unbilled accounts receivable | (23.6 | ) | (122.1 | ) | (24.5 | ) | ||||||
Prepaid expenses and other current assets | (4.4 | ) | (17.9 | ) | (3.1 | ) | ||||||
Other assets | 1.9 | 1.6 | (11.9 | ) | ||||||||
Accounts payable | 38.9 | (20.8 | ) | 19.0 | ||||||||
Deferred revenue | 67.8 | 58.2 | (33.7 | ) | ||||||||
Accrued expenses and other current liabilities | (23.6 | ) | 32.7 | 9.7 | ||||||||
Long-term income taxes payable, net of long-term income taxes receivable | 4.7 | 21.1 | (10.6 | ) | ||||||||
Other liabilities | 0.9 | 8.2 | (9.2 | ) | ||||||||
Net cash provided by operating activities | 306.4 | 261.3 | 157.8 | |||||||||
Cash flow from investing activities: | ||||||||||||
Proceeds from sale and maturity of marketable securities | — | — | 88.6 | |||||||||
Purchases of property and equipment | (72.6 | ) | (95.5 | ) | (80.2 | ) | ||||||
Acquisition of businesses, net of cash acquired | (184.6 | ) | (67.3 | ) | (104.5 | ) | ||||||
Net cash used in investing activities | (257.2 | ) | (162.8 | ) | (96.1 | ) | ||||||
Cash flow from financing activities: | ||||||||||||
Proceeds from issuance of common stock, net of tax payments for cashless exercises | 34.2 | 13.9 | 12.6 | |||||||||
Payments for share repurchase | (200.0 | ) | (200.0 | ) | — | |||||||
Excess tax benefit from stock-based compensation | 4.2 | 7.1 | ||||||||||
Borrowings under credit agreement/facility | 535.0 | 1,176.2 | 429.6 | |||||||||
Repayments under credit agreement/facility | (371.6 | ) | (1,028.9 | ) | (422.5 | ) | ||||||
Borrowings under factoring agreement | 6.4 | — | — | |||||||||
Payments for contingent consideration | (9.9 | ) | — | |||||||||
Payments for debt issuance costs | (1.0 | ) | (0.6 | ) | ||||||||
Net cash provided by (used in) financing activities | 4.0 | (45.5 | ) | 26.2 | ||||||||
Effect of exchange rate changes on cash and cash equivalents | 0.9 | (11.8 | ) | (68.7 | ) | |||||||
Net increase in cash and cash equivalents | 54.1 | 41.2 | 19.2 | |||||||||
Cash and cash equivalents at beginning of year | 248.6 | 207.4 | 188.2 | |||||||||
Cash and cash equivalents at end of year | $ | 302.7 | $ | 248.6 | $ | 207.4 | ||||||
Supplemental disclosures of cash flow information | ||||||||||||
Non-cash capital expenditures | $ | 4.5 | $ | 4.5 | $ | 6.9 | ||||||
Non-cash debt settlement under factoring agreement | $ | 21.2 | $ | — | $ | — | ||||||
Net cash paid during year for: | ||||||||||||
Interest | $ | 9.6 | $ | 13.0 | $ | 10.8 | ||||||
Income taxes, net of refunds | $ | 65.4 | $ | 19.7 | $ | 78.4 | ||||||
The accompanying notes are an integral part of the consolidated financial statements.
56
PAREXEL INTERNATIONAL CORPORATION
NOTES TO CONSOLIDATED FINANCIAL STATEMENTS
NOTE 1. DESCRIPTION OF BUSINESS
PAREXEL International Corporation (“PAREXEL,” “the Company,” or “we”) is a leading biopharmaceutical outsourcing services company, providing a broad range of expertise in clinical research, clinical logistics, medical communications, consulting, commercialization and advanced technology products and services to the worldwide pharmaceutical, biotechnology, and medical device industries. Our primary objective is to provide quality solutions for managing the biopharmaceutical product lifecycle with the goal of reducing the time, risk, and cost associated with the development and commercialization of new therapies. Since our incorporation in 1983, we have developed significant expertise in processes and technologies supporting this strategy. Our product and service offerings include: clinical trials management, observational studies and patient/disease registries, data management, biostatistical analysis, epidemiology, health economics/outcomes research, pharmacovigilance, medical communications, clinical pharmacology, patient recruitment, clinical supply and drug logistics, post-marketing surveillance, regulatory and product development and commercialization consulting, health policy and reimbursement and market access consulting, medical imaging services, regulatory information management (“RIM”) solutions, randomization and trial supply management services (“RTSM”), electronic data capture systems (“EDC”), clinical trial management systems (“CTMS”), web-based portals, systems integration, patient diary applications, and other product development tools and services.
NOTE 2. SUMMARY OF SIGNIFICANT ACCOUNTING POLICIES
Basis of Presentation and Principles of Consolidation
The consolidated financial statements include the accounts of PAREXEL International Corporation, our wholly-owned and majority-owned subsidiaries. All inter-company accounts and transactions have been eliminated. For the year ended June 30, 2017, we recorded $7.5 million related to service revenue arrangements recognized in prior periods. The adjustments were recorded as reductions to service revenue in the consolidated statements of income and comprehensive income for the year ended June 30, 2017. We concluded the effect of these errors was not material to our consolidated financial statements for the current fiscal year, or any of the prior periods and, as such, these consolidated financial statements are not materially misstated.
Cash Pooling Arrangement, Net Presentation
In Fiscal Year 2017, our cash pooling arrangement with RBS Nederland, NV ended and we increased our cash pooling with J.P Morgan Chase. Pooling occurs when debit balances are offset against credit balances and the overall net position is used as a basis by the bank for calculating the overall pool interest payable or receivable amount. Each legal entity owned by us and party to this arrangement remains the owner of either a credit (deposit) or a debit (overdraft) balance. Therefore, interest income is earned by legal entities with credit balances, while interest expense is charged to legal entities with debit balances. Based on the pool’s aggregate balance, the bank then (1) recalculates the overall interest to be charged or earned, (2) compares this amount with the sum of previously charged/earned interest amounts per account and (3) additionally pays/charges the difference.
Use of Estimates
We prepare our financial statements in conformity with U.S. generally accepted accounting principles which require us to make estimates and assumptions that affect the amounts reported in the financial statements. Estimates are used in accounting for, among other items, revenue recognition, allowance for credit losses on receivables, valuation of derivative instruments, periodic impairment reviews of goodwill and intangible assets, contingent consideration, income taxes, and the valuation of acquired and long-term assets. Our estimates are based on the facts and circumstances available at the time estimates are made, historical experience, risk of loss, general economic conditions, trends, and assessments of the probable future outcomes of these matters. Actual results could differ from those estimates. Estimates and assumptions are reviewed periodically, and the effects of changes, if any, are reflected in the statement of operations in the period in which they are determined.
Fair Values of Financial Instruments
The fair value of our cash and cash equivalents, marketable securities, accounts receivable, and accounts payable approximates the carrying value of these financial instruments because of the short-term nature of any maturities. We determine the estimated fair values of other financial instruments, using available market information and valuation methodologies, primarily discounted cash flow analysis or input from independent investment bankers.
Segments
We identify a business as an operating segment if: i) it engages in business activities from which it may earn revenue and incur expenses; ii) its operating results are regularly reviewed by our chief operating decision maker, who is our chief executive officer, and iii) it has available discrete financial information. We aggregate our operating segments into a reportable segment if the operating segments are determined to have similar economic characteristics and are similar in the nature of products and services,
57
PAREXEL INTERNATIONAL CORPORATION
NOTES TO CONSOLIDATED FINANCIAL STATEMENTS (CONTINUED)
nature of production processes, type or class of customer for their products and services, product or service distribution method, and, if applicable, nature of the regulatory environment. We have three reportable segments: Clinical Research Services (“CRS”), PAREXEL Consulting Services (“PC”), and PAREXEL Informatics (“PI”).
Revenue Recognition
We derive revenue from the delivery of service or software solutions to clients in the worldwide pharmaceutical, biotechnology, and medical device industries. We recognize revenue when all of the following conditions are satisfied: (1) there is persuasive evidence of an arrangement; (2) the service offering has been delivered to the client; (3) the collection of fees is probable; and (4) the amount of fees to be paid by the client is fixed or determinable. Revenue recognition treatment of each business segment is described below.
CRS and PC Service Revenue
Service revenue in our CRS and PC businesses are derived principally from fee-for-service or fixed-price executory contracts, which typically involve competitive bid awards and multi-year terms. Client billing schedules and payment arrangements are prescribed under negotiated contract terms. Contract provisions do not provide for rights of return or refund, but normally include rights of cancellation with notice, in which case services delivered through the cancellation date are due and payable by the client, including certain costs to conclude the trial or study.
Our client arrangements generally involve multiple service deliverables, where bundled service deliverables are accounted for in accordance with Financial Accounting Standards Board (“FASB”),Accounting Standards Codification (“ASC”) 605-25, “Multiple-Element Arrangements.” We determined that each of our service deliverables has standalone value. ASC 605-25 requires the allocation of contract (arrangement) value to each separate unit of accounting based on the relative selling price of the various separate units of accounting in the arrangement. ASC 605-25 requires a hierarchy of evidence be followed when determining if evidence of the selling price of an item exists, such that the best evidence of selling price of a unit of accounting is vendor-specific objective evidence (“VSOE”), or the price charged when a deliverable is sold separately. When VSOE is not available to determine selling price, relevant third-party evidence (“TPE”) of selling price should be used, if available. Lastly, when neither VSOE nor TPE of selling price for similar deliverables exists, management must use its best estimated selling price (“BESP”) considering all relevant information that is available without undue cost and effort.
We use BESP in our allocation of arrangement consideration. The objective of BESP is to determine the price at which we would transact if the services were sold by us on a standalone basis. Our determination of BESP involves the consideration of several factors based on the specific facts and circumstances of each arrangement. Specifically, we consider the cost to provide services, the anticipated margin on those deliverables, our ongoing pricing strategy and policies, and the characteristics of the varying markets in which the services are provided. We allocate arrangement consideration at the inception of the arrangement using the relative selling prices of the deliverables within the contract based on BESP.
We analyze the selling prices used in the allocation of arrangement consideration at least annually. Selling prices are analyzed on a more frequent basis if a significant change in our business necessitates a more timely analysis or if we experience significant variances in our selling prices.
We recognize revenue for the separate elements of our contracts upon delivery of actual units of output and when all other revenue recognition criteria are met. Revenue from fee-for-service contracts generally is recognized as units of output are delivered. Revenue on fixed-price contracts generally is measured by applying a proportional performance model using output units, such as site or investigator recruitment, patient enrollment, data management, or other deliverables common to our CRS business. Performance-based output units are pre-defined in contracts and revenue is recognized based upon actual units of completion. Revenue related to changes in contract scope, which are subject to client approval, is recognized when realization is assured and amounts are fixed or determinable.
We present revenue-related taxes collected on behalf of customers and remitted to taxing authorities, principally value-added taxes, on a net basis.
PI Service Revenue
Service revenue is derived principally from the delivery of software solutions through our PI business segment. Software solutions include ClinPhone®RTSM, CTMS, EDC, RIM and Platform Solutions.
Within PI’s ClinPhone® RTSM business, we offer selected software solutions through a hosted application delivered through a standard web browser. We recognize revenue from application hosting services in accordance with ASC 985-605, “Software” and ASC 605-25, as our customers do not have the right to take possession of the software. Revenue resulting from these hosting services consists of three stages: set-up (client specification and workflow), hosting and support services, and closeout reporting.
Fees charged and costs incurred in the set-up stage are deferred until the start of the hosting period and are amortized and recognized ratably over the estimated hosting period, including customary and expected extensions. Deferred costs are direct costs associated
58
PAREXEL INTERNATIONAL CORPORATION
NOTES TO CONSOLIDATED FINANCIAL STATEMENTS (CONTINUED)
with the trial and application setup. These costs include salary and benefits associated with direct labor costs incurred during trial setup, as well as third-party subcontract fees and other contract labor costs. In the event of a contract cancellation by a client, all deferred revenue is recognized and all deferred setup costs are expensed. To the extent that termination-related fees are payable under the contract, such fees are recognized in the period of termination.
PI's Medical Imaging business provides a service allowing customers to manage the image acquisitions and the analysis and quality of data obtained during a clinical trial. Service revenue is derived from executory contracts that are tailored to meet individual client requirements. Client billing schedules and payment arrangements are prescribed under negotiated contract terms. We recognize service revenue related to our Medical Imaging business based upon a proportional performance method utilizing a unitized output method. The defined units used for revenue recognition are used to track output measures that are specific to the services being provided in the contract and may include site survey reports, project management tasks, number of reviews completed, and image receipt and processing.
Reimbursement Revenue & Investigator Fees
Reimbursable out-of-pocket expenses are reflected in our Consolidated Statements of Income under “Reimbursement revenue” and “Reimbursable out-of-pocket expenses,” as we are the primary obligor for these expenses despite being reimbursed by our clients. In addition, as is customary in our industry, we routinely subcontract on behalf of our clients with independent physician investigators in connection with clinical trials. The related investigator fees are not reflected in our Service revenue, Reimbursement revenue, Reimbursable out-of-pocket expenses, or Direct costs, because these fees are reimbursed by clients on a “pass through basis,” without risk or reward to us. The amounts of these investigator fees were $408.8 million, $397.1 million, and $461.0 million for the fiscal years ended June 30, 2017, 2016, and 2015, respectively.
Business Combinations
We account for acquisitions as business combinations in accordance with ASC Topic 805, “Business Combinations.” We allocate the amounts that we pay for each acquisition to the assets we acquire, including identifiable intangible assets, and liabilities we assume based on their fair values at the dates of acquisition. We base the fair value of identifiable intangible assets acquired in a business combination on detailed valuations that use information and assumptions determined by management and which consider management's best estimates of inputs and assumptions that a market participant would use. We allocate any excess purchase price over the fair value of the net tangible and identifiable intangible assets acquired to goodwill.
Cash and Cash Equivalents
We consider all highly liquid investments purchased with original maturities of 90 days or less to be cash equivalents.
Marketable Securities
We account for investments in debt and equity securities in accordance with ASC 320, “Investments - Debt and Equity Securities.”
Marketable securities are held in foreign government treasury certificates that are actively traded and have original maturities over 90 days but less than one year. Our foreign government treasury certificates securities are classified as held-to-maturity based on our intent and ability to hold the securities to maturity and are recorded at amortized cost, which is not materially different than fair value. We do not intend to sell the securities and it is not more likely than not that we will be required to sell the securities before recovery of their amortized cost bases, which may be maturity. Interest and dividends related to these securities are reported as a component of interest income in our consolidated statements of income. At June 30, 2017 and 2016, we did not hold any marketable securities.
Concentration of Credit Risk
Financial instruments that subject us to credit risk primarily consist of cash and cash equivalents, marketable securities, derivative financial instrument contracts, and accounts receivable. We maintain our cash and cash equivalent balances with high-quality financial institutions and, consequently, we believe that such funds are subject to minimal credit risk. Our marketable securities primarily consist of foreign government treasury certificates.
We have seven different counterparties in our derivative contracts, which include interest rate swaps, an interest rate cap and foreign currency hedges. Each of these counterparties is in the financial services industry and is subject to the credit risks inherent to that industry. We perform ongoing credit evaluations of these counterparties.
We perform ongoing credit evaluations related to the financial condition of our clients and, generally, do not require collateral. As of June 30, 2017 and 2016 , one client individually accounted for 12% of our total billed and unbilled accounts receivables. For Fiscal Year 2017 one client individually accounted for 12% of our consolidated service revenue. For Fiscal Year 2016, one client individually accounted for 13% of our consolidated service revenue. For Fiscal Year 2015, one client individually accounted for 14% of our consolidated service revenue.
59
PAREXEL INTERNATIONAL CORPORATION
NOTES TO CONSOLIDATED FINANCIAL STATEMENTS (CONTINUED)
Billed Accounts Receivable, Unbilled Accounts Receivable and Deferred Revenue
Billed accounts receivable represent amounts invoiced to our clients based on contract terms. In general, prerequisites for billings and payments are established by contractual provisions including predetermined payment schedules, which may or may not correspond to the timing of the performance of services under the contract. Unbilled services arise when services have been rendered for which revenue has been recognized but the customers have not been billed. Deferred revenue, which had an estimated weighted average age of 6 months for Fiscal Year 2017, represents payments received in excess of revenue recognized. These payments received in advance of services being provided or reimbursable out of pocket expenses and investigator fees incurred are classified as deferred revenue on the consolidated balance sheet and include amounts billed based on contractual provisions such as milestone payments or customer advances at the beginning of a project. As the contracted services are subsequently performed and the associated revenue is recognized, the deferred revenue balance is reduced by the amount of the revenue recognized during the period. We maintain a provision for losses on receivables based on historical collectability and specific identification of potential problem accounts. Uncollectible invoices are written off when collection efforts have been exhausted.
Property and Equipment
Property and equipment is stated at cost. Depreciation is provided using the straight-line method based on estimated useful lives of 3 to 8 years for computer software and hardware, and 5 years for office furniture, fixtures and equipment. Leasehold improvements are amortized over the lesser of the estimated useful lives of the improvements or the remaining lease term, which include lease extensions when reasonably assured. Repair and maintenance costs are expensed as incurred.
Development of Software for Internal Use
PAREXEL accounts for the costs of software developed or obtained for internal use in accordance with ASC 350-40, “Internal-Use Software.” We capitalize costs of materials, consultants, payroll, and payroll-related costs for employees incurred in developing internal-use software. These costs are included in computer software in Note 5 below. Costs incurred during the preliminary project and post-implementation stages are charged to expense.
Capitalized software costs, net, were $172.9 million and $174.8 million at June 30, 2017 and 2016, respectively. Expense related to the capitalized software was $45.7 million, $43.2 million and $38.7 million for the years ended June 30, 2017, 2016 and 2015, respectively. Future expense for all capitalized software placed in service as of June 30, 2017 is estimated to be $45.5 million, $37.4 million, $27.9 million, $17.7 million and $6.2 million for the years ending June 30, 2018, 2019, 2020, 2021 and 2022, respectively.
Research and Development Costs
We incur ongoing research and development costs related to core technologies used internally as well as software and technology sold externally. Unless eligible for capitalization, these costs are expensed as incurred. Research and development expense was $17.8 million, $19.2 million, and $24.0 million in Fiscal Years 2017, 2016, and 2015, respectively, and is included in selling, general and administrative expenses in the consolidated statements of income.
Goodwill
PAREXEL follows the provisions of ASC 350, “Intangibles—Goodwill and Other.” Under this statement, goodwill as well as certain other intangible assets, determined to have an indefinite life, are not amortized. Instead, these assets are evaluated for impairment at least annually or more frequently if an event occurs or circumstances change that would more likely than not reduce the fair value of the reporting unit below its carrying value. We used the qualitative assessment option for our impairment testing in Fiscal Year 2017 for goodwill and determined that the fair values of the reporting units and the indefinite-lived intangible more likely than not exceeded their carrying values and that there was no evidence of impairment as of June 30, 2017. Our assessment of our indefinite-lived intangible, the ClinPhone RTSM tradename, for impairment uses a relief from royalty approach to determine fair value. Under the relief from royalty approach, the fair value of the indefinite-lived intangible is based on after tax royalty rate and discount rate applied to future forecasted sales. Based on our assessment of the ClinPhone RTSM tradename, there was no evidence of impairment as of June 30, 2017 and June 30, 2016.
Long-lived Assets and Other Intangible Assets
Long-lived assets, including fixed assets and intangible assets which have a definitive life, are reviewed for impairment when circumstances indicate that the carrying amount of assets might not be recoverable.
Indefinite-lived assets are reviewed annually or more frequently if an event occurs or circumstances change that would more likely than not reduce the fair value below the carrying value of the asset. For Fiscal Year 2017, we performed our annual impairment test using the relief from royalty approach to determine fair value. Under the relief from royalty approach, the fair value of the indefinite-lived intangible asset is based on after tax royalty rate and discount rate applied to future forecasted sales. The Company recognized an impairment charge related to an internally-developed software program of approximately $5.7 million for twelve months of Fiscal Year 2017. There was no evidence of impairment of our indefinite-lived intangible asset balances as of June 30,
60
PAREXEL INTERNATIONAL CORPORATION
NOTES TO CONSOLIDATED FINANCIAL STATEMENTS (CONTINUED)
2017. Intangible assets are initially recorded at fair value and stated net of accumulated amortization and impairments. We amortize our intangible assets that have finite lives using either the straight-line method, or if reliably determinable, based on the pattern in which the economic benefit of the asset is expected to be utilized. Amortization is recorded over the estimated useful lives ranging from 1 to 15 years.
Income Taxes
Deferred tax assets and liabilities are recorded for the expected future tax consequences of temporary differences between the carrying amounts and the tax bases of assets and liabilities. Deferred tax assets are recognized for the estimated future tax benefits of deductible temporary differences and tax operating loss and credit carryforwards and are presented net of valuation allowances. Valuation allowances are established in jurisdictions where it is more likely than not that the benefits of the associated deferred tax assets will not be realized. Deferred income tax expense represents the change in the net deferred tax asset and liability balances. Interest and penalties are recognized as a component of income tax expense.
Foreign Currency
Assets and liabilities of PAREXEL’s international operations are translated into U.S. dollars at exchange rates that are in effect on the balance sheet date and equity accounts are translated at historical exchange rates. Income and expense items are translated at average exchange rates in effect during the year. Translation adjustments are accumulated in other comprehensive income (loss) as a separate component of stockholders’ equity in the consolidated balance sheet. Transaction gains and losses are included in miscellaneous expense, net in the consolidated statements of operations. Transaction gains (losses) were $(4.0) million, $(0.5) million, and $7.0 million in Fiscal Years 2017, 2016, and 2015, respectively.
Earnings Per Share
Basic earnings per share is computed by dividing net income for the period by the weighted average number of common shares outstanding during the period. Diluted earnings per share is computed by dividing net income by the weighted average number of common shares plus the dilutive effect of outstanding stock options and restricted stock awards. We do not have any participating securities outstanding nor do we have more than one class of common stock.
Recently Issued Accounting Standards
In May 2014, the FASB issued ASU No. 2014-09 (“ASU 2014-09”), Revenue from Contracts with Customers (Topic 606), which provides that an entity should recognize revenue to depict the transfer of promised goods or services to customers in an amount that reflects the consideration to which the entity expects to be entitled in exchange for those goods or services. To achieve this core principle, an entity should apply the following steps: (1) identify the contract(s) with a customer; (2) identify the performance obligations in the contract; (3) determine the transaction price; (4) allocate the transaction price to the performance obligations in the contract; and (5) recognize revenue when (or as) the entity satisfies a performance obligation. As originally issued, ASU 2014-09 will be effective prospectively for fiscal years and interim periods within those years beginning after December 15, 2016. On July 9, 2015, the FASB approved the proposal to defer the effective date of this standard by one year. Early adoption is permitted for annual periods beginning after December 16, 2016. The Company has made progress toward completing its evaluation of the potential changes from adopting this new standard on its financial reporting and disclosures, drafting accounting policies, and designing changes to business processes, controls, and systems. The Company expects to adopt the new standard effective July 1, 2018 using the modified retrospective approach.
Subsequent to issuing ASU 2014-09, the FASB issued the following amendments concerning clarification of ASU 2014-09. In March 2016, the FASB issued ASU No. 2016-08 (“ASU 2016-08”), Revenue from Contracts with Customers (Topic 606), Principal versus Agent Considerations (Reporting Revenue Gross versus Net), which further clarifies the implementation guidance on principal versus agent considerations. The new guidance requires either a retrospective or a modified retrospective approach to adoption. In April 2016, the FASB issued ASU No. 2016-10, (“ASU 2016-10”) Revenue from Contracts with Customers (Topic 606), Identifying Performance Obligations and Licensing, which clarifies the identification of performance obligations and the licensing implementation guidance, while retaining the related principles for those areas. In May 2016, the FASB issued ASU No. 2016-12 (“ASU 2016-12”), Revenue from Contracts with Customers (Topic 606): Narrow-Scope Improvements and Practical Expedients, which provides clarification on assessing the collectability criterion, presentation of sales taxes, measurement date for noncash consideration and completed contracts at transition. We are currently evaluating the impact these ASUs will have on our consolidated financial statements.
In January 2016, the FASB issued ASU No. 2016-01 (“ASU 2016-01”), Financial Instruments—Overall (Subtopic 825-10) Recognition and Measurement of Financial Assets and Financial Liabilities. This ASU is intended to provide users of financial statements with more useful information on the recognition, measurement, presentation, and disclosure of financial instruments. ASU 2016-01 is effective for fiscal years beginning after December 15, 2017, with early adoption permitted. We are assessing the impact of adopting ASU No. 2016-01 on our consolidated financial statements.
61
PAREXEL INTERNATIONAL CORPORATION
NOTES TO CONSOLIDATED FINANCIAL STATEMENTS (CONTINUED)
In February 2016, the FASB issued ASU No. 2016-02 (“ASU 2016-02”), Leases (Topic 842) Section A-Leases: Amendments to the FASB Accounting Standards Codification® Section B-Conforming Amendments Related to Leases: Amendments to the FASB Accounting Standards Codification® Section C-Background Information and Basis for Conclusions. This ASU requires an entity that leases assets to recognize on the balance sheet the assets and liabilities for the rights and obligations created by those leases. ASU 2016-02 is effective for fiscal years beginning after December 15, 2018, with early adoption permitted. We are assessing the impact of adopting ASU 2016-02 on our consolidated financial statements.
In March 2016, the FASB issued ASU No. 2016-05 (“ASU 2016-05”), Derivatives and Hedging (Topic 815): Effect of Derivative Contract Novations on Existing Hedge Accounting Relationships (a Consensus of the Emerging Issues Task Force). This ASU clarifies that a change in the counterparty to a derivative instrument that has been designated as the hedging instrument under Topic 815 does not, in and of itself, require dedesignation of that hedging relationship provided that all other hedge accounting criteria continue to be met. ASU 2016-05 is effective for fiscal years beginning after December 15, 2016, with early adoption permitted. We are assessing the impact of adopting ASU 2016-05 on our consolidated financial statements.
In January 2017, the FASB issued ASU No. 2017-01 (“ASU 2017-01”), Business Combinations (Topic 805): Clarifying the Definition of a Business. The ASU clarifies that when substantially all of the fair value of gross assets acquired is concentrated in a single asset (or a group of similar assets), the assets acquired would not represent a business. This introduces an initial required screen that, if met, eliminates the need for further assessment. ASU 2017-01 is effective for annual and interim periods beginning after December 15, 2017, with early adoption permitted. We do not believe the updated requirements under ASU 2017-04 will materially impact our consolidated financial statements.
In January 2017, the FASB issued ASU No. 2017-04 (“ASU 2017-04”), Intangibles—Goodwill and Other (Topic 350). The ASU removes Step 2 of the goodwill impairment test, which requires a hypothetical purchase price allocation. A goodwill impairment will now be the amount by which a reporting unit’s carrying value exceeds its fair value, not to exceed the carrying amount of goodwill. ASU 2017-04 is effective for annual or any interim goodwill impairment tests in fiscal years beginning after December 15, 2019, with early adoption permitted. We are assessing the impact of adopting ASU 2017-04 on our consolidated financial statements.
Recently Adopted Accounting Standards
The Company adopted ASU No. 2014-15 ("ASU 2014-15"), Preparation of Financial Statements - Going Concern (Subtopic 205-40), Disclosure of Uncertainties about an Entity’s Ability to Continue as a Going Concern which states that under U.S. GAAP, continuation of a reporting entity as a going concern is presumed as the basis for preparing financial statements unless and until the entity’s liquidation becomes imminent. If and when an entity’s liquidation becomes imminent, financial statements should be prepared under the liquidation basis of accounting. Even when an entity’s liquidation is not imminent, there may be conditions or events that raise substantial doubt about the entity’s ability to continue as a going concern. In those situations, financial statements should continue to be prepared under the going concern basis of accounting, but the amendments in this ASU should be followed to determine whether to disclose information about the relevant conditions and events. The adoption of this ASU did not have a material impact on our consolidated financial statements.
The Company adopted ASU No. 2014-12 (“ASU 2014-12”), Accounting for Share-Based Payments When the Terms of an Award Provide That a Performance Target Could Be Achieved After the Requisite Service Period. ASU 2014-12 requires that a performance target that affects vesting and could be achieved after the requisite service period be treated as a performance condition. A reporting entity should apply existing guidance in Accounting Standards Codification (“ASC”) 718, Compensation—Stock Compensation, as it relates to such awards. ASU 2014-12 permits using either of two methods: (i) prospective to all awards granted or modified after the effective date; or (ii) retrospective to all awards with performance targets that are outstanding as of the beginning of the earliest annual period presented in the financial statements and to all new or modified awards thereafter, with the cumulative effect of applying ASU 2014-12 as an adjustment to the opening retained earnings balance as of the beginning of the earliest annual period presented in the financial statements. The adoption of this ASU did not have a material impact on our consolidated financial statements.
The Company adopted ASU No. 2015-16 (“ASU 2015-16”), Business Combinations (Topic 805): Simplifying the Accounting for Measurement-Period Adjustments. This ASU requires adjustments to provisional amounts that are identified during the measurement period of a business combination to be recognized in the reporting period in which the adjustment amounts are determined. Acquirers are no longer required to revise comparative information for prior periods as if the accounting for the business combination had been completed as of the acquisition date. The adoption of this ASU did not have a material impact on our consolidated financial statements.
The Company adopted ASU No. 2015-03 (“ASU 2015-03”), Simplifying the Presentation of Debt Issuance Costs. ASU 2015-03 requires the presentation of debt issue costs in the consolidated balance sheets as a reduction to the related debt liability rather than as an asset. Amortization of debt issuance costs continues to be classified as interest expense. The adoption of this ASU did not have a material impact on our consolidated financial statements.
62
PAREXEL INTERNATIONAL CORPORATION
NOTES TO CONSOLIDATED FINANCIAL STATEMENTS (CONTINUED)
The Company adopted ASU No. 2016-09 (“ASU 2016-09”), Compensation-Stock Compensation (Topic 718): Improvements to Employee Share-Based Payment Accounting. This ASU simplifies the accounting for share-based payment transactions, including the income tax consequences, classification of awards as either equity or liabilities, and classification on the statement of cash flows. The following summarizes the effects of the adoption on the Company's unaudited condensed consolidated financial statements:
Income taxes - Upon adoption of this standard, all excess tax benefits and tax deficiencies (including tax benefits of dividends on share-based payment awards) are recognized as income tax expense or benefit in the income statement. The tax effects of exercised or vested awards are treated as discrete items in the reporting period in which they occur. The Company also recognizes excess tax benefits regardless of whether the benefit reduces taxes payable in the current period. As a result, the Company recognized discrete adjustments to income tax expense for Fiscal Year 2017, in the amount of $4.5 million related to excess tax benefits. The Company has applied the modified retrospective adoption approach beginning in Fiscal Year 2017. This cumulative-effect adjustment related to tax assets that had previously arisen from tax deductions for equity compensation expenses that were greater than the compensation recognized for financial reporting. These assets had been excluded from the deferred tax assets and liabilities totals on the balance sheet as a result of certain realization requirements previously included in ASC 718. Prior periods have not been adjusted.
Forfeitures - Prior to adoption, share-based compensation expense was recognized on a straight line basis, net of estimated forfeitures, such that expense was recognized only for share-based awards that are expected to vest. A forfeiture rate was estimated annually and revised, if necessary, in subsequent periods if actual forfeitures differed from initial estimates. Upon adoption, the Company will no longer apply a forfeiture rate and instead will account for forfeitures as they occur. As we previously estimated forfeitures to determine stock-based compensation expense, this change resulted in a cumulative-effect adjustment as of July 1, 2016 to reduce retained earnings by $0.6 million.
Statements of Cash Flows - The Company historically accounted for excess tax benefits on the Statement of Cash Flows as a financing activity. Upon adoption of this standard, excess tax benefits are classified as an operating activity. The Company has elected to adopt this portion of the standard on a prospective basis beginning in Fiscal Year 2017. Prior periods have not been adjusted.
Earnings Per Share - The Company uses the treasury stock method to compute diluted earnings per share, unless the effect would be anti-dilutive. Under this method, the Company will no longer be required to estimate the tax rate and apply it to the dilutive share calculation for determining the dilutive earnings per share. The Company has applied this methodology beginning in Fiscal Year 2017, and prior periods have not been adjusted.
Upon adoption, no other aspects of ASU 2016-09 had a material effect on the Company's consolidated financial statements or related footnote disclosures.
NOTE 3 – ACQUISITIONS
The pro forma effects of the acquisitions described below are not significant to the Company's reported results for any period presented. Accordingly, no pro forma financial statements have been presented herein.
ATLAS ACQUISITION
On July 1, 2014, we acquired all of the outstanding equity securities of ATLAS, a provider of clinical research services in Turkey, the Middle East, and North Africa, for approximately $2.1 million. ATLAS provides services across all phases of clinical development, has broad therapeutic expertise, and provides clinical trial-related services from study planning and feasibility, through site selection, data management and medical writing. The business has been integrated into our CRS segment. The acquisition was funded with existing cash. The fair value of the acquired assets and assumed liabilities are reflected in the Consolidated Balance Sheets. The goodwill of $1.4 million arising from the Atlas acquisition largely reflects the expansion of our service offerings across geographic markets complementary to our existing markets. None of the goodwill is expected to be deductible for tax purposes.
CLININTEL ACQUISITION
On October 3, 2014, we acquired all of the outstanding equity securities of privately-owned ClinIntel, a provider of clinical Randomization and Trial Supply Management (RTSM) services, based in the United Kingdom. ClinIntel’s offerings have been combined into the ClinPhone® RTSM suite and are designed to make patient randomization and clinical supply chain solutions more efficient. Capabilities include advanced RTSM technologies for planning, forecasting and supply chain eLogistics. The business has been integrated into the PI segment.
63
PAREXEL INTERNATIONAL CORPORATION
NOTES TO CONSOLIDATED FINANCIAL STATEMENTS (CONTINUED)
The purchase price for the acquisition was approximately $8.8 million, plus the potential to pay up to an additional $16.2 million, representing the United States Dollar (the "USD") equivalent at the date of the acquisition, over a twenty-one months month period following the acquisition date if ClinIntel achieves certain financial targets. We funded the acquisition with existing cash.
The acquired assets and assumed liabilities from ClinIntel were recorded at fair value at the date of acquisition. We finalized the fair value estimates of the acquired assets and the assumed liabilities in June 2015. The components of the consideration transferred in conjunction with the ClinIntel acquisition and the respective fair value of the assets acquired and liabilities assumed as of the acquisition date are as follows (dollars in millions):
Total consideration transferred: | ||||
Cash paid, net of cash acquired | $ | 8.8 | ||
Fair value of contingent consideration | 9.9 | |||
Net purchase price | $ | 18.7 | ||
Fair value of assets acquired and liabilities assumed: | ||||
Accounts receivable | $ | 0.4 | ||
Definite-lived intangible assets | 6.2 | |||
Goodwill | 13.4 | |||
Total assets acquired | 20.0 | |||
Current liabilities | 0.1 | |||
Deferred tax liabilities | 1.2 | |||
Total liabilities assumed | 1.3 | |||
Fair value of net assets acquired: | $ | 18.7 | ||
The fair value of the acquired assets and assumed liabilities are reflected in the Consolidated Balance Sheets. The goodwill of $13.4 million arising from the ClinIntel acquisition largely reflects the potential synergies and expansion of our service offerings across products and markets complementary to our existing service offering and markets. None of the goodwill is expected to be deductible for tax purposes. All contingent consideration obligations for this acquisition were paid.
The following are the identifiable intangible assets acquired and their respective fair value and estimated useful lives (dollars in millions):
Amount | Estimated Useful Life (Years) | |||||
Customer relationships | $ | 2.3 | 10 | |||
Technology | 3.9 | 8 | ||||
Total | $ | 6.2 | ||||
QUANTUM SOLUTIONS INDIA ACQUISITION
On April 13, 2015, we acquired all of the business assets of privately-owned Quantum Solutions India (“QSI”), a leading provider of specialized pharmacovigilance services, based in Chandigarh, India. Pharmacovigilance is the collection, detection, assessment, monitoring, and prevention of adverse effects associated with pharmaceutical products. The business has been integrated into our CRS segment.
We paid approximately $93.6 million for the assets of QSI. We funded the acquisition through use of existing cash held outside of the United States.
64
PAREXEL INTERNATIONAL CORPORATION
NOTES TO CONSOLIDATED FINANCIAL STATEMENTS (CONTINUED)
The acquired assets and assumed liabilities from QSI were recorded at fair value at the date of acquisition. We finalized the fair value estimates of the acquired assets and the assumed liabilities in June 2016. The consideration transferred in conjunction with the QSI acquisition and the respective estimated fair value of the assets acquired and liabilities assumed as of the acquisition date are as follows (dollars in millions):
Total consideration transferred: | ||||
Cash paid, net of cash acquired | $ | 93.6 | ||
Fair value of assets acquired and liabilities assumed: | ||||
Accounts receivable | $ | 4.9 | ||
Other Current Assets | 1.3 | |||
Property and equipment, net | 2.0 | |||
Definite-lived intangible assets | 62.4 | |||
Goodwill | 24.1 | |||
Total assets acquired | 94.7 | |||
Current liabilities | 1.1 | |||
Total liabilities assumed | 1.1 | |||
Fair value of net assets acquired: | $ | 93.6 | ||
The goodwill of $24.1 million arising from the QSI acquisition largely reflects the potential synergies and expansion of our service offerings across products and markets complementary to our existing service offering and markets. All of the goodwill held in the respective jurisdiction is deductible for tax purposes.
The following are the identifiable intangible assets acquired and their respective estimated useful lives, as determined based on the valuations (dollars in millions):
Amount | Estimated Useful Life (Years) | |||||
Customer relationships | $ | 56.3 | 10 | |||
Backlog | 4.7 | 1 | ||||
Trade name | 1.4 | 5 | ||||
Total | $ | 62.4 | ||||
HEALTH ADVANCES ACQUISITION
On January 19, 2016, we entered into a definitive agreement to acquire all of the outstanding equity securities of Health Advances, LLC (“Health Advances”), an independent life sciences strategy consulting firm. Health Advances combines clinical, scientific and business expertise to provide strategic advice to executives leading life sciences companies and investors. The acquisition closed on February 10, 2016, and is part of the PAREXEL Consulting Services (“PC”) segment.
The net purchase price for the acquisition was approximately $67.1 million, plus the potential to pay up to an additional $15.8 million over a thirty-six month period following the acquisition date if Health Advances achieves specified financial targets. We funded the acquisition with borrowings under our credit facilities.
65
PAREXEL INTERNATIONAL CORPORATION
NOTES TO CONSOLIDATED FINANCIAL STATEMENTS (CONTINUED)
The components of the consideration transferred in conjunction with the Health Advances acquisition and the fair value allocation of that consideration is as follows (dollars in millions):
Total consideration transferred: | ||||
Cash paid, net of cash acquired | $ | 67.3 | ||
Receivable from working capital adjustment | (0.2 | ) | ||
Fair value of contingent consideration | 4.5 | |||
Net purchase price | $ | 71.6 | ||
Allocation of consideration transferred: | ||||
Accounts receivable | $ | 4.0 | ||
Other current assets | 0.7 | |||
Property and equipment, net | 1.0 | |||
Deferred tax assets | 0.2 | |||
Definite-lived intangible assets | 15.0 | |||
Goodwill | 52.5 | |||
Total assets acquired | 73.4 | |||
Current liabilities | 1.8 | |||
Total liabilities assumed | 1.8 | |||
Net assets acquired: | $ | 71.6 | ||
During the Fiscal Year 2017, we received a working capital adjustment payment from the sellers of $0.2 million
The goodwill of $52.5 million arising from the Health Advances acquisition largely reflects the potential synergies and expansion of our service offerings across products and markets complementary to our existing service offering and markets. All of the goodwill is expected to be deductible for tax purposes.
The following are the identifiable intangible assets acquired and their respective estimated useful lives, as determined based on valuations (dollars in millions):
Amount | Estimated Useful Life (Years) | |||||
Customer relationships | $ | 11.6 | 10 | |||
Technology | 1.8 | 3 | ||||
Trade name | 1.6 | 5 | ||||
Total | $ | 15.0 | ||||
ExecuPharm, Inc.
On October 3, 2016, we acquired all of the capital stock of privately owned ExecuPharm, Inc. ("ExecuPharm"), a leading global functional service provider, based in Pennsylvania. ExecuPharm provides clinical monitoring or study management, along with associated operational activities such as onboarding, training, line management, performance management and policy administration.
We paid approximately $148.9 million for the capital stock of ExecuPharm, plus the potential for us to pay an additional $20 million if specific financial targets for ExecuPharm are achieved, and $5.0 million for management retention bonuses. In addition, we made a 338(h)(10) tax election with respect to the ExecuPharm acquisition. Under the 338(h)(10) election, ExecuPharm was deemed to have sold and repurchased its assets at fair market value. In connection with this election, the Company provided the seller with a tax gross-up payment, which was paid during the fourth quarter of our Fiscal Year 2017, in the estimated amount of $9.2 million. We funded the acquisition through the use of existing cash held within the United States and $100.0 million from our credit agreement as defined in Note 8. We included ExecuPharm results of operations in our CRS business segment.
66
PAREXEL INTERNATIONAL CORPORATION
NOTES TO CONSOLIDATED FINANCIAL STATEMENTS (CONTINUED)
The components of the consideration transferred in conjunction with the ExecuPharm acquisition and the allocation of that consideration is as follows (in millions):
Total consideration transferred: | ||||
Cash paid, net of cash acquired | $ | 148.5 | ||
Fair value of contingent consideration | 9.4 | |||
Deferred payment | 9.3 | |||
Net purchase price | $ | 167.2 | ||
Allocation of consideration transferred: | ||||
Accounts receivable | $ | 29.2 | ||
Other current assets | 0.1 | |||
Property and equipment, net | 0.9 | |||
Definite-lived intangible assets | 87.1 | |||
Goodwill | 58.6 | |||
Total assets acquired | 175.9 | |||
Current liabilities | 8.7 | |||
Total liabilities assumed | 8.7 | |||
Net assets acquired: | $ | 167.2 | ||
The amounts above represent our fair value estimates as of June 30, 2017 and may be subject to subsequent adjustment as we obtain additional information during the measurement period and finalize our fair value estimates.
The goodwill of $58.6 million arising from the ExecuPharm acquisition largely reflects the potential synergies and expansion of our service offerings across products and markets complementary to our existing service offering and markets. All of the goodwill is expected to be deductible for tax purposes.
The following are the identifiable intangible assets acquired and their respective estimated useful lives, based on valuations (dollars in millions):
Amount | Estimated Useful Life (Years) | |||||
Customer relationships | $ | 85.5 | 15 | |||
Trade name | 1.6 | 2 | ||||
Total | $ | 87.1 | ||||
The Medical Affairs Company, LLC
On March 1, 2017, we acquired all of the membership interests of privately owned The Medical Affairs Company, LLC ("TMAC"), a leading provider of outsourced medical affairs services to the pharmaceutical, biotechnology, and medical device industries.
We paid approximately $37.7 million for the membership interests of TMAC, plus the potential for us to pay an additional $11.0 million if specific financial targets for TMAC are achieved. We funded the acquisition through the use of existing cash held within the United States. We included TMAC results of operations in our Clinical Research Services ("CRS") business segment.
67
PAREXEL INTERNATIONAL CORPORATION
NOTES TO CONSOLIDATED FINANCIAL STATEMENTS (CONTINUED)
The components of the consideration transferred in conjunction with the TMAC acquisition and the allocation of that consideration are as follows (in millions):
Total consideration transferred: | ||||
Cash paid, net of cash acquired | $ | 36.3 | ||
Fair value of contingent consideration | 2.1 | |||
Net purchase price | $ | 38.4 | ||
Allocation of consideration transferred: | ||||
Accounts receivable | $ | 4.7 | ||
Other current assets | 0.1 | |||
Property and equipment, net | 0.3 | |||
Definite-lived intangible assets | 10.2 | |||
Goodwill | 25.8 | |||
Total assets acquired | 41.1 | |||
Current liabilities | 2.7 | |||
Total liabilities assumed | 2.7 | |||
Net assets acquired: | $ | 38.4 | ||
The amounts above represent our fair value estimates as of June 30, 2017 and may be subject to subsequent adjustment as we obtain additional information during the measurement period and finalize our fair value estimates.
The goodwill of $25.8 million arising from the TMAC acquisition largely reflects the potential synergies and expansion of our service offerings across products and markets complementary to our existing service offering and markets. All of the goodwill is expected to be deductible for tax purposes.
The following are the identifiable intangible assets acquired and their respective estimated useful lives, based on valuations (dollars in millions):
Amount | Estimated Useful Life (Years) | |||||
Customer relationships | $ | 7.5 | 10 | |||
Trade name | 0.7 | 3 | ||||
Backlog | 2.0 | 1 | ||||
Total | $ | 10.2 | ||||
NOTE 4. DERIVATIVES
We are exposed to certain risks relating to our ongoing business operations. The primary risks managed by using derivative instruments are interest rate risk and foreign currency exchange rate risk. Accordingly, we have instituted interest rate and foreign currency hedging programs that are accounted for in accordance with ASC 815, “Derivatives and Hedging” (“ASC 815”).
• | Our interest rate hedging program is a cash flow hedge program designed to minimize interest rate volatility. We swap the difference between fixed and variable interest amounts calculated by reference to an agreed-upon notional principal amount, at specified intervals. Our interest rate contracts are designated as hedging instruments. |
• | Our foreign currency hedging program is a cash flow hedge program designed to mitigate foreign currency exchange rate volatility due to the foreign currency exchange exposure related to our intercompany transactions, direct costs, service revenues and significant external transactions. We primarily utilize forward currency exchange contracts and cross-currency swaps with maturities of no more than 12 months. These contracts are designated as hedging instruments. |
We also enter into other economic hedges to mitigate foreign currency exchange risk and interest rate risk related to intercompany and significant external transactions. These contracts are not designated as hedges in accordance with ASC 815.
The following table presents the notional amounts and fair values of our derivatives as of June 30, 2017 and June 30, 2016. All asset and liability amounts are reported in other current and non-current assets and other current and non-current liabilities.
68
PAREXEL INTERNATIONAL CORPORATION
NOTES TO CONSOLIDATED FINANCIAL STATEMENTS (CONTINUED)
June 30, 2017 | June 30, 2016 | ||||||||||||||
(dollars in millions) | Notional Amount | Asset (Liability) | Notional Amount | Asset (Liability) | |||||||||||
Derivatives designated as hedging instruments under ASC 815 | |||||||||||||||
Derivatives in an asset position: | |||||||||||||||
Interest rate contracts | $ | 300.0 | $ | 0.7 | $ | — | $ | — | |||||||
Foreign exchange contracts | 122.7 | 4.8 | 81.2 | 3.5 | |||||||||||
Derivatives in a liability position: | |||||||||||||||
Interest rate contracts | 200.0 | (1.3 | ) | ||||||||||||
Foreign exchange contracts | 26.4 | (0.3 | ) | 103.3 | (8.9 | ) | |||||||||
Total designated derivatives | $ | 449.1 | $ | 5.2 | $ | 384.5 | $ | (6.7 | ) | ||||||
Derivatives not designated as hedging instruments under ASC 815 | |||||||||||||||
Derivatives in an asset position: | |||||||||||||||
Foreign exchange contracts | $ | 93.0 | $ | 2.2 | $ | 36.2 | $ | 1.5 | |||||||
Derivatives in a liability position: | |||||||||||||||
Foreign exchange contracts | 62.7 | (1.0 | ) | 48.0 | (1.4 | ) | |||||||||
Total non-designated derivatives | $ | 155.7 | $ | 1.2 | $ | 84.2 | $ | 0.1 | |||||||
Total derivatives | $ | 604.8 | $ | 6.4 | $ | 468.7 | $ | (6.6 | ) | ||||||
Under certain circumstances, such as the occurrence of significant differences between actual cash payments and forecasted cash payments, the ASC 815 programs could be deemed ineffective. We record the effective portion of any change in the fair value of derivatives designated as hedging instruments under ASC 815 to other accumulated comprehensive loss in our consolidated balance sheets, net of deferred taxes, and any ineffective portion to miscellaneous (expense) income, net in our consolidated statements of income. During Fiscal Years 2017 and 2016, the amounts recorded in miscellaneous (expense) income, net in our consolidated statements of income to reflect ineffective portions of any hedges were losses of $0.4 million and $2.3 million, respectively.
The amounts recognized for Fiscal Years 2017 and 2016 in other comprehensive income (loss) are presented below:
Fiscal Years | ||||||||
(dollars in millions) | 2017 | 2016 | ||||||
Derivatives designated as hedging instruments under ASC 815 | ||||||||
Interest rate contracts, net of taxes | $ | 1.1 | $ | (1.3 | ) | |||
Foreign exchange contracts, net of taxes | 7.5 | (4.5 | ) | |||||
Total designated derivative unrealized gain (loss), net | $ | 8.6 | $ | (5.8 | ) | |||
The unrealized gain (loss) on derivative instruments is net of $2.6 million and $1.3 million of taxes for Fiscal Years 2017 and 2016, respectively. The estimated net amount of the existing gains that are expected to be reclassified into earnings within the next twelve months is $3.3 million.
The change in the fair value of derivatives not designated as hedging instruments under ASC 815 is recorded to miscellaneous (expense) income, net in our consolidated statements of income. The total gains and losses related to foreign exchange contracts not designated as hedging instruments were gains of $2.3 million and losses of $1.7 million for Fiscal Years 2017 and 2016, respectively. The unrealized (loss) gain recognized is presented below:
Fiscal Years | ||||||||
(dollars in millions) | 2017 | 2016 | ||||||
Derivatives not designated as hedging instruments under ASC 815 | ||||||||
Foreign exchange contracts | $ | 1.1 | $ | 1.3 | ||||
Total non-designated derivative unrealized gain (loss), net | $ | 1.1 | $ | 1.3 | ||||
69
PAREXEL INTERNATIONAL CORPORATION
NOTES TO CONSOLIDATED FINANCIAL STATEMENTS (CONTINUED)
NOTE 5. PROPERTY AND EQUIPMENT
Property and equipment at June 30, 2017 and June 30, 2016 consisted of the following:
(dollars in millions) | 2017 | 2016 | ||||||
Property and equipment: | ||||||||
Computer software | $ | 473.3 | $ | 424.9 | ||||
Computer hardware and office equipment | 134.8 | 122.3 | ||||||
Leasehold improvements | 120.7 | 113.5 | ||||||
Medical equipment | 18.0 | 15.2 | ||||||
Furniture and fixtures | 32.8 | 30.7 | ||||||
Office equipment and other assets | 18.2 | 17.2 | ||||||
Total | 797.8 | 723.8 | ||||||
Less: accumulated depreciation | (545.7 | ) | (464.5 | ) | ||||
Total | $ | 252.1 | $ | 259.3 | ||||
We retired $2.6 million and $4.0 million of fully-depreciated assets for Fiscal Years 2017 and 2016, respectively.
The Company recognized an impairment charge related to an internally-developed software program of approximately $5.7 million for twelve months of Fiscal Year 2017.
NOTE 6. GOODWILL AND INTANGIBLE ASSETS
Goodwill
The changes in the carrying amount of goodwill for Fiscal Years 2017 and 2016 were as follows:
(dollars in millions) | CRS | PC | PI | Consolidated | ||||||||||||
Goodwill - June 30, 2015 | $ | 143.8 | $ | 20.6 | $ | 190.5 | $ | 354.9 | ||||||||
Effect of changes in business segments | 3.9 | (3.9 | ) | — | — | |||||||||||
Goodwill arising from Health Advances acquisition | — | 52.5 | — | 52.5 | ||||||||||||
Effect of changes in exchange rates used for translation | (5.9 | ) | (2.1 | ) | (10.2 | ) | (18.2 | ) | ||||||||
Goodwill - June 30, 2016 | $ | 141.8 | $ | 67.1 | $ | 180.3 | $ | 389.2 | ||||||||
Goodwill arising from ExecuPharm acquisition | 58.6 | — | — | 58.6 | ||||||||||||
Goodwill arising from TMAC acquisition | 25.8 | — | — | 25.8 | ||||||||||||
Effect of changes in exchange rates used for translation | 1.6 | 2.9 | (1.8 | ) | 2.7 | |||||||||||
Goodwill - June 30, 2017 | $ | 227.8 | $ | 70.0 | $ | 178.5 | $ | 476.3 | ||||||||
Long-lived Assets and Other Intangible Assets
As of June 30, 2017, intangible assets consisted of the following:
(dollars in millions) | Weighted Average Useful Life (Years) | Cost | Accumulated Amortization/ Effect of Exchange Rate Changes | Net | ||||||||||
Intangible Asset | ||||||||||||||
Customer relationships and backlog | 12.5 | $ | 271.0 | $ | (97.2 | ) | $ | 173.8 | ||||||
Technology and other intangibles | 8.0 | 39.5 | (34.9 | ) | 4.6 | |||||||||
Definite-life tradename | 5.4 | 9.2 | (4.1 | ) | 5.1 | |||||||||
Indefinite-life tradename * | indefinite | 22.2 | (5.9 | ) | 16.3 | |||||||||
Total intangible assets | $ | 341.9 | $ | (142.1 | ) | $ | 199.8 | |||||||
* The tradename acquired in the ClinPhone acquisition has an indefinite useful life. | ||||||||||||||
70
PAREXEL INTERNATIONAL CORPORATION
NOTES TO CONSOLIDATED FINANCIAL STATEMENTS (CONTINUED)
As of June 30, 2016, intangible assets consisted of the following:
(dollars in millions) | Weighted Average Useful Life (Years) | Cost | Accumulated Amortization/ Effect of Exchange Rate Changes | Net | ||||||||||
Intangible Asset | ||||||||||||||
Customer relationships and backlog | 11.6 | $ | 176.1 | $ | (74.5 | ) | $ | 101.6 | ||||||
Technology and other intangibles | 8.0 | 39.5 | (31.4 | ) | 8.1 | |||||||||
Definite-life tradename | 6.6 | 6.9 | (2.4 | ) | 4.5 | |||||||||
Indefinite-life tradename * | indefinite | 22.1 | (5.6 | ) | 16.5 | |||||||||
Total intangible assets | $ | 244.6 | $ | (113.9 | ) | $ | 130.7 | |||||||
* The tradename acquired in the ClinPhone acquisition has an indefinite useful life. | ||||||||||||||
The changes in the carrying amounts of other intangible assets for Fiscal Years 2017 and 2016 were as follows:
(dollars in millions) | Fiscal Year 2017 | Fiscal Year 2016 | ||||||
Beginning balance | $ | 130.7 | $ | 142.1 | ||||
Intangibles assets acquired from Health Advances acquisition | — | 15.0 | ||||||
Intangibles assets acquired from ExecuPharm acquisition | 87.1 | — | ||||||
Intangibles assets acquired from TMAC acquisition | 10.2 | — | ||||||
Amortization | (27.7 | ) | (22.3 | ) | ||||
Effect of changes in exchange rates used for translation | (0.5 | ) | (4.1 | ) | ||||
Ending balance | $ | 199.8 | $ | 130.7 | ||||
Estimated amortization expense for the next five fiscal years is as follows:
(dollars in millions) | ||||||||
2018 | 2019 | 2020 | 2021 | 2022 | ||||
$29.5 | $26.7 | $25.5 | $21.9 | $17.7 | ||||
NOTE 7. RESTRUCTURING CHARGES
January 6, 2017, we approved a plan to restructure our operations to improve the productivity and efficiency of the company, simplify the organization, and streamline decision-making, thereby enhancing client engagement. In May 2017, the company approved an expansion of the 2017 Restructuring Program. For the Fiscal Year 2017 we recorded a $40.7 million restructuring charge, related to the 2017 Restructuring Program, of which employee separation benefits amounted to $39.7 million, remaining $1.0 million relates to facilities separation cost.
In June 2015, the Board of Directors approved a plan (the “Margin Acceleration Program”) to restructure our operations to improve the productivity and efficiency of the Company, simplify the organization, and streamline decision-making, thereby enhancing client engagement. The Margin Acceleration Program was companywide. The activities under the Margin Acceleration Program were substantially complete as of June 30, 2016. For Fiscal Year 2017 and 2016, we recorded $0.5 million and $27.8 million, respectively, in restructuring charges related to the Margin Acceleration Program.
Various restructuring plans adopted by us since Fiscal Year 2005 are included in the Pre-2012 Plans.
71
PAREXEL INTERNATIONAL CORPORATION
NOTES TO CONSOLIDATED FINANCIAL STATEMENTS (CONTINUED)
Changes in the restructuring accrual during Fiscal Year 2017 are summarized below:
Balance at | Charges/(Benefits) | Payments/Foreign Currency Exchange | Balance at | |||||||||||||
(dollars in millions) | June 30, 2016 | June 30, 2017 | ||||||||||||||
2017 Restructuring Plan | ||||||||||||||||
Employee severance | $ | — | $ | 39.7 | $ | (10.7 | ) | $ | 29.0 | |||||||
Facilities-related and other costs | — | 1.0 | — | 1.0 | ||||||||||||
2015 Margin Acceleration Program | ||||||||||||||||
Employee severance | 10.5 | (1.0 | ) | (9.1 | ) | 0.4 | ||||||||||
Facilities-related and other costs | 7.1 | 1.5 | (5.0 | ) | 3.6 | |||||||||||
Pre-2012 Restructuring Plans | ||||||||||||||||
Facilities-related and other costs | 0.1 | — | (0.1 | ) | — | |||||||||||
Total | $ | 17.7 | $ | 41.2 | $ | (24.9 | ) | $ | 34.0 | |||||||
Net restructuring charges by segment for Fiscal Year 2017 and Fiscal Year 2016 are as follows:
Fiscal Year Ended June 30, | ||||||||
(dollars in millions) | 2017 | 2016 | ||||||
CRS | $ | 26.4 | $ | 9.1 | ||||
PC | (0.1 | ) | 2.3 | |||||
PI | 6.3 | 10.6 | ||||||
Segment Total | 32.6 | 22.0 | ||||||
Corporate restructuring charges | 8.6 | 5.8 | ||||||
Total restructuring charges | $ | 41.2 | $ | 27.8 | ||||
NOTE 8. CREDIT ARRANGEMENTS
2016 Credit Agreement
On March 11, 2016, PAREXEL, certain subsidiaries of PAREXEL, Bank of America, N.A. (“Bank of America”), as Administrative Agent, Swingline Lender and L/C Issuer; Merrill Lynch, Pierce, Fenner & Smith Incorporated (“MLPFS”); HSBC Bank USA, National Association (“HSBC”); U.S. Bank, National Association (“US Bank”); TD Securities (USA) LLC (“TD Securities”); and Wells Fargo Securities, LLC (“Wells Fargo Securities”) as Joint Lead Arrangers and Joint Book Managers, HSBC, US Bank, TD Bank, N.A. (“TD Bank”) and Wells Fargo Bank, National Association (“Wells Fargo Bank”) as Joint Syndication Agents, and the other lenders party thereto entered into an amended and restated credit agreement (the “2016 Credit Agreement”) providing for a five-year term loan and revolving credit facility in the principal amount of up to $750.0 million (collectively, the “Loan Amount”), plus additional amounts of up to $300.0 million of loans to be made available upon request of the Company subject to specified terms and conditions.
The 2016 Credit Agreement amends and restates the amended and restated credit agreement dated as of October 15, 2014, (the “2014 Credit Agreement”), by and among the Company, certain subsidiaries of the Company, Bank of America, as Administrative Agent, Swingline Lender and L/C Issuer; MLPFS, J.P. Morgan Securities LLC; HSBC; and US Bank, as Joint Lead Arrangers and Joint Book Managers; JPMorgan Chase Bank N.A.; HSBC and US Bank; as Joint Syndication Agents, and the other lenders party thereto.
The 2016 Credit Agreement is intended to provide funds (i) for stock repurchases, (ii) for the issuance of letters of credit and (iii) for other general corporate purposes of PAREXEL and its subsidiaries, including permitted acquisitions.
The 2016 Credit Agreement provides for a revolving credit facility in the principal amount of up to $350.0 million from time to time outstanding. A portion of the revolving credit facility is available for swingline loans of up to a sublimit of $100.0 million and for the issuance of standby letters of credit up to a sublimit of $10.0 million.
On the closing date of March 11, 2016, after giving effect to the amendment and restatement of the 2014 Credit Agreement and the effectiveness of the 2016 Credit Agreement, the Company was obligated under the 2016 Credit Agreement for term loans in the principal amount of $400.0 million and revolving loans in the principal amount of $65.0 million.
As of June 30, 2017, we had $180.0 million of principal borrowed under the revolving credit facility and $385.0 million of principal borrowed under the term loan. The outstanding amount is presented net of debt issuance costs of approximately $2.4 million in
72
PAREXEL INTERNATIONAL CORPORATION
NOTES TO CONSOLIDATED FINANCIAL STATEMENTS (CONTINUED)
our consolidated balance sheet at June 30, 2017. As of June 30, 2017, we had borrowing availability of $170.0 million under the revolving credit facility.
PAREXEL’s obligations under the 2016 Credit Agreement are guaranteed by certain material domestic subsidiaries of the Company, and the obligations, if any, of any foreign designated borrower are guaranteed by the Company and certain of its material domestic subsidiaries.
Borrowings (other than swingline loans) under the 2016 Credit Agreement bear interest, at PAREXEL’s determination, at a rate based on either (a) LIBOR plus a margin (not to exceed a per annum rate of 2.0%) based on a ratio of consolidated net funded debt to consolidated earnings before interest, taxes, depreciation and amortization (EBITDA) (the “Consolidated Net Leverage Ratio”) or (b) the highest of (i) prime, (ii) the federal funds rate plus 50 basis points, and (iii) the one month LIBOR rate plus 100 basis points (such highest rate, the “Alternate Base Rate”), plus a margin (not to exceed a per annum rate of 1.0%) based on the Consolidated Net Leverage Ratio. Swingline loans in U.S. dollars bear interest calculated at the Alternate Base Rate plus a margin (not to exceed a per annum rate of 1.0%). Loans outstanding under the 2016 Credit Agreement may be prepaid at any time in whole or in part without premium or penalty, other than customary breakage costs, if any, subject to the terms and conditions contained in the 2016 Credit Agreement. The 2016 Credit Agreement terminates and any outstanding loans under it mature on March 11, 2021.
Repayment of the principal borrowed under the revolving credit facility (other than a swingline loan) is due on March 11, 2021. A swingline loan under the 2016 Credit Agreement generally must be paid ten (10) business days after the loan is made. Repayment of principal borrowed under the term loan facility is as follows, with the final payment of all amounts outstanding, plus accrued interest, being due on March 11, 2021:
• | 0.63% by quarterly term loan amortization payments to be made commencing June 30, 2016 and made on or prior to June 30, 2017; |
• | 1.25% by quarterly term loan amortization payments to be made on or after June 30, 2017, but on or prior to March 31, 2019; |
• | 1.88% by quarterly term loan amortization payments to be made on or after June 30, 2019, but on or prior to March 31, 2020; |
• | 2.50% by quarterly term loan amortization payments to be made on or after June 30, 2020, but prior to March 11, 2021; and |
• | 72.50% (or if less, the remaining principal amount of the term loan) on March 11, 2021. |
To the extent not previously paid, all borrowings under the 2016 Credit Agreement must be repaid on March 11, 2021.
Interest due under the revolving credit facility (other than a swingline loan) and the term loan facility must be paid quarterly for borrowings with an interest rate determined with reference to the Alternate Base Rate. Interest must be paid on the last day of the interest period selected by the Company for borrowings determined with reference to LIBOR, provided that for interest periods of longer than three months, interest is required to be paid every three months. Interest under US dollar swingline loans at the alternate base rate is payable quarterly.
The obligations of PAREXEL under the 2016 Credit Agreement may be accelerated upon the occurrence of an event of default under the 2016 Credit Agreement, which includes customary events of default, including payment defaults, defaults in the performance of affirmative and negative covenants, the inaccuracy of representations or warranties, bankruptcy and insolvency related defaults, cross defaults to material indebtedness, defaults relating to such matters as ERISA and judgments, and a change of control default.
The 2016 Credit Agreement contains negative covenants applicable to PAREXEL and its subsidiaries, including financial covenants requiring PAREXEL to comply with maximum net leverage ratios and minimum interest coverage ratios, as well as restrictions on liens, investments, indebtedness, fundamental changes, acquisitions, dispositions of property, making specified restricted payments (including cash dividends and stock repurchases that would result in the Company exceeding an agreed to Consolidated Net Leverage Ratio), transactions with affiliates, and other restrictive covenants. As of June 30, 2017, we were in compliance with all covenants under the 2016 Credit Agreement.
Under the terms of the 2016 Credit Agreement, neither we nor any of our subsidiaries may pay any dividend or make any other distribution with respect to any shares of capital stock except that (a) we and our subsidiaries may declare and pay dividends with respect to equity interests payable solely in additional shares of common stock, (b) our subsidiaries may declare and pay dividends and other distributions ratably with respect to their equity interests, (c) we may make payments pursuant to and in accordance with stock option plans or other benefit plans for management or employees of the Company and our subsidiaries, and (d) the Company and certain of its subsidiaries may make payments in connection with permitted repurchases of their respective capital stock.
In connection with the 2016 Credit Agreement, PAREXEL agreed to pay a commitment fee on the revolving loan commitment calculated as a percentage of the unused amount of the revolving loan commitment at a per annum rate of up to 0.250% (based
73
PAREXEL INTERNATIONAL CORPORATION
NOTES TO CONSOLIDATED FINANCIAL STATEMENTS (CONTINUED)
on the Consolidated Net Leverage Ratio). To the extent there are letters of credit outstanding under the 2016 Credit Agreement, PAREXEL will pay letter of credit fees plus a fronting fee and additional charges. PAREXEL agreed to pay (i) Bank of America for its own account, an arrangement fee, (ii) to each of the lenders on the closing date, an upfront fee, and (iii) to Bank of America for its own account, an annual agency fee.
In May 2013, we entered into an interest rate swap agreement and hedged an additional principal amount of $100.0 million under the 2013 Credit Agreement with a fixed interest rate of 0.73%. The interest rate swap agreement now hedges $100.0 million of principal under our 2016 Credit Agreement.
On October 1, 2015, we entered into a two year interest rate swap agreement effective September 30, 2016, which now hedges an additional principal amount of $100.0 million under the 2016 Credit Agreement with a fixed interest rate 1.104%.
On April 26, 2017, we entered into a four year interest rate swap agreement effective April 28, 2017, which now hedges an additional principal amount of $100.0 million under the 2016 Credit Agreement with a fixed interest rate 1.7680%.
The 2013 and 2015 interest rate hedges were deemed to be fully effective in accordance with ASC 815 and, as such, unrealized gains and losses related to these derivatives are recorded as other comprehensive income in our consolidated balance sheets. As of June 30, 2017, we recognized less than $0.1 million of interest expense related to the ineffectiveness of the 2017 interest rate swap.
2016 Term Loan Agreement
On February 10, 2016, PAREXEL entered into a short term unsecured term loan agreement with TD Bank, providing for a loan to the Company in the amount of $75.0 million (the “Loan”). The Loan matured on April 30, 2016. The Loan bore interest, at PAREXEL’s determination, at a base rate plus a margin (such margin not to exceed a per annum rate of 0.750%) based on a ratio of consolidated funded debt to consolidated earnings before interest, taxes, depreciation and amortization (EBITDA) for the prior four fiscal quarters (the “Leverage Ratio”), or at a LIBOR rate plus a margin (such margin not to exceed a per annum rate of 1.750%) based on the Leverage Ratio.
The proceeds of the Loan were advanced to the Company on February 12, 2016 and were used to repay borrowings under the Company’s 2014 Facility.
As of June 30, 2017, all outstanding amounts under the Loan were fully repaid with the proceeds from the 2016 Credit Agreement.
Master Financing Agreement
On June 12, 2015, we entered into a 3 year, interest free Master Financing Agreement for $7.1 million with General Electric Capital Corporation, (“GECC”), in conjunction with a software term license purchase. On June 30, 2015 we received the gross proceeds of $7.1 million from GECC. Repayment of the principal borrowed under the Master Financing Agreement is due annually on July 1st as follows:
• | $1.4 million made on or prior to July 1, 2015; |
• | $2.8 million made on or prior to July 1, 2016; and |
• | $2.8 million made on or prior to July 1, 2017. |
At June 30, 2017, we had $2.8 million principal borrowed under the Master Financing Agreement.
Note Purchase Agreement
On July 25, 2013, we issued $100.0 million principal amount of 3.11% senior notes due July 25, 2020 (the “Notes”) for aggregate gross proceeds of $100.0 million in a private placement solely to accredited investors. The Notes were issued pursuant to a Note Purchase Agreement entered into by us with certain institutional investors on June 25, 2013 (the “Note Purchase Agreement”). Proceeds from the Notes were used to pay down $100.0 million of principal borrowed under the revolving credit facility portion of the 2013 Credit Agreement. We will pay interest on the outstanding balance of the Notes at a rate of 3.11% per annum, payable semi-annually on January 25 and July 25 of each year until the principal on the Notes shall have become due and payable. We may, at our option, upon notice and subject to the terms of the Note Purchase Agreement, prepay at any time all or part of the Notes in an amount not less than 10% of the aggregate principal amount of the Notes then outstanding, plus a Make-Whole Amount (as defined in the Note Purchase Agreement). The Notes become due and payable on July 25, 2020, unless payment is required to be made earlier under the terms of the Note Purchase Agreement.
The Note Purchase Agreement includes operational and financial covenants, with which we are required to comply, including, among others, maintenance of certain financial ratios and restrictions on additional indebtedness, liens and dispositions. As of June 30, 2017, we were in compliance will all covenants under the Note Purchase Agreement.
In connection with the Note Purchase Agreement, certain subsidiaries of ours entered into a Subsidiary Guaranty, pursuant to which such subsidiaries guaranteed our obligations under the Notes and the Note Purchase Agreement.
74
PAREXEL INTERNATIONAL CORPORATION
NOTES TO CONSOLIDATED FINANCIAL STATEMENTS (CONTINUED)
As of June 30, 2017, we had $100 million of principal borrowed under the Note Purchase Agreement. The outstanding amounts are presented net of debt issuance cost of approximately $0.3 million in our consolidated balance sheets. Our debt under the Note Purchase Agreement carried an average annualized interest rate of 3.05%.
Receivable Purchase Agreement
On February 22, 2017, we entered into a receivables purchase agreement (the “Bank of America Receivable Agreement”) with Bank of America, N.A. (“Bank”). Under the Bank of America Receivable Agreement, we sell to the Bank or other investors on an ongoing basis certain of our trade receivables, together with ancillary rights and the proceeds thereof, which arise under contracts with a client, or its subsidiaries or affiliates. The Bank of America Receivable Agreement includes customary representations and covenants on behalf of us, and may be terminated by either us or the Bank upon thirty business days' advance notice. The Bank of America Receivable Agreement provides a mechanism for accelerating the receipt of cash due on outstanding receivables. We account for the transfer of our receivables with respect to which we have satisfied the applicable revenue recognition criteria in accordance with ASC 860, “Transfers and Servicing.” If we have not satisfied the applicable revenue recognition criteria for the underlying sales transaction, the transfer of the receivable is accounted for as a financing activity in accordance with ASC 470, “Debt.” The accounts receivable and short-term debt balances are derecognized from our consolidated balance sheets at the earlier of the factored receivable’s due date or when all of the revenue recognition criteria are met for those billed services. For Fiscal Year 2017, we transferred approximately $27.6 million of trade receivables. As of June 30, 2017, $6.4 million of the transfers were accounted for as a financing activity.
On February 19, 2013, we entered into a receivables purchase agreement (the “Receivable Agreement”) with JPMorgan Chase Bank, N.A. (“JPMorgan”). Under the Receivable Agreement, we sell to JPMorgan or other investors on an ongoing basis certain of our trade receivables, together with ancillary rights and the proceeds thereof, which arise under contracts with a client of ours, or its subsidiaries or affiliates. The Receivable Agreement includes customary representations and covenants on behalf of us, and may be terminated by either us or JPMorgan upon five business days advance notice. The Receivable Agreement provides a mechanism for accelerating the receipt of cash due on outstanding receivables. We account for the transfer of our receivables with respect to which we have satisfied the applicable revenue recognition criteria in accordance with FASB ASC 860, “Transfers and Servicing.” If we have not satisfied the applicable revenue recognition criteria for the underlying sales transaction, the transfer of the receivable is accounted for as a financing activity in accordance with FASB ASC 470, “Debt.” The accounts receivable and short-term debt balances are derecognized from our consolidated balance sheets at the earlier of the factored receivable’s due date or when all of the revenue recognition criteria are met for those billed services. For Fiscal Year 2017 and 2016, we transferred approximately $0.7 million and $73.6 million of trade receivables, respectively. As of June 30, 2017 and 2016 no transfers were accounted for as a financing activity.
2014 Credit Agreement
The 2014 Credit Agreement provided for a five-year term loan and revolving credit facility in the principal amount of up to $500.0 million (collectively, the “Loan Amount”), plus additional amounts of up to $300.0 million of loans to be made available upon request of the Company subject to specified terms and conditions. The loan facility available under the 2014 Credit Agreement consisted of a term loan facility and a revolving credit facility. The principal amount of up to $200.0 million of the Loan Amount was available through the term loan facility, and the principal amount of up to $300.0 million of the Loan Amount was available through the revolving credit facility. A portion of the revolving credit facility was available for swingline loans of up to a sublimit of $100.0 million and for the issuance of standby letters of credit of up to a sublimit of $10.0 million.
Our obligations under the 2014 Credit Agreement were guaranteed by certain of our material domestic subsidiaries, and the obligations, if any, of any foreign designated borrower were guaranteed by us and certain of our material domestic subsidiaries.
The 2014 Credit Agreement was superseded by the 2016 Credit Agreement and as of June 30, 2016 all outstanding amounts under the 2014 Credit Agreement were fully repaid.
Additional Lines of Credit
On December 23, 2016, we entered into an unsecured line of credit with HSBC Bank, USA in the amount of $100 million. The line bears interest, at our determination, at a base rate plus a margin (such margin not to exceed a per annum rate of 1.00%) based on a ratio of consolidated funded debt to consolidated earnings before interest, taxes, depreciation and amortization (EBITDA) for the prior four fiscal quarters (the “Leverage Ratio”), or at a LIBOR rate plus a margin (such margin not to exceed a per annum rate of 2.00%) based on the Leverage Ratio. We entered into this line of credit to facilitate business transactions during the remaining Fiscal Year 2017. This line matured on June 23, 2017, and no borrowings were outstanding as of June 30, 2017.
We have an unsecured line of credit with JP Morgan UK in the amount of $4.5 million that bears interest at an annual rate ranging between 2.00% and 4.00%. We entered into this line of credit to facilitate business transactions. At June 30, 2017, we had $4.5 million available under this line of credit.
75
PAREXEL INTERNATIONAL CORPORATION
NOTES TO CONSOLIDATED FINANCIAL STATEMENTS (CONTINUED)
We have an unsecured uncommitted overdraft facility with ING Bank NV in the amount of 7.5 million Euros that bears interest at an annual rate ranging between 2.00% and 4.00%. We entered into this line of credit to facilitate business transactions. At June 30, 2017, we had 7.5 million Euros available under this line of credit.
NOTE 9. STOCKHOLDERS’ EQUITY
Share Repurchase Plan
Fiscal Year 2017 Share Repurchase
On October 26, 2016, we announced that our Board of Directors approved an accelerated share repurchase program (the “2017 Program”) authorizing the repurchase of up to $200.0 million of our common stock to be financed with cash on hand, cash generated from operations, existing credit facilities, or new financing. On November 21, 2016, we entered into an agreement (the “2017 Agreement”) to purchase shares of our common stock from HSBC, National Association (“HSBC”), for an aggregate purchase price of $200.0 million pursuant to an accelerated share purchase program. Pursuant to the 2017 Agreement, in November 2016, we paid $200.0 million to HSBC and received from HSBC 2.8 million shares of our common stock, representing 80% of the estimated shares to be repurchased by us under the 2017 Agreement. The shares were repurchased at a price of $57.51 per share, which was the closing price of our common stock on the Nasdaq Global Select Market on November 21, 2016. These shares were canceled and restored to the status of authorized and unissued shares. We recorded the $160.0 million payment, which represents the 80% of the shares we repurchased, as a decrease to equity in our consolidated balance sheet, consisting of decreases in common stock and additional paid-in capital. As additional paid-in capital was reduced to zero, the remainder was applied as a reduction in retained earnings. The remaining $40.0 million, which was an advanced payment accounted for as a forward accelerated share repurchase contract, was recorded within other current assets within the condensed consolidated balance sheet. During the Fiscal Year 2017, the fair value of the forward accelerated share repurchase contract decreased by $20.7 million.
On March 20, 2017, we received 0.3 million shares representing the final settlement of the 2017 Agreement and the 2017 Program was completed. We applied the $19.3 million against equity as additional paid-in capital, which was reduced to zero and the remainder was applied as a reduction in retained earnings. Pursuant to the 2017 Program, we repurchased 3.1 million shares of our common stock at an average price of $64.04 per share from November 2016 to March 2017.
Fiscal Year 2016 Share Repurchase
On September 14, 2015, we announced that our Board of Directors approved a share repurchase program (the “2016 Program”) authorizing the repurchase of up to $200.0 million of our common stock to be financed with cash on hand, cash generated from operations, existing credit facilities, or new financing. On September 15, 2015, we entered into an agreement (the “2016 Agreement”) to purchase shares of our common stock from Wells Fargo Bank, National Association (“WF”), for an aggregate purchase price of $200.0 million pursuant to an accelerated share purchase program. Pursuant to the 2016 Agreement, in September 2015, we paid $200.0 million to WF and received from WF 2.3 million shares of our common stock, representing 80% of the shares to be repurchased by us under the 2016 Agreement. The shares were repurchased at a price of $70.35 per share, which was the closing price of our common stock on the Nasdaq Global Select Market on September 16, 2015. These shares were canceled and restored to the status of authorized and unissued shares.
On February 10, 2016 we received 0.9 million shares representing the final settlement of the 2016 Agreement and the 2016 Program was completed. Pursuant to the 2016 Program, we repurchased 3.2 million shares of our common stock at an average price of $62.92 per share from September 2015 to February 2016.
In Fiscal Year 2016, we recorded the $200.0 million payment to WF as a decrease to equity in our consolidated balance sheet, consisting of decreases in common stock and additional paid-in capital. As additional paid-in capital was reduced to zero, the remainder was applied as a reduction in retained earnings.
76
PAREXEL INTERNATIONAL CORPORATION
NOTES TO CONSOLIDATED FINANCIAL STATEMENTS (CONTINUED)
NOTE 10. EARNINGS PER SHARE
The following table outlines the basic and diluted earnings per common share computations:
Years ended June 30, | ||||||||||||
(dollars in millions, except per share data) | 2017 | 2016 | 2015 | |||||||||
Net income attributable to common shares | $ | 107.3 | $ | 154.9 | $ | 147.8 | ||||||
Weighted average number of shares outstanding, used in computing basic earnings per share | 51.5 | 53.5 | 54.9 | |||||||||
Dilutive common stock equivalents | 0.7 | 0.7 | 0.9 | |||||||||
Weighted average shares used in computing diluted earnings per share | 52.2 | 54.2 | 55.8 | |||||||||
Basic earnings per share | $ | 2.08 | $ | 2.90 | $ | 2.69 | ||||||
Diluted earnings per share | $ | 2.06 | $ | 2.86 | $ | 2.65 | ||||||
Anti-dilutive options and restricted stock (excluded from the calculation of diluted earnings per share) | 0.7 | 0.7 | 0.8 | |||||||||
NOTE 11. ACCUMULATED OTHER COMPREHENSIVE INCOME (LOSS)
The following table reflects the activity for the components of accumulated other comprehensive income (loss), net of tax, for the Fiscal Years ended 2017, 2016 and 2015:
(dollars in millions) | Foreign Currency | Unrealized Gain/Loss on Derivatives | Total | |||||||||
Balance at June 30, 2014 | $ | (2.1 | ) | $ | 4.2 | $ | 2.1 | |||||
Other comprehensive income before reclassifications | (94.1 | ) | (14.3 | ) | (108.4 | ) | ||||||
Loss reclassified from accumulated other comprehensive income (loss) | — | 10.4 | 10.4 | |||||||||
Net current-period other comprehensive income | $ | (94.1 | ) | $ | (3.9 | ) | $ | (98.0 | ) | |||
Balance at June 30, 2015 | $ | (96.2 | ) | $ | 0.3 | $ | (95.9 | ) | ||||
Other comprehensive loss before reclassifications | (34.3 | ) | (10.6 | ) | (44.9 | ) | ||||||
Gain reclassified from accumulated other comprehensive income (loss) | — | 4.8 | 4.8 | |||||||||
Net current-period other comprehensive loss | $ | (34.3 | ) | $ | (5.8 | ) | $ | (40.1 | ) | |||
Balance at June 30, 2016 | $ | (130.5 | ) | $ | (5.5 | ) | $ | (136.0 | ) | |||
Other comprehensive loss before reclassifications | 7.2 | 15.2 | 22.4 | |||||||||
Loss reclassified from accumulated other comprehensive income (loss) | — | (6.6 | ) | (6.6 | ) | |||||||
Net current-period other comprehensive loss | $ | 7.2 | $ | 8.6 | $ | 15.8 | ||||||
Balance at June 30, 2017 | $ | (123.3 | ) | $ | 3.1 | $ | (120.2 | ) | ||||
The change in our translation adjustment was due primarily to the movements in the Euro (EUR), Indian Rupee (INR), Taiwan Dollar (TWD), South African Rand (ZAR) Great British Pound (GBP) and Japanese Yen (JPY) exchange rates against the United States Dollar (USD). For Fiscal Year 2017, the USD weakened by 2.9%, 4.8%, 6.3%and 15.8% as compared to the EUR, INR, TWD and ZAR, respectively; and the USD appreciated by 8.7% and 3.2% against JPY and GBP during the same period. The movement in the EUR, INR, TWD and ZAR represents $5.0 million, $4.5 million, $2.3 million and $1.7 million, respectively, out of the $7.2 million foreign currency translation adjustment during Fiscal Year 2017. The overall change in our translation adjustment was partially offset by the movement in JPY and GBP, representing $2.1 million and $1.4 million, respectively. Also decreased by tax related CTA adjustment amounting to $3.5 million. This represents the Fiscal Year 2017 foreign exchange related movement in the non-US deferred tax, tax receivable/payable and tax exposure balances.
77
PAREXEL INTERNATIONAL CORPORATION
NOTES TO CONSOLIDATED FINANCIAL STATEMENTS (CONTINUED)
The details regarding pre-tax gain (loss) on derivative instruments reclassified to net income from accumulated other comprehensive income are presented below:
Fiscal Year | Affected Line in the Consolidated Statements of Income | |||||||||||||
(dollars in millions) | 2017 | 2016 | 2015 | |||||||||||
Interest rate contracts | $ | (0.4 | ) | $ | (0.5 | ) | $ | (1.5 | ) | Interest expense, net | ||||
Foreign exchange contracts | (2.6 | ) | (4.9 | ) | (12.3 | ) | Direct Costs | |||||||
Foreign exchange contracts | (5.4 | ) | (2.3 | ) | (2.7 | ) | Service revenue | |||||||
Cross-currency swap contracts | — | — | 0.2 | Miscellaneous (expense) income, net | ||||||||||
Total | $ | (8.4 | ) | $ | (7.7 | ) | $ | (16.3 | ) | |||||
The amounts of gain (loss) reclassified from accumulated other comprehensive loss into net income are net of taxes of $1.8 million, $2.9 million, and $5.9 million and for Fiscal Year 2017, 2016 and 2015, respectively.
NOTE 12. STOCK AND EMPLOYEE BENEFIT PLANS
Stock-Based Compensation
We account for stock-based compensation under ASC 718, “Compensation-Stock Compensation.” The stock option compensation cost calculated under the fair value approach is recognized over the vesting period of the stock options (generally over four years). All stock option grants are subject to graded vesting as services are rendered. The fair value for granted options is estimated at the time of the grant using the Black-Scholes option-pricing model. Expected volatilities are based on historical volatilities, and we use historical data to estimate option exercise behavior. The expected term represents an estimate of the period of time we expect the options to remain outstanding based on historical exercise and post-vesting termination data. The dividend yield equals the most recent dividend payment over the market price of the stock at the beginning of the period. The risk-free interest rate is the rate at the date of grant for a zero-coupon U.S. Treasury bond with a term that approximates the expected term of the option. The following weighted average assumptions were used in the Black-Scholes option-pricing model for awards issued during the respective periods:
Fiscal Years | |||||||||
2017 | 2016 | 2015 | |||||||
Dividend yield | 0.0 | % | 0.0 | % | 0.0 | % | |||
Expected volatility | 29.7 | % | 34.2 | % | 36.2 | % | |||
Risk-free interest rate | 0.9 | % | 1.6 | % | 1.7 | % | |||
Expected term (in years) | 5.0 | 5.0 | 5.0 | ||||||
For the last three fiscal years, we recognized the following stock-based compensation expense:
Fiscal Years | ||||||||||||
(dollars in millions) | 2017 | 2016 | 2015 | |||||||||
Direct costs related | $ | 4.7 | $ | 4.7 | $ | 4.4 | ||||||
Selling, general and administrative related | 17.4 | 15.4 | 13.5 | |||||||||
Total stock-based compensation | $ | 22.1 | $ | 20.1 | $ | 17.9 | ||||||
For Fiscal Years 2017, 2016, and 2015, the tax benefit related to stock compensation expense that we recognized was $7.1 million, $6.5 million, and $5.6 million, respectively. As of June 30, 2017, unearned stock-based compensation expense related to unvested awards (stock options and restricted stock) was approximately $41.6 million, which will be recognized over a weighted-average period of 2.2 years.
Stock Options
The Compensation Committee of the Board of Directors is responsible for the administration of our stock option plans and determines the term of each option, the option exercise price, the number of option shares granted, and the rate at which options become exercisable.
On December 3, 2015, the shareholders approved a new share-based compensation plan, the 2015 Stock Incentive Plan (the “2015 Plan”). The 2015 Plan allows for the issuance of up to the sum of (i) 3.0 million shares of PAREXEL common stock plus (ii) up to an additional 3.4 million shares of PAREXEL common stock from awards under the Existing Plans (as defined below), which expire, terminate or are otherwise surrendered, canceled, forfeited or repurchased by the Company. We stopped making awards
78
PAREXEL INTERNATIONAL CORPORATION
NOTES TO CONSOLIDATED FINANCIAL STATEMENTS (CONTINUED)
under the Existing Plans upon approval of the 2015 Plan by our shareholders. The term “Existing Plans” refers collectively to the Company’s 2005 Stock Incentive Plan, 2007 Stock Incentive Plan and 2010 Stock Incentive Plan.
The 2015 Plan allows for the grant of incentive stock options intended to qualify under Section 422 of the Internal Revenue Code of 1986, as amended, nonstatutory stock options, stock appreciation rights, restricted stock, restricted stock units and other stock-based awards, which are referred to collectively as “Awards.” The 2015 Plan became effective upon approval by our shareholders. No Awards may be made under the 2015 Plan after December 3, 2025.
We adopted stock incentive plans in December 2010, December 2007, and September 2005, each of which provides for the grant of incentive stock options, non-statutory stock options, stock appreciation rights, restricted stock, restricted stock units and other stock-based award grants of up to 9.0 million shares in aggregate to employees, officers, directors, consultants, and advisors. The granting of awards under these plans is discretionary, including the individuals who may become participants and receive awards under these plans and the number of shares they may acquire.
In September 2001, we adopted the 2001 Stock Incentive Plan, which provides for the grant of incentive and non-qualified stock options for the purchase of up to an aggregate of 2.0 million shares of common stock to our employees, officers, directors, consultants, and advisors (and any individuals who have accepted an offer for employment).
Options under all our stock incentive plans described above expire no more than ten years from the date of grant and the expiration date and vesting period may vary at the Board of Directors’ discretion.
The following table summarizes information related to stock option activity for the respective periods:
Fiscal Years | ||||||
(dollars in millions, except per share data) | 2017 | 2016 | 2015 | |||
Weighted-average fair value of options granted per share | $20.12 | $22.18 | $20.16 | |||
Intrinsic value of options exercised | $30.3 | $20.9 | $33.8 | |||
Stock option activity for the Fiscal Year was as follows:
Number of Options | Weighted-Average Exercise Price | Weighted- Average Remaining Contractual Life in Years | Aggregate Intrinsic Value (in Millions) | ||||||||||
Balance at June 30, 2016 | 3,332,803 | $ | 48.58 | 5.6 | $ | 52.2 | |||||||
Granted | 166,525 | $ | 68.73 | ||||||||||
Exercised | (892,122 | ) | $ | 36.79 | |||||||||
Canceled | (231,848 | ) | $ | 60.01 | |||||||||
Balance at June 30, 2017 | 2,375,358 | $ | 53.31 | 5.1 | $ | 79.8 | |||||||
Exercisable at June 30, 2017 | 1,111,925 | $ | 42.87 | 4.1 | $ | 49.0 | |||||||
Expected to vest at June 30, 2017 | 1,260,308 | $ | 62.49 | 6.0 | $ | 30.8 | |||||||
Restricted Stock
We use restricted stock awards (“RSAs”) and restricted stock units (“RSUs”), granted under the plans described above, as a component of compensation for executive officers, non-employee members of the Board of Directors, and other employees. In general, we granted RSAs and RSUs that will vest at the end of a three-year service period for employees or one-year service period for non-employee members of the Board. The fair values of restricted stock awards and restricted stock units were based upon the closing stock prices on the day of the grants. For Fiscal Year 2017, 2016, and 2015, the fair value of restricted stock awards vested was $5.9 million, $5.3 million, and $3.9 million, respectively. Restricted stock activity for Fiscal Year 2017 was:
Shares | Weighted-Average Grant- Date Fair Value | ||||||
Unvested Balance at June 30, 2016 | 286,637 | $ | 58.58 | ||||
Granted | 400,564 | $ | 65.70 | ||||
Vested | (113,156 | ) | $ | 51.95 | |||
Forfeited | (28,990 | ) | $ | 62.96 | |||
Unvested Balance at June 30, 2017 | 545,055 | $ | 64.95 | ||||
79
PAREXEL INTERNATIONAL CORPORATION
NOTES TO CONSOLIDATED FINANCIAL STATEMENTS (CONTINUED)
Employee Stock Purchase Plan
We sponsor an employee stock purchase plan (the “Purchase Plan”). The Purchase Plan allows eligible employees to purchase common stock at 95% of the fair market value of the stock on the last day of each purchase period (as defined by the Purchase Plan). The Purchase Plan also includes the automatic enrollment of contributions whereby an eligible employee’s compensation would be reduced and automatic enrollment contributions made on his/her behalf unless an affirmative election not to do so was made. The Purchase Plan is non-compensatory, and as such, no stock based compensation is recorded. An aggregate of approximately 1.8 million shares may be issued under the Purchase Plan.
The following table summarizes the purchases under the Purchase Plan for the last three fiscal years:
Shares Purchased | Average Purchase Price | ||||||
Fiscal Year 2017 | 54,571 | $ | 64.32 | ||||
Fiscal Year 2016 | 58,479 | $ | 62.05 | ||||
Fiscal Year 2015 | 57,557 | $ | 59.09 | ||||
Savings Plan
We sponsor an employee savings plan (“the Plan”) as defined by Section 401(k) of the Internal Revenue Code of 1986, as amended. The Plan covers substantially all employees in the U.S. who elect to participate. Participants have the opportunity to invest on a pre-tax basis in a variety of mutual fund options and our stock. We match 100% of each participant’s voluntary contributions up to 3% of gross salary per payroll period subject to an annual cap of $3,000. Our contributions vest to the participants in 20% increments for each year of employment and become fully vested after five years of continuous employment. Our contributions to the Plan were approximately $11.6 million, $10.8 million, and $10.7 million for the Fiscal Years 2017, 2016, and 2015, respectively.
NOTE 13. FAIR VALUE MEASUREMENTS
We apply the provisions of ASC 820, “Fair Value Measurements and Disclosures.” ASC 820 defines fair value and provides guidance for measuring fair value and expands disclosures about fair value measurements. ASC 820 enables the reader of financial statements to assess the inputs used to develop those measurements by establishing a hierarchy for ranking the quality and reliability of the information used to determine fair value. ASC 820 requires that assets and liabilities carried at fair value be classified and disclosed in one of the following three categories:
• | Level 1 – Unadjusted quoted prices in active markets that are accessible to the reporting entity at the measurement date for identical assets and liabilities. |
• | Level 2 – Inputs other than quoted prices in active markets for identical assets and liabilities that are observable either directly or indirectly for substantially the full term of the asset or liability. Level 2 inputs include the following: |
◦ | quoted prices for similar assets and liabilities in active markets |
◦ | quoted prices for identical or similar assets or liabilities in markets that are not active |
◦ | observable inputs other than quoted prices that are used in the valuation of the asset or liabilities (e.g., interest rate and yield curve quotes at commonly quoted intervals) |
◦ | inputs that are derived principally from, or corroborated by, observable market data by correlation or other means |
• | Level 3 – Unobservable inputs for the assets or liability (i.e., supported by little or no market activity). Level 3 inputs include management’s own assumptions about the assumptions that market participants would use in pricing the asset or liability (including assumptions about risk). |
The following table sets forth by level, within the fair value hierarchy, our assets (liabilities) carried at fair value as of June 30, 2017:
(dollars in millions) | Level 1 | Level 2 | Level 3 | Total | ||||||||||||
Contingent Consideration | $ | — | $ | — | $ | (18.0 | ) | $ | (18.0 | ) | ||||||
Interest Rate Derivative Instruments | — | 0.7 | — | 0.7 | ||||||||||||
Foreign Currency Exchange Contracts | — | 5.7 | — | 5.7 | ||||||||||||
Total | $ | — | $ | 6.4 | $ | (18.0 | ) | $ | (11.6 | ) | ||||||
80
PAREXEL INTERNATIONAL CORPORATION
NOTES TO CONSOLIDATED FINANCIAL STATEMENTS (CONTINUED)
The following table sets forth by level, within the fair value hierarchy, our assets (liabilities) carried at fair value as of June 30, 2016:
(dollars in millions) | Level 1 | Level 2 | Level 3 | Total | ||||||||||||
Contingent Consideration | $ | — | $ | — | $ | (5.2 | ) | $ | (5.2 | ) | ||||||
Interest Rate Derivative Instruments | — | (1.3 | ) | — | (1.3 | ) | ||||||||||
Foreign Currency Exchange Contracts | — | (5.3 | ) | — | (5.3 | ) | ||||||||||
Total | $ | — | $ | (6.6 | ) | $ | (5.2 | ) | $ | (11.8 | ) | |||||
Level 1 Estimates
Cash equivalents are measured at quoted prices in active markets. These investments are considered cash equivalents due to the short maturity (less than 90 days) of the investments.
Marketable securities are held in foreign government treasury certificates that are actively traded and have original maturities over 90 days but less than one year. As of June 30, 2017 and 2016, we did not hold any marketable securities.
Level 2 Estimates
Interest rate derivative instruments are measured at fair value using a market approach valuation technique. The valuation is based on an estimate of net present value of the expected cash flows using relevant mid-market observable data inputs and based on the assumption of no unusual market conditions or forced liquidation.
Foreign currency exchange contracts are measured at fair value using a market approach valuation technique. The inputs to this technique utilize current foreign currency exchange forward market rates published by leading third-party financial news and data providers. This is observable data that represent the rates that the financial institution uses for contracts entered into at that date; however, they are not based on actual transactions so they are classified as Level 2.
Level 3 Estimates
We have entered into a forward share repurchase contract in connection with our 2017 accelerated share repurchase program with HSBC. We recorded the $160.0 million payment, which represents the 80% of the shares we repurchased, as a decrease to equity in our consolidated balance sheet, consisting of decreases in common stock and additional paid-in capital. As additional paid-in capital was reduced to zero, the remainder was applied as a reduction in retained earnings. The remaining $40.0 million, which was an advance payment accounted for as a forward share repurchase contract, was recorded as within other current assets within the condensed consolidated balance sheet. The prepaid forward contract was initially valued at the transaction price of $40.0 million. The forward share repurchase contract was remeasured at fair value with market conditions based on the use of a Monte-Carlo Simulation Model. Increases or decreases in the fair value of our forward contract are primarily impacted by the Company's stock price.
On February 27, 2017, the Company entered into an amendment with HSBC to amend the definitions of the purchaser share cap and the seller share cap. This amendment modifies the contract in which the new terms qualify the ASR contract to be reclassified to equity. As of June 30, 2017 this has been settled as described in the table below.
During the Fiscal Year 2017, the fair value of the forward share repurchase contract decreased by $20.7 million. The change in fair value was recorded in miscellaneous (expense) income, net.
The recurring Level 3 fair value measurements of our forward share repurchase contract asset include the following significant unobservable inputs:
Forward Share | |
Unobservable Input | Repurchase Contract |
Risk free rate | 0.5% |
Share price volatility | 37.5% |
Contract term | 0.2 years |
81
PAREXEL INTERNATIONAL CORPORATION
NOTES TO CONSOLIDATED FINANCIAL STATEMENTS (CONTINUED)
The following table provides a summary of the change in our valuation of the fair value of the forward accelerated share repurchase contract asset, which was determined by Level 3 inputs:
(in millions) | ||||||
Balance at June 30, 2016 | $ | — | ||||
Additions of forward share repurchase contract | 40.0 | |||||
Change in fair value of forward share repurchase contract | (20.7 | ) | ||||
Reclass of forward accelerated share repurchase contract to equity | (19.3 | ) | ||||
Balance at June 30, 2017 | $ | — | ||||
Contingent consideration liabilities are re-measured to fair value each reporting period using projected financial targets, discount rates, probabilities of payment, and projected payment dates. Projected contingent payment amounts are discounted back to the current period using a discounted cash flow model. Projected financial targets are based on our most recent internal operational budgets and may take into consideration alternate scenarios that could result in more or less profitability for the respective service line. Increases or decreases in projected financial targets and probabilities of payment may result in significant changes in the fair value measurements. Increases in discount rates and the time to payment may result in lower fair value measurements. Increases or decreases in any of those inputs in isolation may result in a significantly lower or higher fair value measurement.
In March 2017, we acquired TMAC. The purchase price for the TMAC acquisition was approximately $37.7 million, plus the potential to pay up to an additional $11.0 million at the end of a three year period ending December 31, 2019 if TMAC achieves specific financial targets. The contingent consideration related to the TMAC acquisition is measured at fair value with market conditions based on the use of a Monte-Carlo Simulation Model. Increases or decreases in the fair value of our contingent consideration liability are primarily impacted by the likelihood of achieving financial targets, but also by changes in discount periods and rates.
In October 2016, we acquired ExecuPharm. The purchase price for the ExecuPharm acquisition was approximately $148.9 million, plus the potential to pay up to an additional $20.0 million at the end of a two year period ending June 30, 2018 if ExecuPharm achieves specific financial targets. The contingent consideration related to the ExecuPharm acquisition is measured at fair value with market conditions based on the use of a Monte-Carlo Simulation Model. Increases or decreases in the fair value of our contingent consideration liability are primarily impacted by the likelihood of achieving financial targets, but also by changes in discount periods and rates.
In February 2016, we acquired Health Advances. The purchase price for the Health Advances acquisition was approximately $67.1 million, plus the potential to pay up to an additional $15.8 million over a thirty-six month period following the acquisition date if Health Advances achieves specific financial targets. The contingent consideration related to the Health Advances acquisition is measured at fair value with market conditions based on the use of a Monte-Carlo Simulation Model. Increases or decreases in the fair value of our contingent consideration liability is primarily impacted by the likelihood of achieving financial targets, but also from changes in discount periods and rates.
The recurring Level 3 fair value measurements of our forward share repurchase contract asset include the following significant unobservable inputs:
Unobservable Input | Health Advances | ExecuPharm | TMAC | |||
Risk free rate | 1.3% | 1.2% | 1.5% | |||
Revenue volatility | 24% | 25% | 25% | |||
Projected period of payment | Approximately 2 years | 12 months | 2.5 years | |||
82
PAREXEL INTERNATIONAL CORPORATION
NOTES TO CONSOLIDATED FINANCIAL STATEMENTS (CONTINUED)
The following table provides a summary of the change in our valuation of the fair value of the contingent consideration, which was determined by Level 3 inputs:
(dollars in millions) | Fair Value | |||
Balance at June 30, 2015 | $ | 7.3 | ||
Additions of contingent consideration from Health Advances acquisition | 4.5 | |||
Change in fair value of contingent consideration | 8.7 | |||
Payment of contingent consideration | (14.1 | ) | ||
Effect of changes in exchange rates used for translation | (1.2 | ) | ||
Balance at June 30, 2016 | 5.2 | |||
Additions of contingent consideration | 11.5 | |||
Change in fair value of contingent consideration | 1.3 | |||
Balance at June 30, 2017 | $ | 18.0 | ||
For fiscal years 2017, 2016 and 2015, the change in fair value of contingent consideration of $1.3 million, $8.7 million and $7.4 million, was recorded in selling, general and administrative expense, respectively.
For fiscal years 2017 and 2016, there were no transfers among Level 1, Level 2, or Level 3 categories. Additionally, there were no changes in the valuation techniques used to determine the fair values of our Level 2 assets or liabilities over the same periods.
The fair value of the debt under the Notes was estimated to be $97.3 million as of June 30, 2017, and was determined using U.S. government treasury rates and Level 3 inputs, including a credit risk adjustment.
The carrying value of our short-term and long-term debt under the 2016 Credit Agreement approximates fair value because all of the debt bears variable rate interest.
NOTE 14. INCOME TAXES
Domestic and foreign income before income taxes for the last three fiscal years was as follows:
(dollars in millions) | 2017 | 2016 | 2015 | |||||||||
Domestic | $ | 74.6 | $ | 107.1 | $ | 101.1 | ||||||
Foreign | 81.6 | 108.1 | 99.1 | |||||||||
$ | 156.2 | $ | 215.2 | $ | 200.2 | |||||||
Provisions for income taxes for the last three fiscal years were as follows:
(dollars in millions) | 2017 | 2016 | 2015 | |||||||||
Current: | ||||||||||||
Federal | $ | 31.3 | $ | (4.9 | ) | $ | 36.6 | |||||
State | 2.6 | 4.5 | 8.6 | |||||||||
Foreign | 31.9 | 37.2 | 23.0 | |||||||||
65.8 | 36.8 | 68.2 | ||||||||||
Deferred: | ||||||||||||
Federal | (15.8 | ) | 23.2 | 6.7 | ||||||||
State | (1.1 | ) | 1.3 | (1.2 | ) | |||||||
Foreign | — | (1.0 | ) | (21.3 | ) | |||||||
(16.9 | ) | 23.5 | (15.8 | ) | ||||||||
$ | 48.9 | $ | 60.3 | $ | 52.4 | |||||||
83
PAREXEL INTERNATIONAL CORPORATION
NOTES TO CONSOLIDATED FINANCIAL STATEMENTS (CONTINUED)
Our consolidated effective income tax rate differed from the U.S. federal statutory income tax rate for the last three fiscal years as set forth below:
(dollars in millions) | 2017 | % | 2016 | % | 2015 | % | |||||||||||||||
Income tax expense computed at the federal statutory rate | $ | 54.7 | 35.0 | % | $ | 75.3 | 35.0 | % | $ | 70.1 | 35.0 | % | |||||||||
State income taxes, net of federal benefit | (0.8 | ) | (0.5 | )% | 4.3 | 2.0 | % | 5.1 | 2.5 | % | |||||||||||
Foreign rate differential | (13.8 | ) | (8.9 | )% | (12.8 | ) | (5.9 | )% | (4.3 | ) | (2.2 | )% | |||||||||
Change in valuation allowances | (12.1 | ) | (7.7 | )% | 13.3 | 6.2 | % | (0.8 | ) | (0.4 | )% | ||||||||||
Change in reserves | 1.5 | 1.0 | % | (5.7 | ) | (2.7 | )% | (2.1 | ) | (1.0 | )% | ||||||||||
Research and development | (0.6 | ) | (0.4 | )% | (9.0 | ) | (4.2 | )% | (13.4 | ) | (6.7 | )% | |||||||||
Non-taxable contingent consideration | — | — | % | 2.8 | 1.3 | % | (1.8 | ) | (0.9 | )% | |||||||||||
Recognition of Subsidiary Basis Difference | 11.1 | 7.1 | % | (12.9 | ) | (6.0 | )% | — | — | % | |||||||||||
Accelerated stock purchase | 7.2 | 4.6 | % | — | — | % | — | — | % | ||||||||||||
Stock based compensation | (4.8 | ) | (3.1 | )% | — | — | % | — | — | % | |||||||||||
Other non-deductible expenses | 2.8 | 1.8 | % | 1.5 | 0.7 | % | 1.3 | 0.6 | % | ||||||||||||
Statutory tax rate changes | 0.8 | 0.5 | % | 0.2 | 0.1 | % | (0.6 | ) | (0.2 | )% | |||||||||||
Other, net | 2.9 | 1.9 | % | 3.3 | 1.5 | % | (1.1 | ) | (0.5 | )% | |||||||||||
$ | 48.9 | 31.3 | % | $ | 60.3 | 28.0 | % | $ | 52.4 | 26.2 | % | ||||||||||
Significant components of our net deferred tax assets (liabilities) as of June 30, 2017, and June 30, 2016 were as follows:
(dollars in millions) | 2017 | 2016 | ||||||
Deferred tax assets: | ||||||||
U.S. loss carryforwards | $ | 2.1 | $ | 2.5 | ||||
Foreign loss carryforwards | 2.3 | 13.9 | ||||||
Accrued expenses | 47.7 | 49.8 | ||||||
Tax credit carryforwards | 1.1 | 1.7 | ||||||
Provision for losses on receivables | 1.0 | 1.6 | ||||||
Deferred compensation | 15.0 | 13.2 | ||||||
Deferred revenue | 30.9 | 22.6 | ||||||
Revenue recognition | 4.5 | — | ||||||
Intercompany loans | — | 0.2 | ||||||
Other | 2.7 | 2.0 | ||||||
Gross deferred tax assets | 107.3 | 107.5 | ||||||
Deferred tax asset valuation allowance | (2.7 | ) | (16.1 | ) | ||||
Total deferred tax assets | 104.6 | 91.4 | ||||||
Deferred tax liabilities: | ||||||||
Property and equipment | (40.9 | ) | (43.0 | ) | ||||
Revenue recognition | — | (5.7 | ) | |||||
Intangible assets | (31.4 | ) | (29.0 | ) | ||||
Other | (9.8 | ) | (5.9 | ) | ||||
Total deferred tax liabilities | (82.1 | ) | (83.6 | ) | ||||
Net deferred tax assets | 22.5 | 7.8 | ||||||
The net deferred tax assets and liabilities included in the consolidated balance sheets as of June 30, 2017 and June 30, 2016 were as follows:
(dollars in millions) | 2017 | 2016 | ||||||
Non-current deferred tax assets | $ | 35.1 | $ | 27.1 | ||||
Non-current deferred tax liabilities | (12.6 | ) | (19.3 | ) | ||||
$ | 22.5 | $ | 7.8 | |||||
84
PAREXEL INTERNATIONAL CORPORATION
NOTES TO CONSOLIDATED FINANCIAL STATEMENTS (CONTINUED)
The tax rate in the Fiscal Year 2017 tax rate was increased primarily attributable to the non-deductibility of the unrealized loss in connection with accelerated share repurchase program, as well as certain R&D tax benefits being recorded outside of the provision for income taxes during Fiscal Year 2017 due to a change in law offset by a benefit from the adoption of ASU 2016-09.
At June 30, 2017, federal, state and foreign loss carryforwards of $3.9 million, $24.0 million and $10.4 million, respectively, were available to offset future liabilities for income taxes. The federal net operating losses expire in the fiscal years 2023 through 2037. Use of these loss carryforwards is limited based on the future income of certain subsidiaries. The state net operating losses expire in the fiscal years 2023 through 2037. Of the non-U.S. loss carryforwards, $1.5 million will expire between fiscal years 2020 and 2037; the remainder does not expire. The decrease in the foreign loss carryforwards is due to the de-recognition of foreign capital loss carryforwards that were generated in Fiscal Year 2016 as a result of a foreign subsidiary reorganization.
A valuation allowance has been established for certain future income tax benefits related to loss carryforwards and temporary tax adjustments based on an assessment that it is more likely than not that these benefits will not be realized. The decrease in the valuation allowance in Fiscal Year 2017 was primarily due to the $11.1 million of valuation allowance release against the de-recognition of foreign capital loss carryforwards that were generated as a result of a foreign subsidiary reorganization.
Provision has not been made for U.S. or additional foreign taxes on undistributed earnings of foreign subsidiaries as those earnings are indefinitely reinvested. Undistributed earnings of foreign subsidiaries that are indefinitely reinvested are approximately $729.0 million and $565.6 million at June 30, 2017 and June 30, 2016, respectively. Due to the complexities associated with this hypothetical calculation, it is not practicable to estimate the unrecognized deferred tax liability on the earnings that are indefinitely reinvested in foreign operations.
As of June 30, 2017, we had $31.0 million of gross unrecognized tax benefits of which $20.1 million would impact the effective tax rate if recognized. As of June 30, 2016, we had $29.5 million of gross unrecognized tax benefits of which $18.9 million would impact the effective tax rate if recognized. This reserve primarily relates to exposures for income tax matters such as changes in the jurisdiction in which income is taxable.
Unrecognized tax benefits represent favorable positions we have taken, or expect to take, on tax returns. These positions have reduced, or are expected to reduce, our income tax liability on our tax returns and financial statements. As a result of the uncertainty associated with these positions, we have established a liability that effectively reverses the previous recognition of the tax benefits, making them “unrecognized.” Our unrecognized income tax benefits, excluding accrued interest and penalties, are as follows:
(dollars in millions) | 2017 | 2016 | 2015 | |||||||||
Balance at beginning of year | $ | 29.5 | $ | 35.2 | $ | 41.5 | ||||||
Additions related to tax positions in prior years | 1.6 | 0.1 | — | |||||||||
Additions related to tax positions in the current year | — | 1.0 | 3.6 | |||||||||
Reductions related to tax positions in prior years | — | (5.0 | ) | (0.5 | ) | |||||||
Reductions related to settlements with tax authorities | — | — | (6.5 | ) | ||||||||
Reductions related to the expiration of statutes | (0.4 | ) | (1.0 | ) | (0.1 | ) | ||||||
Currency translation adjustments | 0.3 | (0.8 | ) | (2.8 | ) | |||||||
Balance at end of year | $ | 31.0 | $ | 29.5 | $ | 35.2 | ||||||
As of June 30, 2017, we anticipate that the liability for unrecognized tax benefits for uncertain tax positions could change by up to $0.9 million in the next twelve months primarily as a result of the expiration of statutes of limitation and settlement with tax authorities.
We recognize interest and penalties related to income tax matters in income tax expense. As of June 30, 2017 and June 30, 2016, interest and penalties of $4.1 million and $3.4 million, respectively, were included in our liability for unrecognized tax benefits. For Fiscal Years 2017, 2016, and 2015, an expense of $0.6 million, a benefit of $0.9 million, and a benefit of $0.8 million, respectively, were recorded for interest and penalties related to tax matters.
We are subject to U.S. federal income tax, as well as income tax in multiple states, local and foreign jurisdictions. Our U.S. federal, state and local income tax returns for the tax years 2005 to 2017 remain open for examination by the relevant tax authority. In foreign tax jurisdictions, the Company has open tax years dating back to 2002. The extended open tax years for these tax jurisdictions resulted from tax attributes carryover including net operating losses or tax credits from those tax years.
NOTE 15. DEBT, COMMITMENTS, CONTINGENCIES AND GUARANTEES
We lease facilities under operating leases that include renewal and escalation clauses. Rent expense is recorded on a straight-line basis over the lease term. Total rent expense was $53.9 million, $58.5 million, and $56.4 million for Fiscal Years 2017, 2016, and
85
2015, respectively. Future minimum debt obligations, lease payments under non-cancelable leases, and purchase commitments due as of June 30, 2017 are as follows (excluding future potential payments in connection with acquisitions - see Note 3):
(dollars in millions) | FY 2018 | FY 2019 | FY 2020 | FY 2021 | FY 2022 | Thereafter | Total | |||||||||||||||||||||
Debt obligations (principal) | $ | 28.4 | $ | 21.7 | $ | 31.8 | $ | 589.6 | $ | — | $ | — | $ | 671.5 | ||||||||||||||
Operating leases | 44.1 | 36.5 | 28.9 | 21.8 | 19.3 | 81.8 | 232.4 | |||||||||||||||||||||
Purchase commitments* | 129.6 | 39.4 | 19.7 | 12.4 | 1.1 | 0.2 | 202.4 | |||||||||||||||||||||
Total | $ | 202.1 | $ | 97.6 | $ | 80.4 | $ | 623.8 | $ | 20.4 | $ | 82.0 | $ | 1,106.3 | ||||||||||||||
*includes commitments to purchase software, hardware and services | ||||||||||||||||||||||||||||
We have letter-of-credit agreements with banks, totaling approximately $9.5 million, guaranteeing performance under various operating leases and vendor agreements. Additionally, the borrowings under the 2016 Credit Agreement and the Notes are guaranteed by certain of our U.S. subsidiaries.
We periodically become involved in various claims and lawsuits that are incidental to our business. We are also regularly subject to, and are currently undergoing, audits by tax authorities in the United States and foreign jurisdictions for prior tax years relating to indirect taxes. Although we believe our accruals for non-income tax related tax exposures to be appropriately estimated, and we intend to defend our positions through litigation if necessary, the final outcome of tax audits and related litigation is inherently uncertain and could be materially different than that reflected in our accruals. Adverse outcomes of tax audits could also result in assessments of substantial additional taxes and/or fines or penalties relating to ongoing or future audits. For indirect tax-related matters we estimate our reasonably possible loss in excess of amounts accrued as probable and estimable to be up to approximately $9.2 million at June 30, 2017.
In connection with the pending acquisition of the Company by certain investments funds affiliated with Pamplona Capital Management, pursuant to the Agreement and Plan of Merger, several lawsuits were filed by shareholders of PAREXEL against the Company. The Company believes that the claims asserted against them are without merit and intend to vigorously defend against these lawsuits.
If the merger is not completed within the expected time frame or at all, we may be subject to a number of material risks. The price of our common stock may decline to the extent that current market prices reflect a market assumption that the merger will be completed. We could be required to reimburse certain expenses of Parent or pay Parent a termination fee of $138 million if the merger agreement is terminated under specific circumstances described in the merger agreement.
The above table does not include asset retirement obligations due to the uncertainty of the timing of the future cash outflows related to the restoration costs associated with returning certain facilities to their original condition upon termination of our long-term leases. As of June 30, 2017, the obligation expected to be incurred is $3.8 million.
The above table does not include contingent consideration due to the uncertainty regarding the amounts and timing of the future cash outflows related to the potential payments. As of June 30, 2017, we recorded contingent consideration liabilities of $18.0 million. See Note 13 to our consolidated financial statements included in this annual report for more information.
We believe, after consultation with counsel or other experts, that no matters currently pending would, in the event of an adverse outcome, either individually or in the aggregate, have a material impact on our consolidated financial position, results of operations, or liquidity.
86
PAREXEL INTERNATIONAL CORPORATION
NOTES TO CONSOLIDATED FINANCIAL STATEMENTS (CONTINUED)
NOTE 16. GEOGRAPHIC INFORMATION
Financial information by geographic area for the last three fiscal years was as follows:
(dollars in millions) | 2017 | 2016 | 2015 | |||||||||
Service revenue: | ||||||||||||
The Americas | $ | 998.3 | $ | 978.5 | $ | 1,055.6 | ||||||
Europe, Middle East & Africa | 775.6 | 819.1 | 691.1 | |||||||||
Asia/Pacific | 343.7 | 296.7 | 269.3 | |||||||||
Total | $ | 2,117.6 | $ | 2,094.3 | $ | 2,016.0 | ||||||
Income from operations: | ||||||||||||
The Americas | $ | 86.4 | $ | 109.3 | $ | 112.8 | ||||||
Europe, Middle East & Africa | 53.9 | 84.5 | 56.3 | |||||||||
Asia/Pacific | 50.9 | 30.2 | 30.8 | |||||||||
Total | $ | 191.2 | $ | 224.0 | $ | 199.9 | ||||||
Tangible long-lived assets: | ||||||||||||
The Americas | $ | 185.9 | $ | 189.5 | $ | 161.2 | ||||||
Europe, Middle East & Africa | 49.5 | 52.5 | 61.4 | |||||||||
Asia/Pacific | 16.7 | 17.3 | 18.6 | |||||||||
Total | $ | 252.1 | $ | 259.3 | $ | 241.2 | ||||||
The following countries represented greater than 10% of consolidated service revenue for the last three fiscal years:
(dollars in millions) | 2017 | 2016 | 2015 | |||||||||
Service revenue: | ||||||||||||
United States | $ | 928.1 | $ | 908.9 | $ | 984.7 | ||||||
United Kingdom | $ | 197.4 | $ | 251.0 | $ | 239.6 | ||||||
NOTE 17. SEGMENT INFORMATION
We have three reportable segments: CRS, PC and PI.
• | CRS constitutes our core business and includes all phases of clinical research from Early Phase (encompassing the early stages of clinical testing that range from first-in-man through proof-of-concept studies) to Phase II-III and Phase IV, which we call PAREXEL Access. Our services include clinical trials management and biostatistics, data management and clinical pharmacology, as well as related medical advisory, patient recruitment, clinical supply and drug logistics, pharmacovigilance, and investigator site services. We aggregate Early Phase and PAREXEL Access with Phase II-III due to economic similarities in these operating segments. |
• | PC provides technical expertise and advice in such areas as drug development, regulatory affairs, product pricing and reimbursement, commercialization and strategic compliance. It also provides a full spectrum of market development, product development, and targeted communications services in support of product launch. Our PC consultants identify alternatives and propose solutions to address client issues associated with product development, registration, and commercialization. |
• | PI provides information technology solutions designed to help improve clients’ product development and regulatory submission processes. PI offers a portfolio of products and services that includes medical imaging services, ClinPhone® RTSM, IMPACT® CTMS, DataLabs® EDC, web-based portals, systems integration, electronic patient reported outcomes (“ePRO”), and LIQUENT InSight® RIM solutions. |
We evaluate our segment performance and allocate resources based on service revenue and gross profit (service revenue less direct costs), while other operating costs are allocated and evaluated on a geographic basis. Accordingly, we do not include the impact of selling, general, and administrative expenses, depreciation and amortization expense, other income (expense), and income tax expense in segment profitability. We attribute revenue to individual countries based upon the revenue earned in the respective countries; however, inter-segment transactions are not included in service revenue. Furthermore, we have a global infrastructure supporting its business segments, and therefore, assets are not identified by reportable segment.
87
PAREXEL INTERNATIONAL CORPORATION
NOTES TO CONSOLIDATED FINANCIAL STATEMENTS (CONTINUED)
(dollars in millions) | CRS | PC | PI | TOTAL | ||||||||||||
Service revenue: | ||||||||||||||||
2017 | $ | 1,626.6 | $ | 210.3 | $ | 280.7 | $ | 2,117.6 | ||||||||
2016 | 1,626.0 | 190.4 | 277.9 | 2,094.3 | ||||||||||||
2015 | 1,599.1 | 152.2 | 264.7 | 2,016.0 | ||||||||||||
Gross profit on service revenue: | ||||||||||||||||
2017 | $ | 514.7 | $ | 89.8 | $ | 135.6 | $ | 740.1 | ||||||||
2016 | 515.0 | 88.2 | 130.8 | 734.0 | ||||||||||||
2015 | 472.6 | 71.7 | 127.5 | 671.8 | ||||||||||||
NOTE 18. QUARTERLY OPERATING RESULTS (UNAUDITED)
The following is a summary of unaudited quarterly results of operations for Fiscal Years 2017 and 2016:
Fiscal Year 2017 | ||||||||||||||||||||
(dollars in millions, except per share data) | First Quarter | Second Quarter | Third Quarter | Fourth Quarter | Total Year | |||||||||||||||
Service revenue | $ | 496.7 | $ | 534.4 | $ | 529.3 | $ | 557.2 | $ | 2,117.6 | ||||||||||
Gross profit | 169.0 | 183.5 | 179.7 | 207.9 | 740.1 | |||||||||||||||
Income from operations | 53.3 | 60.0 | 29.9 | 48.0 | 191.2 | |||||||||||||||
Net income | 37.8 | 21.8 | 17.8 | 29.9 | 107.3 | |||||||||||||||
Diluted earnings per share | $ | 0.70 | $ | 0.41 | $ | 0.35 | $ | 0.58 | $ | 2.06 | ||||||||||
Fiscal Year 2016 | ||||||||||||||||||||
(dollars in millions, except per share data) | First Quarter | Second Quarter | Third Quarter | Fourth Quarter | Total Year | |||||||||||||||
Service revenue | $ | 512.1 | $ | 518.5 | $ | 527.1 | $ | 536.6 | $ | 2,094.3 | ||||||||||
Gross profit | 168.9 | 186.0 | 189.3 | 189.8 | 734.0 | |||||||||||||||
Income from operations | 35.5 | 54.6 | 69.7 | 64.2 | 224.0 | |||||||||||||||
Net income | 24.9 | 39.4 | 47.9 | 42.7 | 154.9 | |||||||||||||||
Diluted earnings per share | $ | 0.45 | $ | 0.73 | $ | 0.89 | $ | 0.80 | $ | 2.86 | ||||||||||
88
NOTE 19. SUBSEQUENT EVENTS
On June 19, 2017, PAREXEL entered into an Agreement and Plan of Merger pursuant to which West Street Merger Sub, Inc., a Massachusetts corporation and a wholly-owned subsidiary of West Street Parent, LLC, a Delaware limited liability company (which we refer to as Parent) and affiliate of Pamplona Capital Management, LLP, will be merged with and into us, with PAREXEL surviving as a subsidiary of West Street Parent, LLC, which we refer to as the merger will acquire all of the outstanding shares of PAREXEL for $88.10 per share in cash in a transaction valued at approximately $5.5 billion, including PAREXEL’s net debt. Consummation of the merger is subject to various customary conditions, including adoption of the merger agreement by the Company’s stockholders and receipt of required regulatory approvals. The closing of the merger is expected to be completed late in the third quarter or early in the fourth quarter of calendar year 2017.
Immediately prior to, and contingent upon, the closing of the merger, each outstanding Company stock option, restricted stock unit, restricted share and performance restricted stock unit (collectively, the “Company Equity Awards”) will vest in full (in the case of performance restricted stock units, at target level regardless of the actual achievement of the applicable performance metric). Such fully vested Company Equity Awards will be canceled and converted into the right to receive an amount in cash equal to $88.10 per share for each share of our common stock underlying such Company Equity Awards (net of any applicable exercise price and subject to any applicable withholding taxes).
On August 15, 2017, the Company announced a special meeting of the shareholders of PAREXEL to be held on September 15, 2017. At the shareholder meeting, shareholders will be asked to consider and vote on a proposal to approve the Agreement and Plan of Merger, dated as of June 19, 2017, by and among PAREXEL, West Street Parent, LLC (“Parent”) and West Street Merger Sub, Inc. (“Merger Sub, providing for the acquisition of the Company by an affiliate of the private equity investment firm Pamplona. Subject to the terms and conditions of the Merger Agreement, the acquisition will occur by means of a merger of Merger Sub, a wholly-owned subsidiary of Parent, with and into the Company, with the Company surviving the merger as a wholly-owned subsidiary of Parent in accordance with the Massachusetts Business Corporation Act (the “MBCA”).
We have incurred $10.0 million as of June 30, 2017, and will continue to incur, significant costs and expenses, including fees for professional services and other transaction costs, in connection with the merger.
89
Management’s Report on Internal Control over Financial Reporting
The management of PAREXEL International Corporation is responsible for establishing and maintaining adequate internal control over financial reporting for the Company. Internal control over financial reporting is defined in Rule 13a-15(f) or 15d-15(f) promulgated under the Securities Exchange Act of 1934, as amended, as a process designed by, or under the supervision of, the Company’s principal executive and principal financial officers and effected by the Company’s board of directors, management and other personnel, to provide reasonable assurance regarding the reliability of financial reporting and the preparation of financial statements for external purposes in accordance with generally accepted accounting principles and includes those policies and procedures that:
• | Pertain to the maintenance of records that in reasonable detail accurately and fairly reflect the transactions and dispositions of the assets of the Company; |
• | Provide reasonable assurance that transactions are recorded as necessary to permit preparation of financial statements in accordance with generally accepted accounting principles, and that receipts and expenditures of the Company are being made only in accordance with authorizations of management and directors of the Company; and |
• | Provide reasonable assurance regarding prevention or timely detection of unauthorized acquisition, use or disposition of the Company’s assets that could have a material effect on the financial statements. |
Because of its inherent limitations, internal control over financial reporting may not prevent or detect misstatements. Projections of any evaluation of effectiveness to future periods are subject to the risk that controls may become inadequate because of changes in conditions, or that the degree of compliance with the policies or procedures may deteriorate.
The Company’s management assessed the effectiveness of the Company’s internal control over financial reporting as of June 30, 2017. In making this assessment, the Company’s management used the criteria set forth by the Committee of Sponsoring Organizations of the Treadway Commission (2013 framework) (the COSO criteria) in Internal Control-Integrated Framework.
Based on our assessment, the Company's management concluded that the material weakness in revenue recognition for our Clinical Research Services (CRS) reporting segment as reported in our Annual Report on Form 10-K for the year ended June 30, 2016 remains un-remediated as of June 30, 2017.
Our control activities in revenue recognition for our Clinical Research Services (CRS) reporting segment were not designed and operating effectively. Even though we strengthened our controls around the timely identification and accounting treatment of contracts and contract amendments, further remediation is needed. Additionally, our control activities that were in place at the revenue unit level were not designed to address completeness and accuracy risks of certain underlying systems and reports. Finally, the level of training of company personnel and the level of precision of the management review controls was improved, but still not sufficient to identify all potential errors.
As a result of the material weakness identified, we performed additional analysis and other post-closing procedures to ensure that our consolidated financial statements present fairly, in all material respects, the Company’s financial position, results of operations and cash flows for the periods disclosed in conformity with U.S. GAAP. We will continue to strengthen control processes and procedures already in place to address this weakness and also to ensure that we become compliant with the requirements of Section 404 of the Sarbanes-Oxley Act of 2002. The revenue recognition remediation efforts are expected to include enhancement of unit revenue review controls to address the risks of data accuracy and completeness coming from underlying systems and tracking files. Additionally, we will further strengthen the management review controls including completeness and accuracy verification of the reports used to support control execution. Finally, we will continue to provide training for finance and non-finance personnel to ensure the consistent application of revenue recognition criteria. Management will report regularly to the Audit Committee regarding the status of the implementation activities.
The control deficiency described above resulted in certain immaterial misstatements in the preliminary consolidated financial statements that were corrected prior to the issuance of the annual consolidated financial statements. The control deficiency creates a possibility that a material misstatement to our consolidated financial statements will not be prevented or detected on a timely basis. Therefore we concluded that our internal control and procedures over financial reporting was not effective as of June 30, 2017 due to the material weakness in our internal control related to revenue recognition in our CRS reporting segment.
The audited consolidated financial statements of the Company include the results of the acquired ExecuPharm, Inc. and The Medical Affairs Company, LLC. As permitted by the U.S. Securities and Exchange Commission, we've excluded these acquisitions from our assessment of the effectiveness of internal control over financial reporting as of June 30, 2017, since it was not practical for management to conduct an assessment of internal control over financial reporting for these two entities between the acquisition date and the date of management's assessment. Excluded from our assessment of the effectiveness of the internal control over financial reporting as of June 30, 2017, these acquisitions, were approximately 5% and less than 1% of total assets, respectively, excluding the effect of purchase accounting adjustments, as of June 30, 2017 and 4% and less than 1%, respectively, of service revenues for the year then ended.
90
The Company’s independent registered public accounting firm, Ernst & Young LLP, has issued an audit report on the Company’s internal control over financial reporting. This report appears on page 93.
91
Report of Independent Registered Public Accounting Firm
The Board of Directors and Stockholders of PAREXEL International Corporation
We have audited the accompanying consolidated balance sheets of PAREXEL International Corporation as of June 30, 2017 and 2016, and the related consolidated statements of income and comprehensive income, stockholders' equity and cash flows for each of the three years in the period ended June 30, 2017. Our audits also included the financial statement schedule listed in the Index at Item 15(a). These financial statements and schedule are the responsibility of the Company's management. Our responsibility is to express an opinion on these financial statements and schedule based on our audits.
We conducted our audits in accordance with the standards of the Public Company Accounting Oversight Board (United States). Those standards require that we plan and perform the audit to obtain reasonable assurance about whether the financial statements are free of material misstatement. An audit includes examining, on a test basis, evidence supporting the amounts and disclosures in the financial statements. An audit also includes assessing the accounting principles used and significant estimates made by management, as well as evaluating the overall financial statement presentation. We believe that our audits provide a reasonable basis for our opinion.
In our opinion, the financial statements referred to above present fairly, in all material respects, the consolidated financial position of PAREXEL International Corporation at June 30, 2017 and 2016, and the consolidated results of its operations and its cash flows for each of the three years in the period ended June 30, 2017, in conformity with U.S. generally accepted accounting principles. Also, in our opinion, the related financial statement schedule, when considered in relation to the basic financial statements taken as a whole, present fairly in all material respects the information set forth therein.
We also have audited, in accordance with the standards of the Public Company Accounting Oversight Board (United States), PAREXEL International Corporation’s internal control over financial reporting as of June 30, 2017, based on criteria established in Internal Control-Integrated Framework issued by the Committee of Sponsoring Organizations of the Treadway Commission (2013 framework) and our report dated August 29, 2017 expressed an adverse opinion thereon.
/s/ Ernst & Young LLP
Boston, Massachusetts
August 29, 2017
92
Report of Independent Registered Public Accounting Firm
The Board of Directors and Stockholders of PAREXEL International Corporation
We have audited PAREXEL International Corporation’s internal control over financial reporting as of June 30, 2017, based on criteria established in Internal Control-Integrated Framework issued by the Committee of Sponsoring Organizations of the Treadway Commission (2013 framework) (the COSO criteria). PAREXEL International Corporation’s management is responsible for maintaining effective internal control over financial reporting, and for its assessment of the effectiveness of internal control over financial reporting included in the accompanying Management's Report on Internal Control over Financial Reporting. Our responsibility is to express an opinion on the company’s internal control over financial reporting based on our audit.
We conducted our audit in accordance with the standards of the Public Company Accounting Oversight Board (United States). Those standards require that we plan and perform the audit to obtain reasonable assurance about whether effective internal control over financial reporting was maintained in all material respects. Our audit included obtaining an understanding of internal control over financial reporting, assessing the risk that a material weakness exists, testing and evaluating the design and operating effectiveness of internal control based on the assessed risk, and performing such other procedures as we considered necessary in the circumstances. We believe that our audit provides a reasonable basis for our opinion.
A company’s internal control over financial reporting is a process designed to provide reasonable assurance regarding the reliability of financial reporting and the preparation of financial statements for external purposes in accordance with generally accepted accounting principles. A company’s internal control over financial reporting includes those policies and procedures that (1) pertain to the maintenance of records that, in reasonable detail, accurately and fairly reflect the transactions and dispositions of the assets of the company; (2) provide reasonable assurance that transactions are recorded as necessary to permit preparation of financial statements in accordance with generally accepted accounting principles, and that receipts and expenditures of the company are being made only in accordance with authorizations of management and directors of the company; and (3) provide reasonable assurance regarding prevention or timely detection of unauthorized acquisition, use, or disposition of the company’s assets that could have a material effect on the financial statements.
Because of its inherent limitations, internal control over financial reporting may not prevent or detect misstatements. Also, projections of any evaluation of effectiveness to future periods are subject to the risk that controls may become inadequate because of changes in conditions, or that the degree of compliance with the policies or procedures may deteriorate.
A material weakness is a deficiency, or combination of deficiencies, in internal control over financial reporting, such that there is a reasonable possibility that a material misstatement of the company’s annual or interim financial statements will not be prevented or detected on a timely basis. The following material weakness has been identified and included in management’s assessment. Management has identified and included in its management’s assessment a material weakness in controls related to revenue recognition at its Clinical Research Services reporting segment. We also have audited, in accordance with the standards of the Public Company Accounting Oversight Board (United States), the 2017 consolidated financial statements of PAREXEL International Corporation. This material weakness was considered in determining the nature, timing and extent of audit tests applied in our audit of the 2017 financial statements, and this report does not affect our report dated August 29, 2017, which expressed an unqualified opinion on those financial statements.
As indicated in the accompanying Management's Report on Internal Control over Financial Reporting, management’s assessment of and conclusion on the effectiveness of internal control over financial reporting did not include the internal controls of ExecuPharm, Inc. and The Medical Affairs Company, LLC., which are included in the 2017 consolidated financial statements of PAREXEL International Corporation and constituted approximately 5% and less than 1% of total assets, respectively, excluding the effect of purchase accounting adjustments, as of June 30, 2017 and 4% and less than 1%, respectively, of service revenues for the year then ended. Our audit of internal control over financial reporting of PAREXEL International Corporation also did not include an evaluation of the internal control over financial reporting of ExecuPharm Holding Company, Inc. and The Medical Affairs Company, LLC.
In our opinion, because of the effect of the material weakness described above on the achievement of the objectives of the control criteria, PAREXEL International Corporation has not maintained effective internal control over financial reporting as of June 30, 2017, based on the COSO criteria.
/s/ Ernst & Young LLP
Boston, Massachusetts
August 29, 2017
93
Item 9. Changes in and Disagreements with Accountants on Accounting and Financial Disclosure
Not applicable.
Item 9A. Controls and Procedures
(a) Evaluation of Disclosure Controls and Procedures
Management conducted an evaluation, under the supervision and with the participation of our Chief Executive Officer and Chief Financial Officer (our principal executive officer and principal financial officer, respectively), of the effectiveness of the design and operation of our disclosure controls and procedures (as defined in Rules 13a-15(e) and 15d-15(e) under the Securities Exchange Act of 1934, as amended) as of June 30, 2017. Based on the evaluation of our disclosure controls and procedures as of June 30, 2017, our Chief Executive Officer and Chief Financial Officer concluded that, as of such date, PAREXEL’s disclosure controls and procedures were not effective due to the material weaknesses in our internal control over financial reporting for revenue recognition in our CRS reporting segment as described above in Management’s Report on Internal Control over Financial Reporting under Item 308 of Regulation S-K.
(b) Changes in Internal Control Over Financial Reporting
The material weakness in our in our internal control over financial reporting related to approval of invoices for payment and validation of vendors as reported in Item 9A of our Annual Report on Form 10-K for the period ended June 30, 2016 is remediated as of June 30, 2017. Management verified the authenticity of a majority of this specific class of vendors and implemented new invoice review guidelines and analytical reviews.
Other than the material weakness referenced above, there were no changes in our internal control over financial reporting that occurred during the fourth quarter of our most recently completed fiscal year that materially affected, or are reasonably likely to materially affect, our internal control over financial reporting.
Item 9B. Other Information
On August 27, 2017, we entered into an Amendment to Severance/Change of Control Agreement with Simon Harford, Senior Vice President and Chief Financial Officer. Under the terms of the agreement, as amended, if Mr. Harford’s employment is terminated without “cause” (as defined in the agreement), he will be entitled to receive a lump sum cash payment equal to (a) 1.5 times the sum of 12 months of his base salary (at the highest rate in effect in the preceding 12 month period), plus (b) the pro rata share of the bonus that would have been payable to him during the year in which termination occurs, plus (c) notwithstanding anything to the contrary set forth in the offer letter between Mr. Harford and the Company dated February 22, 2017 (the “Offer Letter”), an amount equal to the second installment of the sign-on bonus to the extent unpaid as of the termination date(the “Sign-on Bonus”). If we terminate Mr. Harford’s employment without cause during the period beginning nine months prior to, and ending 18 months following, a “change of control” of the Company (as defined in the Agreement), or Mr. Harford terminates his employment “for good reason” (as defined in the Agreement) during the 18 month period following a change of control of the Company, Mr. Harford would be entitled to receive:
• | a severance payment equal to 1.5 times the sum of: |
a. | his annualized base salary (at the highest rate in effect in the preceding 12 month period), and |
b. | his target annual bonus in the year of termination; |
• | notwithstanding anything to the contrary set forth in the Offer Letter, an amount equal to the Sign-on Bonus; |
• | accelerated vesting of all equity awards, except performance-based equity awards, which will be governed by their individual award agreement terms; and |
• | insurance benefits provided or paid for one year. |
He will be required to sign a waiver and release form in connection with his receipt of the foregoing benefits.
On August 28, 2017, we entered into an Amended and Restated Change of Control/Severance Agreement with Douglas A. Batt, Senior Vice President, General Counsel & Secretary. Under the terms of the agreement, if Mr. Batt’s employment is terminated without “cause” (as defined in the agreement) other than due to his death or disability, or Mr. Batt terminates his employment for “good reason” (as defined in the agreement), he would be entitled to receive:
• | severance payments equal in aggregate to 2 times the sum of: |
a. | base salary (at the highest rate in effect in the preceding 12 month period), |
b. | the greater of (i) his target annual bonus in year of termination or (ii) the bonus paid to him for the immediately preceding fiscal year, and |
c. | the value of all other annual benefits he receives immediately prior to his termination (less any pre-paid amounts paid in the year of termination for any periods Mr. Batt does not provide services to us), |
94
all to be paid in bi-monthly installments over a 2 year period;
• | accelerated vesting of all equity awards, except with respect to performance awards which shall vest when (and only to the extent that) our Compensation Committee certifies that the relevant performance metrics have been achieved following the end of the applicable performance period; and |
• | insurance benefits to be provided or paid for 2 years. |
If we terminate Mr. Batt’s employment without cause other than due to his death or disability, or Mr. Batt terminates his employment for good reason, in either case, during the period beginning six months prior to, and ending 24 months following, a “change of control” of the Company (as defined in the agreement), Mr. Batt would be entitled to receive:
• | a severance payment equal to 2 times the sum of: |
a. | his annualized base salary (at the highest rate in effect in the preceding 12 month period), |
b. | the greater of (i) his target annual bonus in the year of termination or (ii) the bonus paid to him for the immediately preceding fiscal year, and |
c. | the value of all other benefits he receives immediately prior to his termination (less any pre-paid amounts paid in the year of termination for any periods Mr. Batt does not provide services to us); |
• | accelerated vesting of all equity awards, with performance-based equity awards vesting at “target” level of performance; |
• | outplacement services, up to $35,000; and |
• | insurance benefits provided or paid for two years. |
If Mr. Batt has begun to receive payments as a result of his termination by the Company without cause or his resignation for good reason and a change of control occurs within six months of his termination date, any payment to which he becomes entitled as a result of the change of control occurring within such period will be reduced by any amounts of severance he has already received.
If Mr. Batt’s employment terminates due to death or disability, Mr. Batt would be entitled to accelerated vesting of all of his equity awards, except performance awards which shall be earned as of the last day of the applicable performance period to the extent it would have been earned had he remained employed through the last day of the applicable performance period.
All payments, benefits and equity acceleration made to Mr. Batt under his agreement (with the exception of any payments of “accrued compensation” (as that term is defined in the agreement)) are subject to Mr. Batt’s timely execution and nonrevocation of a Separation and Release agreement in favor of the Company and with his continuing adherence to the terms of his key employee agreement with the Company.
95
PART III
Item 10. Directors, Executive Officers and Corporate Governance
Information with respect to this item may be found under the captions “Elections of Directors,” “Corporate Governance,” “Executive Officers” and “Section 16(a) Beneficial Ownership Reporting Compliance” in the Proxy Statement for the Company’s 2017 Annual Meeting of Stockholders. Such information is incorporated herein by reference.
CODE OF ETHICS
PAREXEL has adopted a code of business conduct and ethics applicable to all of its employees, including our principal executive officer and principal financial officer. The code of business conduct and ethics is available on our website (www.parexel.com) under the category “Investor Relations-Corporate Governance.”
Item 11. Executive Compensation
Information with respect to this item may be found under the captions “Directors’ Compensation,” “Compensation Committee Interlocks and Insider Participation,” “Executive Compensation,” “Employment and Change of Control Agreements” and “Compensation Committee Report” in the Proxy Statement for the Company’s 2017 Annual Meeting of Stockholders. Such information is incorporated herein by reference.
Item 12. Security Ownership of Certain Beneficial Owners and Management and Related Stockholder Matters
Information with respect to this item may be found under the caption “Security Ownership of Certain Beneficial Owners and Management” and “Equity Compensation Plan Information” in the Proxy Statement for the Company’s 2017 Annual Meeting of Stockholders. Such information is incorporated herein by reference.
Item 13. Certain Relationships and Related Transactions, and Director Independence
Information with respect to this item may be found under the captions “Certain Relationships and Related Transactions” in the Proxy Statement for the Company’s 2017 Annual Meeting of Stockholders. Such information is incorporated herein by reference.
Item 14. Principal Accounting Fees and Services
Information with respect to this item may be found under the caption “Fees Paid to Independent Registered Public Accounting Firm” in the Proxy Statement for the Company’s 2017 Annual Meeting of Stockholders. Such information is incorporated herein by reference.
96
PART IV
Item 15. Financial Statements, Financial Statement Schedules and Exhibits
(a) | 1. Financial Statements | |
The following financial statements and supplementary data are included in Item 8 of this annual report: | ||
Reports of Independent Registered Public Accounting Firm for the years ended June 30, 2017, 2016 and 2015 | ||
Consolidated Statements of Income and Comprehensive Income for each of the three years ended June 30, 2017, 2016 and 2015 | ||
Consolidated Balance Sheets at June 30, 2017 and 2016 | ||
Consolidated Statements of Cash Flows for each of the three years ended June 30, 2017, 2016 and 2015 | ||
Consolidated Statements of Stockholders’ Equity for each of the three years ended June 30, 2017, 2016 and 2015 | ||
Notes to Consolidated Financial Statements | ||
2. Financial Statement Schedules | ||
Schedule II - Valuation and Qualifying Accounts | ||
All other schedules have been omitted since the required information is not present, or not present in amounts sufficient to require submission of the schedule or because the information required is included in the consolidated financial statements or the Notes thereto. | ||
3. Exhibits | ||
Exhibits filed with this Form 10-K are included on the Exhibit Index, which is incorporated herein by reference, and are filed or furnished as part of this report or are incorporated into this report by reference. | ||
97
SIGNATURES
Pursuant to the requirements of Section 13 or 15(d) of the Securities Exchange Act of 1934, the registrant has duly caused this report to be signed on its behalf by the undersigned, thereunto duly authorized.
PAREXEL INTERNATIONAL CORPORATION
By: | /s/ Josef H. von Rickenbach | Dated: | August 29, 2017 | |||
Josef H. von Rickenbach Chairman of the Board and Chief Executive Officer | ||||||
Pursuant to the requirements of the Securities Exchange Act of 1934, this report has been signed below by the following persons on behalf of the registrant and in the capacities and on the dates indicated.
Signatures | Title(s) | Date | ||
/s/ Josef H. von Rickenbach | August 29, 2017 | |||
Josef H. von Rickenbach | Chairman of the Board and Chief Executive Officer (Principal Executive Officer) | |||
/s/ Simon Harford | August 29, 2017 | |||
Simon Harford | Senior Vice President and Chief Financial Officer (Principal Financial and Accounting Officer) | |||
/s/ A. Dana Callow, Jr. | August 29, 2017 | |||
A. Dana Callow, Jr. | Director | |||
/s/ Patrick J. Fortune | August 29, 2017 | |||
Patrick J. Fortune | Director | |||
/s/ Maykin Ho | August 29, 2017 | |||
Maykin Ho | Director | |||
/s/ Eduard E. Holdener | August 29, 2017 | |||
Eduard E. Holdener | Director | |||
/s/ Christopher J. Lindop | August 29, 2017 | |||
Christopher J. Lindop | Director | |||
/s/ Richard L. Love | August 29, 2017 | |||
Richard L. Love | Director | |||
/s/ Ellen M. Zane | August 29, 2017 | |||
Ellen M. Zane | Director | |||
98
SCHEDULE II
PAREXEL INTERNATIONAL CORPORATION
VALUATION AND QUALIFYING ACCOUNTS
(in millions) | Balance at beginning of year | Charged (credited) to income from operations | Other adjustments* | Balance at end of year | ||||||||||||
Provision for losses on receivables | ||||||||||||||||
Year ended June 30, 2015 | $ | 4.1 | $ | 1.1 | $ | — | $ | 5.2 | ||||||||
Year ended June 30, 2016 | $ | 5.2 | $ | (1.3 | ) | $ | 2.2 | $ | 6.1 | |||||||
Year ended June 30, 2017 | $ | 6.1 | $ | — | $ | 0.6 | $ | 6.7 | ||||||||
* Other adjustments denote the effects of foreign currency exchange, write-offs, and recoveries. | ||||||||||||||||
(in millions) | Balance at beginning of year | Charged (credited) to income tax expense | Other adjustments* | Balance at end of year | ||||||||||||
Valuation allowance for deferred tax assets | ||||||||||||||||
Year ended June 30, 2015 | $ | 5.3 | $ | 0.7 | $ | (1.6 | ) | $ | 4.4 | |||||||
Year ended June 30, 2016 | $ | 4.4 | $ | 13.2 | $ | (1.5 | ) | $ | 16.1 | |||||||
Year ended June 30, 2017 | $ | 16.1 | $ | (12.1 | ) | $ | (1.3 | ) | $ | 2.7 | ||||||
* Other adjustments denote the effects of foreign currency exchange, write-offs, recoveries, acquisitions and certain reclassifications related to ASC 740. | ||||||||||||||||
99
EXHIBIT INDEX
EXHIBIT NO. | DESCRIPTION | |
2.1 | Agreement and Plan of Merger, dated June 19, 2017, among PAREXEL International Corporation, West Street Parent, LLC, and West Street Merger Sub, Inc. (filed as Exhibit 2.1 to the Company's Current Report on Form 8-K dated June 19, 2017 and incorporated herein by reference). | |
3.1 | Amended and Restated Articles of Organization of the Company, as amended (filed as Exhibit 3.1 to the Company’s Annual Report on Form 10-K for the year ended June 30, 2013 and incorporated herein by this reference). | |
3.2 | Amended and Restated By-laws of the Company, as amended (filed as Exhibit 3.2 to the Company’s Quarterly Report on Form 10-Q for the quarterly period ended September 30, 2009 and incorporated herein by this reference). | |
3.3 | Amendment to Second Amended and Restated By-laws of PAREXEL International Corporation (filed as Exhibit 3.1 to the Company's Current Report on Form 8-k dated June 19, 2017 and incorporated herein by reference) | |
4.1 | Specimen certificate representing the Common Stock of the Company (filed as Exhibit 4.1 to the Company’s Registration Statement on Form S-1 (File No. 33-97406) and incorporated herein by this reference). | |
10.1* | 2001 Stock Incentive Plan of the Company (filed as Exhibit 10.7.1 to the Company’s Annual Report on Form 10-K for the year ended June 30, 2006 and incorporated herein by this reference). | |
10.2* | Amendment No. 1 to 2001 Stock Incentive Plan of the Company (filed as Exhibit 10.7.2 to the Company’s Annual Report on Form 10-K for the year ended June 30, 2006 and incorporated herein by this reference). | |
10.3* | Form of Stock Option Agreement under the Company’s 2001 Stock Incentive Plan (filed as Exhibit 10.4 to the Company’s Annual Report on Form 10-K for the year ended June 30, 2004 and incorporated herein by this reference). | |
10.4* | 2005 Stock Incentive Plan of the Company (filed as Exhibit 10.8 to the Company’s Annual Report on Form 10-K for the year ended June 30, 2006 and incorporated herein by this reference). | |
10.5* | Form of Restricted Stock Agreement for non-employee directors under the Company’s 2005 Stock Incentive Plan (filed as Exhibit 10.2 to the Company’s Quarterly Report on Form 10-Q for the quarter ended December 31, 2009 and incorporated herein by this reference). | |
10.6* | Form of Restricted Stock Agreement for executive officers under the Company’s 2005 Stock Incentive Plan (filed as Exhibit 10.3 to the Company’s Quarterly Report on Form 10-Q for the quarter ended December 31, 2009 and incorporated herein by this reference). | |
10.7* | Form of Stock Option Agreement under the Company’s 2005 Stock Incentive Plan (filed as Exhibit 10.11 to the Company’s Annual Report on Form 10-K for the year ended June 30, 2012 and incorporated herein by this reference). | |
10.8* | 2007 Stock Incentive Plan (filed as Exhibit 10.1 to the Company’s Quarterly Report on Form 10-Q for the quarter ended December 31, 2007 and incorporated herein by reference). | |
10.9* | Form of Restricted Stock Unit Agreement for executive officers under the Company’s 2007 Stock Incentive Plan (filed as Exhibit 10.29 to the Company’s Annual Report on Form 10-K for the year ended June 30, 2010 and incorporated herein by reference). | |
10.10* | Form of Restricted Stock Agreement for non-employee directors under the Company’s 2007 Stock Incentive Plan (filed as Exhibit 10.14 to the Company's Annual Report on Form 10-K for the fiscal year ended June 30, 2012 and incorporated herein by reference) | |
10.11* | Form of Restricted Stock Agreement for executive officers under the Company’s 2007 Stock Incentive Plan (filed as Exhibit 10.15 to the Company's Annual Report on Form 10-K for the fiscal year ended June 30, 2012 and incorporated herein by reference) | |
10.12* | Form of Stock Option Agreement under the Company’s 2007 Stock Incentive Plan (filed as Exhibit 10.16 to the Company's Annual Report on Form 10-K for the fiscal year ended June 30, 2012 and incorporated herein by reference) | |
10.13* | 2010 Stock Incentive Plan as amended (filed as Exhibit 10.17 to the Company’s Annual Report on Form 10-K for the year ended June 30, 2013 and incorporated herein by this reference). . | |
10.14* | Form of Restricted Stock Agreement for non-employee directors under the Company’s 2010 Stock Incentive Plan (filed as Exhibit 10.3 to the Company’s Quarterly Report on Form 10-Q for the quarter ended September 30, 2011 and incorporated herein by reference) | |
10.15* | Form of Restricted Stock Agreement for executive officers under the Company’s 2010 Stock Incentive Plan (filed as Exhibit 10.2 to the Company’s Quarterly Report on Form 10-Q for the quarter ended September 30, 2011 and incorporated herein by reference) | |
10.16* | Form of Restricted Stock Unit Agreement for executive officers under the Company’s 2010 Stock Incentive Plan (filed as Exhibit 10.4 to the Company’s Quarterly Report on Form 10-Q for the quarter ended September 30, 2011 and incorporated herein by reference) | |
10.17* | Form of Stock Option Agreement under the Company’s 2010 Stock Incentive Plan (filed as Exhibit 10.1 to the Company’s Quarterly Report on Form 10-Q for the quarter ended September 30, 2011 and incorporated herein by reference) | |
10.18 | Lease dated June 14, 1991 between 200 West Street Limited Partnership and the Company (filed as Exhibit 10.19 to the Company’s Annual Report on Form 10-K for the year ended June 30, 2000 and incorporated herein by this reference). | |
10.19 | First Amendment dated as of January 3, 1992 to the Lease dated June 14, 1991 between 200 West Street Limited Partnership and the Company (filed as Exhibit 10.25 to the Company’s Registration Statement on Form S-1 (File No. 33-97406) and incorporated herein by this reference). | |
10.20 | Second Amendment dated as of June 28, 1993 to the Lease dated June 14, 1991 between 200 West Street Limited Partnership and the Company (filed as Exhibit 10.28 to the Company’s Registration Statement on Form S-1 (File No. 33-97406) and incorporated herein by this reference). | |
10.21 | Third Amendment to Lease dated November 17, 1998 between Boston Properties Limited Partnership and the Company (filed as Exhibit 10.1 to the Company’s Quarterly Report on Form 10-Q for the quarter ended December 31, 1998 and incorporated herein by this reference). | |
10.22 | Fourth Amendment dated August 28, 2000 to the Lease dated November 17, 1998 between Boston Properties Limited Partnership and the Company (filed as Exhibit 10.22 to the Company’s Annual Report on Form 10-K for the year ended June 30, 2000 and incorporated herein by this reference). | |
10.23 | Fifth Amendment dated as of June 29, 2007 to the lease dated June 14, 1991 by and between Boston Properties Limited Partnership and PAREXEL International, LLC (filed as Exhibit 10.12.5 to the Company’s Annual Report on Form 10-K for the year ended June 30, 2007 and incorporated herein by this reference). | |
10.24* | Amended and Restated Employment Agreement dated April 15, 2008 between Josef H. von Rickenbach and the Company (filed as Exhibit 10.1 to the Company’s Quarterly Report on Form 10-Q for the quarter ended March 31, 2008 and incorporated herein by this reference). | |
100
EXHIBIT NO. | DESCRIPTION | |
10.25* | Amended and Restated Change of Control/Severance Agreement, dated as of January 31, 2017, by and between the Company and Mark A. Goldberg (filed as Exhibit 10.1 to the Company’s Current Report on Form 8-K dated January 31, 2017 and incorporated herein by reference). | |
10.26* | PAREXEL International Amended and Restated Nonqualified Deferred Compensation Plan (filed as Exhibit 10.1 to the Company's Quarterly Report on Form 10-Q for the quarter ended March 31, 2013 and incorporated herein by this reference). | |
10.27 | Lease dated April 10, 2002 between API (No. 23) Limited, Arlington Property Investments Limited, PAREXEL International Limited and the Company (filed as Exhibit 10.22 to the Company’s Annual Report on Form 10-K for the year ended June 30, 2003 and incorporated herein by this reference). | |
10.28* | Amended and Restated Change of Control/Severance Agreement, dated as of April 15, 2008, by and between the Company and Douglas A. Batt (filed as Exhibit 10.26 to the Company’s Quarterly Report on Form 10-Q for the quarter ended March 31, 2008 and incorporated herein by this reference). | |
10.29* | Form of Key Employee Agreement for Executive Officers (US) (filed as Exhibit 10.2 to the Company's Quarterly Report on Form 10-Q for the quarter ended March 31, 2013 and incorporated herein by this reference). | |
10.30* | Form of Key Employee Agreement for Executive Officers (UK) (filed as Exhibit 10.3 to the Company's Quarterly Report on Form 10-Q for the quarter ended March 31, 2013 and incorporated herein by this reference). | |
10.31 | Receivables Purchase Agreement, dated as of February 19, 2013, by and between PAREXEL International, LLC and JPMorgan Chase Bank, N.A. (filed as Exhibit 10.1 to the Company's Current Report on Form 8-K dated February 19, 2013 and incorporated herein by reference). | |
10.32 | Note Purchase Agreement, dated as of June 25, 2013, between the Company and the Purchasers listed therein (filed as Exhibit 10.1 to the Company's Current Report on Form 8-K dated June 25, 2013 and incorporated herein by reference). | |
10.33 | Third Amended and Restated Credit agreement, dated as of March 11, 2016, among PAREXEL International Corporation, certain subsidiaries of PAREXEL, Bank of America, N.A., as Administrative Agent, Swingline Lender and L/C Issuer, Merrill Lynch, Pierce, Fenner & Smith Incorporated, HSBC Bank USA, National Association ("HSBC"), U.S. Bank, National Association ("US Bank"), TD Securities (USA) LLC (filed as Exhibit 10.1 to the Company's Current Report on 8-K dated March 11, 2016 and incorporated herein by reference) | |
10.34 | Supplier Receivables Purchase Agreement, dated as of February 22, 2017, by and between the Company and Bank of America, N.A. (filed as Exhibit 10.1 to the Company's Current Report on Form 8-K dated February 22, 2017 and incorporated herein by reference) | |
10.35* | Offer Letter, dated February 22, 2017, between PAREXEL and Simon Harford (filed as Exhibit 10.1 to the Company’s Current Report on Form 8-K dated February 25, 2017 and incorporated herein by reference). | |
10.36* | Change of Control/Severance Agreement, dated February 25, 2017, by and between the Company and Simon Harford (filed as Exhibit 10.2 to the Company Current Report on Form 8-K dated February 25, 2017 and incorporated herein by reference). | |
10.37* | Form of Director Indemnification Agreement (filed as Exhibit 10.1 to the Company's Current Report on Form 8-k dated June 19, 2017 and incorporated herein by reference) | |
10.38 | Revolving Credit Facility - Letter Loan Agreement, dated December 23, 2016, between HSBC and PAREXEL (filed as Exhibit 10.1 to the Company's Current Report on Form 8-K dated December 23, 2016 and incorporated herein by reference) | |
10.39* | Amendment to Simon Harford Change of Control/Severance Agreement, dated August 27, 2017 | |
10.40* | Second Amended to Batt Douglas Change in Control/Severance Agreement, dated August 28, 2017 | |
21.1 | List of subsidiaries of the Company. | |
23.1 | Consent of Independent Registered Public Accounting Firm. | |
31.1 | CEO certification pursuant to Section 302 of the Sarbanes-Oxley Act of 2002. | |
31.2 | CFO certification pursuant to Section 302 of the Sarbanes-Oxley Act of 2002. | |
32.1 | CEO certification pursuant to Section 906 of the Sarbanes-Oxley Act of 2002. | |
32.2 | CFO certification pursuant to Section 906 of the Sarbanes-Oxley Act of 2002. | |
101.INS** | XBRL Instance Document. | |
101.SCH** | XBRL Taxonomy Extension Schema. | |
101.CAL** | XBRL Taxonomy Extension Calculation Linkbase. | |
101.DEF** | XBRL Taxonomy Extension Definition Linkbase. | |
101.LAB** | XBRL Taxonomy Extension Label Linkbase. | |
101.PRE** | XBRL Taxonomy Extension Presentation Linkbase. | |
* Denotes management contract or any compensatory plan, contract or arrangement | ||
** In accordance with Rule 406T of Regulation S-T, the information in these exhibits is furnished and deemed not filed or part of a registration statement or prospectus for purposes of Sections 11 or 12 of the Securities Act of 1933, is deemed not filed for purposes of Section 18 of the Securities Exchange Act of 1934, and otherwise is not subject to liability under these sections | ||
101