Attached files
| file | filename |
|---|---|
| EX-99.1 - EX-99.1 - BEACON ROOFING SUPPLY INC | d444643dex991.htm |
| EX-10.2 - EX-10.2 - BEACON ROOFING SUPPLY INC | d444643dex102.htm |
| EX-10.1 - EX-10.1 - BEACON ROOFING SUPPLY INC | d444643dex101.htm |
| EX-2.1 - EX-2.1 - BEACON ROOFING SUPPLY INC | d444643dex21.htm |
| 8-K - FORM 8-K - BEACON ROOFING SUPPLY INC | d444643d8k.htm |
Acquisition of Allied Building Products August 24, 2017 Exhibit 99.2
Forward Looking Statements and Non-GAAP Measures This presentation contains information about management's view of the Company's future expectations, plans and prospects that constitute forward-looking statements for purposes of the safe harbor provisions under the Private Securities Litigation Reform Act of 1995. Actual results may differ materially from those indicated by such forward-looking statements as a result of various important factors, including, but not limited to, those set forth in the "Risk Factors" section of the Company's latest Form 10-K and under the heading “Forward Looking Statements” in the Company’s August 24, 2017 press release. In addition, the forward-looking statements included in this presentation represent the Company's views as of the date of this presentation and these views could change. However, while the Company may elect to update these forward-looking statements at some point, the Company specifically disclaims any obligation to do so, other than as required by federal securities laws. These forward-looking statements should not be relied upon as representing the Company's views as of any date subsequent to the date of this presentation. This presentation contains projections of Adjusted EBITDA, which is a measure not presented in accordance with generally accepted accounting principles (“GAAP"). Adjusted EBITDA is defined as net income plus interest expense (net of interest income), income taxes, depreciation and amortization, adjustments to contingent consideration, stock-based compensation, non-recurring acquisition costs and projected run rate synergies. The company utilizes Adjusted EBITDA to analyze and report operating results that are unaffected by differences in capital structures, capital investment cycles, and varying ages of related assets. Although the company believes this measure provides a useful representation of performance, non-GAAP financial measures should not be considered in isolation or as a substitute for any items calculated in accordance with GAAP. In addition, this presentation includes projections regarding the expected accretive impact of the proposed transaction to Adjusted EPS, based on internal forecasts of Adjusted EPS, which forecasts are non-GAAP financial measures and are derived by excluding transaction related expenses and incremental deal-related intangibles amortization. These accretion projections also should not be considered a substitute for GAAP measures. The determination of the amounts that are excluded in making the accretion calculations are a matter of management judgment. [Beacon logo]
Paul Isabella President and Chief Executive Officer Joe Nowicki Executive Vice President and Chief Financial Officer Today’s Presenters
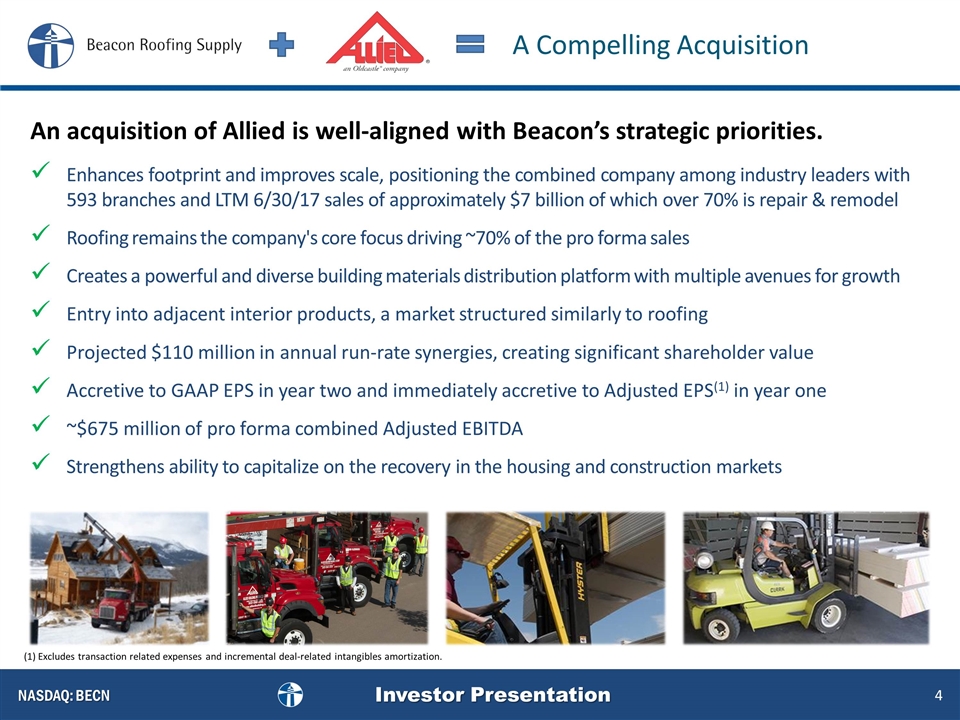
Enhances footprint and improves scale, positioning the combined company among industry leaders with 593 branches and LTM 6/30/17 sales of approximately $7 billion of which over 70% is repair & remodel Roofing remains the company's core focus driving ~70% of the pro forma sales Creates a powerful and diverse building materials distribution platform with multiple avenues for growth Entry into adjacent interior products, a market structured similarly to roofing Projected $110 million in annual run-rate synergies, creating significant shareholder value Accretive to GAAP EPS in year two and immediately accretive to Adjusted EPS(1) in year one ~$675 million of pro forma combined Adjusted EBITDA Strengthens ability to capitalize on the recovery in the housing and construction markets An acquisition of Allied is well-aligned with Beacon’s strategic priorities. A Compelling Acquisition (1) Excludes transaction related expenses and incremental deal-related intangibles amortization. 71% of PF sales 71% is roofing and 75% is repaid and re-modelling Specific that it is still roofing and repair and remodel
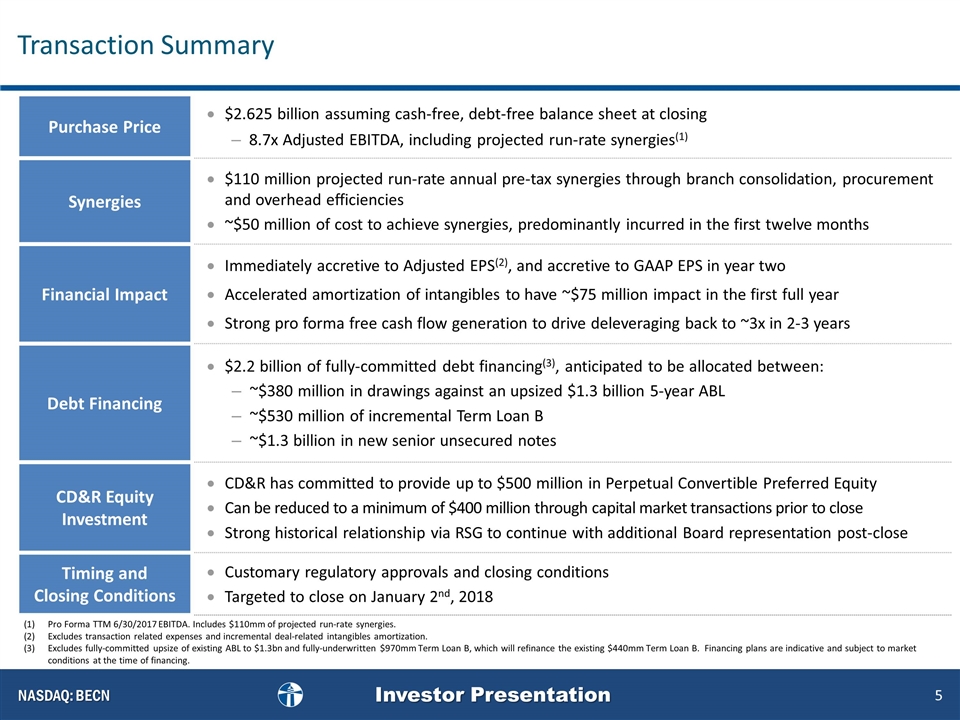
Transaction Summary Purchase Price $2.625 billion assuming cash-free, debt-free balance sheet at closing 8.7x Adjusted EBITDA, including projected run-rate synergies(1) Synergies $110 million projected run-rate annual pre-tax synergies through branch consolidation, procurement and overhead efficiencies ~$50 million of cost to achieve synergies, predominantly incurred in the first twelve months Financial Impact Immediately accretive to Adjusted EPS(2), and accretive to GAAP EPS in year two Accelerated amortization of intangibles to have ~$75 million impact in the first full year Strong pro forma free cash flow generation to drive deleveraging back to ~3x in 2-3 years Debt Financing $2.2 billion of fully-committed debt financing(3), anticipated to be allocated between: ~$380 million in drawings against an upsized $1.3 billion 5-year ABL ~$530 million of incremental Term Loan B ~$1.3 billion in new senior unsecured notes CD&R Equity Investment CD&R has committed to provide up to $500 million in Perpetual Convertible Preferred Equity Can be reduced to a minimum of $400 million through capital market transactions prior to close Strong historical relationship via RSG to continue with additional Board representation post-close Timing and Closing Conditions Customary regulatory approvals and closing conditions Targeted to close on January 2nd, 2018 Rework 2nd bullet in financial impact to take out the number $115 and be more general Pro Forma TTM 6/30/2017 EBITDA. Includes $110mm of projected run-rate synergies. Excludes transaction related expenses and incremental deal-related intangibles amortization. Excludes fully-committed upsize of existing ABL to $1.3bn and fully-underwritten $970mm Term Loan B, which will refinance the existing $440mm Term Loan B. Financing plans are indicative and subject to market conditions at the time of financing.
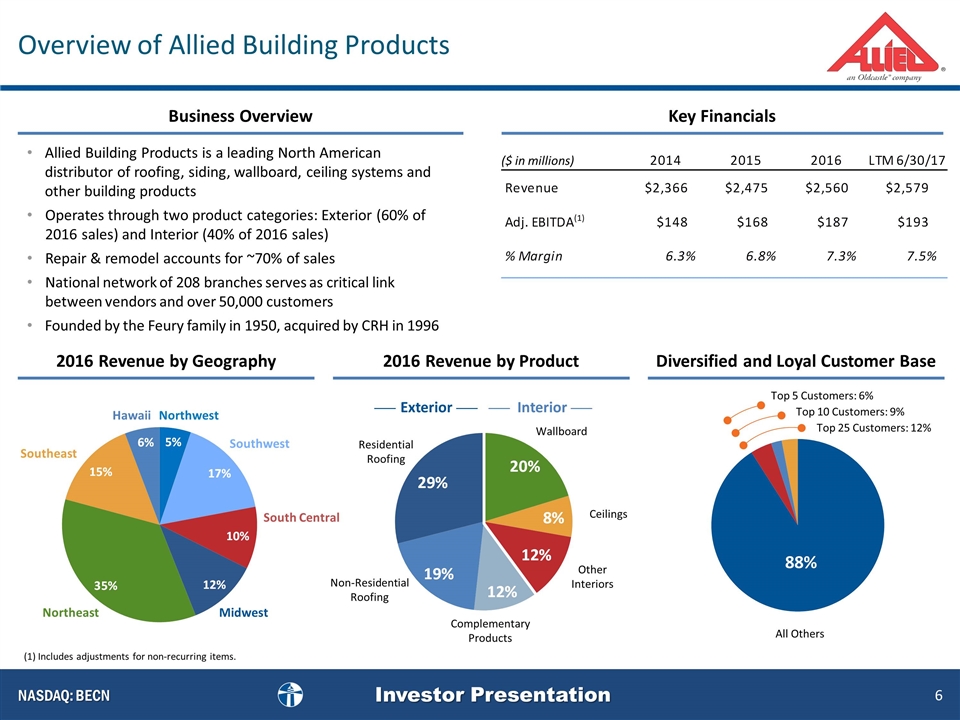
Diversified and Loyal Customer Base Residential Roofing Complementary Products Non-Residential Roofing Top 5 Customers: 6% Top 10 Customers: 9% Top 25 Customers: 12% All Others Key Financials Business Overview 2016 Revenue by Geography Allied Building Products is a leading North American distributor of roofing, siding, wallboard, ceiling systems and other building products Operates through two product categories: Exterior (60% of 2016 sales) and Interior (40% of 2016 sales) Repair & remodel accounts for ~70% of sales National network of 208 branches serves as critical link between vendors and over 50,000 customers Founded by the Feury family in 1950, acquired by CRH in 1996 2016 Revenue by Product 88% ($ in millions) Interior Exterior Overview of Allied Building Products (1) (1) Includes adjustments for non-recurring items. Northwest Southwest South Central Midwest Northeast Southeast Hawaii Wallboard Other Interiors Ceilings
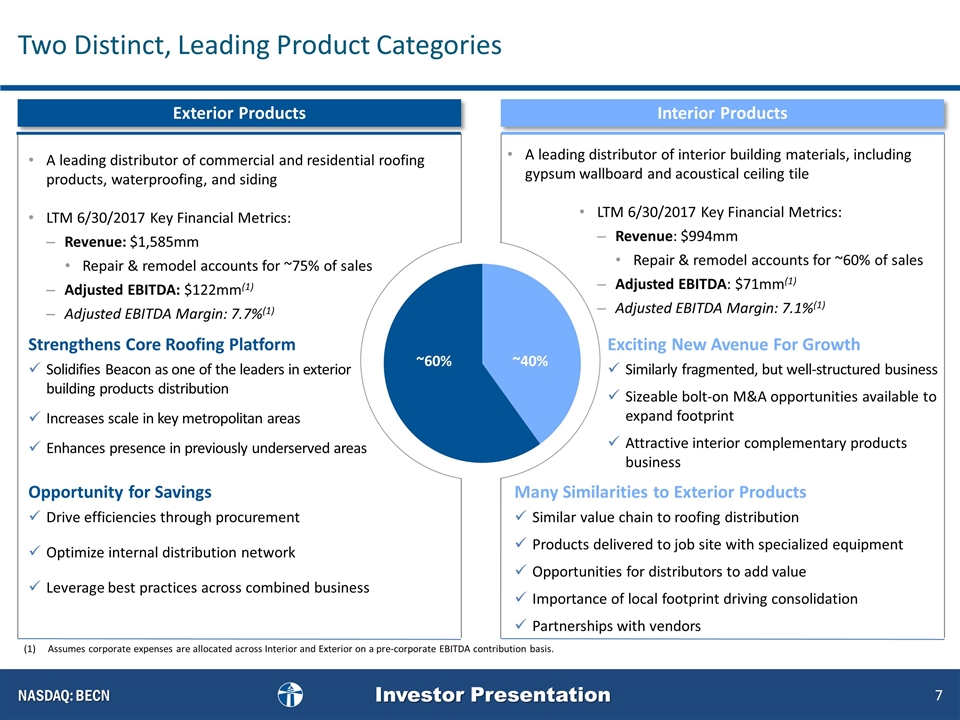
A leading distributor of interior building materials, including gypsum wallboard and acoustical ceiling tile LTM 6/30/2017 Key Financial Metrics: Revenue: $994mm Repair & remodel accounts for ~60% of sales Adjusted EBITDA: $71mm(1) Adjusted EBITDA Margin: 7.1%(1) A leading distributor of commercial and residential roofing products, waterproofing, and siding LTM 6/30/2017 Key Financial Metrics: Revenue: $1,585mm Repair & remodel accounts for ~75% of sales Adjusted EBITDA: $122mm(1) Adjusted EBITDA Margin: 7.7%(1) Exterior Products Interior Products ~60% ~40% Solidifies Beacon as one of the leaders in exterior building products distribution Increases scale in key metropolitan areas Enhances presence in previously underserved areas Opportunity for Savings Drive efficiencies through procurement Optimize internal distribution network Leverage best practices across combined business Strengthens Core Roofing Platform Similarly fragmented, but well-structured business Sizeable bolt-on M&A opportunities available to expand footprint Attractive interior complementary products business Many Similarities to Exterior Products Similar value chain to roofing distribution Products delivered to job site with specialized equipment Opportunities for distributors to add value Importance of local footprint driving consolidation Partnerships with vendors Exciting New Avenue For Growth Assumes corporate expenses are allocated across Interior and Exterior on a pre-corporate EBITDA contribution basis. Two Distinct, Leading Product Categories
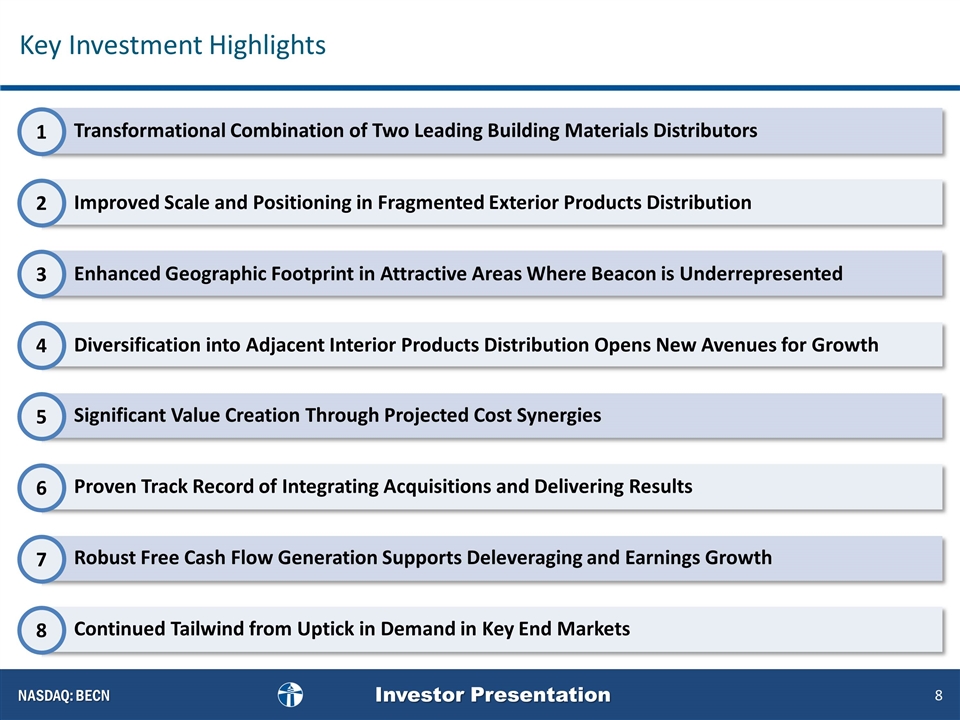
Transformational Combination of Two Leading Building Materials Distributors Diversification into Adjacent Interior Products Distribution Opens New Avenues for Growth Improved Scale and Positioning in Fragmented Exterior Products Distribution Enhanced Geographic Footprint in Attractive Areas Where Beacon is Underrepresented Significant Value Creation Through Projected Cost Synergies Proven Track Record of Integrating Acquisitions and Delivering Results Robust Free Cash Flow Generation Supports Deleveraging and Earnings Growth Continued Tailwind from Uptick in Demand in Key End Markets 1 2 3 4 5 6 7 8 Key Investment Highlights
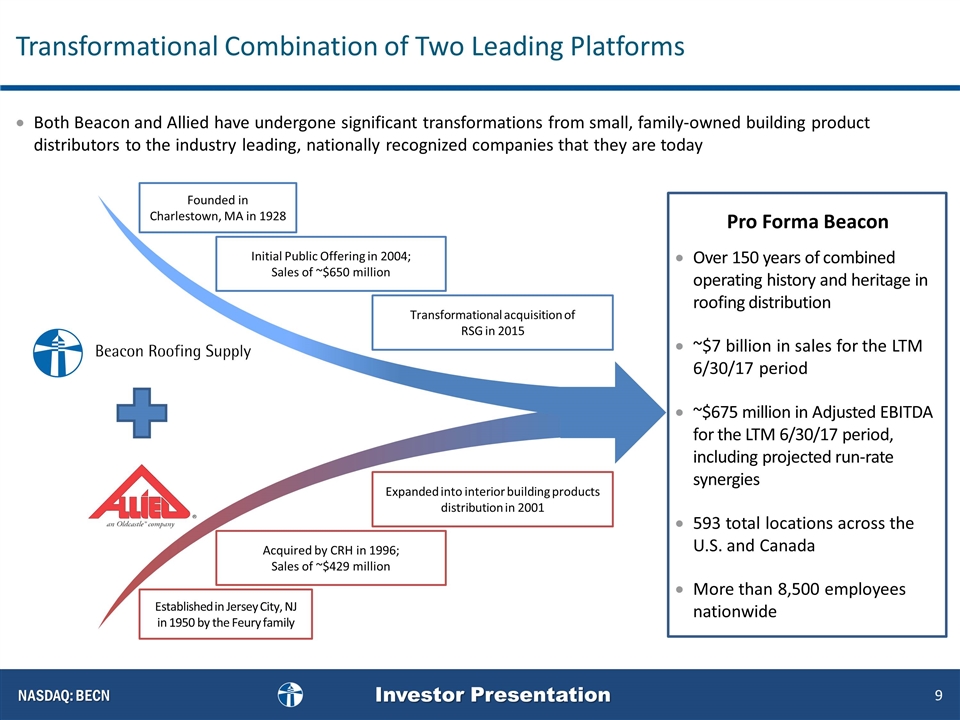
Both Beacon and Allied have undergone significant transformations from small, family-owned building product distributors to the industry leading, nationally recognized companies that they are today Founded in Charlestown, MA in 1928 Initial Public Offering in 2004; Sales of ~$650 million Over 150 years of combined operating history and heritage in roofing distribution ~$7 billion in sales for the LTM 6/30/17 period ~$675 million in Adjusted EBITDA for the LTM 6/30/17 period, including projected run-rate synergies 593 total locations across the U.S. and Canada More than 8,500 employees nationwide Pro Forma Beacon Transformational acquisition of RSG in 2015 Established in Jersey City, NJ in 1950 by the Feury family Acquired by CRH in 1996; Sales of ~$429 million Expanded into interior building products distribution in 2001 Transformational Combination of Two Leading Platforms
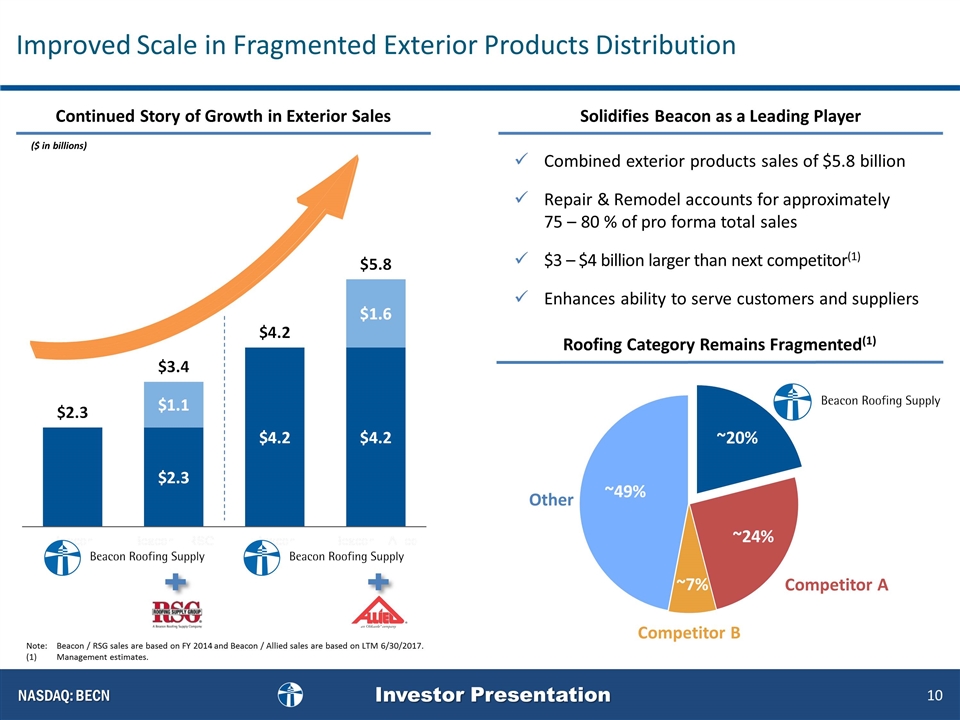
Solidifies Beacon as a Leading Player Combined exterior products sales of $5.8 billion Repair & Remodel accounts for approximately 75 – 80 % of pro forma total sales $3 – $4 billion larger than next competitor(1) Enhances ability to serve customers and suppliers Roofing Category Remains Fragmented(1) ~20% Other ~24% ~7% ~49% Note:Beacon / RSG sales are based on FY 2014 and Beacon / Allied sales are based on LTM 6/30/2017. (1)Management estimates. Continued Story of Growth in Exterior Sales ($ in billions) Improved Scale in Fragmented Exterior Products Distribution Competitor A Competitor B
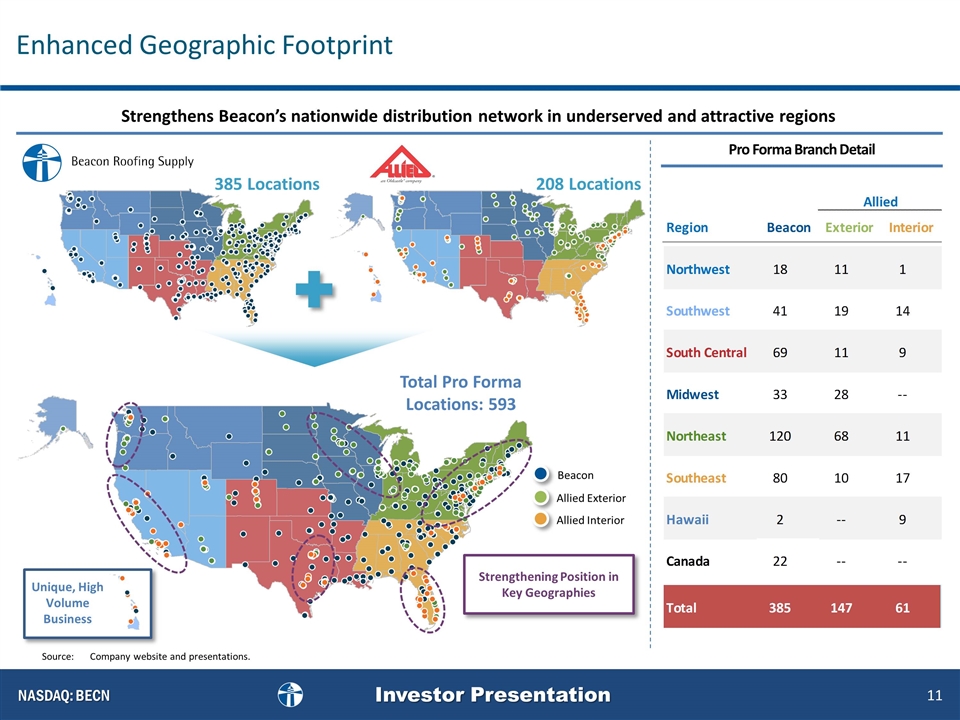
385 Locations 208 Locations Total Pro Forma Locations: 593 Source:Company website and presentations. Unique, High Volume Business Strengthening Position in Key Geographies Strengthens Beacon’s nationwide distribution network in underserved and attractive regions Pro Forma Branch Detail Enhanced Geographic Footprint Alaska Beacon Allied Exterior Allied Interior
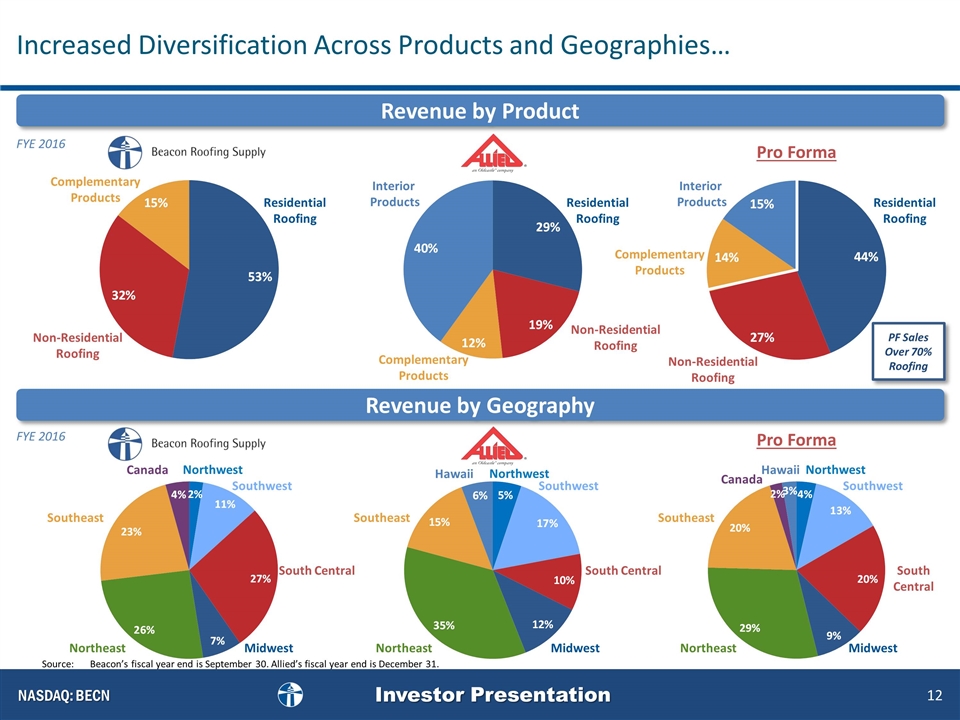
Revenue by Product Revenue by Geography Pro Forma Pro Forma FYE 2016 Residential Roofing Non-Residential Roofing Complementary Products Residential Roofing Non-Residential Roofing Complementary Products Interior Products Residential Roofing Non-Residential Roofing Complementary Products Interior Products FYE 2016 Increased Diversification Across Products and Geographies… Northwest Southwest South Central Midwest Northeast Southeast Canada Northwest Southwest South Central Midwest Northeast Southeast Hawaii Northwest Southwest South Central Midwest Northeast Southeast Hawaii Canada PF Sales Over 70% Roofing Source:Beacon’s fiscal year end is September 30. Allied’s fiscal year end is December 31.
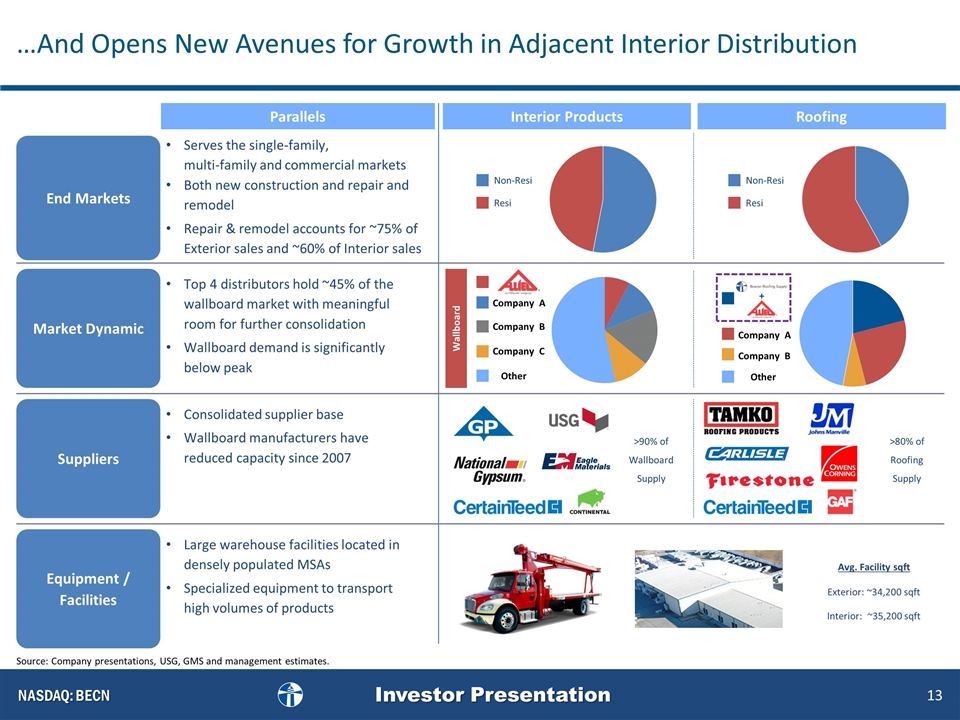
Source: Company presentations, USG, GMS and management estimates. Equipment / Facilities Large warehouse facilities located in densely populated MSAs Specialized equipment to transport high volumes of products Parallels Interior Products End Markets Serves the single-family, multi-family and commercial markets Both new construction and repair and remodel Repair & remodel accounts for ~75% of Exterior sales and ~60% of Interior sales Market Dynamic Top 4 distributors hold ~45% of the wallboard market with meaningful room for further consolidation Wallboard demand is significantly below peak Suppliers Consolidated supplier base Wallboard manufacturers have reduced capacity since 2007 Avg. Facility sqft Exterior: ~34,200 sqft Interior: ~35,200 sqft Wallboard Non-Resi Resi >90% of Wallboard Supply …And Opens New Avenues for Growth in Adjacent Interior Distribution Other Roofing Non-Resi Resi >80% of Roofing Supply + Other Competitor A, B, C Company A Company B Company C Company A Company B
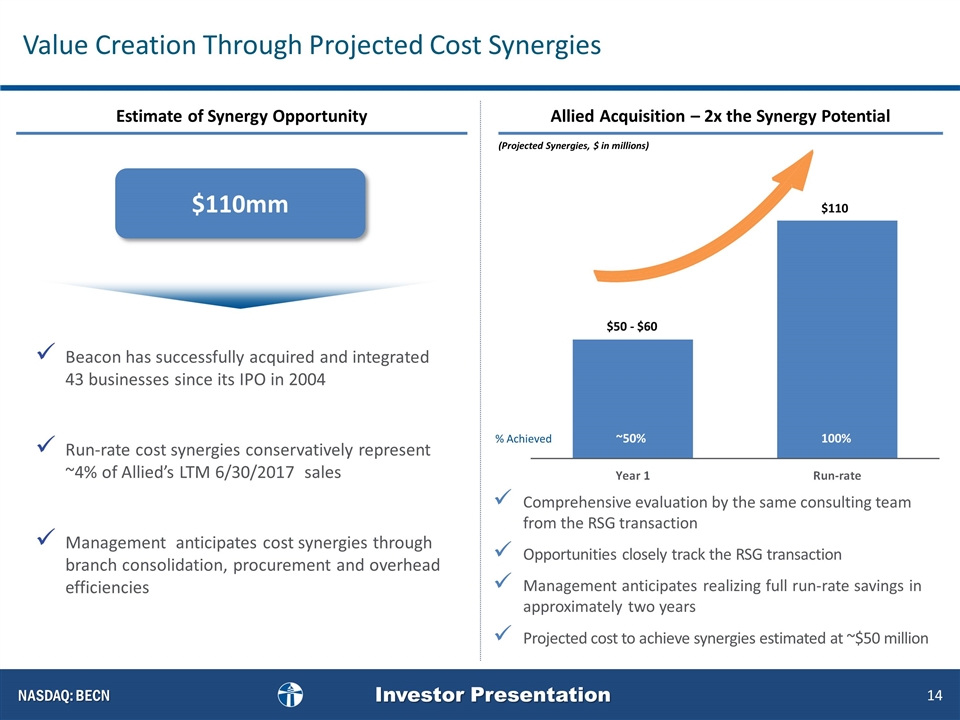
Comprehensive evaluation by the same consulting team from the RSG transaction Opportunities closely track the RSG transaction Management anticipates realizing full run-rate savings in approximately two years Projected cost to achieve synergies estimated at ~$50 million $50 - $60 % Achieved 90%+ ~50% Allied Acquisition – 2x the Synergy Potential Estimate of Synergy Opportunity (Projected Synergies, $ in millions) Value Creation Through Projected Cost Synergies Run-rate of 110+ $110 100% $110mm Beacon has successfully acquired and integrated 43 businesses since its IPO in 2004 Run-rate cost synergies conservatively represent ~4% of Allied’s LTM 6/30/2017 sales Management anticipates cost synergies through branch consolidation, procurement and overhead efficiencies
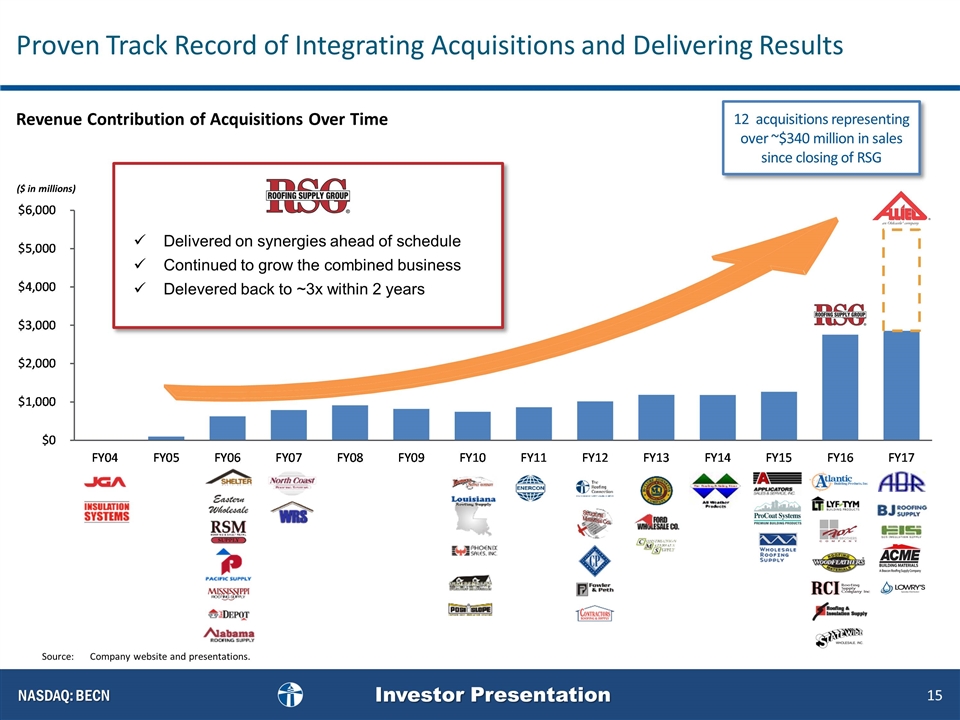
Delivered on synergies ahead of schedule Continued to grow the combined business Delevered back to ~3x within 2 years ($ in millions) Revenue Contribution of Acquisitions Over Time Proven Track Record of Integrating Acquisitions and Delivering Results 12 acquisitions representing over ~$340 million in sales since closing of RSG Source:Company website and presentations.
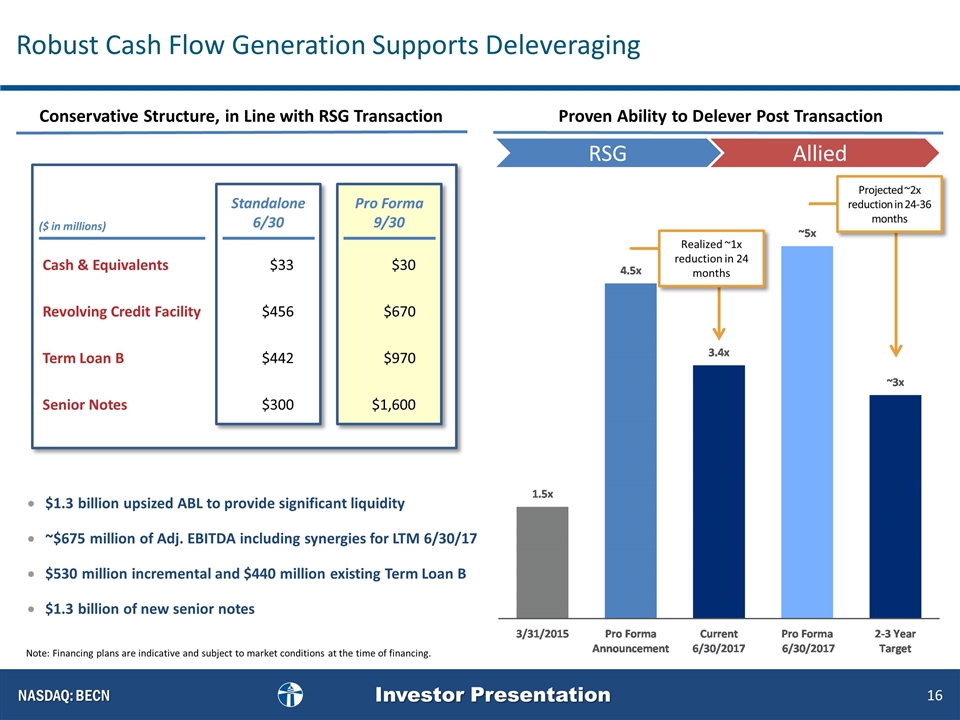
Allied Proven Ability to Delever Post Transaction Realized ~1x reduction in 24 months Projected ~2x reduction in 24-36 months $1.3 billion upsized ABL to provide significant liquidity ~$675 million of Adj. EBITDA including synergies for LTM 6/30/17 $530 million incremental and $440 million existing Term Loan B $1.3 billion of new senior notes Cash & Equivalents Revolving Credit Facility Term Loan B Senior Notes Standalone 6/30 Pro Forma 9/30 $33 $456 $442 $300 $30 $670 $970 $1,600 ($ in millions) Conservative Structure, in Line with RSG Transaction Robust Cash Flow Generation Supports Deleveraging RSG Note: Financing plans are indicative and subject to market conditions at the time of financing.
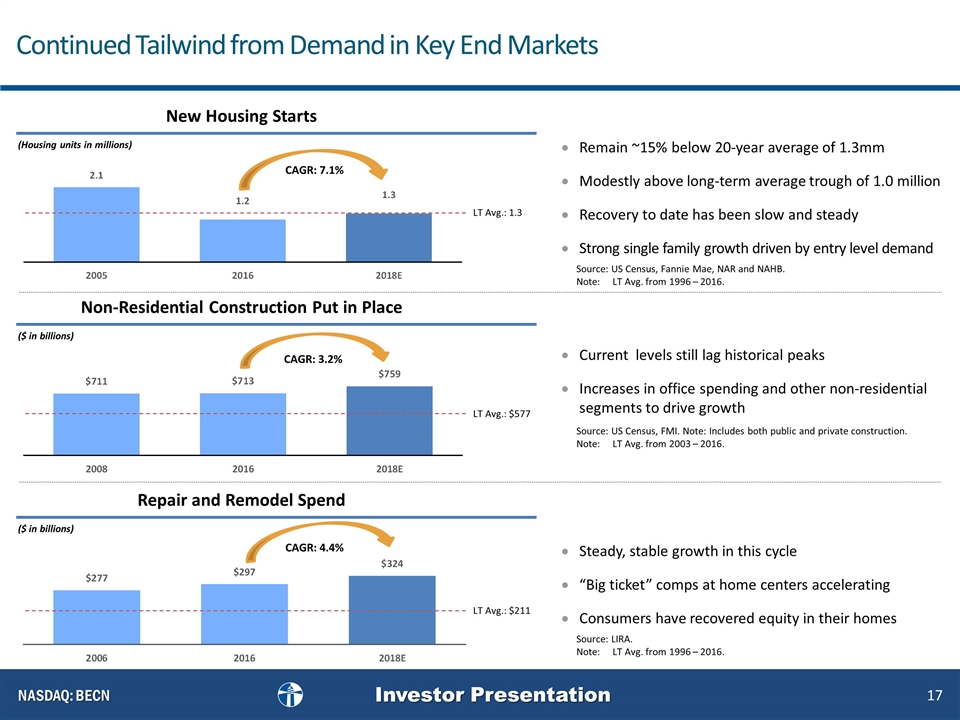
(Housing units in millions) Remain ~15% below 20-year average of 1.3mm Modestly above long-term average trough of 1.0 million Recovery to date has been slow and steady Strong single family growth driven by entry level demand Current levels still lag historical peaks Increases in office spending and other non-residential segments to drive growth Steady, stable growth in this cycle “Big ticket” comps at home centers accelerating Consumers have recovered equity in their homes New Housing Starts ($ in billions) Non-Residential Construction Put in Place ($ in billions) Repair and Remodel Spend CAGR: 3.2% CAGR: 7.1% CAGR: 4.4% Source: US Census, Fannie Mae, NAR and NAHB. Note: LT Avg. from 1996 – 2016. Source: US Census, FMI. Note: Includes both public and private construction. Note: LT Avg. from 2003 – 2016. Source: LIRA. Note: LT Avg. from 1996 – 2016. LT Avg.: 1.3 LT Avg.: $577 LT Avg.: $211 Continued Tailwind from Demand in Key End Markets Line chart
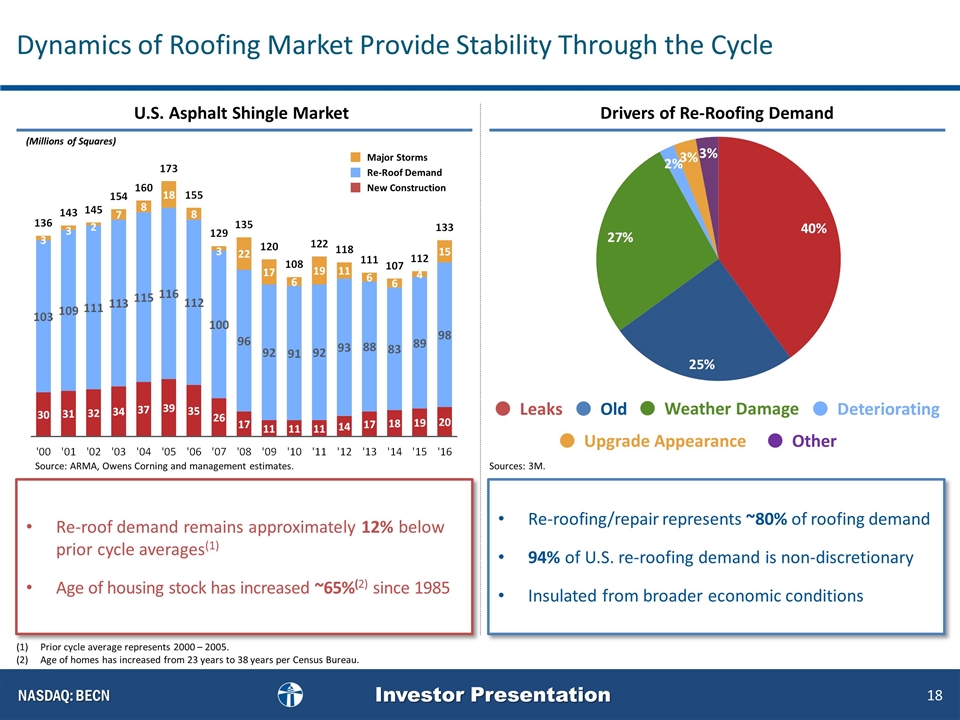
Prior cycle average represents 2000 – 2005. Age of homes has increased from 23 years to 38 years per Census Bureau. Source: ARMA, Owens Corning and management estimates. U.S. Asphalt Shingle Market (Millions of Squares) Re-roof demand remains approximately 12% below prior cycle averages(1) Age of housing stock has increased ~65%(2) since 1985 Re-roofing/repair represents ~80% of roofing demand 94% of U.S. re-roofing demand is non-discretionary Insulated from broader economic conditions Drivers of Re-Roofing Demand Leaks Old Weather Damage Deteriorating Upgrade Appearance Other Sources: 3M. Dynamics of Roofing Market Provide Stability Through the Cycle Major Storms Re-Roof Demand New Construction
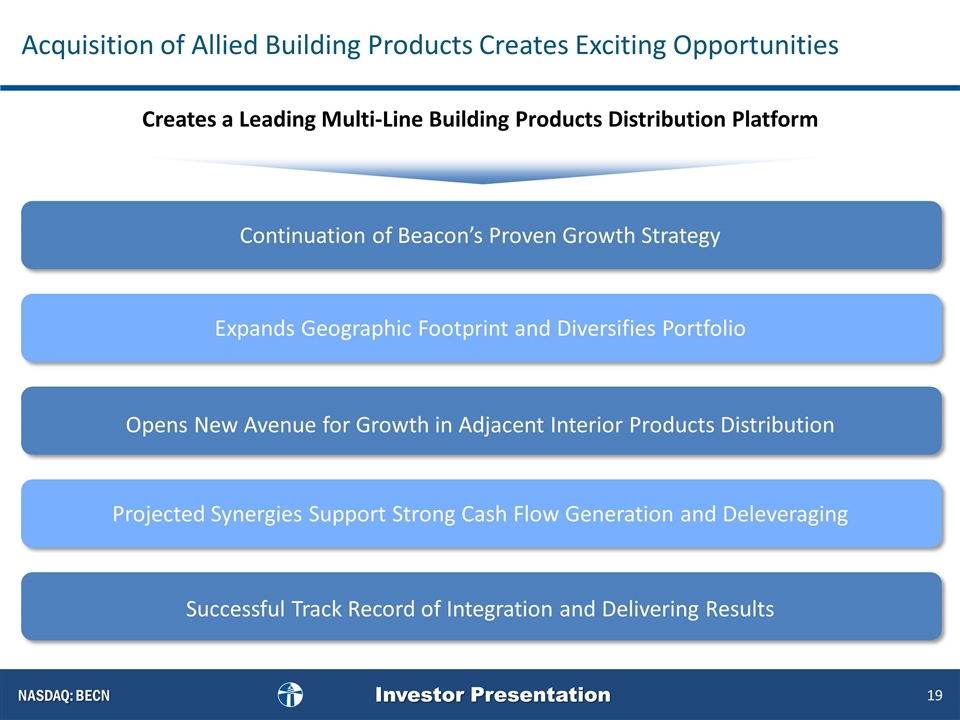
Creates a Leading Multi-Line Building Products Distribution Platform Enhances Growth Strategy Projected Synergies Support Strong Cash Flow Generation and Deleveraging Opens New Avenue for Growth in Adjacent Interior Products Distribution Expands Geographic Footprint and Diversifies Portfolio Successful Track Record of Integration and Delivering Results Acquisition of Allied Building Products Creates Exciting Opportunities Continuation of Beacon’s Proven Growth Strategy
