Attached files
| file | filename |
|---|---|
| 8-K - 8-K - US BANCORP \DE\ | a17-20719_18k.htm |
Exhibit 99.1
U.S. Bancorp Intellisight Investor Presentation August 22, 2017 EVP, Treasurer John Stern
Forward-looking Statements and Additional Information The following information appears in accordance with the Private Securities Litigation Reform Act of 1995: Today’s presentation contains forward-looking statements about U.S. Bancorp. Statements that are not historical or current facts, including statements about beliefs and expectations, are forward-looking statements and are based on the information available to, and assumptions and estimates made by, management as of the date hereof. These forward-looking statements cover, among other things, anticipated future revenue and expenses and the future plans and prospects of U.S. Bancorp. Forward-looking statements involve inherent risks and uncertainties, and important factors could cause actual results to differ materially from those anticipated. A reversal or slowing of the current economic recovery or another severe contraction could adversely affect U.S. Bancorp’s revenues and the values of its assets and liabilities. Global financial markets could experience a recurrence of significant turbulence, which could reduce the availability of funding to certain financial institutions and lead to a tightening of credit, a reduction of business activity, and increased market volatility. Stress in the commercial real estate markets, as well as a downturn in the residential real estate markets could cause credit losses and deterioration in asset values. In addition, changes to statutes, regulations, or regulatory policies or practices could affect U.S. Bancorp in substantial and unpredictable ways. U.S. Bancorp’s results could also be adversely affected by deterioration in general business and economic conditions; changes in interest rates; deterioration in the credit quality of its loan portfolios or in the value of the collateral securing those loans; deterioration in the value of securities held in its investment securities portfolio; legal and regulatory developments; litigation; increased competition from both banks and non-banks; changes in customer behavior and preferences; breaches in data security; effects of mergers and acquisitions and related integration; effects of critical accounting policies and judgments; and management’s ability to effectively manage credit risk, market risk, operational risk, compliance risk, strategic risk, interest rate risk, liquidity risk and reputational risk. For discussion of these and other risks that may cause actual results to differ from expectations, refer to U.S. Bancorp’s Annual Report on Form 10-K for the year ended December 31, 2016, on file with the Securities and Exchange Commission, including the sections entitled “Risk Factors” and “Corporate Risk Profile” contained in Exhibit 13, and all subsequent filings with the Securities and Exchange Commission under Sections 13(a), 13(c), 14 or 15(d) of the Securities Exchange Act of 1934. However, factors other than these also could adversely affect U.S. Bancorp’s results, and the reader should not consider these factors to be a complete set of all potential risks or uncertainties. Forward-looking statements speak only as of the date hereof, and U.S. Bancorp undertakes no obligation to update them in light of new information or future events. This presentation includes non-GAAP financial measures to describe U.S. Bancorp’s performance. The calculations of these measures are provided in the Appendix. These disclosures should not be viewed as a substitute for operating results determined in accordance with GAAP, nor are they necessarily comparable to non-GAAP performance measures that may be presented by other companies.
Agenda U.S. Bank Overview Risk Management The Regulatory Environment Top Issues in the Banking Industry
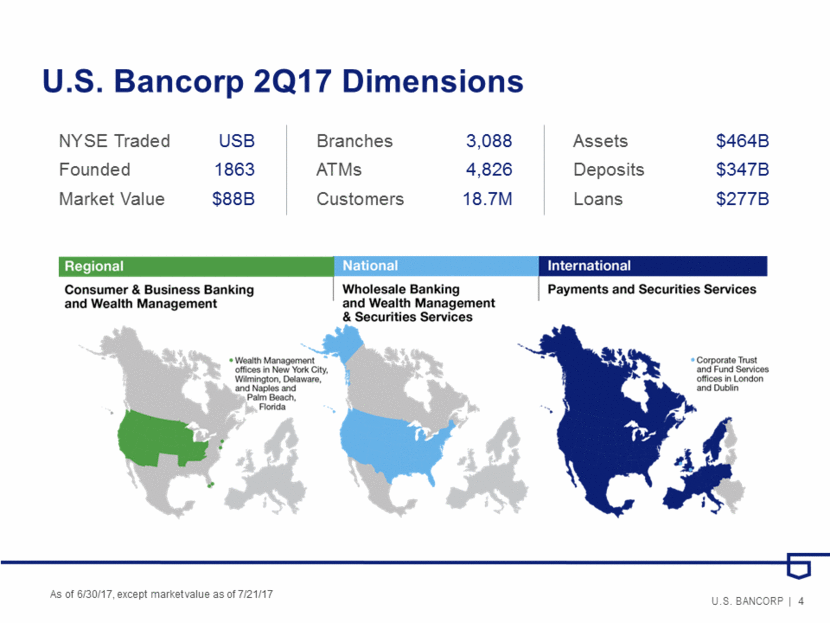
U.S. Bancorp 2Q17 Dimensions As of 6/30/17, except market value as of 7/21/17 NYSE Traded USB Founded 1863 Market Value $88B Branches 3,088 ATMs 4,826 Customers 18.7M Assets $464B Deposits $347B Loans $277B
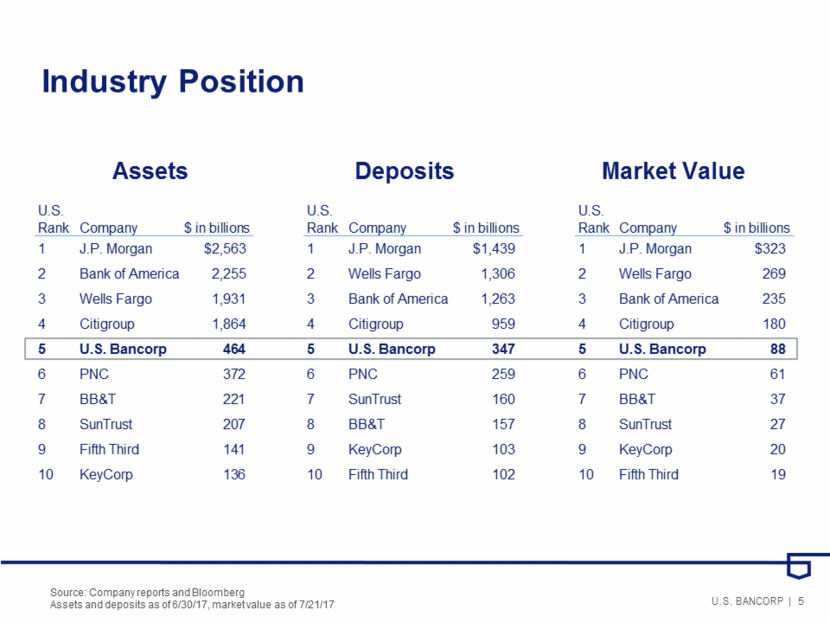
Industry Position Source: Company reports and Bloomberg Assets and deposits as of 6/30/17, market value as of 7/21/17 Assets Market Value Deposits
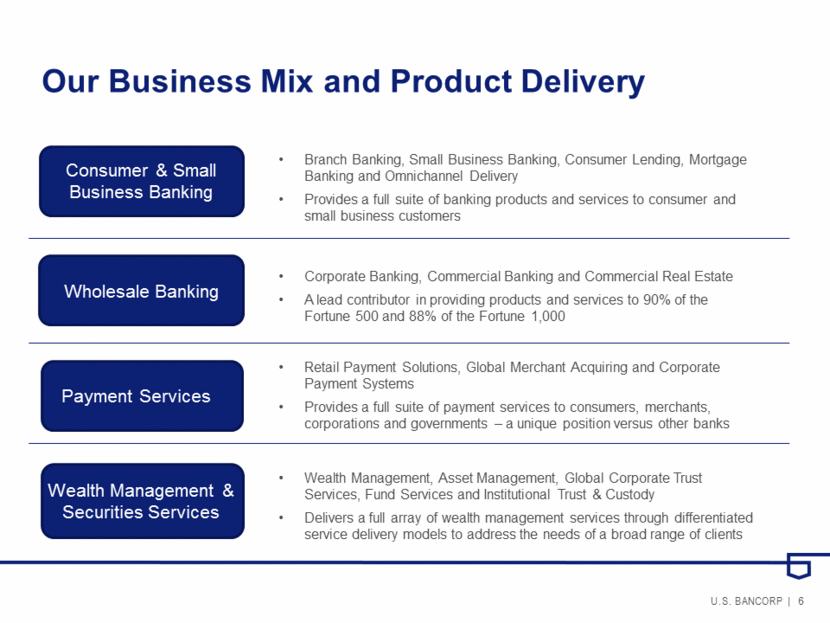
Our Business Mix and Product Delivery Payment Services Wealth Management & Securities Services Retail Payment Solutions, Global Merchant Acquiring and Corporate Payment Systems Provides a full suite of payment services to consumers, merchants, corporations and governments – a unique position versus other banks Wealth Management, Asset Management, Global Corporate Trust Services, Fund Services and Institutional Trust & Custody Delivers a full array of wealth management services through differentiated service delivery models to address the needs of a broad range of clients Branch Banking, Small Business Banking, Consumer Lending, Mortgage Banking and Omnichannel Delivery Provides a full suite of banking products and services to consumer and small business customers Corporate Banking, Commercial Banking and Commercial Real Estate A lead contributor in providing products and services to 90% of the Fortune 500 and 88% of the Fortune 1,000 Wholesale Banking Consumer & Small Business Banking
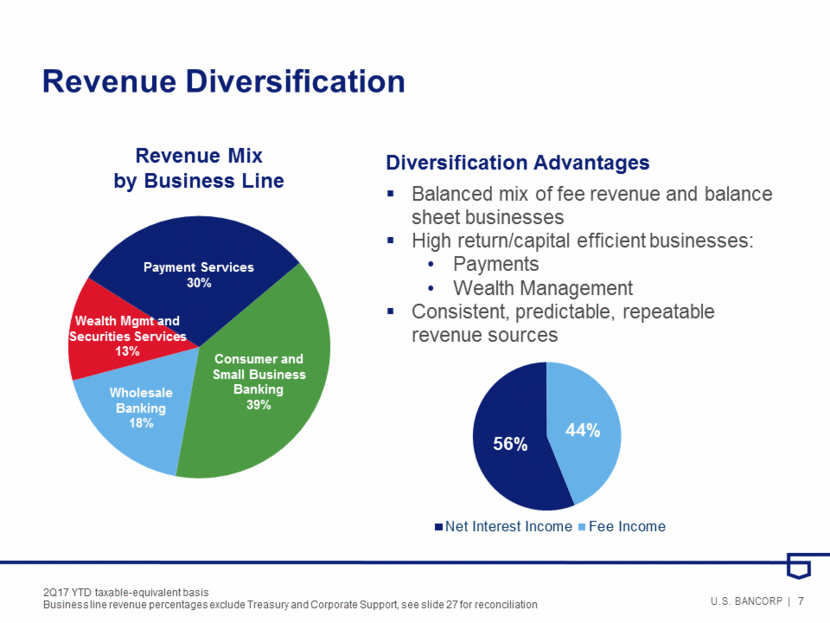
Revenue Diversification 2Q17 YTD taxable-equivalent basis Business line revenue percentages exclude Treasury and Corporate Support, see slide 27 for reconciliation Payment Services 30% Consumer and Small Business Banking 39% Wholesale Banking 18% Revenue Mix by Business Line Diversification Advantages Balanced mix of fee revenue and balance sheet businesses High return/capital efficient businesses: Payments Wealth Management Consistent, predictable, repeatable revenue sources Wealth Mgmt and Securities Services 13% 56% 44% Net Interest Income Fee Income
Agenda U.S. Bank Overview Risk Management The Regulatory Environment Top Issues in the Banking Industry
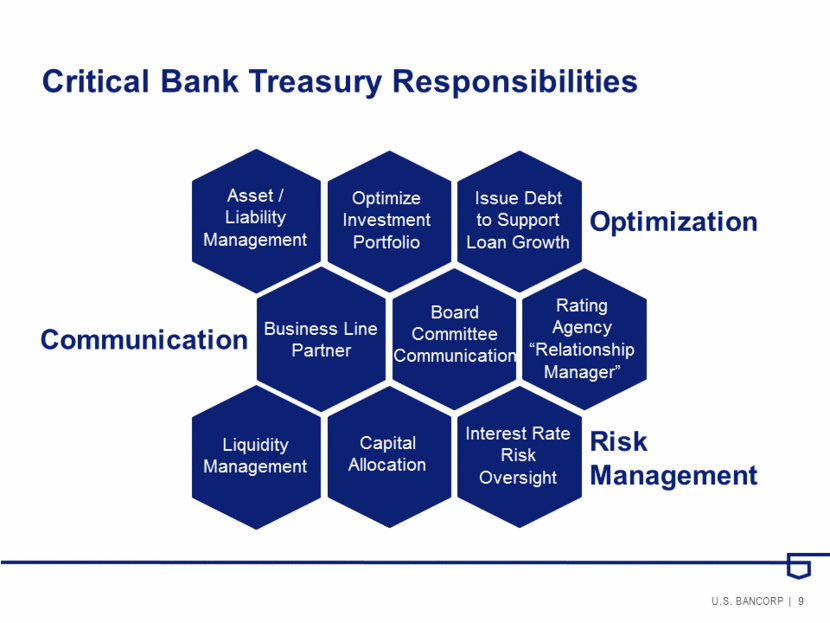
Critical Bank Treasury Responsibilities Optimization Communication Risk Management Asset / Liability Management Optimize Investment Portfolio Issue Debt to Support Loan Growth Business Line Partner Board Committee Communication Rating Agency “Relationship Manager” Liquidity Management Capital Allocation Interest Rate Risk Oversight
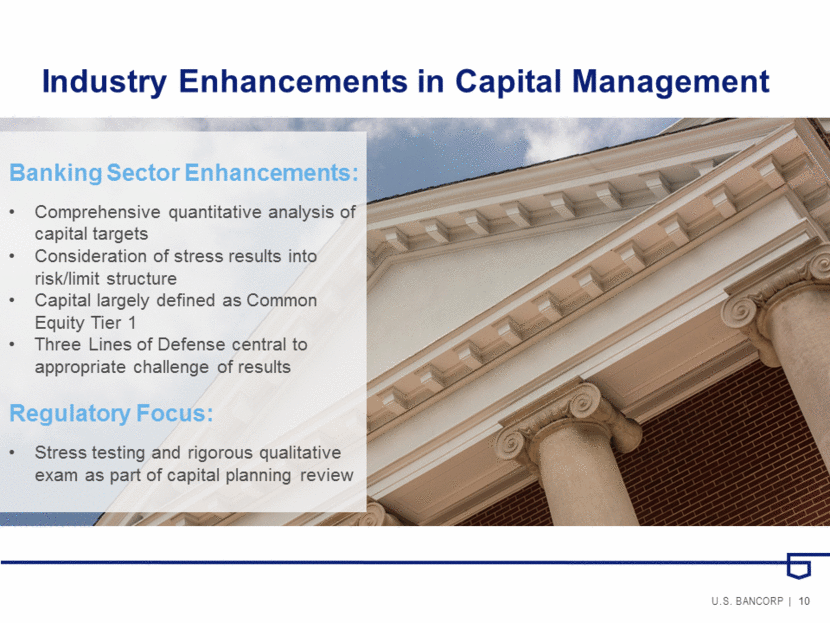
Industry Enhancements in Capital Management Banking Sector Enhancements: Comprehensive quantitative analysis of capital targets Consideration of stress results into risk/limit structure Capital largely defined as Common Equity Tier 1 Three Lines of Defense central to appropriate challenge of results Regulatory Focus: Stress testing and rigorous qualitative exam as part of capital planning review
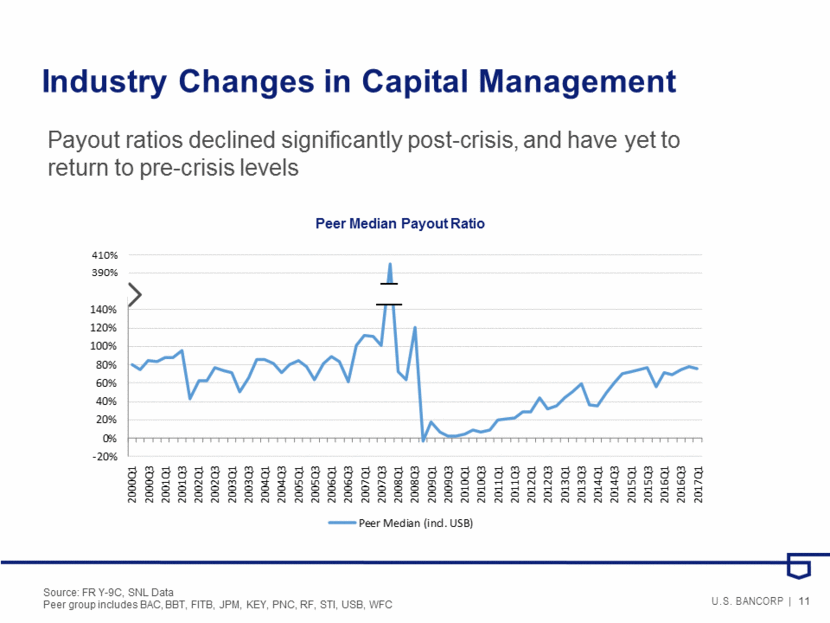
Industry Changes in Capital Management Source: FR Y-9C, SNL Data Peer group includes BAC, BBT, FITB, JPM, KEY, PNC, RF, STI, USB, WFC Peer Median Payout Ratio 410% 390% Payout ratios declined significantly post-crisis, and have yet to return to pre-crisis levels
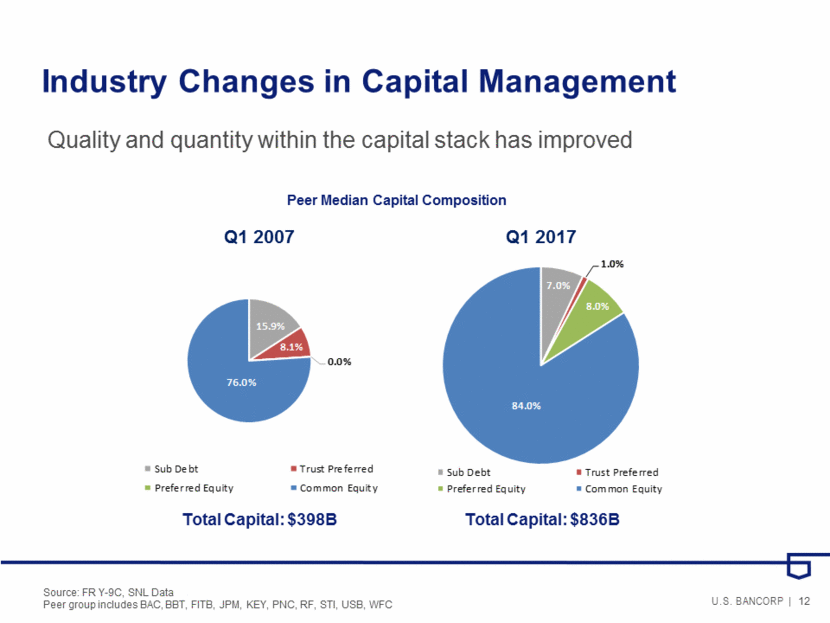
Industry Changes in Capital Management Source: FR Y-9C, SNL Data Peer group includes BAC, BBT, FITB, JPM, KEY, PNC, RF, STI, USB, WFC Quality and quantity within the capital stack has improved Peer Median Capital Composition Q1 2007 Q1 2017 Total Capital: $398B Total Capital: $836B
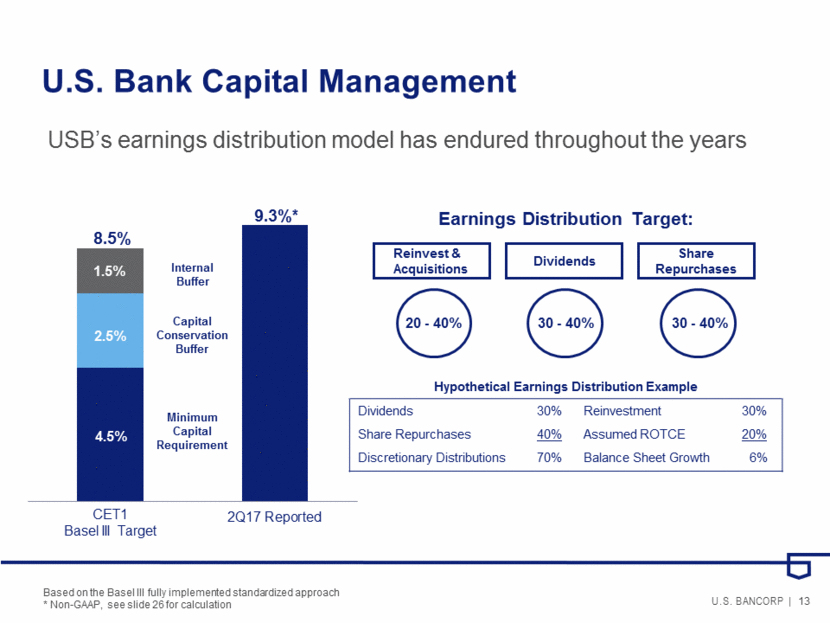
U.S. Bank Capital Management Based on the Basel III fully implemented standardized approach * Non-GAAP, see slide 26 for calculation Earnings Distribution Target: Reinvest & Acquisitions Dividends Share Repurchases 20 - 40% 30 - 40% 30 - 40% Hypothetical Earnings Distribution Example Dividends 30% Reinvestment 30% Share Repurchases 40% Assumed ROTCE 20% Discretionary Distributions 70% Balance Sheet Growth 6% USB’s earnings distribution model has endured throughout the years
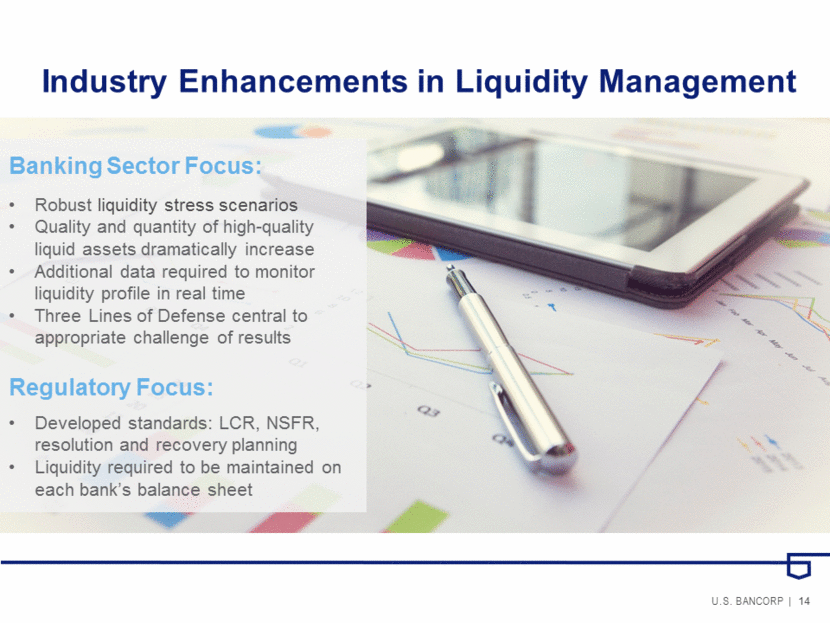
Industry Enhancements in Liquidity Management Banking Sector Focus: Robust liquidity stress scenarios Quality and quantity of high-quality liquid assets dramatically increase Additional data required to monitor liquidity profile in real time Three Lines of Defense central to appropriate challenge of results Regulatory Focus: Developed standards: LCR, NSFR, resolution and recovery planning Liquidity required to be maintained on each bank’s balance sheet
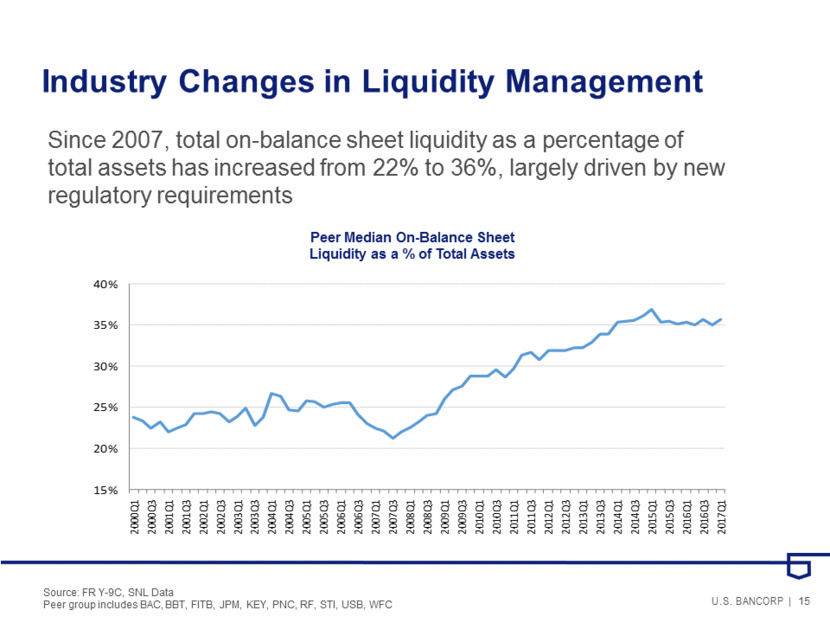
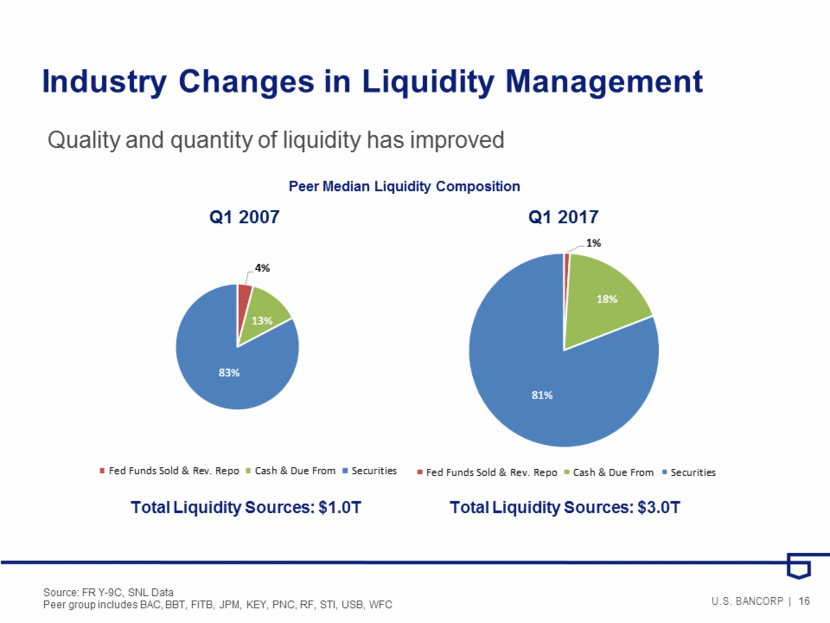
Industry Changes in Liquidity Management Source: FR Y-9C, SNL Data Peer group includes BAC, BBT, FITB, JPM, KEY, PNC, RF, STI, USB, WFC Since 2007, total on-balance sheet liquidity as a percentage of total assets has increased from 22% to 36%, largely driven by new regulatory requirements Peer Median On-Balance Sheet Liquidity as a % of Total Assets
Q1 2007 Q1 2017 Total Liquidity Sources: $1.0T Total Liquidity Sources: $3.0T Industry Changes in Liquidity Management Peer Median Liquidity Composition Quality and quantity of liquidity has improved Source: FR Y-9C, SNL Data Peer group includes BAC, BBT, FITB, JPM, KEY, PNC, RF, STI, USB, WFC
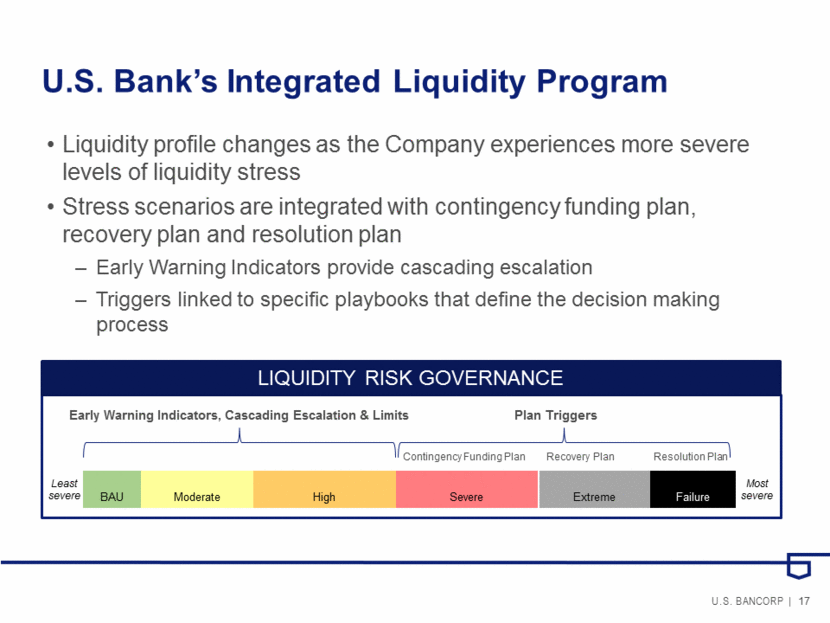
U.S. Bank’s Integrated Liquidity Program Liquidity profile changes as the Company experiences more severe levels of liquidity stress Stress scenarios are integrated with contingency funding plan, recovery plan and resolution plan Early Warning Indicators provide cascading escalation Triggers linked to specific playbooks that define the decision making process Failure Least severe Extreme High BAU Moderate Severe Most severe Contingency Funding Plan 2016 Enhancements Completed by 2Q17 Recovery Plan Resolution Plan Early Warning Indicators, Cascading Escalation & Limits Plan Triggers LIQUIDITY RISK GOVERNANCE
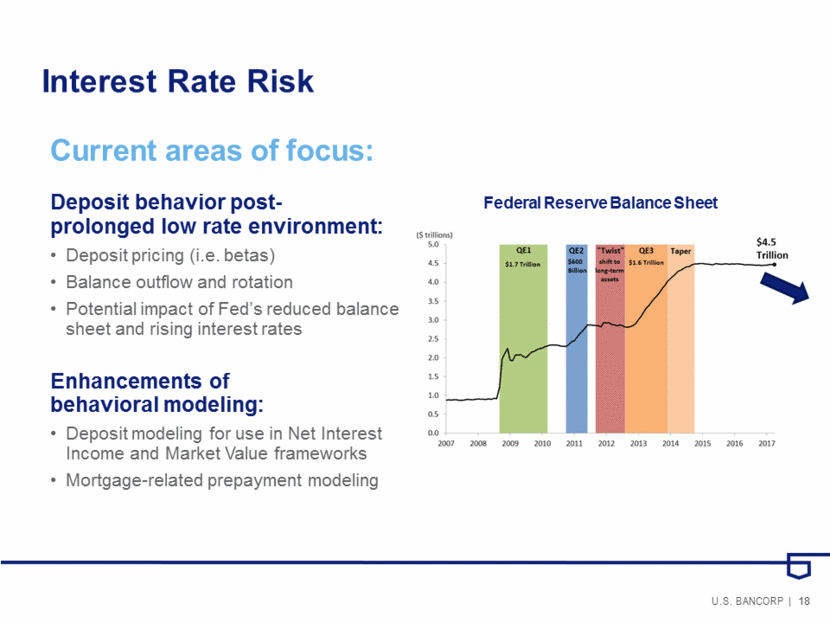
Interest Rate Risk Current areas of focus: Deposit behavior post- prolonged low rate environment: Deposit pricing (i.e. betas) Balance outflow and rotation Potential impact of Fed’s reduced balance sheet and rising interest rates Enhancements of behavioral modeling: Deposit modeling for use in Net Interest Income and Market Value frameworks Mortgage-related prepayment modeling Federal Reserve Balance Sheet
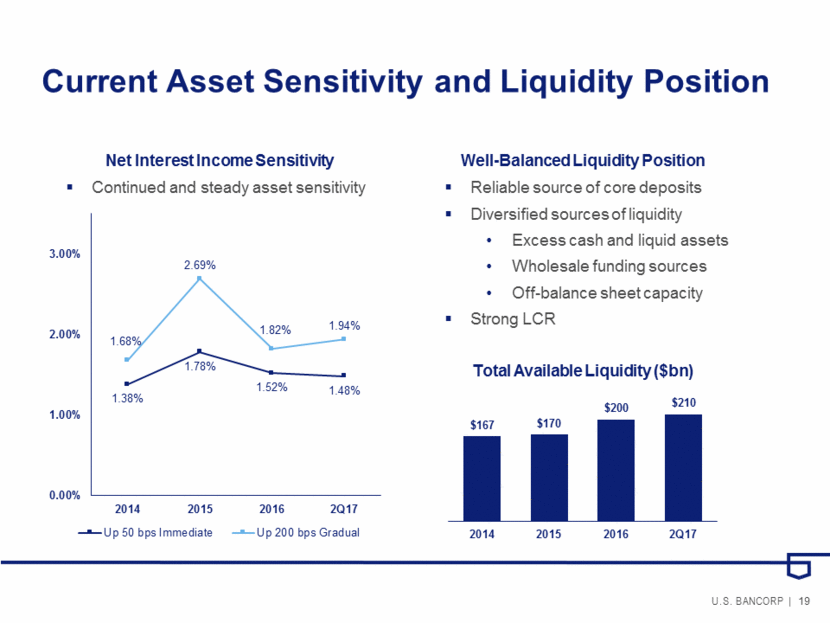
Current Asset Sensitivity and Liquidity Position Net Interest Income Sensitivity Reliable source of core deposits Diversified sources of liquidity Excess cash and liquid assets Wholesale funding sources Off-balance sheet capacity Strong LCR Total Available Liquidity ($bn) Well-Balanced Liquidity Position Continued and steady asset sensitivity 1.38% 1.78% 1.52% 1.48% 1.68% 2.69% 1.82% 1.94% 0.00% 1.00% 2.00% 3.00% 2014 2015 2016 2Q17 Up 50 bps Immediate Up 200 bps Gradual
Agenda U.S. Bank Overview Risk Management The Regulatory Environment Top Issues in the Banking Industry
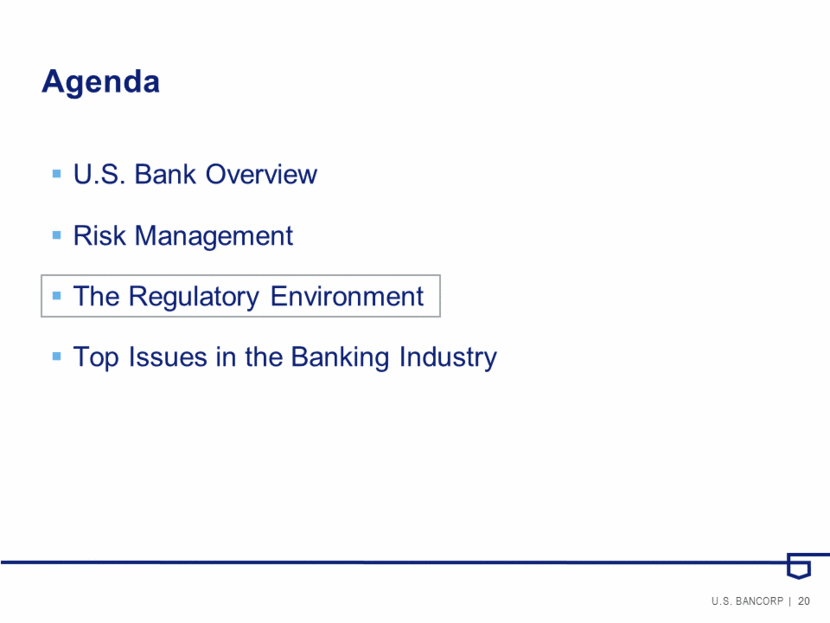
Current Regulatory Environment Current areas of focus: Current environment is complex Multiple new rules over the past decade have created new constraints Structural changes within the Fed and OCC continue to drive headlines More recently, open and productive dialogue is taking place
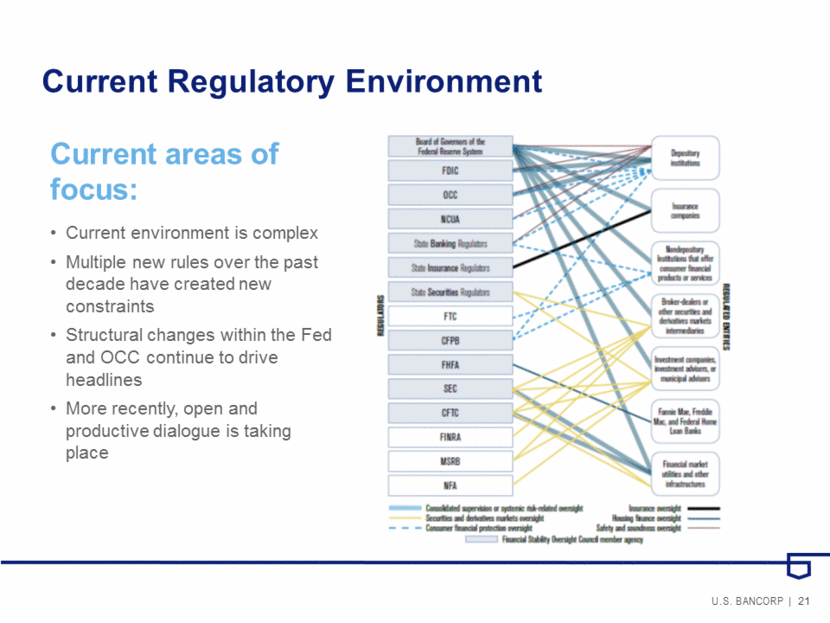
U.S. Bancorp’s Position and Optimal Size Assets G-SIBs TLAC/Bail-in debt requirements Higher capital standards Enhanced supplementary leverage ratio Higher litigation risk Limited acquisition opportunities Relative cost of compliance Sub-optimal efficiency and scale Less capacity to invest Potential trapped capital
Agenda U.S. Bank Overview Risk Management The Regulatory Environment Top Issues in the Banking Industry
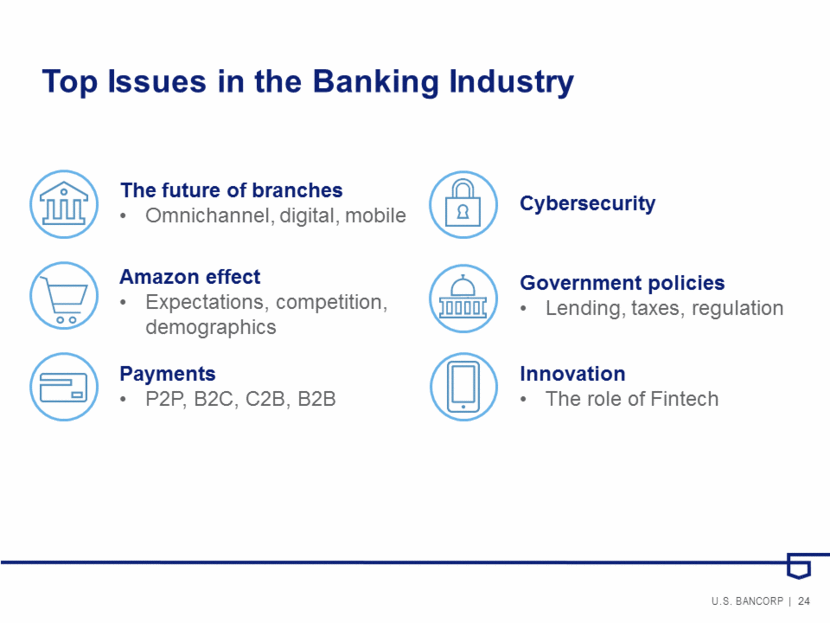
Top Issues in the Banking Industry The future of branches Omnichannel, digital, mobile Innovation The role of Fintech Payments P2P, B2C, C2B, B2B Cybersecurity Government policies Lending, taxes, regulation Amazon effect Expectations, competition, demographics
Appendix
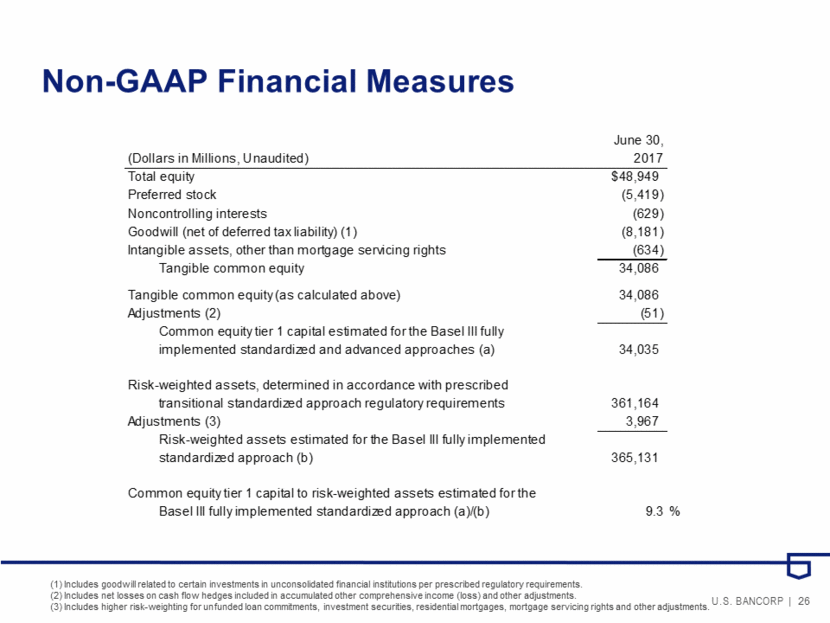
Non-GAAP Financial Measures (1) Includes goodwill related to certain investments in unconsolidated financial institutions per prescribed regulatory requirements. (2) Includes net losses on cash flow hedges included in accumulated other comprehensive income (loss) and other adjustments. (3) Includes higher risk-weighting for unfunded loan commitments, investment securities, residential mortgages, mortgage servicing rights and other adjustments. June 30, (Dollars in Millions, Unaudited) 2017 Total equity $48,949 Preferred stock (5,419) Noncontrolling interests (629) Goodwill (net of deferred tax liability) (1) (8,181) Intangible assets, other than mortgage servicing rights (634) Tangible common equity 34,086 Tangible common equity (as calculated above) 34,086 Adjustments (2) (51) Common equity tier 1 capital estimated for the Basel III fully implemented standardized and advanced approaches (a) 34,035 Risk-weighted assets, determined in accordance with prescribed transitional standardized approach regulatory requirements 361,164 Adjustments (3) 3,967 Risk-weighted assets estimated for the Basel III fully implemented standardized approach (b) 365,131 Common equity tier 1 capital to risk-weighted assets estimated for the Basel III fully implemented standardized approach (a)/(b) 9.3 %
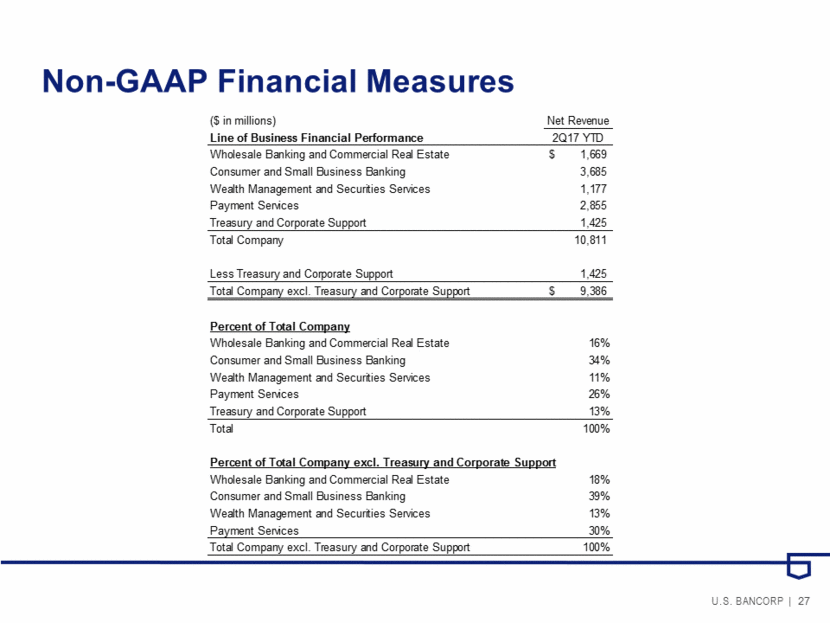
Non-GAAP Financial Measures ($ in millions) Net Revenue Line of Business Financial Performance 2Q17 YTD Wholesale Banking and Commercial Real Estate 1,669 $ Consumer and Small Business Banking 3,685 Wealth Management and Securities Services 1,177 Payment Services 2,855 Treasury and Corporate Support 1,425 Total Company 10,811 Less Treasury and Corporate Support 1,425 Total Company excl. Treasury and Corporate Support 9,386 $ Percent of Total Company Wholesale Banking and Commercial Real Estate 16% Consumer and Small Business Banking 34% Wealth Management and Securities Services 11% Payment Services 26% Treasury and Corporate Support 13% Total 100% Percent of Total Company excl. Treasury and Corporate Support Wholesale Banking and Commercial Real Estate 18% Consumer and Small Business Banking 39% Wealth Management and Securities Services 13% Payment Services 30% Total Company excl. Treasury and Corporate Support 100%
U.S. Bancorp Intellisight Investor Presentation August 22, 2017
