Attached files
| file | filename |
|---|---|
| 8-K - FORM 8-K - RPC INC | v473536_8k.htm |
Exhibit 99

RPC, Inc. (NYSE: RES) 3rd Quarter 2017 Investor Update POSITIVE TRACTION

Forward-Looking Statement Disclosure Certain statements and information included in this presentation constitute "forward-looking statements" within the meaning of the Private Securities Litigation Reform Act of 1995, including all statements that look forward in time or express management’s beliefs, expectations or hopes. In particular, such statements include, without limitation, RPC’s expectations regarding minimal capital expenditures during 2017. These statements involve known and unknown risks, uncertainties and other factors which may cause the actual results, performance or achievements of RPC to be materially different from any future results, performance or achievements expressed or implied in such forward-looking statements. Additional discussion of factors that could cause the actual results to differ materially from management's projections, forecasts, estimates and expectations is contained in RPC's Form 10-K filed with the Securities and Exchange Commission for the year ended December 31, 2016. RPC has used the non-GAAP financial measure of earnings before interest, taxes, depreciation and amortization (EBITDA) in this presentation. EBITDA should not be considered in isolation or as a substitute for operating income, net income or other performance measures prepared in accordance with GAAP. RPC uses EBITDA as a measure of operating performance because it allows us to compare performance consistently over various periods without regard to changes in our capital structure. We are also required to use EBITDA to report compliance with financial covenants under our revolving credit facility. A non-GAAP financial measure is a numerical measure of financial performance, financial position, or cash flows that either 1) excludes amounts, or is subject to adjustments that have the effect of excluding amounts, that are included in the most directly comparable measure calculated and presented in accordance with GAAP in the statement of operations, balance sheet or statement of cash flows, or 2) includes amounts, or is subject to adjustments that have the effect of including amounts, that are excluded from the most directly comparable measure so calculated and presented. Set forth in Appendix A is a reconciliation of EBITDA with Net Income, the most comparable GAAP measure. This reconciliation also appears on RPC's investor website, which can be found on the Internet at www.rpc.net. 2
Corporate Profile NYSE: RES. Publicly-traded since 1984 Recent Share Price (August 11, 2017) $ 19.70 Market Capitalization $4.4 Billion Average Daily Volume (YTD) 1,924,000 Large Insider Ownership • Provider of Oilfield Completion, Workover and Rental Services • Primarily U.S., Land-Based • Conservative Capitalization, High Returns on Invested Capital 3

Why RPC? • Operational focus and Tenured Management • Proven ability to manage through the oilfield cycles and allocate capital appropriately • Strong presence in the Permian Basin • Completion-oriented businesses Together, these factors have generated superior shareholder returns RPC has Maintained Peer-Leading Balance Sheet Strength 25% 20% 15% 10% 5% 0% Average Peer Debt-to-Total Capitalization, Q2 2017 * * FRAC, PTEN, PUMP, SPN, TUSK RPC has generated positive operating cash flow for the past 15 years Operating Cash Flow ($millions) Average U.S. Domestic Rig Count $600 $500 $400 $300 $200 $100 $0 2,000 1,800 1,600 1,400 1,200 1,000 800 600 400 2001 2004 2007 2010 2013 2016 4

Return on Invested Capital * RPC Peers ** 50% 40% 30% 20% 10% 0% (10%) 2001 2002 2003 2004 2005 2006 2007 2008 2009 2010 2011 2012 2013 2014 2015 2016 * Calculated using cash flow from operations and average invested capital ** BAS, SPN, 2006; BAS, SPN, KEG 2007; BAS, KEG, SPN, CJES, 2008 – 2015. TUSK, FRAC, 2015 -2016. PTEN, SPN, KEG, BAS, 2016. 5
Second Quarter 2017 Financial Highlights Key Financial Results ($ millions) Revenues: $ 398.8 Operating Profit: $ 67.0 Net Income: $ 43.8 EBITDA: $ 110.3 Profitable for the second consecutive quarter since Q1 2015 Q2 2017 Compared to Q1 2017 Revenues increased by 33.8%. EBITDA incrementals of 63.4%. Operating Income incrementals of 65.0%. Sequential improvement led by Pressure Pumping. Balance Sheet Highlights • Debt-Free for all of 2016 and 2017. $126 million in cash. 6

Responsible Stewardship of Cash RPC Summarized Cash Flow 2006 – Q2 2017 ($ 000’s) $0 $500 $1000 $1500 $2000 $2500 $3000 Beginning Cash Operating Cash Flow Other Financing Net Capex Dividends Paid Net Repurchase of Stock Ending Cash Between the Beginning of 2006 and the end of Q3 2015, RPC borrowed as much as $225 million. RPC has repaid that entire amount, returned approximately $660 million to shareholders in the form of dividends and share repurchases, and at the end of Q2 2017 had $126 million in cash on the balance sheet. 7
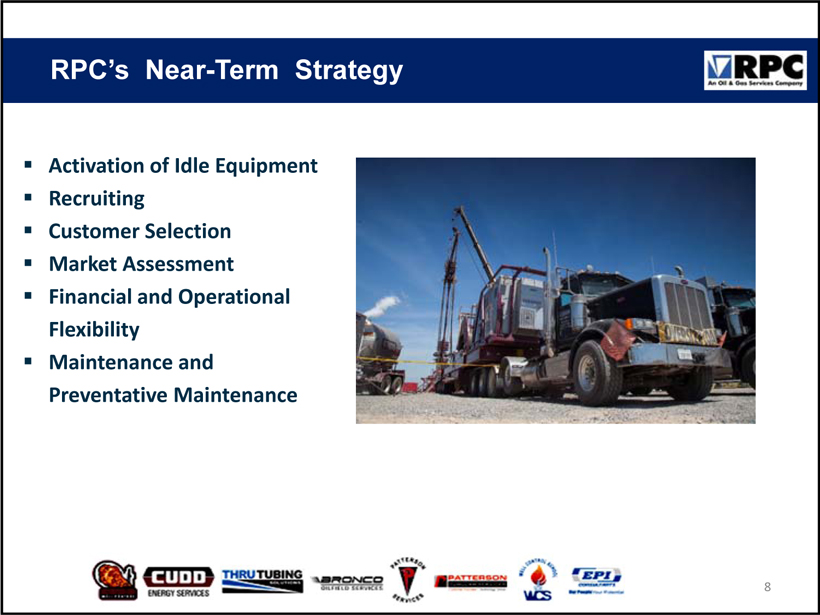
RPC’s Near-Term Strategy Activation of Idle Equipment Recruiting Customer Selection Market Assessment Financial and Operational Flexibility Maintenance and Preventative Maintenance 8

Top Service Lines Service Line Revenue as a Percentage of Consolidated Revenues Three Months Ended June 30, 2017 Pressure Pumping Thru Tubing Solutions (Downhole Tools) Coiled Tubing Rental Tools Nitrogen Snubbing Other 63.6% 18.0% 6.5% 6.3% 1.7% 10.6% 2.3% 9

Pressure Pumping Well-maintained, high quality fleet concentrated in service-intensive oilfield basins Fleet assessment process has efficiently refined maintenance procedures Demonstrated ability to operate efficiently and effectively positioned to benefit from increasing activity levels 10
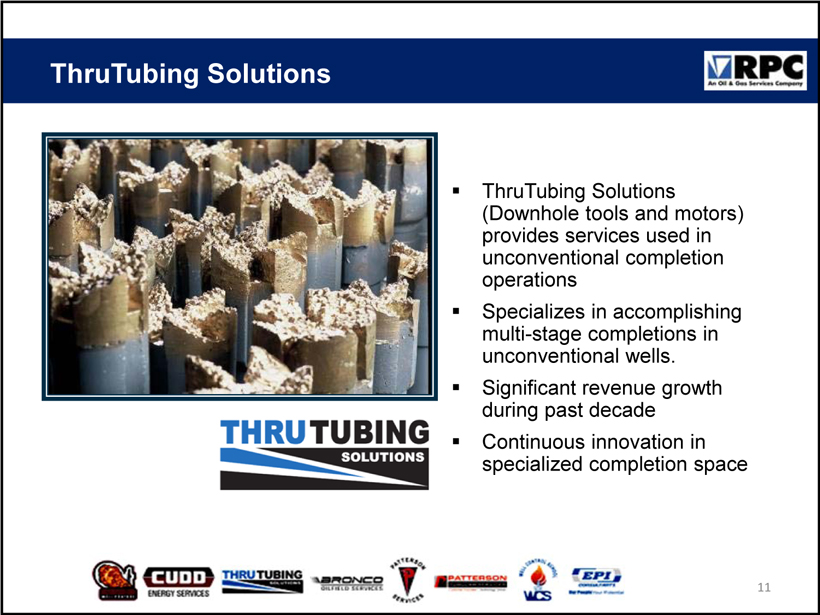
ThruTubing Solutions ThruTubing Solutions (Downhole tools and motors) provides services used in unconventional completion operations Specializes in accomplishing multi-stage completions in unconventional wells. Significant revenue growth during past decade Continuous innovation in specialized completion space 11
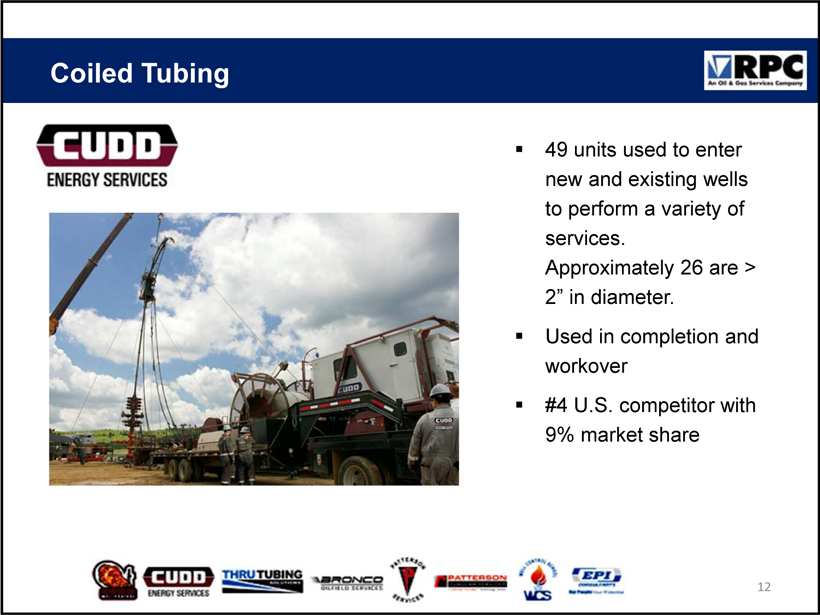
Coiled Tubing 49 units used to enter new and existing wells to perform a variety of services. Approximately 26 are > 2” in diameter. Used in completion and workover #4 U.S. competitor with 9% market share 12

Patterson Rental Tools Rents a variety of tools and products required during drilling or re-entering a well 1.6% of Q2 2017 revenues 2% market share Currently Leveraged to Liquids- and Oil-Related Plays in Bakken and Eagle Ford with recent entrance into Permian Basin 13
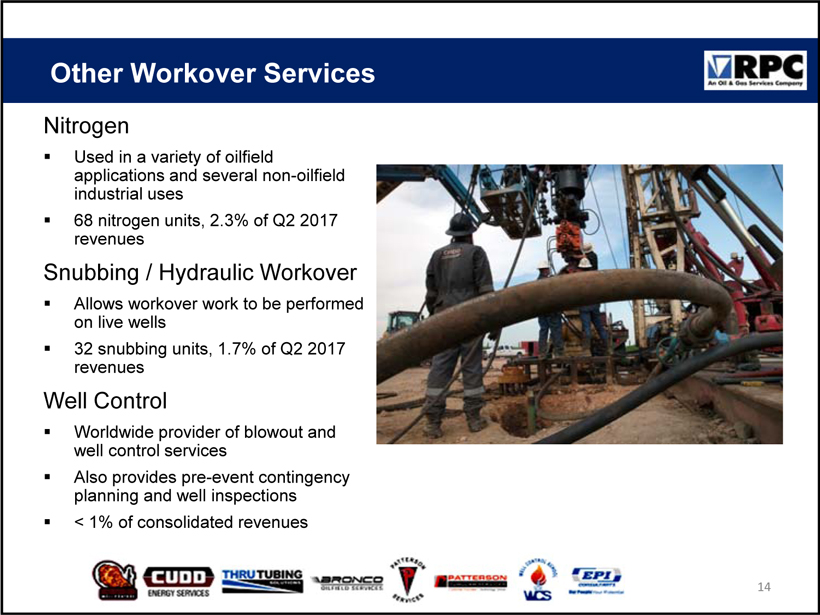
Other Workover Services Nitrogen Used in a variety of oilfield applications and several non-oilfield industrial uses 68 nitrogen units, 2.3% of Q2 2017 revenues Snubbing / Hydraulic Workover Allows workover work to be performed on live wells 32 snubbing units, 1.7% of Q2 2017 revenues Well Control Worldwide provider of blowout and well control services Also provides pre-event contingency planning and well inspections < 1% of consolidated revenues 14

Contact Us Operational Headquarters: The Woodlands, Texas (above) Corporate Headquarters: 2801 Buford Highway NE, Suite 520 Atlanta, GA 30329 (404) 321-2140 irdept@rpc.net www.rpc.net 15
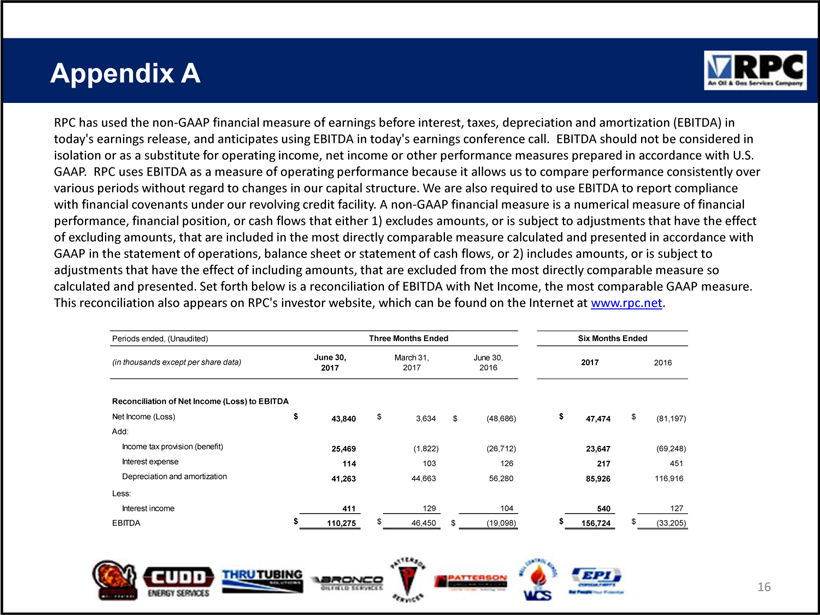
Appendix A RPC has used the non-GAAP financial measure of earnings before interest, taxes, depreciation and amortization (EBITDA) in today's earnings release, and anticipates using EBITDA in today's earnings conference call. EBITDA should not be considered in isolation or as a substitute for operating income, net income or other performance measures prepared in accordance with U.S. GAAP. RPC uses EBITDA as a measure of operating performance because it allows us to compare performance consistently over various periods without regard to changes in our capital structure. We are also required to use EBITDA to report compliance with financial covenants under our revolving credit facility. A non-GAAP financial measure is a numerical measure of financial performance, financial position, or cash flows that either 1) excludes amounts, or is subject to adjustments that have the effect of excluding amounts, that are included in the most directly comparable measure calculated and presented in accordance with GAAP in the statement of operations, balance sheet or statement of cash flows, or 2) includes amounts, or is subject to adjustments that have the effect of including amounts, that are excluded from the most directly comparable measure so calculated and presented. Set forth below is a reconciliation of EBITDA with Net Income, the most comparable GAAP measure. This reconciliation also appears on RPC's investor website, which can be found on the Internet at www.rpc.net. Periods ended, (Unaudited) Three Months Ended Six Months Ended June 30, March 31, June 30, (in thousands except per share data) 2017 2017 2016 2017 2016 Reconciliation of Net Income (Loss) to EBITDA Net Income (Loss) $ 43,840 $ 3,634 $ (48,686) $ 47,474 $ (81,197) Add: Income tax provision (benefit) 25,469 (1,822) (26,712) 23,647 (69,248)\ Interest expense 114 103 126 217 451 Depreciation and amortization 41,263 44,663 56,280 85,926 116,916 Less: Interest income 411 129 104 540 127 EBITDA $ 110,275 $ 46,450 $ (19,098) $ 156,724 $ (33,205) 16