Attached files
| file | filename |
|---|---|
| 8-K - 8-K - ROGERS CORP | form8k.htm |
Exhibit 99.1

1 InvestorPresentation 2017

WelcomeJack Monti, CFADirector, Investor Relations
Forward-looking statements 3 Safe Harbor StatementThis presentation contains forward-looking statements, which may concern our plans, objectives, outlook, goals, strategies, future events, future net sales or performance, capital expenditures, financing needs, future restructuring, plans or intentions relating to expansions, business trends and other information that is not historical information. All forward-looking statements are based upon information available to us on the date of this release and are subject to risks, uncertainties and other factors, many of which are outside of our control, which could cause actual results to differ materially from the results discussed in the forward-looking statements. Risks that could cause such results to differ include: failure to capitalize on, and volatility within, the Company's growth drivers, including internet connectivity, clean energy, and safety and protection, as well as specific market and industry trends within these growth drivers; business, economic and political conditions in the United States and abroad, particularly in China, South Korea, Germany, Hungary and Belgium, where we maintain significant manufacturing, sales or administrative operations; fluctuations in foreign currency exchange rates; research and development efforts; competitive developments; business development transactions and related integration considerations; the outcome of ongoing and future litigation, including our asbestos-related product liability litigation; and changes in laws and regulations applicable to our business. For additional information about the risks, uncertainties and other factors that may affect our business, please see our most recent annual report on Form 10-K and subsequent quarterly reports on Form 10-Q filed with the Securities and Exchange Commission. Rogers Corporation assumes no responsibility to update any forward-looking statements contained herein except as required by law. ProjectionsToday’s presentation includes information related to projected industry conditions and forecasts obtained from internal industry research, publicly available information, and external surveys and market research. The publicly available information and external surveys and market research have been obtained from sources we believe to be reliable, but we cannot assure the accuracy and completeness of this information. We have not independently verified any of the data from third-party sources, and we have not ascertained the underlying economic assumptions relied upon within those sources. Similarly, our internal research and forecasts are based upon our management’s understanding of industry conditions, and such information has not been verified by independent sources. Forward-looking information obtained from these sources is subject to the same qualification and the additional uncertainties regarding the other forward-looking statements in this presentation.Today's presentation is not an offer to sell or a solicitation of an offer to buy any of our securities.

Agenda 4 Executive overviewBruce HoechnerPresident and Chief Executive Officer, Principal Executive Officer Technology and innovation leadershipBob DaigleSenior Vice President and Chief Technology Officer Advanced Connectivity Solutions overviewJeff GrudzienSenior Vice President and General Manager, Advanced Connectivity Solutions Power Electronics Solutions overviewHelen ZhangSenior Vice President and General Manager, Power Electronics Solutions Elastomeric Material Solutions overviewChris ShaddaySenior Vice President and General Manager, Elastomeric Material Solutions Financial overviewJanice StippSenior Vice President and Chief Financial Officer, Principal Financial Executive
Executive overviewBruce HoechnerPresident and Chief Executive Officer, Principal Executive Officer
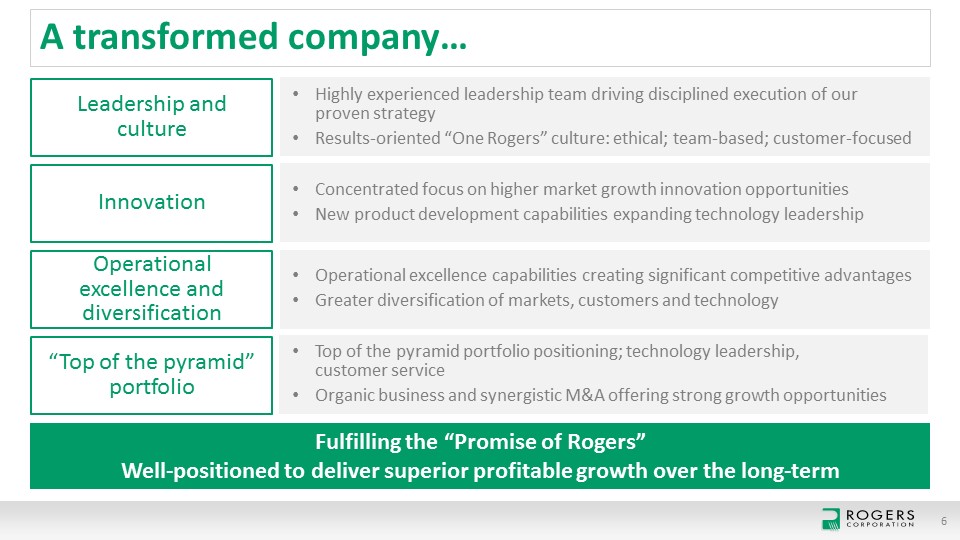
A transformed company… 6 Fulfilling the “Promise of Rogers”Well-positioned to deliver superior profitable growth over the long-term Highly experienced leadership team driving disciplined execution of our proven strategyResults-oriented “One Rogers” culture: ethical; team-based; customer-focused Innovation Operational excellence and diversification “Top of the pyramid” portfolio Leadership and culture Concentrated focus on higher market growth innovation opportunitiesNew product development capabilities expanding technology leadership Operational excellence capabilities creating significant competitive advantagesGreater diversification of markets, customers and technology Top of the pyramid portfolio positioning; technology leadership, customer serviceOrganic business and synergistic M&A offering strong growth opportunities
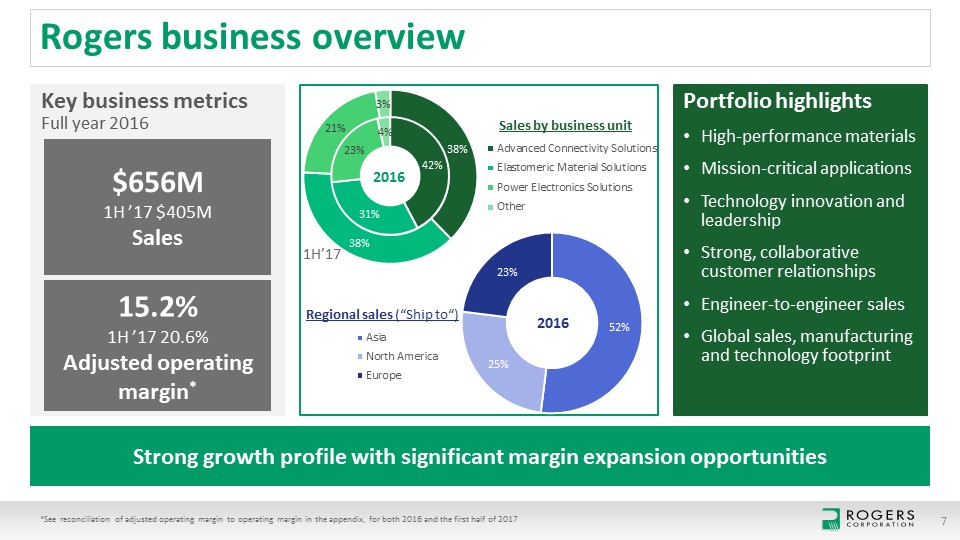
Rogers business overview *See reconciliation of adjusted operating margin to operating margin in the appendix, for both 2016 and the first half of 2017 7 Portfolio highlightsHigh-performance materialsMission-critical applicationsTechnology innovation and leadershipStrong, collaborative customer relationshipsEngineer-to-engineer salesGlobal sales, manufacturing and technology footprint Key business metricsFull year 2016 $656M1H ’17 $405MSales 15.2%1H ’17 20.6%Adjusted operating margin* Strong growth profile with significant margin expansion opportunities 2016 Sales by business unit 2016 1H’17 Regional sales (“Ship to“)
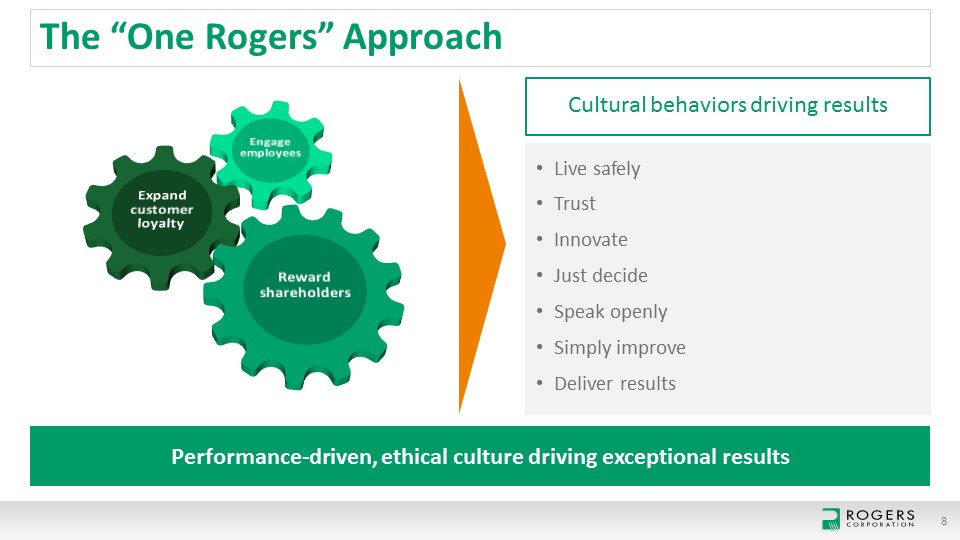
The “One Rogers” Approach 8 Performance-driven, ethical culture driving exceptional results Live safelyTrustInnovateJust decideSpeak openlySimply improveDeliver results Cultural behaviors driving results Reward shareholders Expandcustomerloyalty Engageemployees
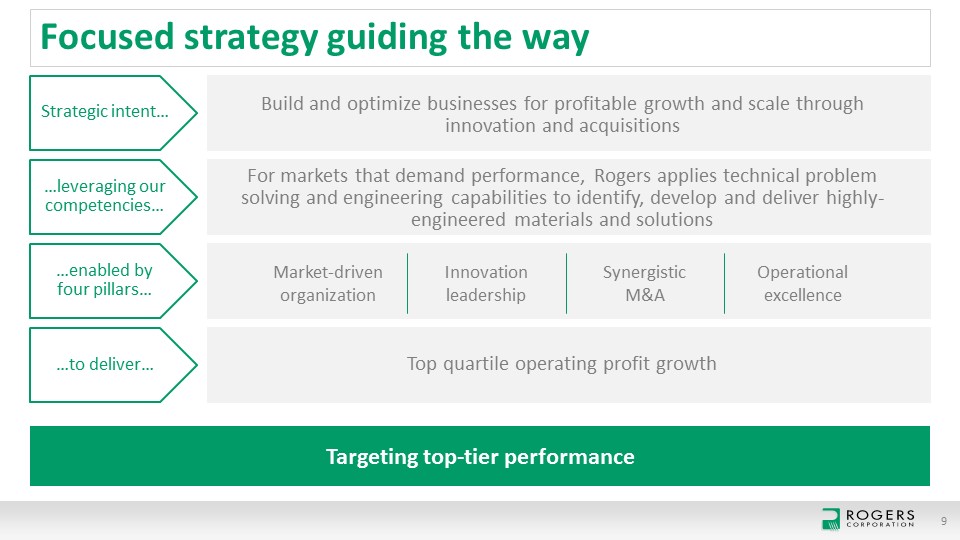
Focused strategy guiding the way 9 Targeting top-tier performance Strategic intent… Build and optimize businesses for profitable growth and scale through innovation and acquisitions …leveraging our competencies… For markets that demand performance, Rogers applies technical problem solving and engineering capabilities to identify, develop and deliver highly-engineered materials and solutions …enabled by four pillars… …to deliver… Top quartile operating profit growth Market-driven organization Innovation leadership Synergistic M&A Operationalexcellence
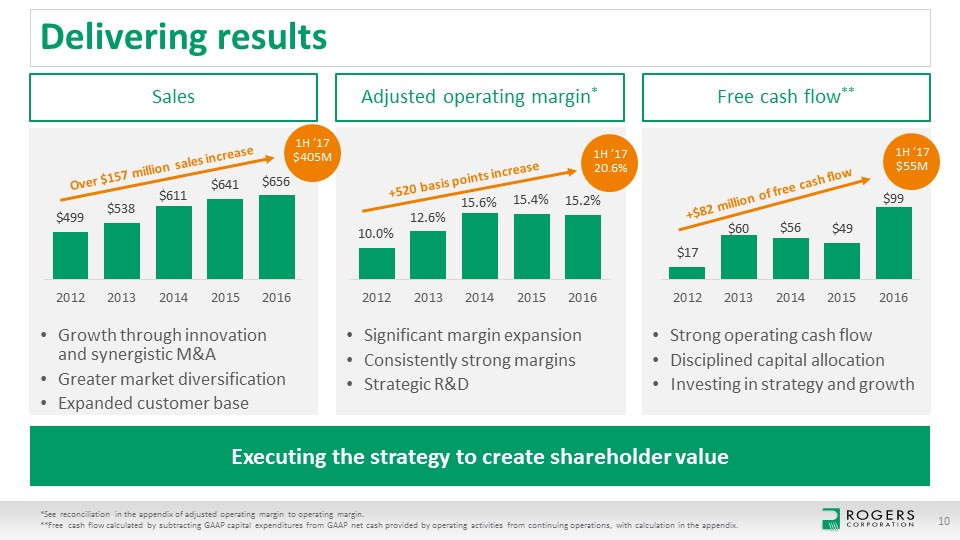
Delivering results *See reconciliation in the appendix of adjusted operating margin to operating margin. **Free cash flow calculated by subtracting GAAP capital expenditures from GAAP net cash provided by operating activities from continuing operations, with calculation in the appendix. 10 Executing the strategy to create shareholder value Sales Adjusted operating margin* Free cash flow** Growth through innovation and synergistic M&A Greater market diversification Expanded customer base Significant margin expansionConsistently strong marginsStrategic R&D Strong operating cash flowDisciplined capital allocationInvesting in strategy and growth Over $157 million sales increase +520 basis points increase 1H ’17$405M 1H ’1720.6% +$82 million of free cash flow 1H ’17$55M
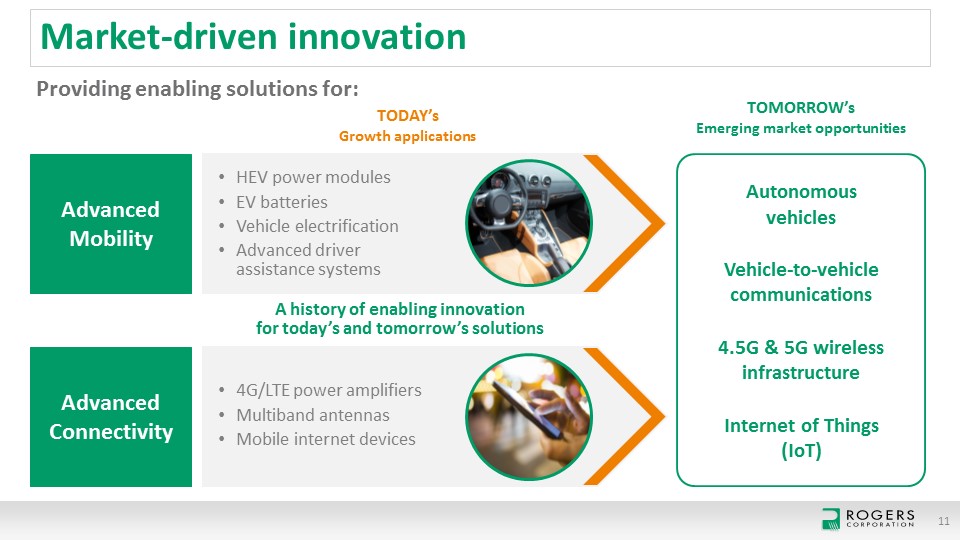
Market-driven innovation 11 Providing enabling solutions for: AutonomousvehiclesVehicle-to-vehicle communications4.5G & 5G wireless infrastructureInternet of Things(IoT) TOMORROW’sEmerging market opportunities Advanced Mobility Advanced Connectivity A history of enabling innovationfor today’s and tomorrow’s solutions TODAY’sGrowth applications HEV power modulesEV batteriesVehicle electrificationAdvanced driver assistance systems 4G/LTE power amplifiers Multiband antennasMobile internet devices
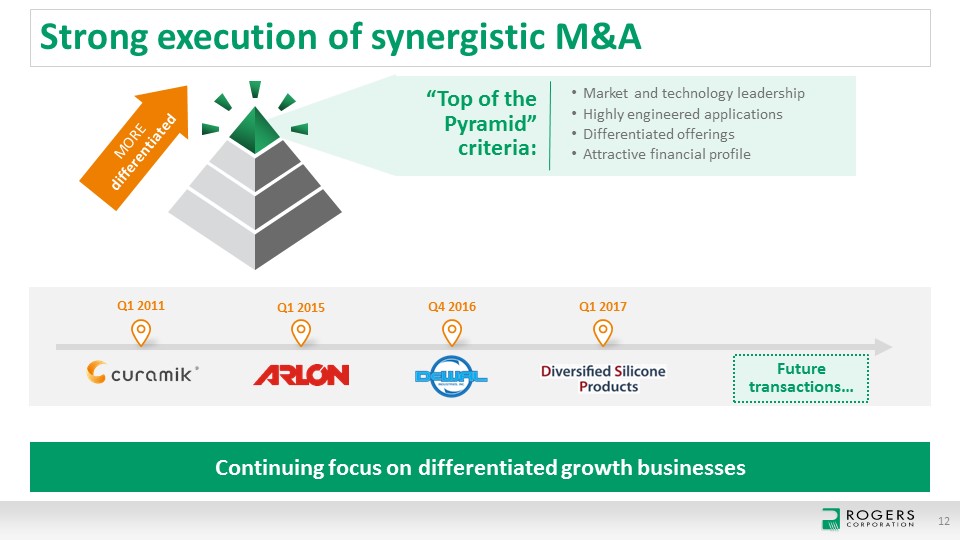
Strong execution of synergistic M&A 12 Continuing focus on differentiated growth businesses MOREdifferentiated Market and technology leadershipHighly engineered applicationsDifferentiated offeringsAttractive financial profile “Top of the Pyramid” criteria: Q1 2017 Q4 2016 Q1 2011 Future transactions… Q1 2015
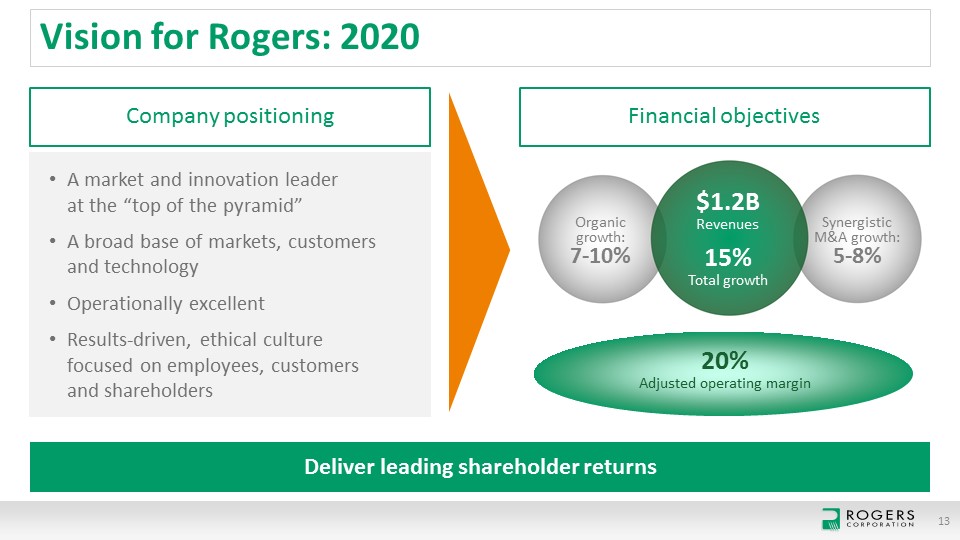
Vision for Rogers: 2020 13 Deliver leading shareholder returns A market and innovation leader at the “top of the pyramid”A broad base of markets, customers and technologyOperationally excellentResults-driven, ethical culture focused on employees, customers and shareholders Company positioning Financial objectives ~$370M Adjusted Operating Margin: 20% $1.2BRevenues 15% Total growth Synergistic M&A growth:5-8% Organic growth: 7-10% 20%Adjusted operating margin
Technology and innovation leadershipBob Daigle Senior Vice President and Chief Technology Officer
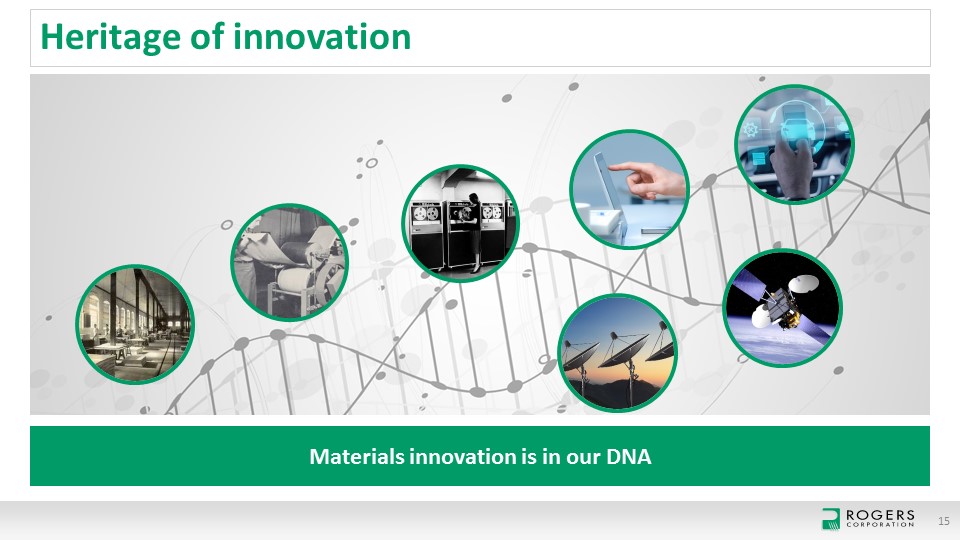
Heritage of innovation 15 Materials innovation is in our DNA
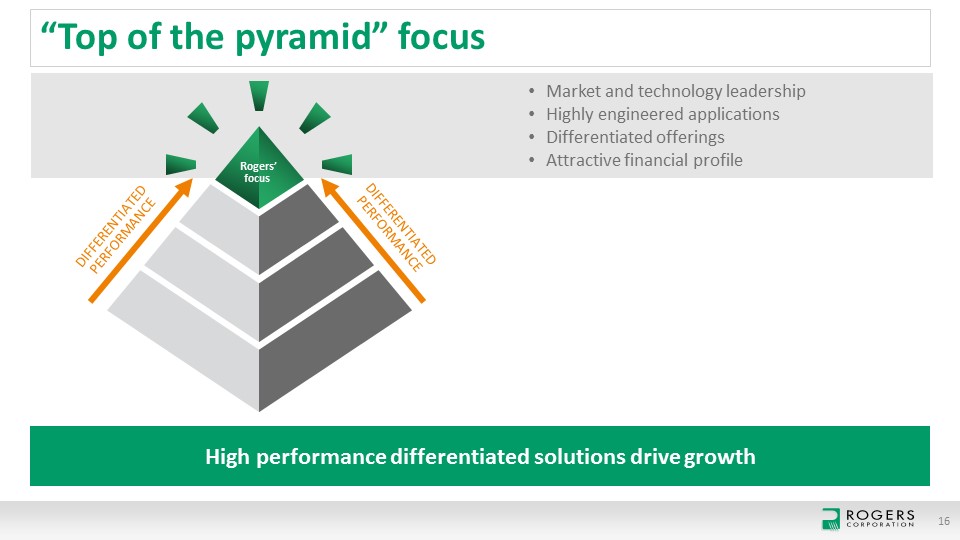
“Top of the pyramid” focus 16 High performance differentiated solutions drive growth DIFFERENTIATED PERFORMANCE DIFFERENTIATED PERFORMANCE Market and technology leadershipHighly engineered applicationsDifferentiated offeringsAttractive financial profile Rogers’focus
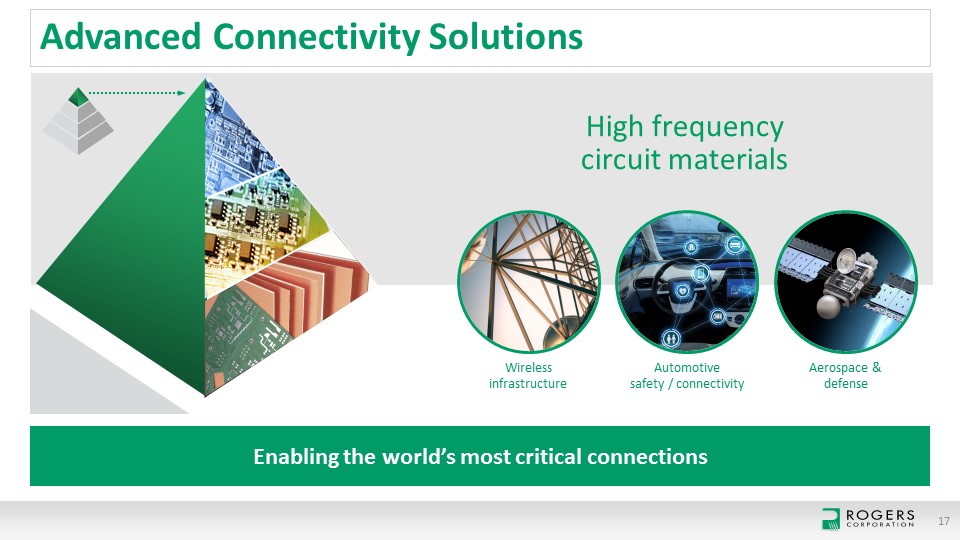
Wirelessinfrastructure Automotive safety / connectivity Aerospace & defense Advanced Connectivity Solutions 17 Enabling the world’s most critical connections High frequency circuit materials
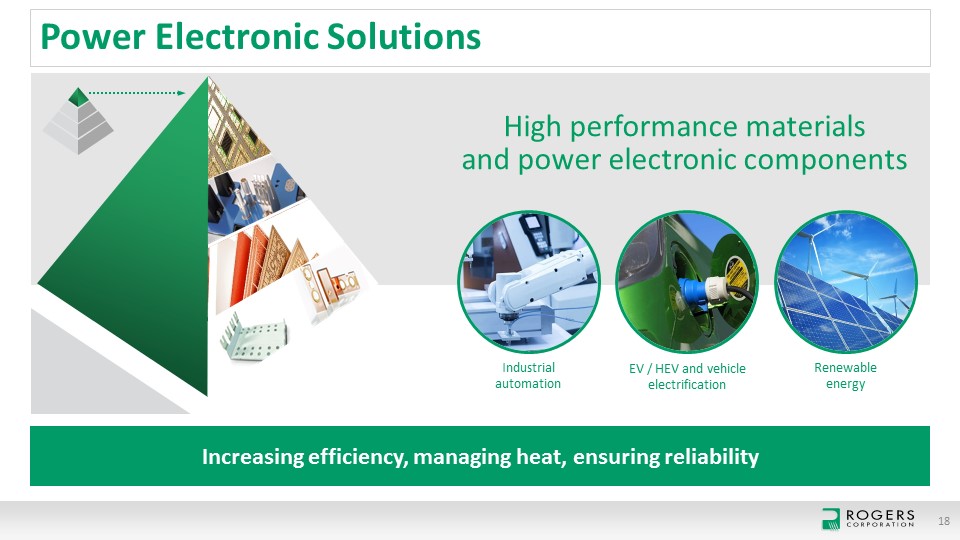
Industrial automation EV / HEV and vehicleelectrification Renewableenergy Power Electronic Solutions 18 Increasing efficiency, managing heat, ensuring reliability High performance materials and power electronic components
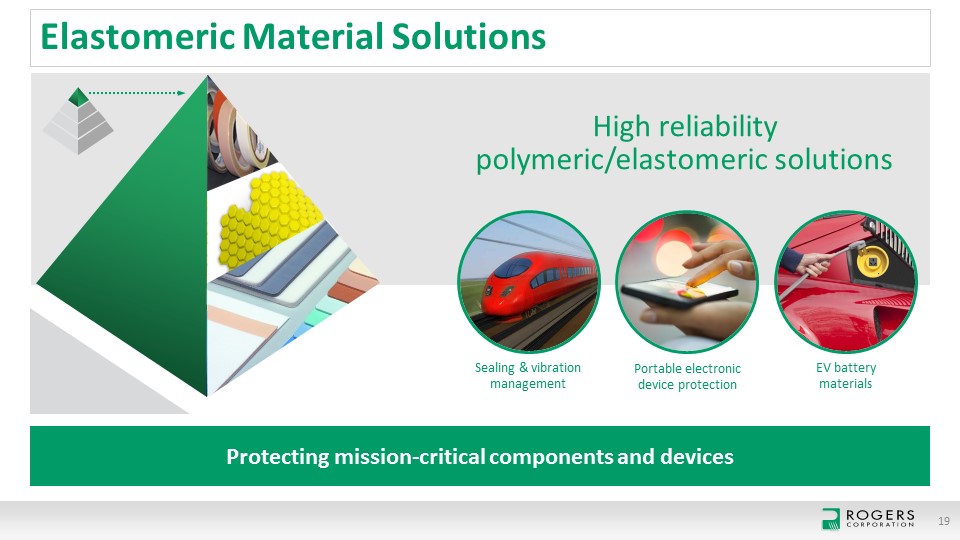
Sealing & vibration management Portable electronicdevice protection EV batterymaterials Elastomeric Material Solutions 19 Protecting mission-critical components and devices High reliability polymeric/elastomeric solutions
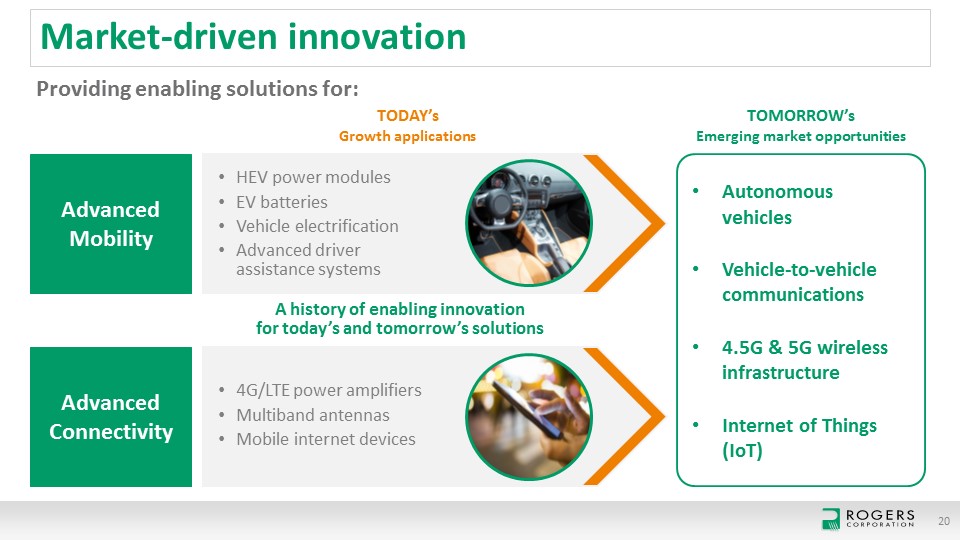
Market-driven innovation 20 Providing enabling solutions for: AutonomousvehiclesVehicle-to-vehicle communications4.5G & 5G wireless infrastructureInternet of Things(IoT) TOMORROW’sEmerging market opportunities Advanced Mobility Advanced Connectivity A history of enabling innovationfor today’s and tomorrow’s solutions TODAY’sGrowth applications HEV power modulesEV batteriesVehicle electrificationAdvanced driver assistance systems 4G/LTE power amplifiers Multiband antennasMobile internet devices
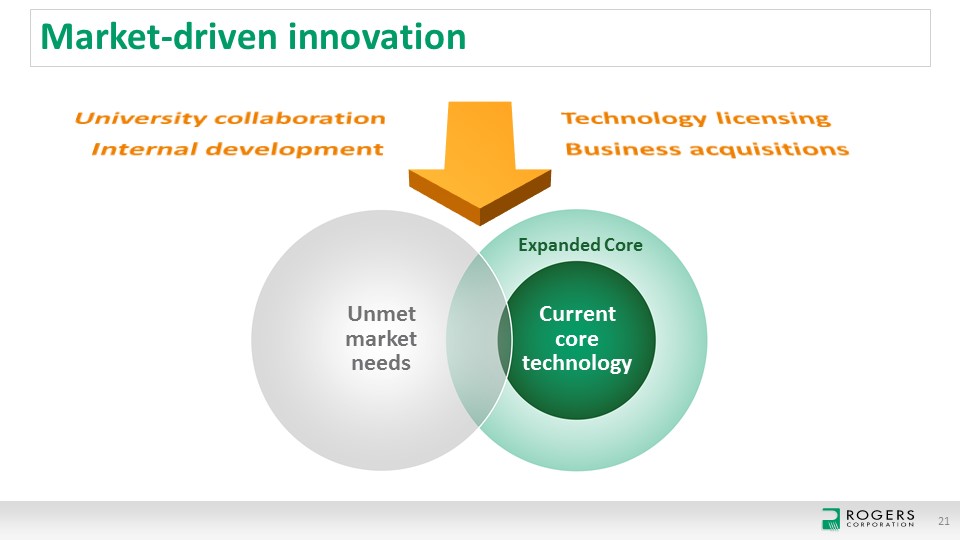
Market-driven innovation 21 Expanded Core Current coretechnology University collaboration Internal development Technology licensing Business acquisitions Unmet market needs
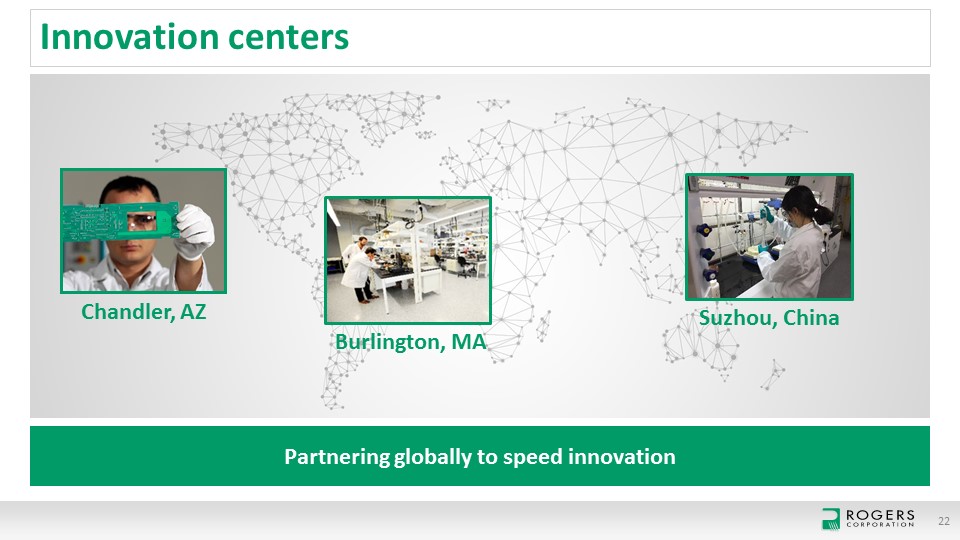
Innovation centers 22 Partnering globally to speed innovation Chandler, AZ Burlington, MA Suzhou, China
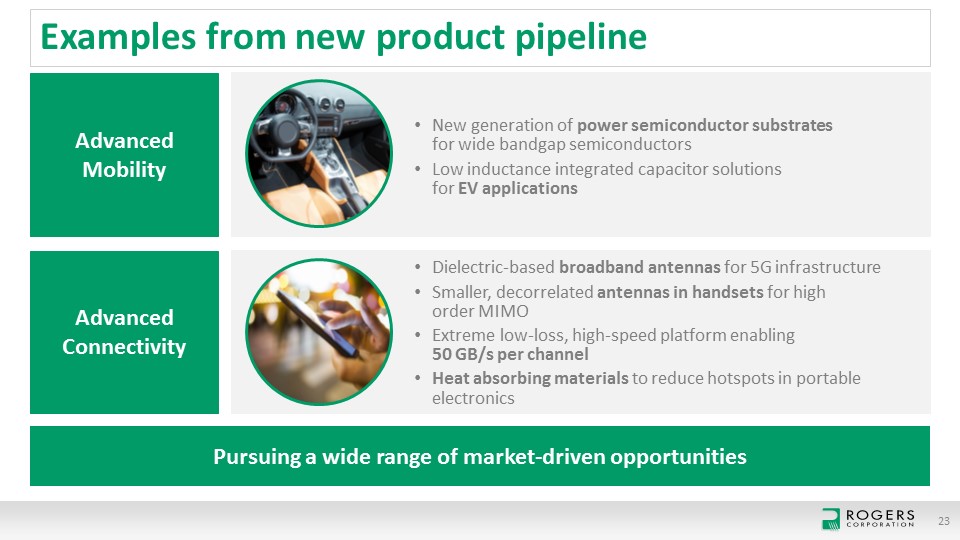
Examples from new product pipeline 23 Pursuing a wide range of market-driven opportunities Advanced Mobility Advanced Connectivity New generation of power semiconductor substrates for wide bandgap semiconductorsLow inductance integrated capacitor solutions for EV applications Dielectric-based broadband antennas for 5G infrastructureSmaller, decorrelated antennas in handsets for high order MIMOExtreme low-loss, high-speed platform enabling 50 GB/s per channelHeat absorbing materials to reduce hotspots in portable electronics
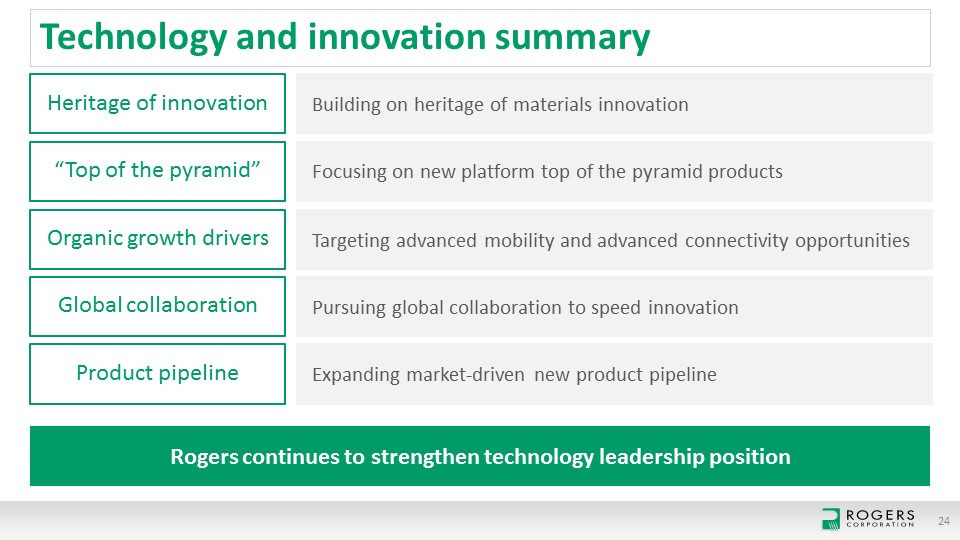
Targeting advanced mobility and advanced connectivity opportunities Technology and innovation summary 24 Heritage of innovation Building on heritage of materials innovation “Top of the pyramid” Focusing on new platform top of the pyramid products Organic growth drivers Global collaboration Pursuing global collaboration to speed innovation Product pipeline Expanding market-driven new product pipeline Rogers continues to strengthen technology leadership position
Advanced Connectivity SolutionsJeff Grudzien Senior Vice President and General Manager
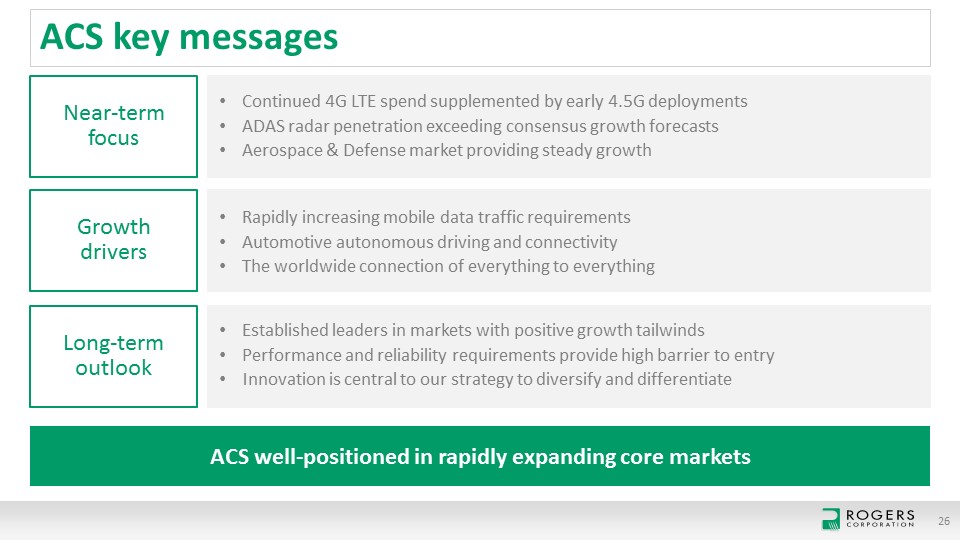
ACS key messages 26 ACS well-positioned in rapidly expanding core markets Near-term focus Continued 4G LTE spend supplemented by early 4.5G deployments ADAS radar penetration exceeding consensus growth forecastsAerospace & Defense market providing steady growth Growthdrivers Rapidly increasing mobile data traffic requirementsAutomotive autonomous driving and connectivityThe worldwide connection of everything to everything Long-term outlook Established leaders in markets with positive growth tailwindsPerformance and reliability requirements provide high barrier to entryInnovation is central to our strategy to diversify and differentiate
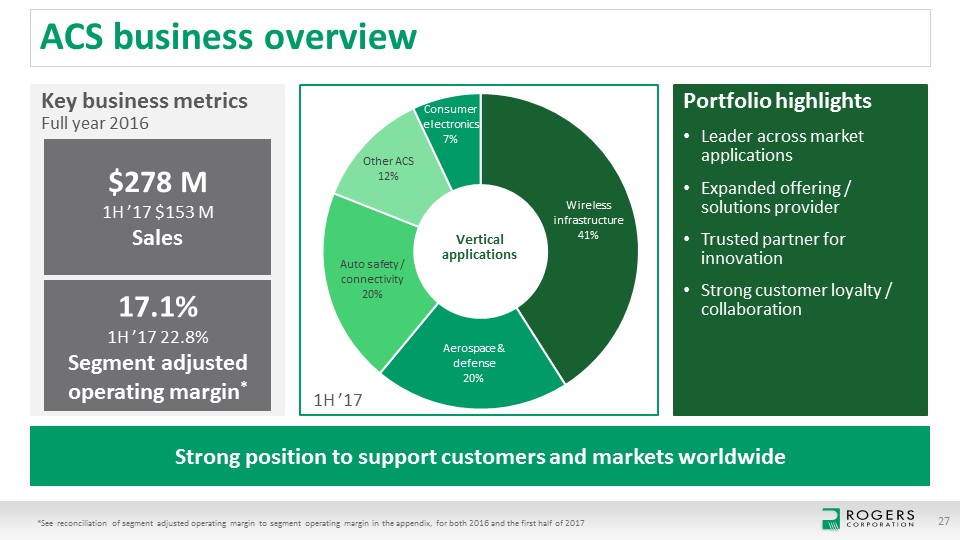
ACS business overview 27 Portfolio highlightsLeader across market applicationsExpanded offering / solutions providerTrusted partner for innovationStrong customer loyalty / collaboration Key business metricsFull year 2016 $278 M1H ’17 $153 MSales 17.1%1H ’17 22.8%Segment adjusted operating margin* Strong position to support customers and markets worldwide Vertical applications *See reconciliation of segment adjusted operating margin to segment operating margin in the appendix, for both 2016 and the first half of 2017 1H ’17
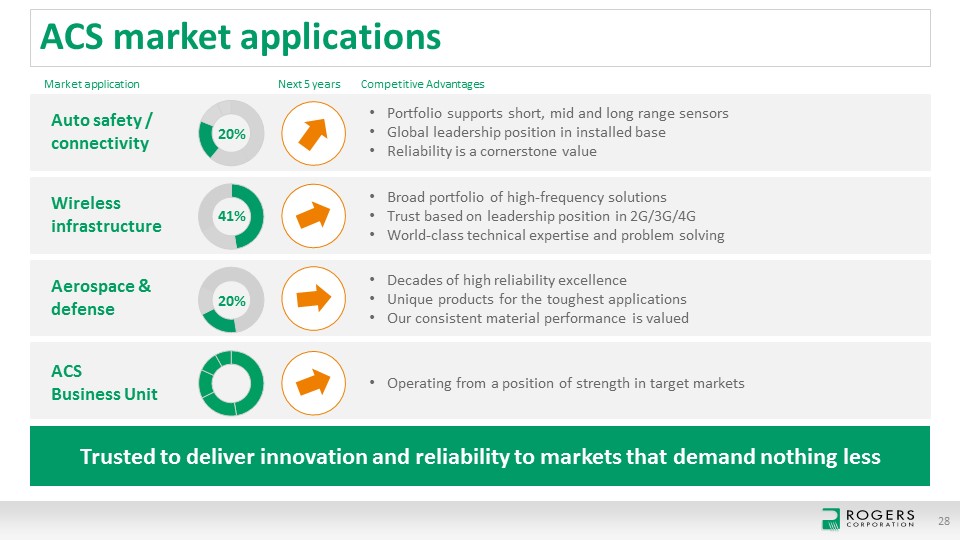
ACS market applications 28 Trusted to deliver innovation and reliability to markets that demand nothing less 20% 41% 20% ACS Business Unit Operating from a position of strength in target markets Market application Next 5 years Competitive Advantages Auto safety / connectivity Portfolio supports short, mid and long range sensorsGlobal leadership position in installed baseReliability is a cornerstone value Aerospace & defense Decades of high reliability excellenceUnique products for the toughest applicationsOur consistent material performance is valued Wireless infrastructure Broad portfolio of high-frequency solutionsTrust based on leadership position in 2G/3G/4GWorld-class technical expertise and problem solving
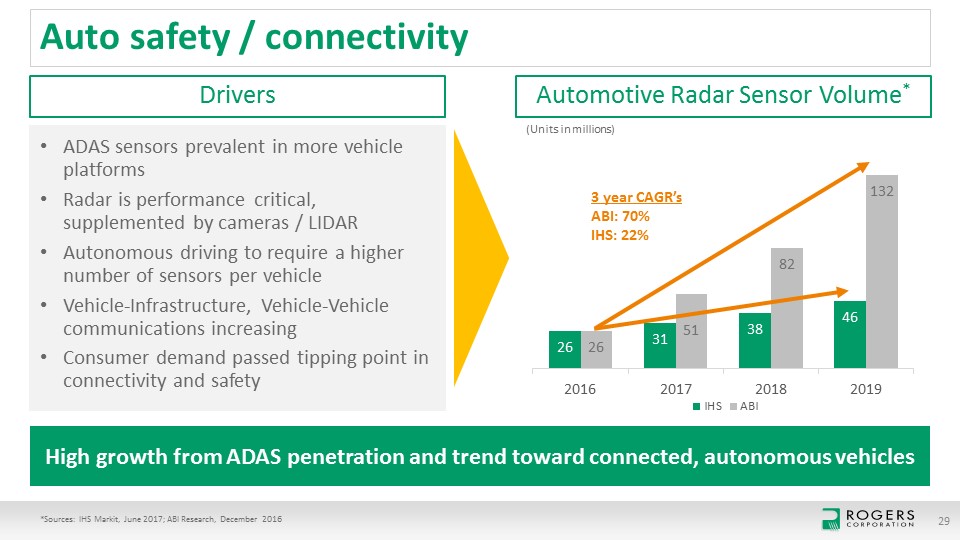
Auto safety / connectivity *Sources: IHS Markit, June 2017; ABI Research, December 2016 29 High growth from ADAS penetration and trend toward connected, autonomous vehicles ADAS sensors prevalent in more vehicle platformsRadar is performance critical, supplemented by cameras / LIDARAutonomous driving to require a higher number of sensors per vehicleVehicle-Infrastructure, Vehicle-Vehicle communications increasingConsumer demand passed tipping point in connectivity and safety Drivers Automotive Radar Sensor Volume* (Units in millions) 3 year CAGR’sABI: 70%IHS: 22%
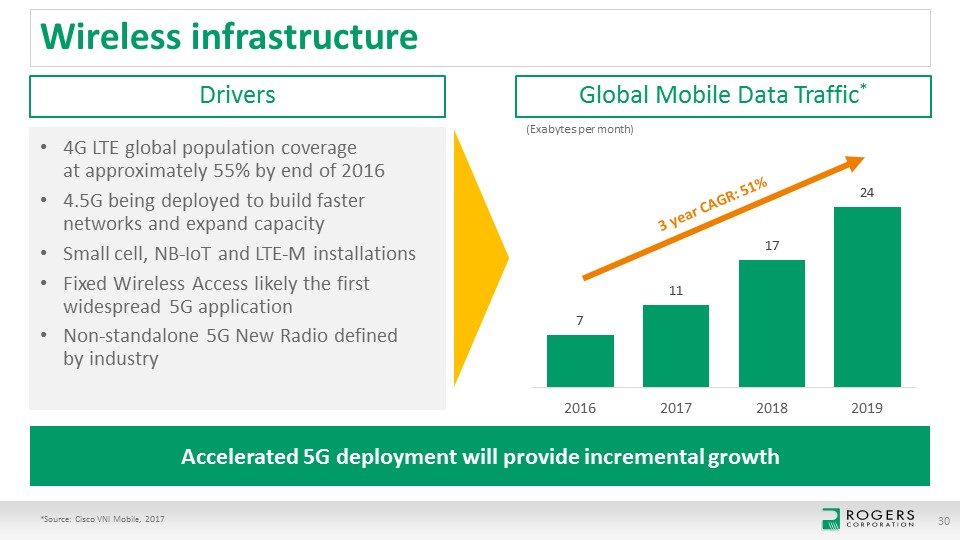
Wireless infrastructure *Source: Cisco VNI Mobile, 2017 30 Accelerated 5G deployment will provide incremental growth 4G LTE global population coverage at approximately 55% by end of 20164.5G being deployed to build faster networks and expand capacitySmall cell, NB-IoT and LTE-M installationsFixed Wireless Access likely the first widespread 5G applicationNon-standalone 5G New Radio defined by industry Drivers Global Mobile Data Traffic* (Exabytes per month) 3 year CAGR: 51%
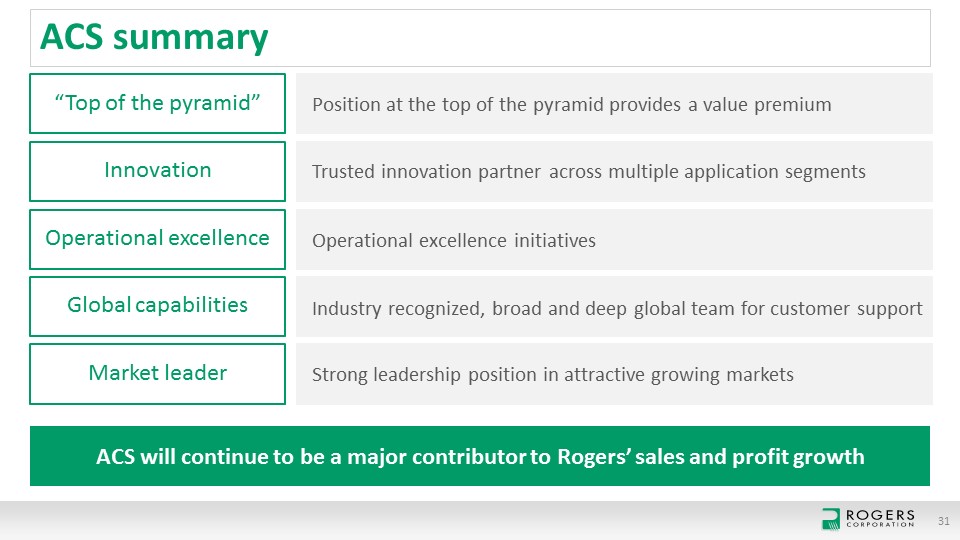
Operational excellence initiatives ACS summary 31 “Top of the pyramid” Position at the top of the pyramid provides a value premium Innovation Trusted innovation partner across multiple application segments Operational excellence Global capabilities Industry recognized, broad and deep global team for customer support Market leader Strong leadership position in attractive growing markets ACS will continue to be a major contributor to Rogers’ sales and profit growth
Power Electronics SolutionsHelen ZhangSenior Vice President and General Manager
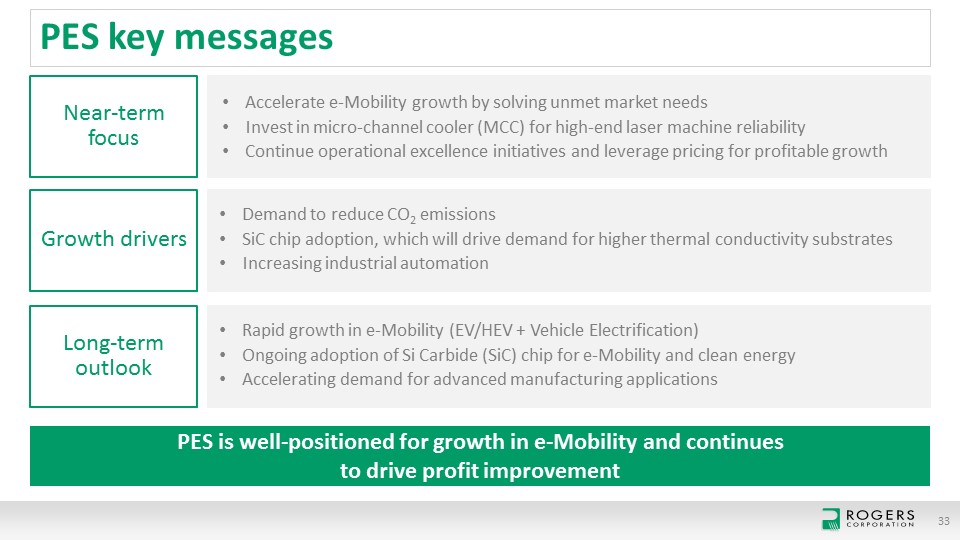
PES key messages 33 PES is well-positioned for growth in e-Mobility and continues to drive profit improvement Near-term focus Rapid growth in e-Mobility (EV/HEV + Vehicle Electrification) Ongoing adoption of Si Carbide (SiC) chip for e-Mobility and clean energy Accelerating demand for advanced manufacturing applications Growth drivers Demand to reduce CO2 emissionsSiC chip adoption, which will drive demand for higher thermal conductivity substratesIncreasing industrial automation Long-term outlook Accelerate e-Mobility growth by solving unmet market needsInvest in micro-channel cooler (MCC) for high-end laser machine reliability Continue operational excellence initiatives and leverage pricing for profitable growth
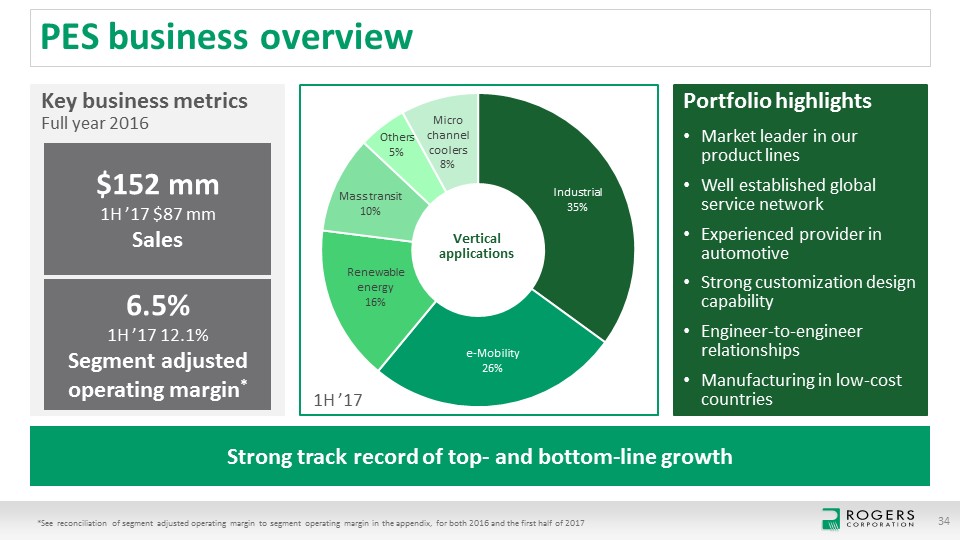
PES business overview 34 Portfolio highlightsMarket leader in our product linesWell established global service networkExperienced provider in automotiveStrong customization design capabilityEngineer-to-engineer relationshipsManufacturing in low-cost countries Key business metricsFull year 2016 $152 mm1H ’17 $87 mmSales 6.5%1H ’17 12.1%Segment adjusted operating margin* Strong track record of top- and bottom-line growth *See reconciliation of segment adjusted operating margin to segment operating margin in the appendix, for both 2016 and the first half of 2017 Vertical applications 1H ’17
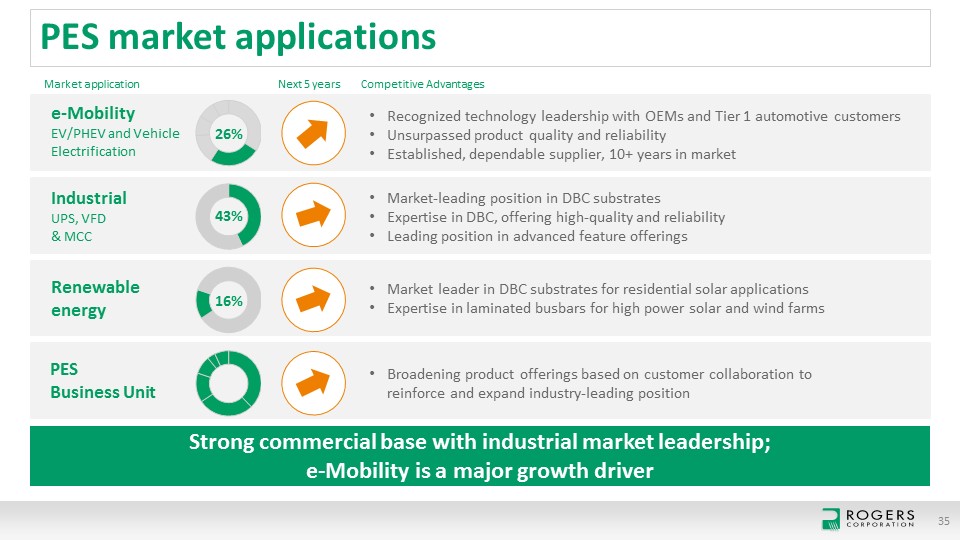
PES market applications Strong commercial base with industrial market leadership; e-Mobility is a major growth driver 26% 43% 16% e-MobilityEV/PHEV and Vehicle Electrification IndustrialUPS, VFD& MCC PES Business Unit Renewable energy Recognized technology leadership with OEMs and Tier 1 automotive customers Unsurpassed product quality and reliabilityEstablished, dependable supplier, 10+ years in market Market-leading position in DBC substrates Expertise in DBC, offering high-quality and reliabilityLeading position in advanced feature offerings Broadening product offerings based on customer collaboration to reinforce and expand industry-leading position Market leader in DBC substrates for residential solar applicationsExpertise in laminated busbars for high power solar and wind farms Market application Next 5 years Competitive Advantages 35
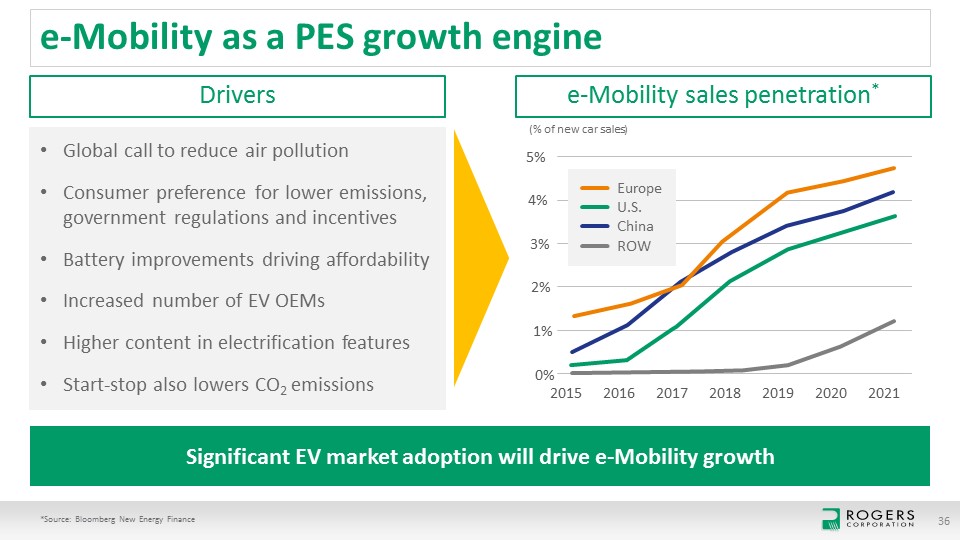
e-Mobility as a PES growth engine 36 Significant EV market adoption will drive e-Mobility growth *Source: Bloomberg New Energy Finance Global call to reduce air pollutionConsumer preference for lower emissions, government regulations and incentivesBattery improvements driving affordabilityIncreased number of EV OEMsHigher content in electrification features Start-stop also lowers CO2 emissions Drivers e-Mobility sales penetration* (% of new car sales) 5% 4% 3% 2% 1% 0% 2015 2016 2017 2018 2019 2020 2021 EuropeU.S.ChinaROW
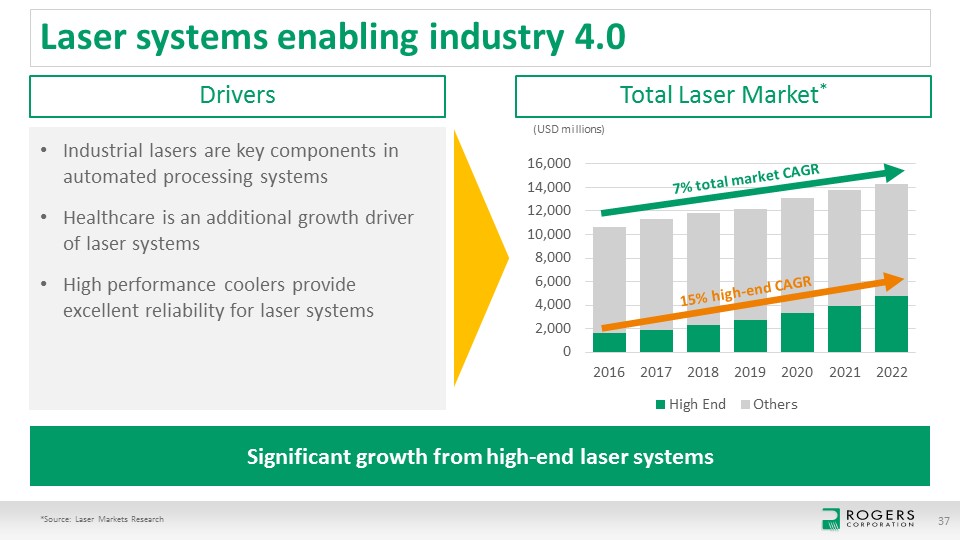
Laser systems enabling industry 4.0 *Source: Laser Markets Research 37 Significant growth from high-end laser systems Industrial lasers are key components in automated processing systemsHealthcare is an additional growth driver of laser systems High performance coolers provide excellent reliability for laser systems Drivers Total Laser Market* (USD millions) 15% high-end CAGR 7% total market CAGR
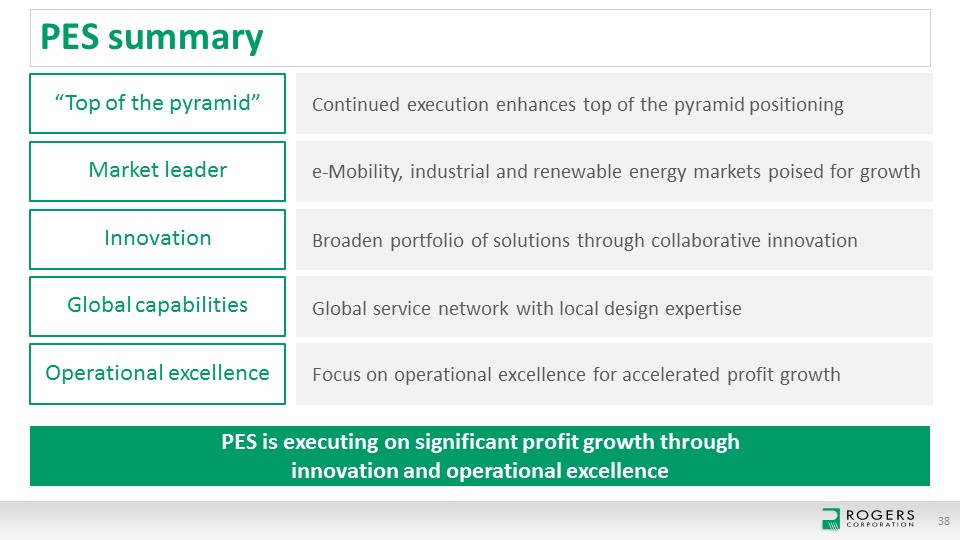
Broaden portfolio of solutions through collaborative innovation PES summary 38 Market leader e-Mobility, industrial and renewable energy markets poised for growth Innovation Global capabilities Global service network with local design expertise Operational excellence Focus on operational excellence for accelerated profit growth PES is executing on significant profit growth through innovation and operational excellence “Top of the pyramid” Continued execution enhances top of the pyramid positioning
Elastomeric Material SolutionsChris Shadday Senior Vice President and General Manager
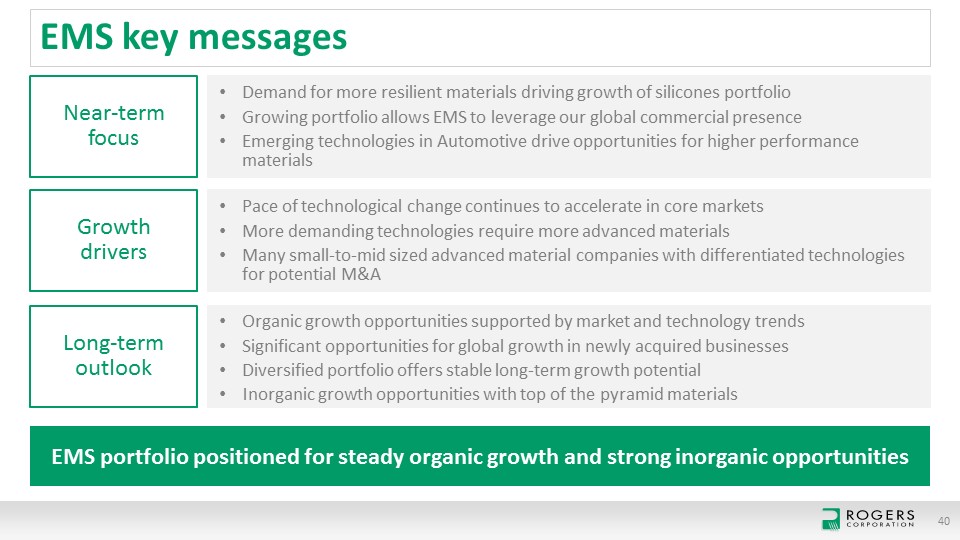
EMS key messages 40 EMS portfolio positioned for steady organic growth and strong inorganic opportunities Near-term focus Organic growth opportunities supported by market and technology trendsSignificant opportunities for global growth in newly acquired businessesDiversified portfolio offers stable long-term growth potentialInorganic growth opportunities with top of the pyramid materials Growthdrivers Pace of technological change continues to accelerate in core marketsMore demanding technologies require more advanced materialsMany small-to-mid sized advanced material companies with differentiated technologies for potential M&A Long-term outlook Demand for more resilient materials driving growth of silicones portfolioGrowing portfolio allows EMS to leverage our global commercial presenceEmerging technologies in Automotive drive opportunities for higher performance materials
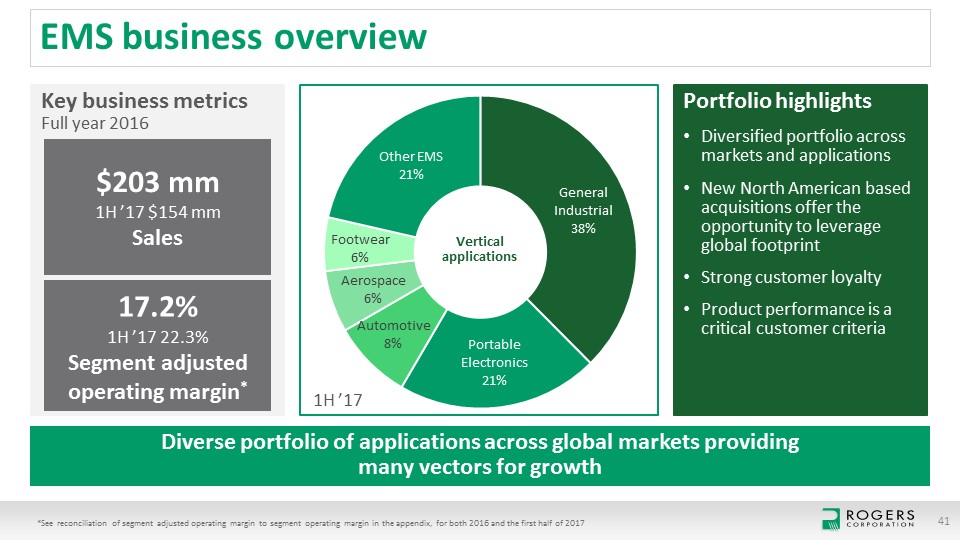
EMS business overview 41 Portfolio highlightsDiversified portfolio across markets and applicationsNew North American based acquisitions offer the opportunity to leverage global footprintStrong customer loyaltyProduct performance is a critical customer criteria Diverse portfolio of applications across global markets providing many vectors for growth Key business metricsFull year 2016 $203 mm1H ’17 $154 mmSales 17.2%1H ’17 22.3%Segment adjusted operating margin* Vertical applications *See reconciliation of segment adjusted operating margin to segment operating margin in the appendix, for both 2016 and the first half of 2017 1H ’17
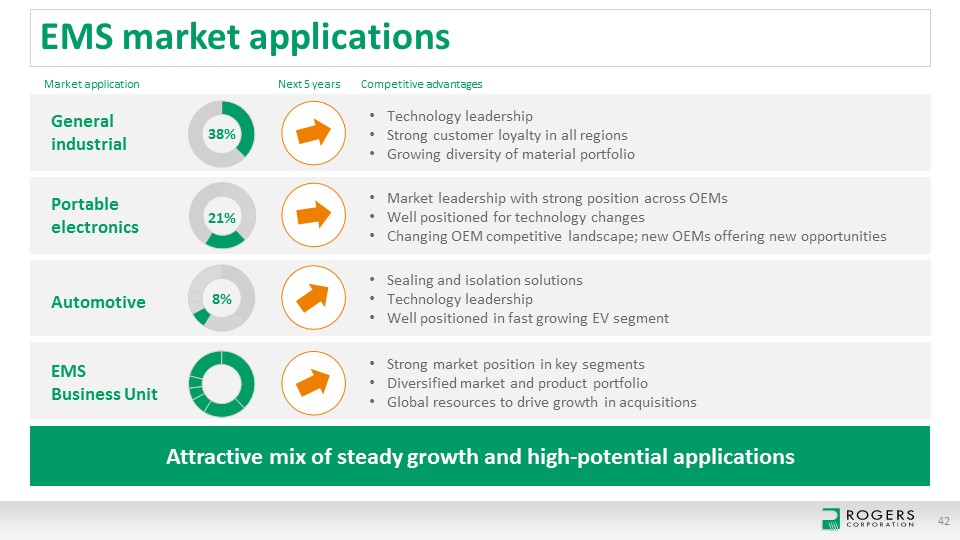
EMS market applications 42 Attractive mix of steady growth and high-potential applications 38% 21% 8% General industrial Portableelectronics EMS Business Unit Automotive Technology leadershipStrong customer loyalty in all regionsGrowing diversity of material portfolio Market leadership with strong position across OEMsWell positioned for technology changesChanging OEM competitive landscape; new OEMs offering new opportunities Strong market position in key segmentsDiversified market and product portfolioGlobal resources to drive growth in acquisitions Sealing and isolation solutionsTechnology leadershipWell positioned in fast growing EV segment Market application Next 5 years Competitive advantages
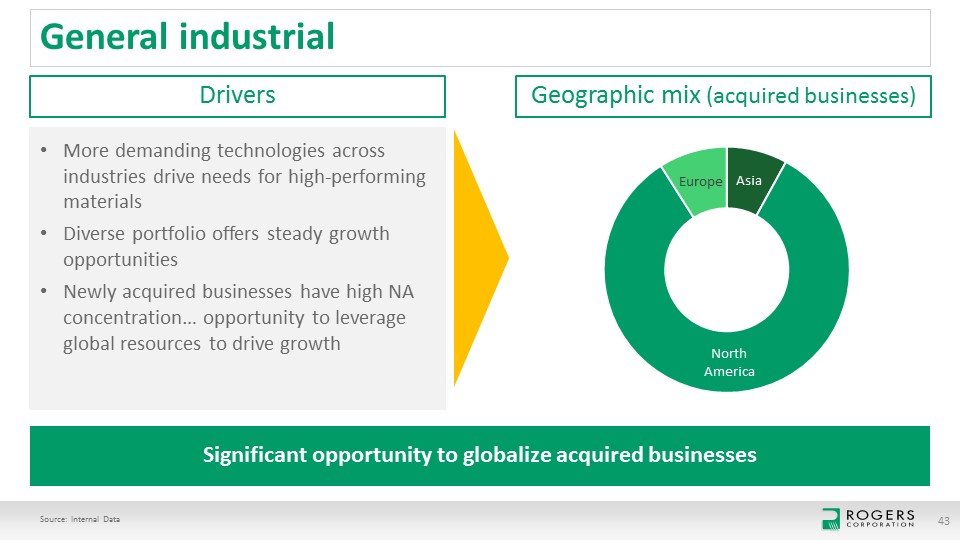
General industrial Source: Internal Data 43 Significant opportunity to globalize acquired businesses More demanding technologies across industries drive needs for high-performing materialsDiverse portfolio offers steady growth opportunitiesNewly acquired businesses have high NA concentration… opportunity to leverage global resources to drive growth Drivers Geographic mix (acquired businesses)
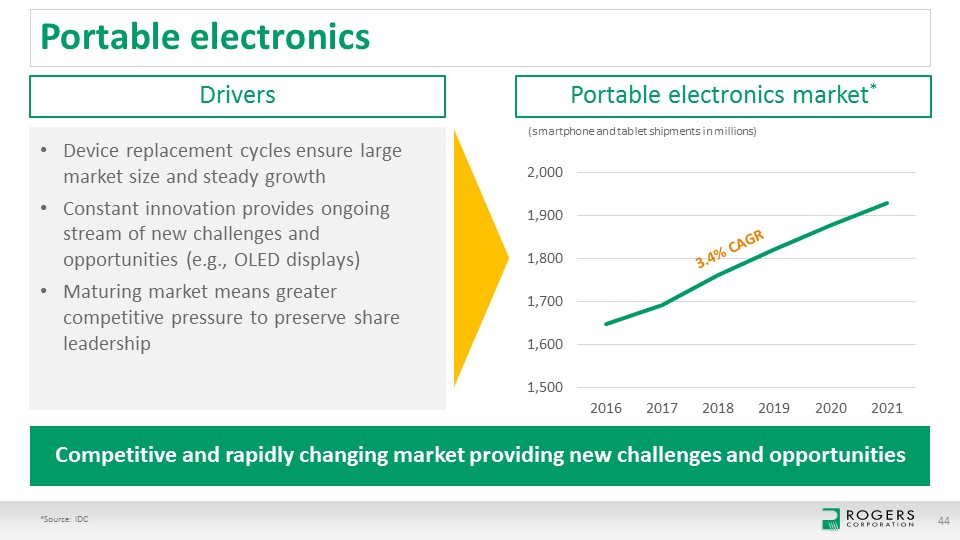
Portable electronics *Source: IDC 44 Competitive and rapidly changing market providing new challenges and opportunities Device replacement cycles ensure large market size and steady growthConstant innovation provides ongoing stream of new challenges and opportunities (e.g., OLED displays)Maturing market means greater competitive pressure to preserve share leadership Drivers Portable electronics market* (smartphone and tablet shipments in millions) 3.4% CAGR
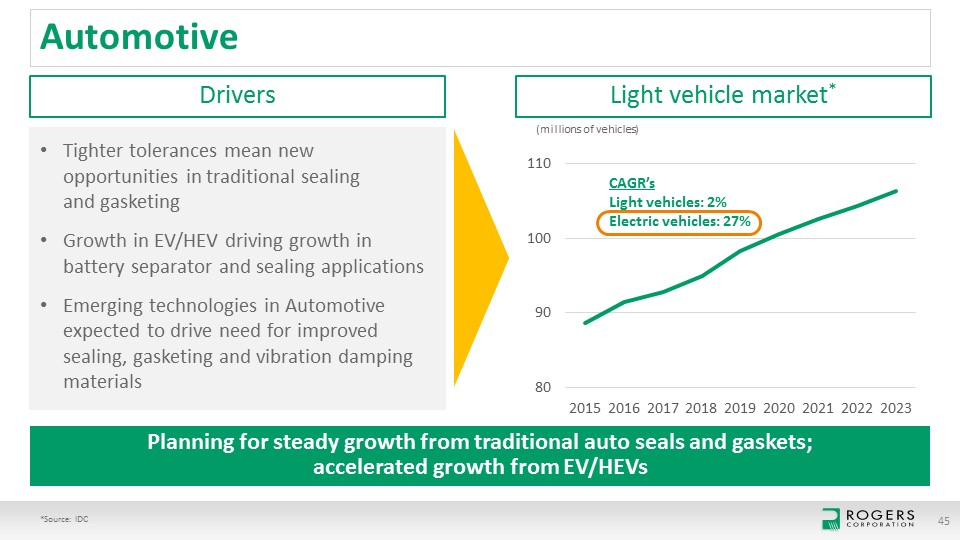
Automotive *Source: IDC 45 Planning for steady growth from traditional auto seals and gaskets; accelerated growth from EV/HEVs Tighter tolerances mean new opportunities in traditional sealing and gasketingGrowth in EV/HEV driving growth in battery separator and sealing applicationsEmerging technologies in Automotive expected to drive need for improved sealing, gasketing and vibration damping materials Drivers Light vehicle market* (millions of vehicles) CAGR’sLight vehicles: 2%Electric vehicles: 27%
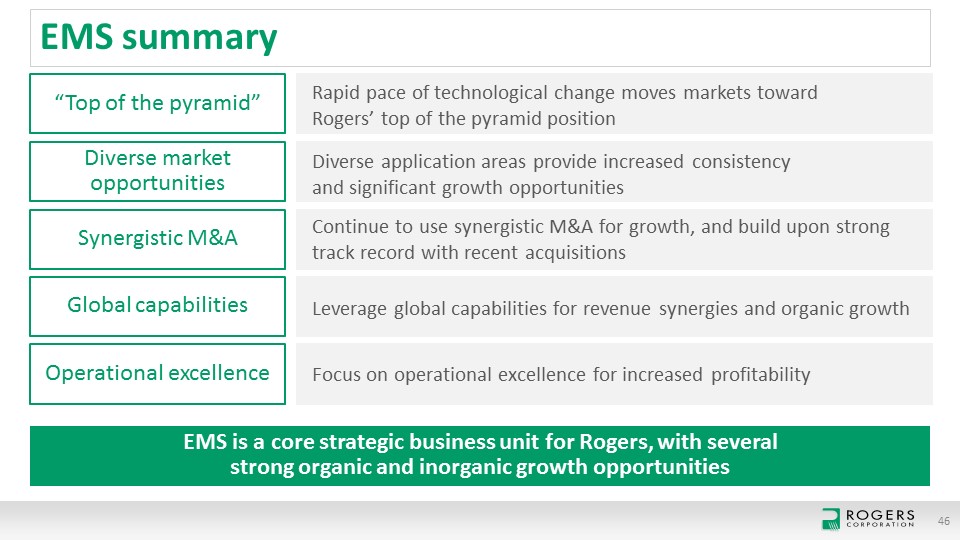
Continue to use synergistic M&A for growth, and build upon strong track record with recent acquisitions EMS summary 46 Diverse market opportunities Diverse application areas provide increased consistency and significant growth opportunities Synergistic M&A Global capabilities Leverage global capabilities for revenue synergies and organic growth Operational excellence Focus on operational excellence for increased profitability EMS is a core strategic business unit for Rogers, with several strong organic and inorganic growth opportunities “Top of the pyramid” Rapid pace of technological change moves markets toward Rogers’ top of the pyramid position
Financial overviewJanice Stipp Senior Vice President and Chief Financial Officer, Principal Financial Officer
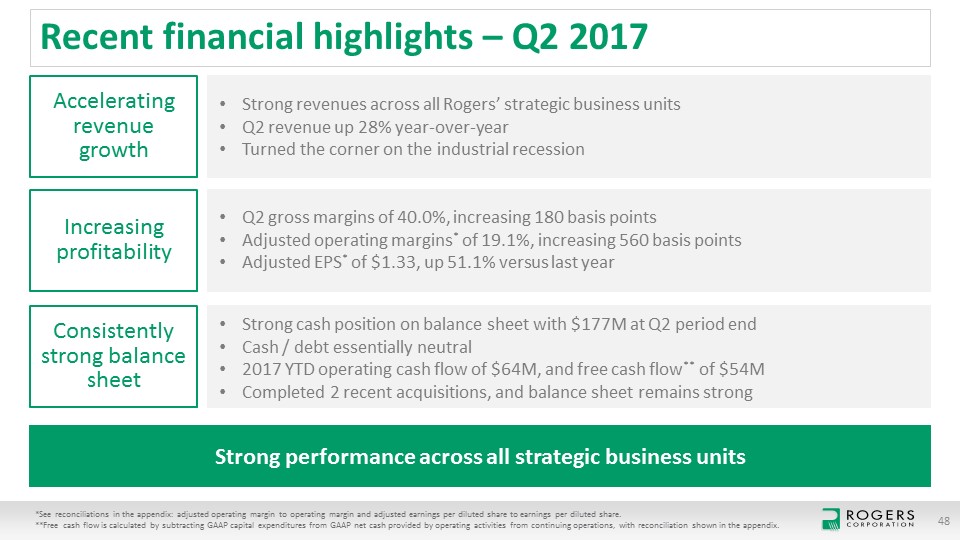
Recent financial highlights – Q2 2017 48 Accelerating revenue growth Strong revenues across all Rogers’ strategic business unitsQ2 revenue up 28% year-over-yearTurned the corner on the industrial recession Increasing profitability Q2 gross margins of 40.0%, increasing 180 basis pointsAdjusted operating margins* of 19.1%, increasing 560 basis pointsAdjusted EPS* of $1.33, up 51.1% versus last year Consistentlystrong balance sheet Strong cash position on balance sheet with $177M at Q2 period endCash / debt essentially neutral2017 YTD operating cash flow of $64M, and free cash flow** of $54MCompleted 2 recent acquisitions, and balance sheet remains strong Strong performance across all strategic business units *See reconciliations in the appendix: adjusted operating margin to operating margin and adjusted earnings per diluted share to earnings per diluted share. **Free cash flow is calculated by subtracting GAAP capital expenditures from GAAP net cash provided by operating activities from continuing operations, with reconciliation shown in the appendix.
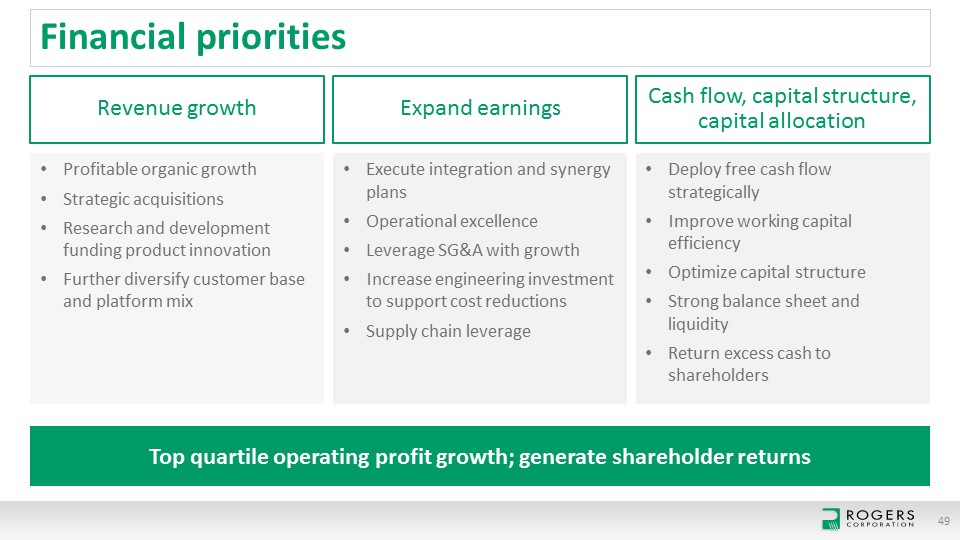
Profitable organic growthStrategic acquisitionsResearch and development funding product innovationFurther diversify customer base and platform mix Execute integration and synergy plansOperational excellenceLeverage SG&A with growthIncrease engineering investment to support cost reductionsSupply chain leverage Deploy free cash flow strategicallyImprove working capital efficiencyOptimize capital structureStrong balance sheet and liquidityReturn excess cash to shareholders Financial priorities 49 Top quartile operating profit growth; generate shareholder returns Revenue growth Expand earnings Cash flow, capital structure, capital allocation
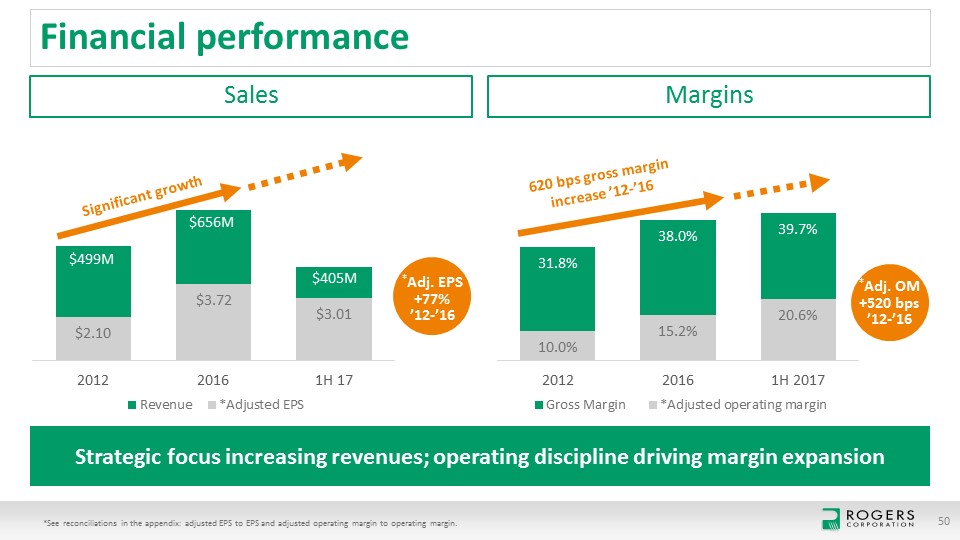
Financial performance 50 *See reconciliations in the appendix: adjusted EPS to EPS and adjusted operating margin to operating margin. Strategic focus increasing revenues; operating discipline driving margin expansion Sales Margins Significant growth *Adj. EPS +77% ’12-’16 $499M $656M *Adj. OM +520 bps ’12-’16 620 bps gross margin increase ’12-’16 $405M
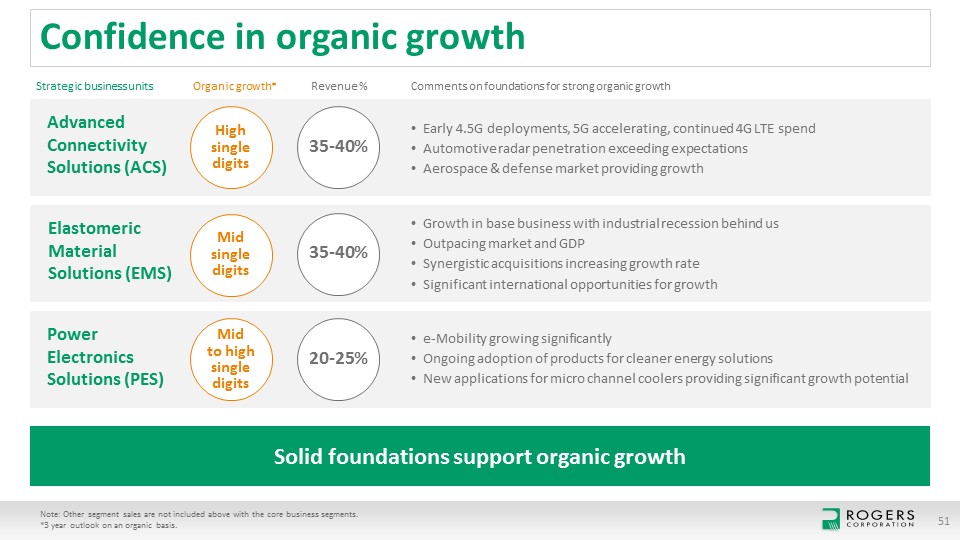
Confidence in organic growth Note: Other segment sales are not included above with the core business segments. *3 year outlook on an organic basis. 51 Solid foundations support organic growth Strategic business units Comments on foundations for strong organic growth Advanced Connectivity Solutions (ACS) Power Electronics Solutions (PES) Elastomeric Material Solutions (EMS) Organic growth* High single digits Mid to high single digits Revenue % 35-40% 35-40% 20-25% Early 4.5G deployments, 5G accelerating, continued 4G LTE spendAutomotive radar penetration exceeding expectationsAerospace & defense market providing growth Growth in base business with industrial recession behind usOutpacing market and GDPSynergistic acquisitions increasing growth rateSignificant international opportunities for growth e-Mobility growing significantlyOngoing adoption of products for cleaner energy solutionsNew applications for micro channel coolers providing significant growth potential Mid single digits
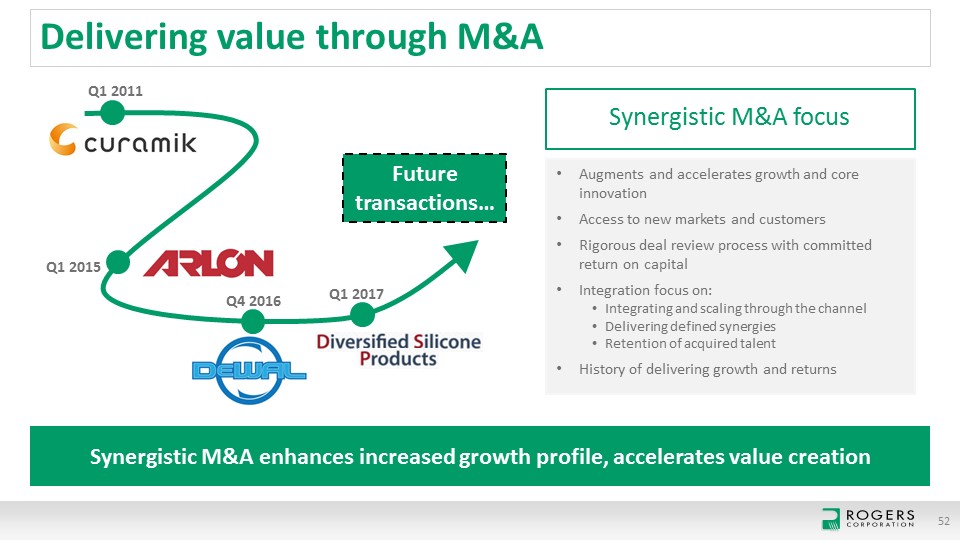
Delivering value through M&A 52 Synergistic M&A enhances increased growth profile, accelerates value creation Augments and accelerates growth and core innovationAccess to new markets and customersRigorous deal review process with committed return on capitalIntegration focus on:Integrating and scaling through the channelDelivering defined synergiesRetention of acquired talentHistory of delivering growth and returns Synergistic M&A focus Q1 2011 Q1 2015 Q4 2016 Q1 2017 Future transactions…
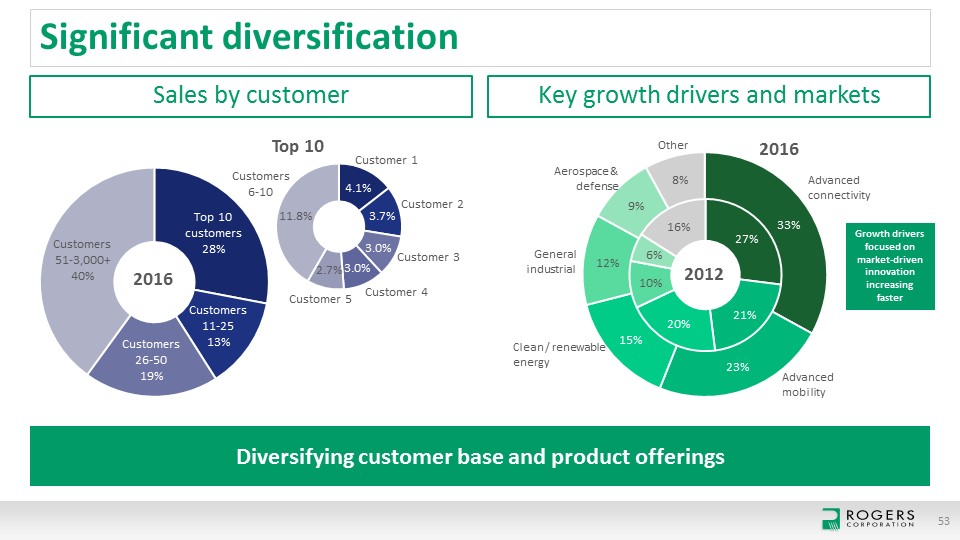
Significant diversification 53 Diversifying customer base and product offerings Sales by customer Key growth drivers and markets Growth drivers focused on market-driven innovation increasing faster 2016 2012 Advanced mobility Advanced connectivity Other Aerospace & defense General industrial Clean / renewable energy Top 10 2016 Customer 1 Customer 2 Customer 3 Customer 4 Customer 5 Customers 6-10
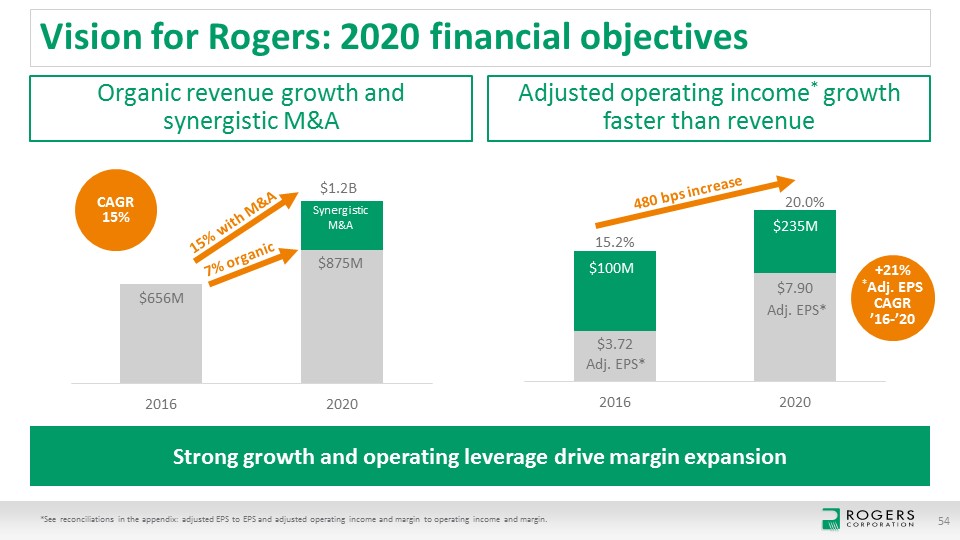
Vision for Rogers: 2020 financial objectives *See reconciliations in the appendix: adjusted EPS to EPS and adjusted operating income and margin to operating income and margin. 54 Strong growth and operating leverage drive margin expansion Organic revenue growth and synergistic M&A Adjusted operating income* growth faster than revenue CAGR 15% Synergistic M&A 7% organic 15% with M&A 480 bps increase $656M $875M $1.2B $100M $235M Adj. EPS* Adj. EPS* +21%*Adj. EPS CAGR ’16-’20
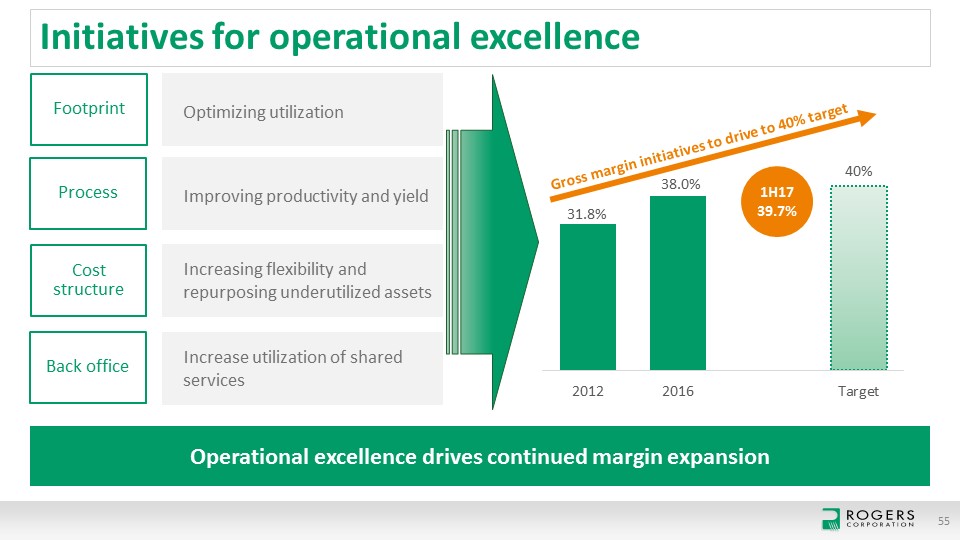
Initiatives for operational excellence 55 Operational excellence drives continued margin expansion Optimizing utilization Improving productivity and yield Increasing flexibility and repurposing underutilized assets Increase utilization of shared services Footprint Process Cost structure Back office Gross margin initiatives to drive to 40% target 1H1739.7%
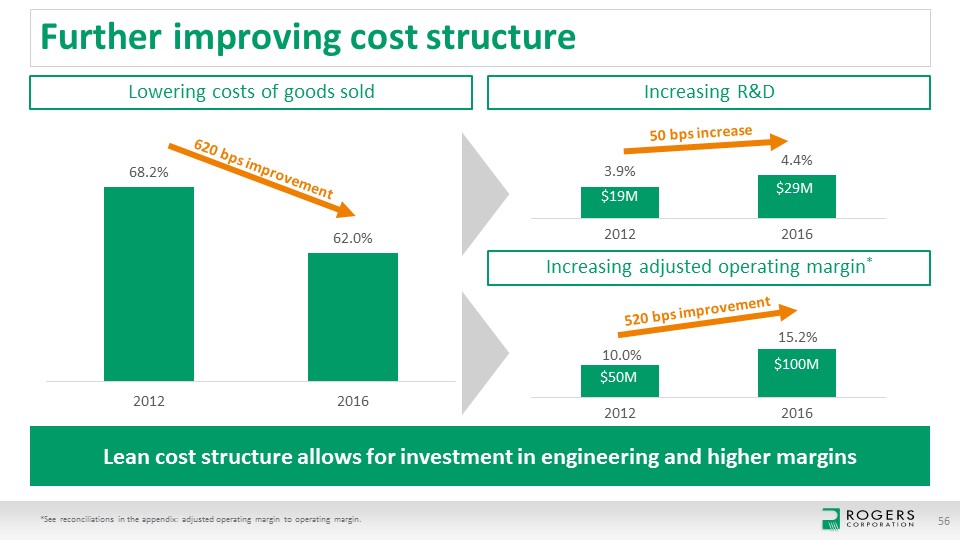
Further improving cost structure 56 *See reconciliations in the appendix: adjusted operating margin to operating margin. Lean cost structure allows for investment in engineering and higher margins Lowering costs of goods sold Increasing R&D Increasing adjusted operating margin* 620 bps improvement 50 bps increase 520 bps improvement $50M $100M $29M $19M
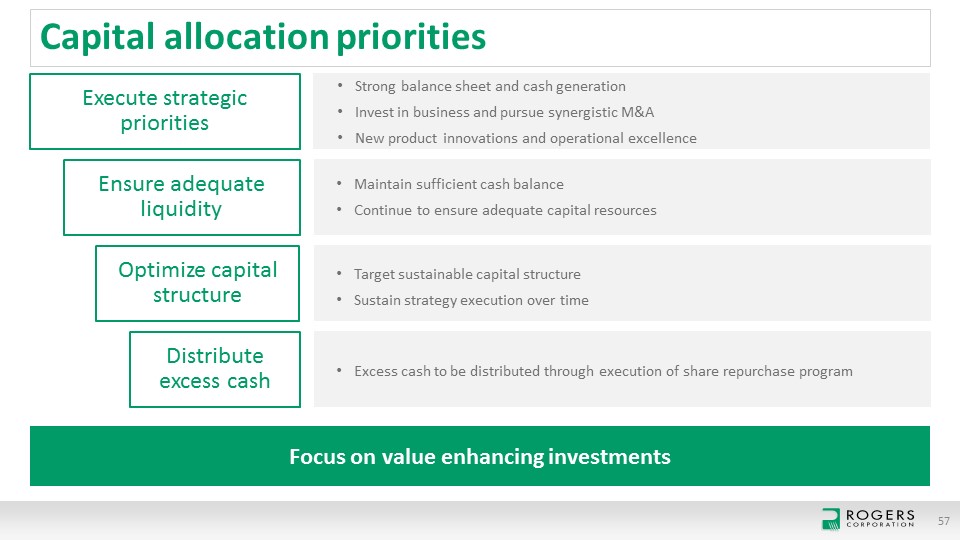
Capital allocation priorities 57 Execute strategic priorities Strong balance sheet and cash generationInvest in business and pursue synergistic M&ANew product innovations and operational excellence Ensure adequate liquidity Optimize capital structure Distribute excess cash Maintain sufficient cash balanceContinue to ensure adequate capital resources Target sustainable capital structureSustain strategy execution over time Excess cash to be distributed through execution of share repurchase program Focus on value enhancing investments
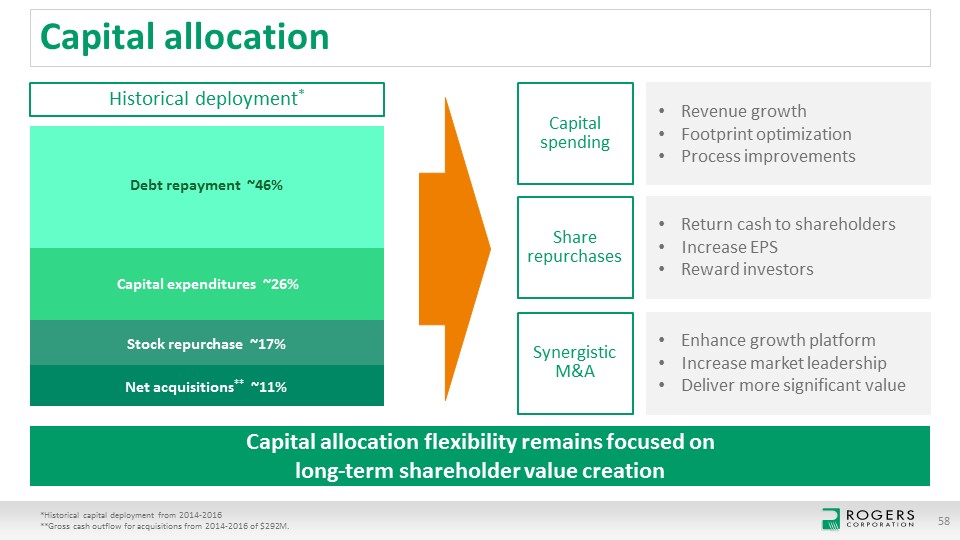
Capital allocation 58 *Historical capital deployment from 2014-2016**Gross cash outflow for acquisitions from 2014-2016 of $292M. Capital allocation flexibility remains focused on long-term shareholder value creation Capital spending Revenue growthFootprint optimizationProcess improvements Share repurchases Return cash to shareholdersIncrease EPSReward investors Synergistic M&A Enhance growth platformIncrease market leadershipDeliver more significant value Historical deployment* Capital expenditures ~26% Debt repayment ~46% Stock repurchase ~17% Net acquisitions** ~11%
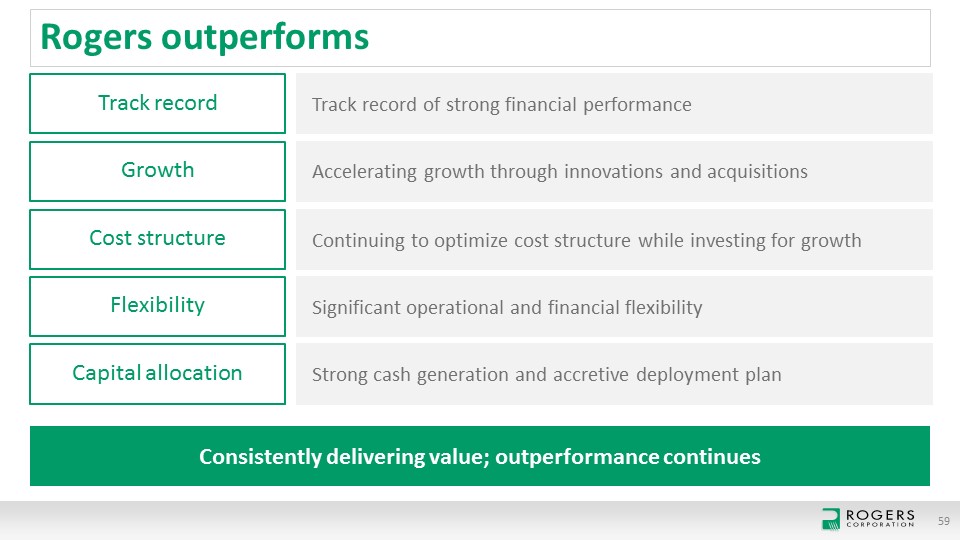
Continuing to optimize cost structure while investing for growth Rogers outperforms 59 Track record Track record of strong financial performance Growth Accelerating growth through innovations and acquisitions Cost structure Flexibility Significant operational and financial flexibility Capital allocation Strong cash generation and accretive deployment plan Consistently delivering value; outperformance continues
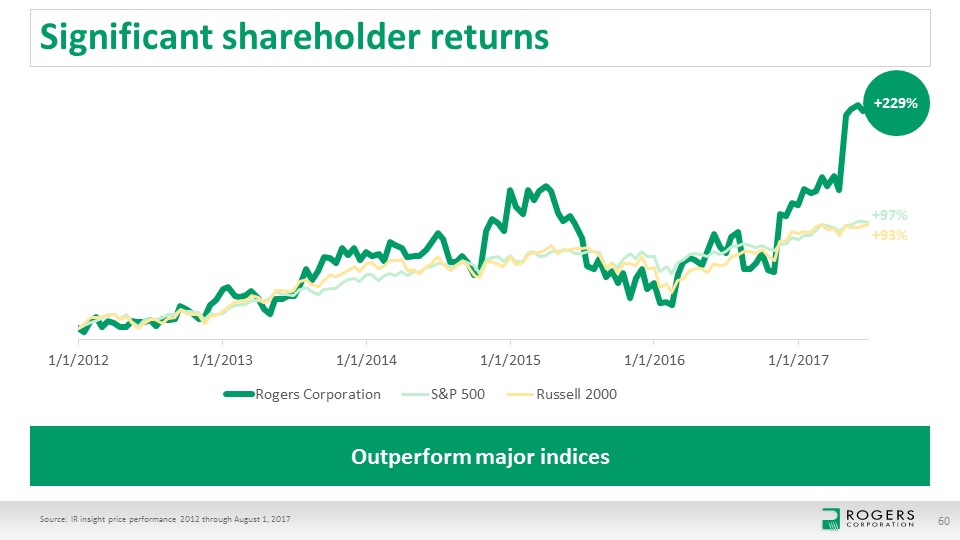
Outperform major indices Significant shareholder returns Source: IR insight price performance 2012 through August 1, 2017 60 +229% +97% +93%
Questions and answersBruce Hoechner and executive team
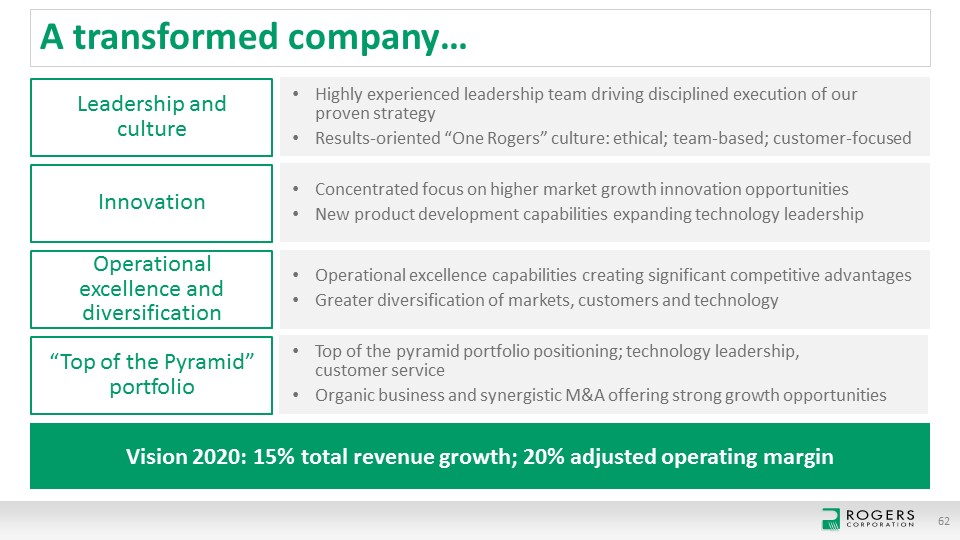
A transformed company… 62 Vision 2020: 15% total revenue growth; 20% adjusted operating margin Highly experienced leadership team driving disciplined execution of our proven strategyResults-oriented “One Rogers” culture: ethical; team-based; customer-focused Innovation Operational excellence and diversification “Top of the Pyramid” portfolio Leadership and culture Concentrated focus on higher market growth innovation opportunitiesNew product development capabilities expanding technology leadership Operational excellence capabilities creating significant competitive advantagesGreater diversification of markets, customers and technology Top of the pyramid portfolio positioning; technology leadership, customer serviceOrganic business and synergistic M&A offering strong growth opportunities

Presenters
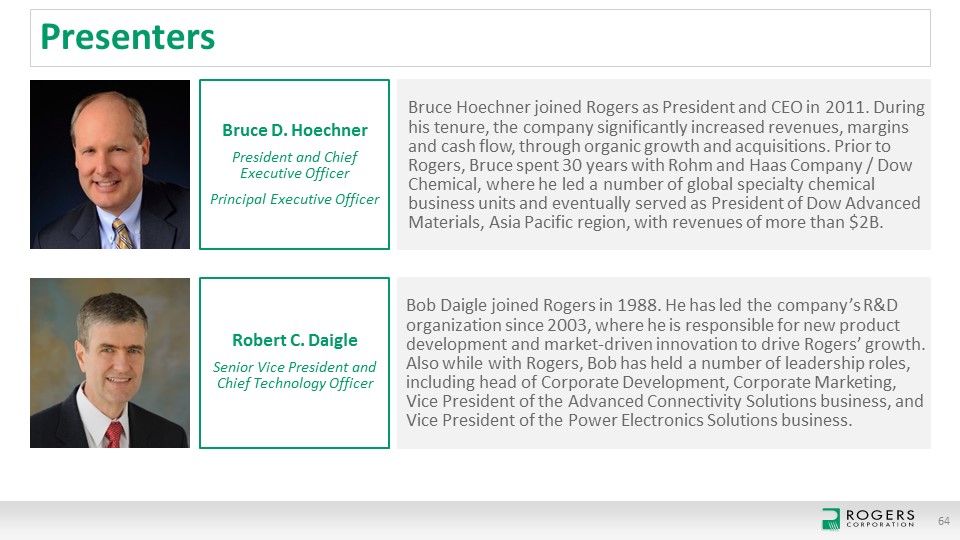
Presenters 64 Bruce D. HoechnerPresident and Chief Executive OfficerPrincipal Executive Officer Bruce Hoechner joined Rogers as President and CEO in 2011. During his tenure, the company significantly increased revenues, margins and cash flow, through organic growth and acquisitions. Prior to Rogers, Bruce spent 30 years with Rohm and Haas Company / Dow Chemical, where he led a number of global specialty chemical business units and eventually served as President of Dow Advanced Materials, Asia Pacific region, with revenues of more than $2B. Robert C. DaigleSenior Vice President and Chief Technology Officer Bob Daigle joined Rogers in 1988. He has led the company’s R&D organization since 2003, where he is responsible for new product development and market-driven innovation to drive Rogers’ growth. Also while with Rogers, Bob has held a number of leadership roles, including head of Corporate Development, Corporate Marketing, Vice President of the Advanced Connectivity Solutions business, and Vice President of the Power Electronics Solutions business.
Presenters 65 Jeffrey M. GrudzienSr. Vice President and General ManagerAdvanced Connectivity Solutions Jeff Grudzien joined Rogers in 2000 and has served in a number of sales and marketing leadership roles during his tenure. Since 2012, Jeff has led the Advanced Connectivity Solutions business. Before that, Jeff served as Vice President of Sales & Marketing for all of Rogers’ product lines. Jeff has over 33 years of business experience, primarily in Sales and Marketing roles for specialty engineered products. Helen ZhangSr. Vice President and General ManagerPower Electronics Solutions Helen Zhang joined Rogers in May 2012 as Vice President, leading the company’s Power Electronics Solutions business unit, as well as Rogers’ Asia region. Prior to Rogers, Helen spent more than 20 years with Dow Chemical where she held a variety of leadership positions in the specialty chemicals business, and led two joint ventures in the Asia region.
Presenters 66 Christopher R. ShaddaySr. Vice President and General ManagerElastomeric Material Solutions Chris Shadday joined Rogers in 2014 as Vice President of Marketing for the Elastomeric Material Solutions business and took over leadership of the division in early 2016. Prior to joining Rogers, Chris spent 28 years in manufacturing and commercial leadership roles within Rohm and Haas Company and its subsidiaries, including the role as President of a specialty chemical joint venture company between Rohm and Haas and Rockwood Specialties. Janice E. StippSr. Vice President and Chief Financial OfficerPrincipal Financial Officer Janice Stipp joined in 2015 serving as Chief Financial Officer of Rogers Corporation. Janice brings 35 years of finance and accounting experience to her role, including over 10 years of CFO experience, for public and private companies across the manufacturing, technology and automotive industries. Janice serves on the Board of Directors for Arcbest and Plygem, and is on the Michigan State University Accounting Advisory Board.

Appendix
Non-GAAP information 68 This presentation includes the following financial measures that are not presented in accordance with generally accepted accounting principles in the United States of America (“GAAP”): Adjusted earnings per diluted share, which the Company defines as earnings per diluted share excluding acquisition-related amortization of intangible assets and discrete items, such as restructuring expenses, certain costs associated with acquisitions, and gains or losses on asset or business dispositions (collectively, “Discrete Items”)Adjusted operating income, which the Company defines as operating income excluding acquisition-related amortization of intangible assets and Discrete Items; Adjusted operating margin, which the Company defines as operating margin excluding acquisition-related amortization of intangible assets and Discrete Items.Management believes each of these measures is useful to investors because they allow for comparison to the Company’s performance in prior periods without the effect of items that, by their nature, tend to obscure the Company’s core operating results due to the potential variability across periods based on the timing, frequency and magnitude. As a result, management believes that adjusted net sales, adjusted earnings per diluted share, adjusted EBITDA, adjusted operating income, adjusted operating margin and adjusted EBITDA margin enhance the ability of investors to analyze trends in the Company’s business and evaluate the Company’s performance relative to peer companies. However, non-GAAP financial measures have limitations as analytical tools and should not be considered in isolation from, or solely as alternatives to, financial measures prepared in accordance with GAAP. In addition, these non-GAAP financial measures may differ from similarly named measures used by other companies. Reconciliations of the differences between these non-GAAP financial measures and their most directly comparable financial measures calculated in accordance with GAAP are set forth at the end of this document.
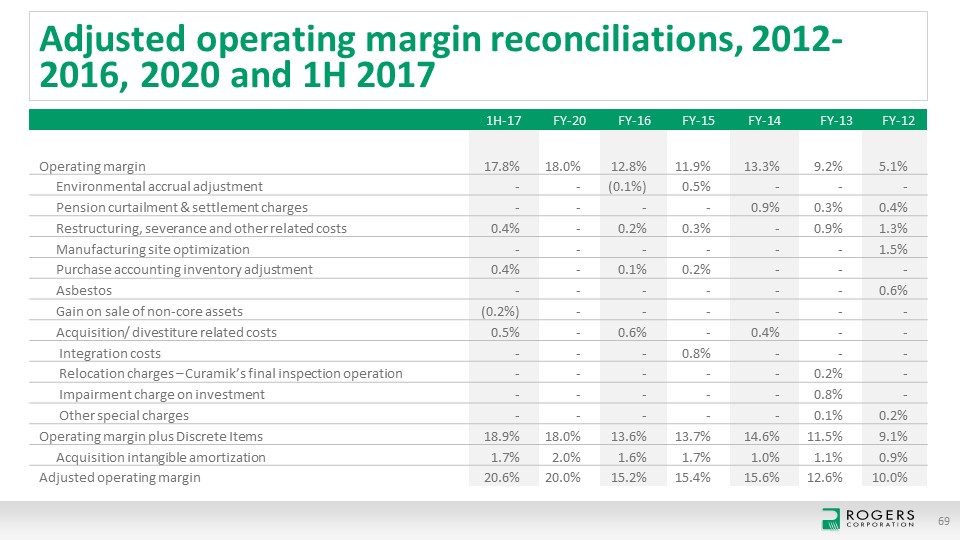
69 1H-17 FY-20 FY-16 FY-15 FY-14 FY-13 FY-12 Operating margin 17.8% 18.0% 12.8% 11.9% 13.3% 9.2% 5.1% Environmental accrual adjustment - - (0.1%) 0.5% - - - Pension curtailment & settlement charges - - - - 0.9% 0.3% 0.4% Restructuring, severance and other related costs 0.4% - 0.2% 0.3% - 0.9% 1.3% Manufacturing site optimization - - - - - - 1.5% Purchase accounting inventory adjustment 0.4% - 0.1% 0.2% - - - Asbestos - - - - - - 0.6% Gain on sale of non-core assets (0.2%) - - - - - - Acquisition/ divestiture related costs 0.5% - 0.6% - 0.4% - - Integration costs - - - 0.8% - - - Relocation charges – Curamik’s final inspection operation - - - - - 0.2% - Impairment charge on investment - - - - - 0.8% - Other special charges - - - - - 0.1% 0.2% Operating margin plus Discrete Items 18.9% 18.0% 13.6% 13.7% 14.6% 11.5% 9.1% Acquisition intangible amortization 1.7% 2.0% 1.6% 1.7% 1.0% 1.1% 0.9% Adjusted operating margin 20.6% 20.0% 15.2% 15.4% 15.6% 12.6% 10.0% Adjusted operating margin reconciliations, 2012-2016, 2020 and 1H 2017
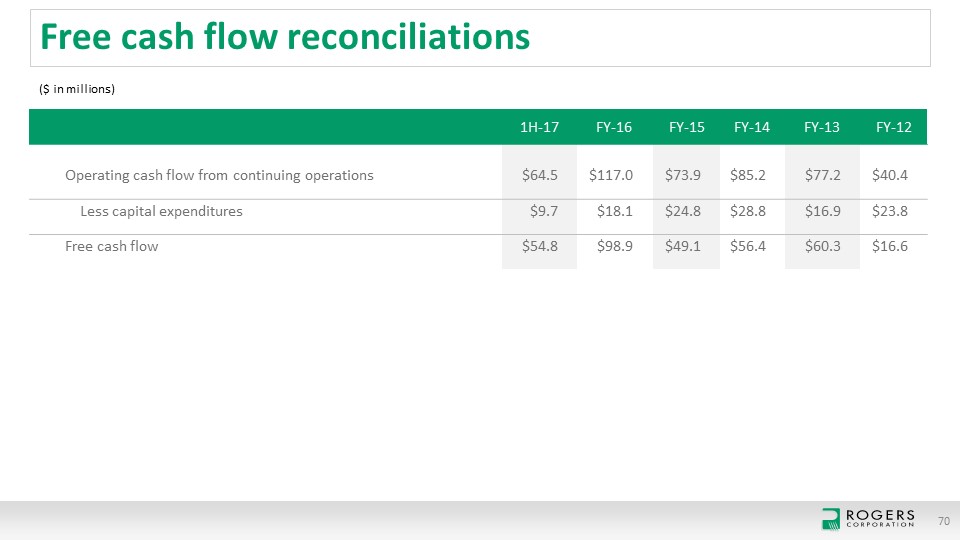
Free cash flow reconciliations 70 1H-17 FY-16 FY-15 FY-14 FY-13 FY-12 Operating cash flow from continuing operations $64.5 $117.0 $73.9 $85.2 $77.2 $40.4 Less capital expenditures $9.7 $18.1 $24.8 $28.8 $16.9 $23.8 Free cash flow $54.8 $98.9 $49.1 $56.4 $60.3 $16.6 ($ in millions)
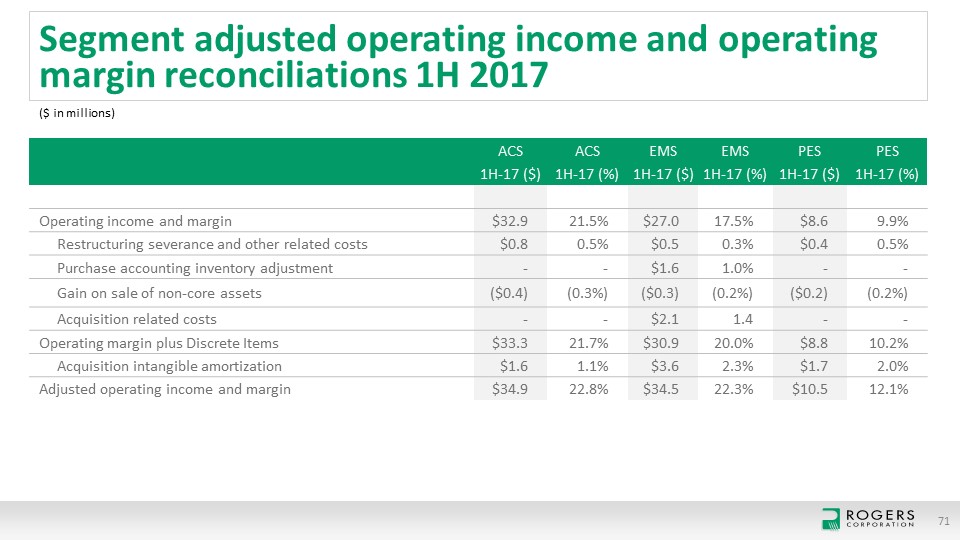
71 ACS ACS EMS EMS PES PES 1H-17 ($) 1H-17 (%) 1H-17 ($) 1H-17 (%) 1H-17 ($) 1H-17 (%) Operating income and margin $32.9 21.5% $27.0 17.5% $8.6 9.9% Restructuring severance and other related costs $0.8 0.5% $0.5 0.3% $0.4 0.5% Purchase accounting inventory adjustment - - $1.6 1.0% - - Gain on sale of non-core assets ($0.4) (0.3%) ($0.3) (0.2%) ($0.2) (0.2%) Acquisition related costs - - $2.1 1.4 - - Operating margin plus Discrete Items $33.3 21.7% $30.9 20.0% $8.8 10.2% Acquisition intangible amortization $1.6 1.1% $3.6 2.3% $1.7 2.0% Adjusted operating income and margin $34.9 22.8% $34.5 22.3% $10.5 12.1% Segment adjusted operating income and operating margin reconciliations 1H 2017 ($ in millions)
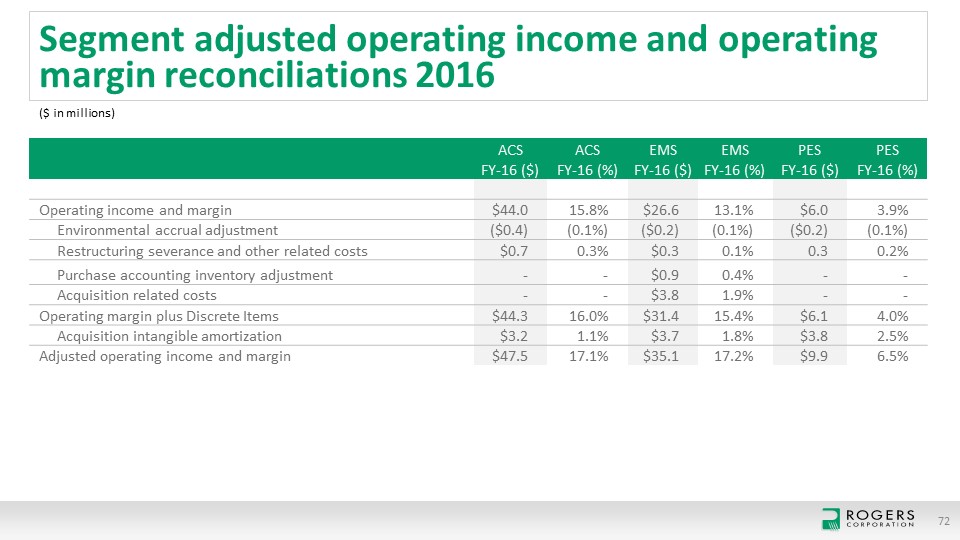
72 Segment adjusted operating income and operating margin reconciliations 2016 ACS ACS EMS EMS PES PES FY-16 ($) FY-16 (%) FY-16 ($) FY-16 (%) FY-16 ($) FY-16 (%) Operating income and margin $44.0 15.8% $26.6 13.1% $6.0 3.9% Environmental accrual adjustment ($0.4) (0.1%) ($0.2) (0.1%) ($0.2) (0.1%) Restructuring severance and other related costs $0.7 0.3% $0.3 0.1% 0.3 0.2% Purchase accounting inventory adjustment - - $0.9 0.4% - - Acquisition related costs - - $3.8 1.9% - - Operating margin plus Discrete Items $44.3 16.0% $31.4 15.4% $6.1 4.0% Acquisition intangible amortization $3.2 1.1% $3.7 1.8% $3.8 2.5% Adjusted operating income and margin $47.5 17.1% $35.1 17.2% $9.9 6.5% ($ in millions)
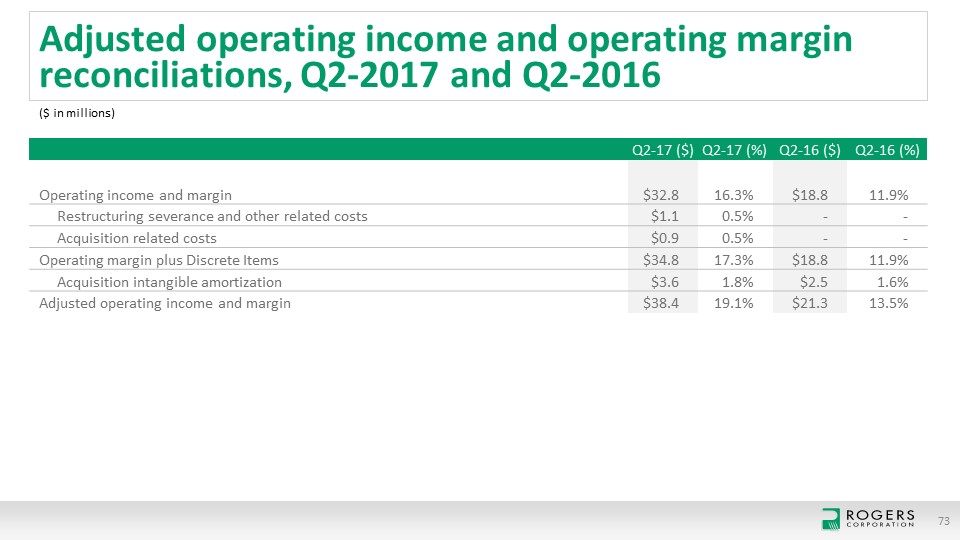
73 Q2-17 ($) Q2-17 (%) Q2-16 ($) Q2-16 (%) Operating income and margin $32.8 16.3% $18.8 11.9% Restructuring severance and other related costs $1.1 0.5% - - Acquisition related costs $0.9 0.5% - - Operating margin plus Discrete Items $34.8 17.3% $18.8 11.9% Acquisition intangible amortization $3.6 1.8% $2.5 1.6% Adjusted operating income and margin $38.4 19.1% $21.3 13.5% Adjusted operating income and operating margin reconciliations, Q2-2017 and Q2-2016 ($ in millions)
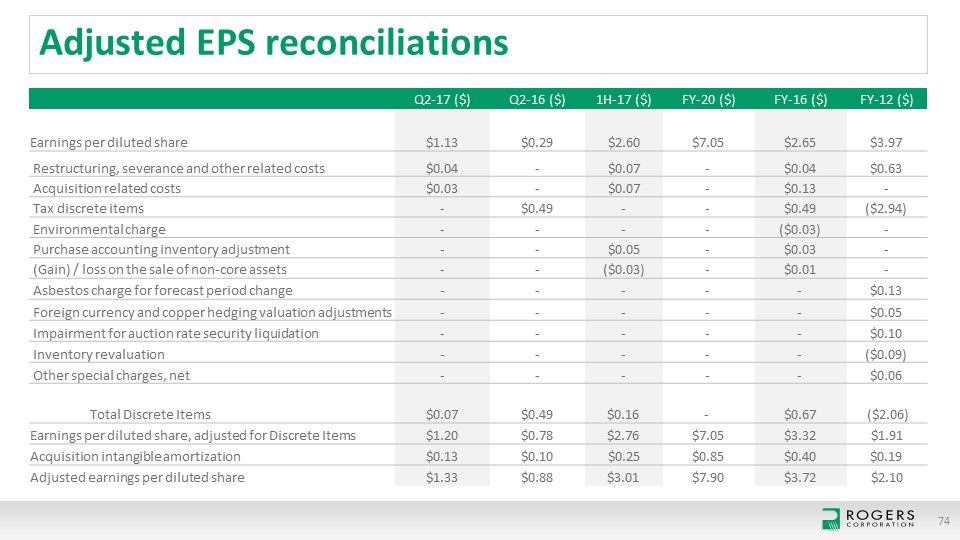
74 Q2-17 ($) Q2-16 ($) 1H-17 ($) FY-20 ($) FY-16 ($) FY-12 ($) Earnings per diluted share $1.13 $0.29 $2.60 $7.05 $2.65 $3.97 Restructuring, severance and other related costs $0.04 - $0.07 - $0.04 $0.63 Acquisition related costs $0.03 - $0.07 - $0.13 - Tax discrete items - $0.49 - - $0.49 ($2.94) Environmental charge - - - - ($0.03) - Purchase accounting inventory adjustment - - $0.05 - $0.03 - (Gain) / loss on the sale of non-core assets - - ($0.03) - $0.01 - Asbestos charge for forecast period change - - - - - $0.13 Foreign currency and copper hedging valuation adjustments - - - - - $0.05 Impairment for auction rate security liquidation - - - - - $0.10 Inventory revaluation - - - - - ($0.09) Other special charges, net - - - - - $0.06 Total Discrete Items $0.07 $0.49 $0.16 - $0.67 ($2.06) Earnings per diluted share, adjusted for Discrete Items $1.20 $0.78 $2.76 $7.05 $3.32 $1.91 Acquisition intangible amortization $0.13 $0.10 $0.25 $0.85 $0.40 $0.19 Adjusted earnings per diluted share $1.33 $0.88 $3.01 $7.90 $3.72 $2.10 Adjusted EPS reconciliations