Attached files
| file | filename |
|---|---|
| EX-99.4 - EXHIBIT 99.4 AMENDED AND RESTATED EXPENSE SUPPORT CONDITIONAL REIMBURSEMENT AGMT - GUGGENHEIM CREDIT INCOME FUND 2019 | ex994ccifiaandrexpensesup.htm |
| 8-K - 8-K - GUGGENHEIM CREDIT INCOME FUND 2019 | ccif-iform8xk2017q2overview.htm |
 | Exhibit 99.6 | |
CAREY CREDIT INCOME FUND
SECOND QUARTER 2017 OVERVIEW
This overview contains details about the portfolio and operating results for the quarter ended June 30, 2017 of Carey Credit Income Fund ("CCIF" or the "Company") and its feeder funds, Carey Credit Income Fund — I ("CCIF - I") and Carey Credit Income Fund 2016 T ("CCIF 2016 T"). This overview should be read in conjunction with the CCIF - I and CCIF 2016 T Quarterly Reports on Form 10-Q, which each incorporate the CCIF Quarterly Report on Form 10-Q, as filed with the U.S. Securities and Exchange Commission (the "SEC") on August 11, 2017.
Highlights
• | On August 10, 2017, CCIF’s Board of Trustees accepted the resignation of Carey Credit Advisors, LLC ("W. P. Carey") as CCIF’s investment advisor and appointed Guggenheim Partners Investment Management, LLC ("Guggenheim") as CCIF’s interim advisor, each to become effective on September 11, 2017. Under the interim investment advisory agreement, the base management fee will be equal to 1.75% of average gross assets. For further details please see "Subsequent Events." |
• | As of June 30, 2017, CCIF had total assets of $401 million, compared to total assets of $305 million as of December 31, 2016. |
• | During the six months ended June 30, 2017, CCIF invested $174 million, 74% of which was in directly originated debt investments, with sales and paydowns totaling $76 million for the same period. For the year ended December 31, 2016, CCIF invested $268 million, 51% of which was in directly originated debt investments. |
• | CCIF's portfolio investments at fair value totaled $376 million as of June 30, 2017, of which 88% was in senior secured debt investments. The portfolio consisted of 98 investments across 67 portfolio companies. |
• | CCIF's gross portfolio yield as of June 30, 2017 was 8.6%, compared to 8.2% as of December 31, 2016.1 |
• | As of June 30, 2017, CCIF had one debt investment on non-accrual status, which represented 0.8% of total investments on both a fair value basis and an amortized cost basis. |
• | Please see below for feeder fund specific highlights for the period ended June 30, 2017: |
Six Months Ended June 30, 2017 | ||||
CCIF - I | CCIF 2016 T | |||
Distributions paid per share | $0.91 | $0.32 | ||
Total investment return - net asset value (non-annualized)2 | 4.22 | % | 3.70 | % |
Total assets ($ in thousands) | $41,639 | $162,483 | ||
Net asset value per share | $25.92 | $9.13 | ||
Gross proceeds from offering ($ in thousands) | $21,174 | $49,197 | ||
• | CCIF 2016 T concluded its public offering on April 28, 2017, having raised $164 million since inception. |
• | As of June 30, 2017, CCIF - I raised cumulative gross proceeds of $41.1 million since inception. |
________________________
(1) | Weighted average effective yield is calculated as the effective yield of each investment and weighted by its amortized cost as compared to the aggregate amortized cost of all investments. Effective yield is the return earned on investments net of any discount, premium, or issuance costs. Effective portfolio yield for the total debt portfolio is calculated before considering the impact of leverage or any operating expenses, and cash, restricted cash, non-income producing assets and equity investments are excluded. |
(2) | Total investment return-net asset value is a measure of the change in total value for shareholders who held the company’s common shares at the beginning and end of the period, including distributions declared during the period. Total investment return-net asset value is based on (i) net asset value per share on the first day of the period, (ii) the net asset value per share on the last day of the period, plus any shares issued in connection with the reinvestment of monthly distributions, and (iii) distributions payable relating to the ownership of shares, if any, on the last day of the period. The total investment return-net asset value calculation assumes that (i) monthly cash distributions are reinvested in accordance with the Company’s distribution reinvestment plan and (ii) the shares issued pursuant to the distribution reinvestment plan are issued at the then current public offering price, net of sales load, on each monthly distribution payment date. Since there is no public market for the company’s shares, terminal market value per share is assumed to be equal to net asset value per share on the last day of the period presented. Investment performance is presented without regard to sales load that may be incurred by shareholders in the purchase of the Company’s common shares. The Company’s performance changes over time and currently may be different than that shown above. Past performance is no guarantee of future results. Total investment return-net asset value is not annualized. |
- 1 -
Business Environment
During the first half of 2017 the credit markets continued the strong streak of performance that commenced in early 2016. High-yield corporate bonds delivered 4.4 percent year-to-date returns through the end of the second quarter, while bank loans returned 2.0 percent. Markets shrugged off worrisome developments during the second quarter, including declining oil prices, a lack of progress on fiscal legislation in Washington, D.C., and rising geopolitical risks.
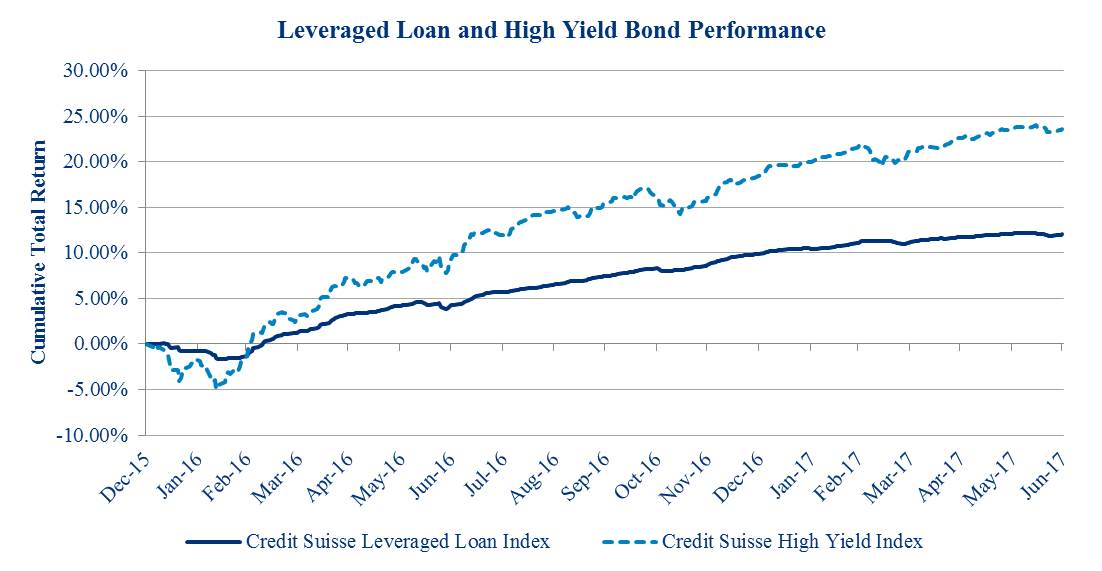
Concurrently, over the first half of 2017, loan market returns have been hindered by refinancing activity, which in turn reduced contractual spreads at the expense of the lender. Historical performance suggests loans should perform better than bonds through the hiking cycle, but the question remains whether this will repeat in the current cycle.
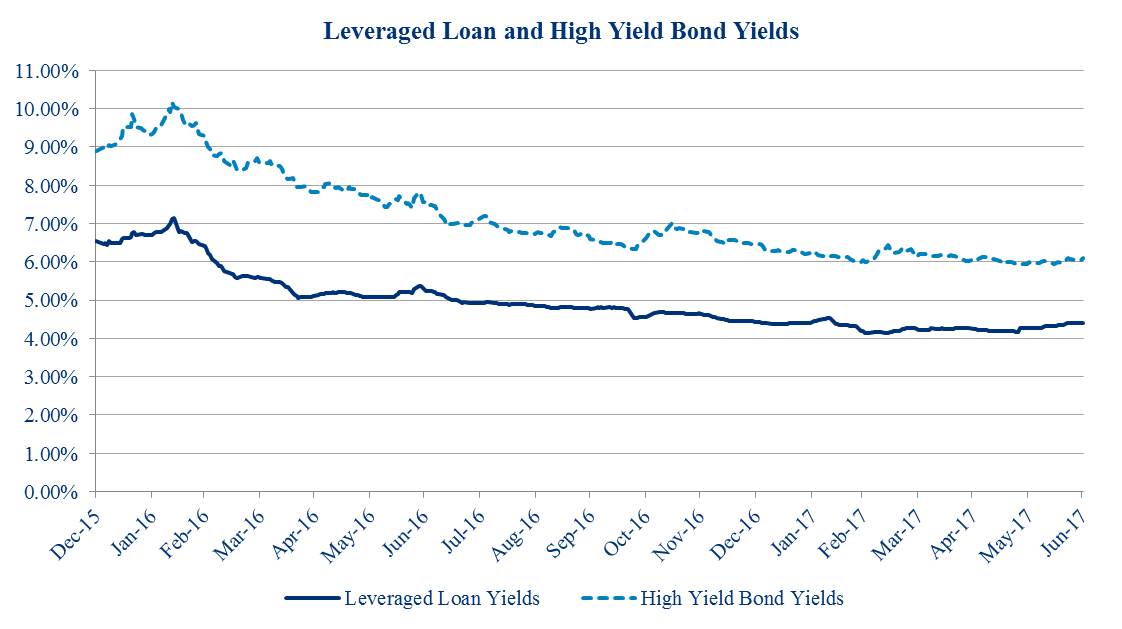
With prices already near par, we continue to expect that bond market returns will largely consist of coupons with limited price upside. The increase in short-term interest rates will drive bank loan coupons higher over the next two years. We expect bank loan coupons will eventually approximate high-yield corporate bond coupons. As bank loan coupons drift closer to those of high-yield bonds, we believe loans will be viewed as increasingly attractive to investors. In particular, we believe that privately negotiated, directly originated loans that are underwritten by experienced credit managers will offer better risk/reward profiles.
- 2 -
We believe that, in this credit environment, experienced credit managers are critical to the success of credit investors. While we remain constructive on credit and will be opportunistic during times of technical dislocations in the syndicated markets, we believe that direct origination will be the primary source of opportunity in the near term. We believe that CCIF's Advisors' extensive resources in credit research and direct origination capabilities will allow us to continue investing in new assets with attractive yields while remaining in the senior credit position of portfolio companies' capital structures to protect against the downside when the market conditions shift.
Investment Activity, Investment Performance, and Portfolio Update
As the syndicated bank loan markets remain competitive, we continue to see lower yields and fewer loan covenants making the syndicated market less attractive for sourcing debt investments from a risk/reward standpoint. As such, our investment focus remains concentrated in directly originated investments, where we seek attractive yields that allow us to largely remain in senior positions of companies' capital structures.
During the six months ended June 30, 2017, our investment activity was primarily concentrated in sourcing debt investments through direct origination (74%) and primary issuance channels (18%) and the remainder was through secondary market channels (i.e. syndicated investments). Investment activity consisted of $174 million in new commitments, including commitments to 23 new portfolio companies.
The following table presents our investment activity for the six months ended June 30, 2017 and June 30, 2016 (dollars in thousands):
Six Months Ended June 30, 2017 | Six Months Ended June 30, 2016 | ||||||
Total Assets | $ | 400,757 | $ | 170,306 | |||
Total Fair Value of Investments | $ | 376,421 | $ | 144,155 | |||
Gross Portfolio Yield | 8.6 | % | 7.3 | % | |||
Investment activity segmented by access channel: | |||||||
Direct origination | $ | 128,512 | - | ||||
Primary issuance | 31,919 | 61,469 | |||||
Secondary market transactions | 13,499 | 26,558 | |||||
Total investment activity | 173,930 | 88,027 | |||||
Investments sold or repaid | (76,106 | ) | (23,592 | ) | |||
Net investment activity | $ | 97,824 | $ | 64,435 | |||
Portfolio companies at beginning of period | 55 | 32 | |||||
Number of added portfolio companies | 23 | 27 | |||||
Number of exited portfolio companies | (11 | ) | (7 | ) | |||
Portfolio companies at period end | 67 | 52 | |||||
As discussed above, while syndicated loan market yields continue to tighten, CCIF's investment focus is concentrated in directly originated transactions that are also senior secured in order to better protect investors against the downside when the market environment eventually shifts. During Q2 of 2017, only 8% of investment commitments were outside of senior secured debt investments.
- 3 -
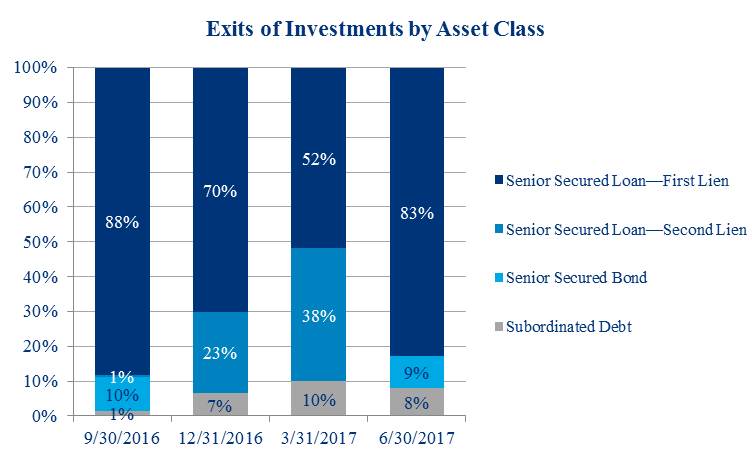
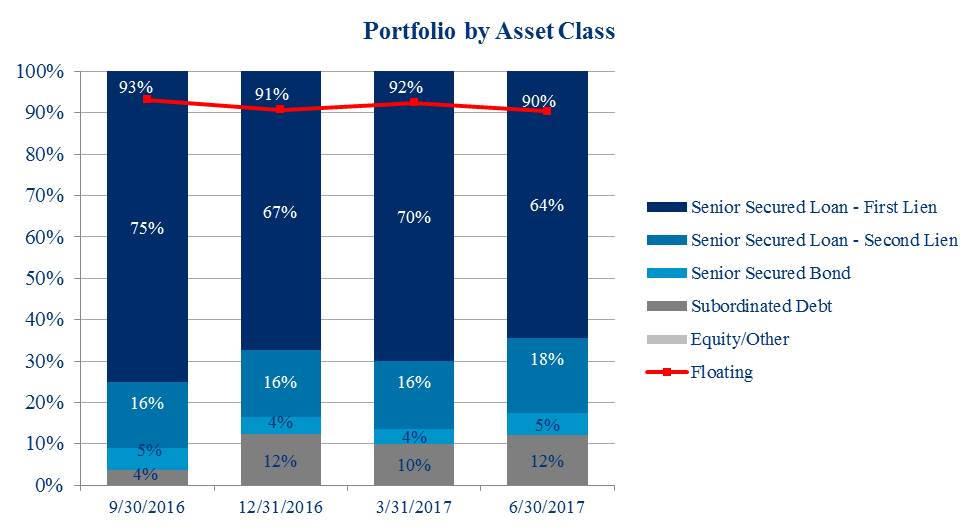
Investment activity by quarter and by asset class as of each of the last four quarters was as follows:
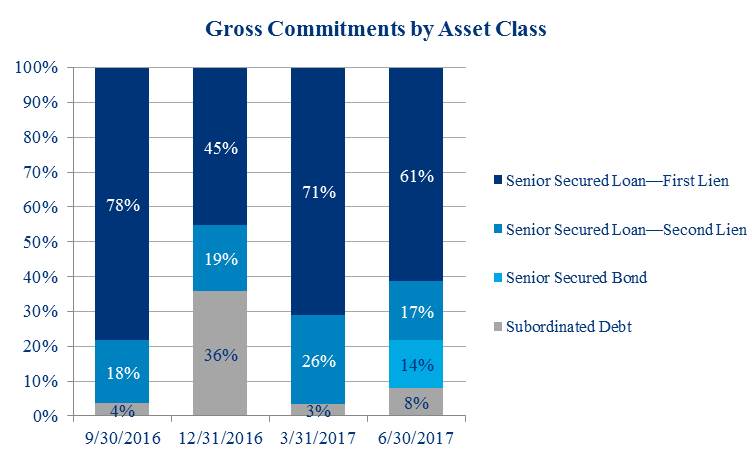
As of June 30, 2017, the portfolio consisted of $376 million of total investments at fair value and, consistent with prior quarters, our debt portfolio remains predominately invested in senior secured debt investments which represented 88% of the portfolio at fair value. We believe senior secured debt investments provide for downside protection which is particularly important given today's credit environment.
Set forth below is the composition of the portfolio by asset class for each quarter end based on fair value:
- 4 -
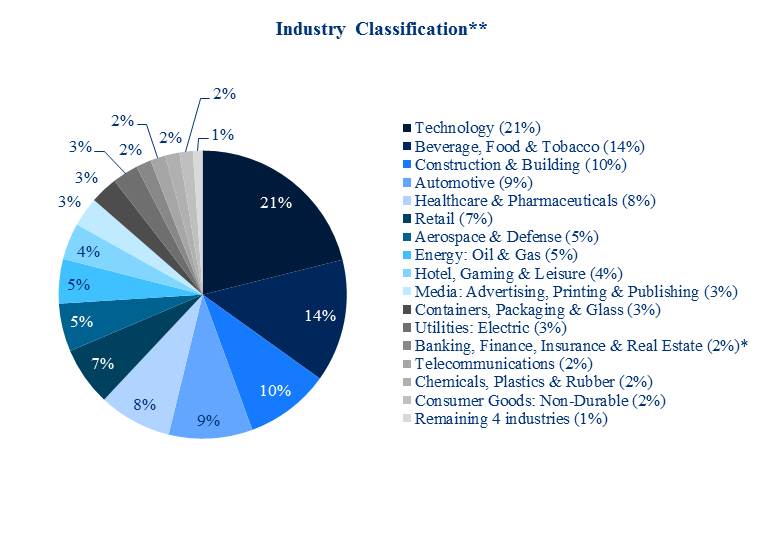
As of June 30, 2017, there were 67 portfolio companies in which CCIF held 98 investments. The weighted average portfolio company age, based on fair value, was 44 years as of June 30, 2017. Furthermore, and aligned with our strategy of mitigating industry specific risk, the companies comprising the CCIF portfolio were diversified across 20 industries. Set forth below are the industry concentrations in CCIF's portfolio as of June 30, 2017 by fair value:
________________________
(*) Portfolio companies may include insurance brokers that are not classified as insurance companies.
(**) Industry classifications based upon Moody's standard industry classifications.
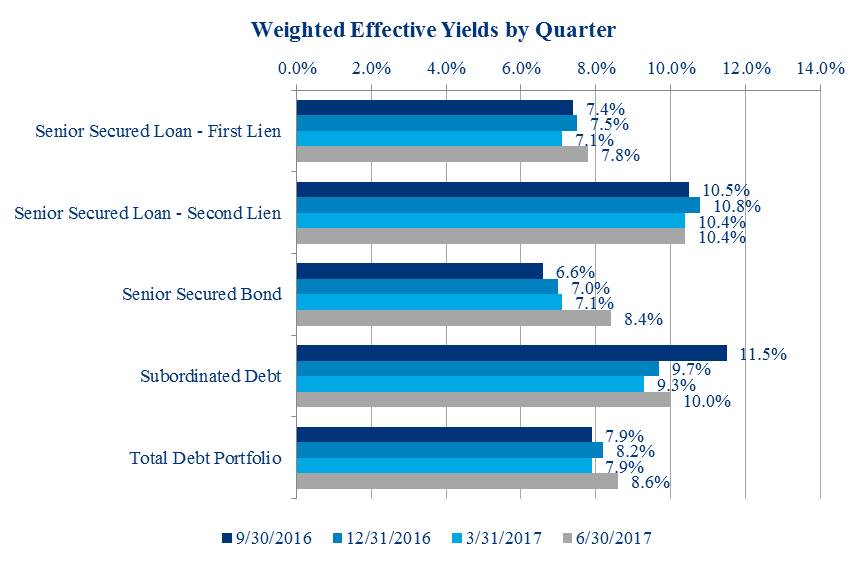
As spreads have tightened in the secondary market, CCIF's Advisors continue to actively deploy capital into directly originated transactions, achieving a gross portfolio yield of 8.6% as of June 30, 2017, compared to 8.2% as of December 31, 2016.
Set forth below are the weighted average effective yields, by investment type, as of each of the prior four quarters:
- 5 -
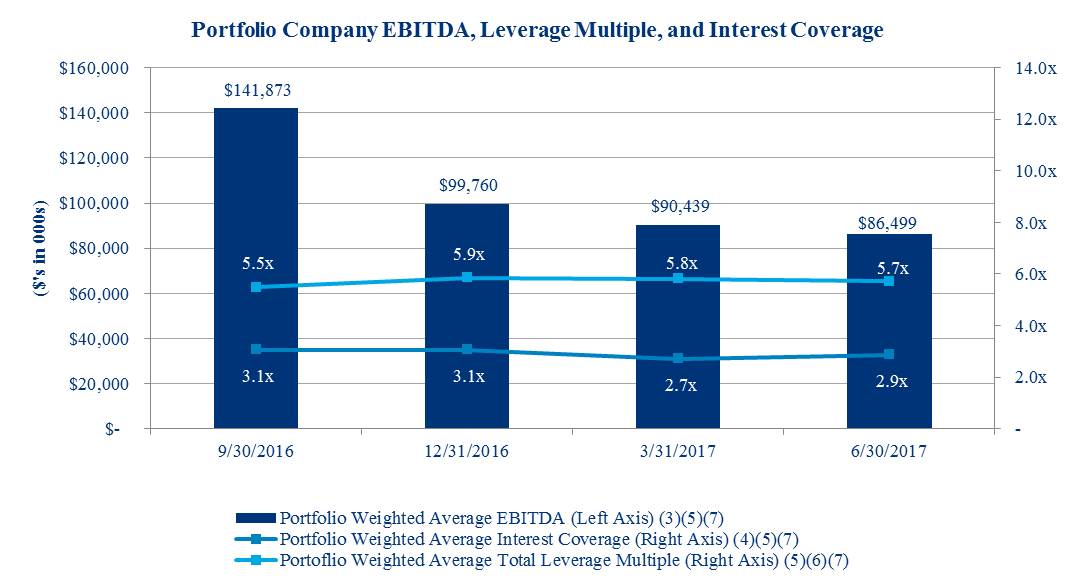
Set forth below are the weighted average EBITDA, weighted average total leverage multiple, and weighted average interest rate coverage of CCIF's portfolio companies. The quarter-over-quarter decline in portfolio weighted average EBITDA was primarily due to the continued focus on directly originated transactions. The twelve new portfolio companies associated with direct originations had a weighted average EBITDA of $82.7 million and the investments in nine portfolio companies that were sold or paid down during the second quarter of 2017 had a weighted average EBITDA of $124.9 million.
________________________
(3) | Weighted average EBITDA amounts are weighted based on the amortized cost of the portfolio company investments. EBITDA amounts are estimated from the most recent portfolio company financial statements, have not been independently verified by CCIF or its Advisors, and may reflect a normalized or adjusted amount. Accordingly, neither CCIF nor its Advisors makes any representation or warranty in respect of this information. |
(4) | Weighted average interest coverage represents the portfolio company’s EBITDA as a multiple of interest expense. Portfolio company credit statistics are derived from the most recently available portfolio company financial statements, have not been independently verified by CCIF or its Advisors, and may reflect a normalized or adjusted amount. Accordingly, neither CCIF nor its Advisors makes any representation or warranty in respect of this information. |
(5) | Portfolio weighted average EBITDA, weighted average total leverage multiple, and weighted average interest coverage ratio data includes information solely in respect of portfolio companies in which CCIF has a debt investment. |
(6) | Weighted average total leverage multiple represents the portfolio company’s total debt as a multiple of EBITDA. Portfolio company credit statistics are derived from the most recently available portfolio company financial statements, have not been independently verified by CCIF or its Advisors, and may reflect a normalized or adjusted amount. Accordingly, neither CCIF nor its Advisors makes any representation or warranty in respect of this information. |
(7) | EBITDA is a non-GAAP financial measure. For a particular portfolio company, EBITDA is generally defined as net income before net interest expense, income tax expense, depreciation and amortization. EBITDA amounts are estimated from the most recent portfolio company's financial statements, have not been independently verified by CCIF or its Advisors, and may reflect a normalized or adjusted amount. Accordingly, neither CCIF nor its Advisors makes any representation or warranty in respect of this information. |
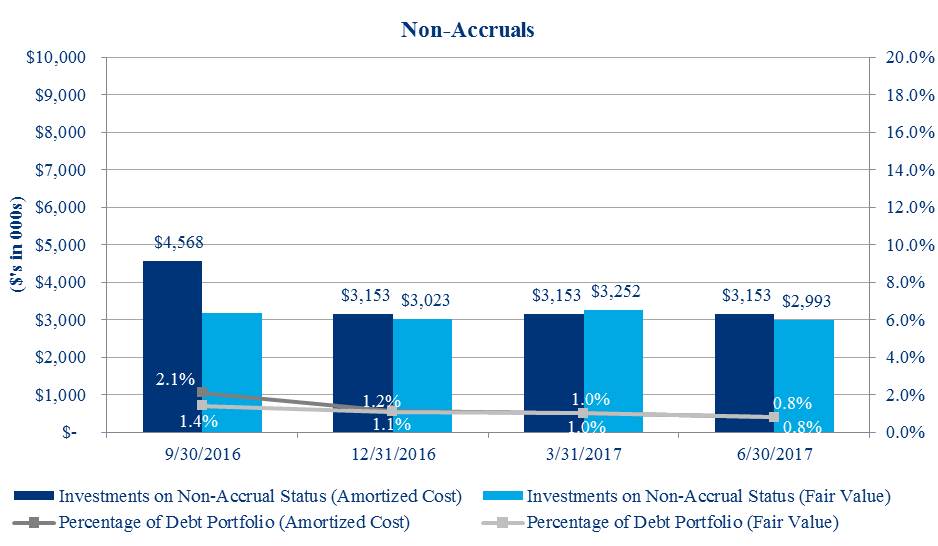
As of June 30, 2017, CCIF had one debt investment on non-accrual status associated with one portfolio company in the Energy: Oil and Gas industry, which represented less than 1% of total investments on both a fair value and amortized cost basis. In May of 2016, the portfolio company voluntarily filed a petition to reorganize under Chapter 11 of the U.S. Bankruptcy Code, and the bankruptcy workout was still underway as of June 30, 2017. We are actively monitoring the situation and continuously evaluating our position.
- 6 -
The following chart shows debt investments on non-accrual status based on their amortized cost and fair value for each of the prior four quarters.
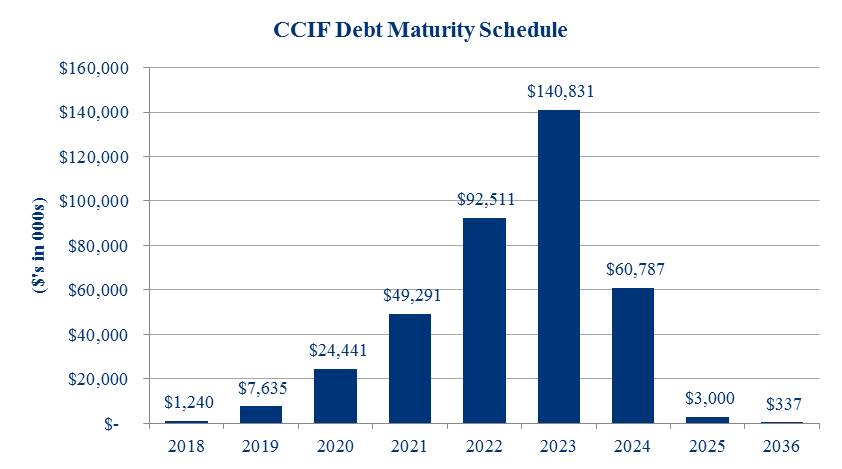
The following chart shows the maturity schedule of CCIF's debt investments, excluding unfunded commitments, based on their principal amount as of June 30, 2017.
- 7 -
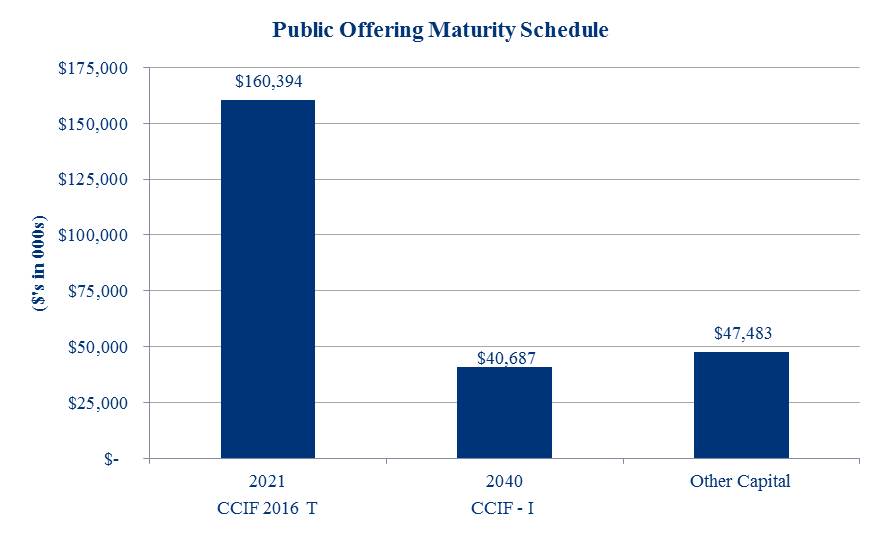
CCIF's publicly offered feeder funds, CCIF 2016 T and CCIF - I, which have committed to seek liquidity events on or before December 31, 2021 and December 31, 2040, respectively, collectively represented 81% of CCIF's total ownership as of June 30, 2017. The following chart shows the liquidity schedule of CCIF's publicly offered feeder funds as of June 30, 2017 based on the net assets of CCIF.
Subsequent Events
In connection with the recent announcement by W. P. Carey Inc., the parent of our Advisor, of its decision to exit retail fundraising and to focus on its core real estate business, the Advisor has decided to resign as investment advisor to CCIF. At a Board Meeting held on August 10, 2017 (the “Board Meeting”), CCIF’s Board of Trustees (the “Board”) accepted the resignation of the Advisor as the CCIF’s investment advisor (the “Advisor Resignation”) to become effective on September 11, 2017 (the “Advisor Resignation Date”) and appointed Guggenheim as CCIF’s interim advisor to become effective on the Advisor Resignation Date (the “Interim Advisor Appointment”). In connection with the Advisor Resignation and the Interim Advisor Appointment, the Board terminated the Investment Sub-Advisory Agreement with Guggenheim to become effective on the Advisor Resignation Date. CCIF’s Board, including all of the Independent Trustees, approved a new investment advisory agreement with Guggenheim (the “New Advisory Agreement”) to become effective upon approval by a majority of CCIF’s outstanding common shares (as defined in the 1940 Act). The Interim Advisor Appointment will terminate upon the earlier to occur of (i) 150 days from the Advisor Resignation Date or (ii) the date CCIF shareholders approve the New Advisory Agreement. At the Board Meeting, the Board set a shareholder meeting date of October 13, 2017 and a record date of August 25, 2017 for CCIF shareholders to consider the approval of the New Advisory Agreement. At the Board Meeting, CCIF’s Board of Trustees also accepted the resignation of Carey Credit Advisors, LLC as CCIF’s (and each Feeder Fund’s) administrator to become effective on the Advisor Resignation Date and appointed Guggenheim as CCIF’s (and each Feeder Fund’s) new administrator to become effective on the Advisor Resignation Date. At the Board Meeting, CCIF’s Board of Trustees also approved the assignment of the Dealer Manager Agreement from Carey Financial, LLC to Guggenheim Funds Distributors, LLC effective immediately.
The Amended and Restated Expense Support and Conditional Reimbursement Agreements, Amended and Restated Organization and Offering Expense Agreements, and the Administrative Services Agreement with Guggenheim are materially unchanged from the prior forms of such agreements.
There are no material differences between the terms of the Interim Investment Advisory Agreement between the Master Fund and Guggenheim approved in connection with the Interim Advisory Appointment and the terms of the prior Investment Advisory Agreement, except for a lower management fee (1.75% of average gross assets) and the inclusion of provisions in the Interim Investment Advisory Agreement which are necessary to comply with the requirements of Rule 15a-4 under the Investment Company Act of 1940, as amended.
In making the Interim Advisor Appointment and approving the New Advisory Agreement, the Board of Trustees, including all of the Independent Trustees, considered a number of factors, including, but not limited to: (i) CCIF's and Guggenheim's performance; (ii) the ability of Guggenheim to maintain continuity in the investment advisory services that have been provided by the Advisor and Guggenheim to CCIF, including Guggenheim's expectation that the key personnel of the Advisor who currently provide services to CCIF (and the Feeder Funds) will continue to provide those services as employees of Guggenheim after the
- 8 -
Advisor Resignation Date; (iii) Guggenheim’s representations that it intends to provide the same or greater scope and quality of investment advisory services to CCIF that it and the Advisor currently provide; (iv) the estimated fees and expenses of CCIF (and, as relevant, the Feeder Funds), including a lower annual management fee of 1.75% of the Master Fund’s average gross assets and continued expense support by Guggenheim with respect to the Funds' dividends payable to shareholders; and (v) Guggenheim's longer-term business goals with regard to the business and operations of the Funds. The Board also considered that the Funds' shareholders will not bear any costs associated with the Interim Advisor Appointment and the proposal to shareholders to approve the New Advisory Agreement. Additional information about the Board's considerations will be provided in CCIF's proxy materials that will be distributed in connection with the shareholder meeting to consider the approval of the New Advisory Agreement.
About Carey Credit Income Fund
CCIF is a non-traded business development company ("BDC") that invests primarily in large, privately negotiated loans to private middle market U.S. companies. CCIF is the master fund which pools investor capital raised through its feeder fund offerings, such as CCIF - I and CCIF 2016 T. CCIF is managed by affiliates of WPC and Guggenheim and is designed to provide investors with current income, capital preservation, and, to a lesser extent, capital appreciation. CCIF and its feeder fund offerings share the same investment objectives and strategies and all portfolio investments and corporate borrowings are held at CCIF.
About W. P. Carey Inc.
Founded in 1973, WPC (NYSE: WPC) is a leading, internally-managed net-lease real estate investment trust that provides real estate-based financing solutions for companies primarily in the U.S. and Europe. WPC has expertise in credit and real estate underwriting, with more than 35 years of experience in evaluating credit and real estate investment opportunities. A capital provider to growing U.S. companies since its inception, WPC had an enterprise value of approximately $11.2 billion at June 30, 2017. In addition to its owned portfolio of diversified global real estate, WPC manages a series of non-traded publicly registered investment programs with assets under management of approximately $13.2 billion. WPC is subject to the information and reporting requirements of the Exchange Act. As a result, it files periodic reports and financial statements with the SEC, copies of which are available on the SEC's website at www.sec.gov.
For four decades, WPC has provided companies around the globe with capital to expand their businesses, make acquisitions, invest in research and development, or fund other corporate initiatives. Its corporate finance-focused credit and underwriting process is a constant that has been leveraged across a wide variety of companies and industries. WPC's investment process has largely focused on identifying companies with stable and improving credit profiles using a top-down and bottom-up approach, without relying on outside rating agencies. Credit-quality characteristics, capital structure, operating history, margin and ratio analysis, industry market share, and management team are all key considerations in evaluating and determining investment suitability of potential credits.
About Guggenheim Partners, LLC
Guggenheim Investments represents the investment management businesses of Guggenheim Partners and includes Guggenheim, an SEC-registered investment adviser. Guggenheim Partners is a privately-held, global financial services firm with over 2,300 employees and more than $260 billion in assets under management as of June 30, 2017. It produces customized solutions for its clients, which include institutions, governments and agencies, corporations, insurance companies, investment advisors, family offices, and individual investors.
Guggenheim Investments manages more than $237 billion in assets across fixed income, equity, and alternatives as of June 30, 2017. Its 120+ investment professionals perform research to understand market trends and identify undervalued opportunities in areas that are often complex and underfollowed. This approach to investment management has enabled Guggenheim to deliver long-term results to its clients.
Within Guggenheim Investments is the Guggenheim Corporate Credit Team, which is responsible for all corporate credit strategies and asset management of $85.3 billion. A unified credit platform is utilized for all strategies and is organized by industry as opposed to asset class, which increases its ability to uncover relative value opportunities and to identify and source opportunities. The scale of the platform, combined with the expertise across a wide range of industries and in-house legal resources, allows Guggenheim to be a solution provider to the market and maintain an active pipeline of investment opportunities.
Cautionary Statement Concerning Forward-Looking Statements
This document contains forward-looking statements within the meaning of the Federal securities laws. These statements are not guarantees of future performance and are subject to risks, uncertainties and other factors, some of which are beyond our control, are difficult to predict and could cause actual results to differ materially from those expressed or forecasted in the forward-looking statements. CCIF, CCIF - I, and CCIF 2016 T undertake no obligation to update any forward-looking statements contained
- 9 -
herein to conform the statements to actual results or changes in their expectations. A number of factors may cause CCIF’s, CCIF - I's and CCIF 2016 T's actual results, performance or achievement to differ materially from those anticipated. For further information on factors that could impact CCIF, CCIF - I, and CCIF 2016 T performance, please review CCIF’s, CCIF - I's, and CCIF 2016 T's respective filings at the SEC website at www.sec.gov.
- 10 -