Attached files
| file | filename |
|---|---|
| EX-99.1 - EXHIBIT 99.1 - ROYAL GOLD INC | v472867_ex99-1.htm |
| 8-K - 8-K - ROYAL GOLD INC | v472867_8k.htm |
Exhibit 99.2

Fiscal 2017 Full Year and Fourth Quarter Results Royal Gold, Inc. August 10, 2017

2 August 10, 2017 Cautionary Statement NASDAQ: RGLD This presentation contains certain forward - looking statements within the meaning of the Private Securities Litigation Reform Act of 1995 . Such forward - looking statements involve known and unknown risks, uncertainties, and other factors that could cause actual results to differ materially from the projections and estimates contained herein and include, but are not limited to : sequential growth catalyst and estimated production at Rainy River, Cortez Crossroads and Peñasquito Pyrite Leach in calendar 2017 , 2018 and 2019 ; estimated revenue and percentages of future revenue expected from the Company’s stream and royalty portfolio in the aggregate ; expected timing for commissioning of the Rainy River project ; expected start - up date for Cortez Crossroads ; expected start - up date for and estimated production from the Pyrite Leach project ; estimated production at each of Rainy River, Cortez Crossroads and the Pyrite Leach project ; the expected increase in the gold stream rate at Wassa and Prestea in calendar year 2018 ; improving throughput and recovery at Mount Milligan ; forecast effective tax rate, depreciation, depletion and amortization, interest expense and debt repayments for fiscal year 2018 ; forecast gold equivalent ounces and compounded annual growth rate between fiscal year 2017 and fiscal year 2020 ; mine life and reserves estimates and forecasts of throughput, recoveries and production from the operators of our stream and royalty interests ; and the lack of additional funding requirements . Factors that could cause actual results to differ materially from these forward - looking statements include, among others : the risks inherent in the operation of mining properties ; a decreased price environment for gold and other metals on which our stream and royalty interests are determined ; performance of and production at properties, and variation of actual production from the production estimates and forecasts made by the operators of those stream and royalty properties from fiscal 2017 to fiscal 2020 ; decisions and activities of the Company’s management affecting margins, use of capital and changes in strategy ; unexpected operating costs, decisions and activities of the operators of the Company’s stream and royalty properties ; changes in operators’ mining and processing techniques or stream or royalty calculation methodologies ; resolution of regulatory and legal proceedings ; unanticipated grade, geological, metallurgical, environmental, processing or other problems at the properties ; revisions or inaccuracies in technical reports, reserve, resources and production estimates ; changes in project parameters as plans of the operators are refined ; the results of current or planned exploration activities ; errors or disputes in calculating stream deliveries and royalty payments, or deliveries or payments under stream or royalty agreements ; the liquidity and future financial needs of the Company ; economic and market conditions ; the impact of future acquisitions and stream and royalty financing transactions ; the impact of issuances of additional common stock ; and risks associated with conducting business in foreign countries, including application of foreign laws to contract and other disputes, environmental laws, enforcement and uncertain political and economic environments . These risks and other factors are discussed in more detail in the Company’s public filings with the Securities and Exchange Commission . Statements made herein are as of the date hereof and should not be relied upon as of any subsequent date . The Company’s past performance is not necessarily indicative of its future performance . The Company disclaims any obligation to update any forward - looking statements . Third - party information : Certain information provided in this presentation has been provided to the Company by the operators of properties subject to our stream and royalty interests, or is publicly available information filed by these operators with applicable securities regulatory bodies, including the Securities and Exchange Commission . The Company has not verified, and is not in a position to verify, and expressly disclaims any responsibility for the accuracy, completeness or fairness of such third - party information and refers readers to the public reports filed by the operators for information regarding those properties .

Today’s Speakers Tony Jensen President and CEO Stefan Wenger CFO and Treasurer 3 NASDAQ: RGLD August 10, 2017
FY 2017 Highlights 4 August 10, 2017 NASDAQ: RGLD Record revenue Record cash flow from operations Record volume Record dividends Repayment of $95 million of debt >$850 million of liquidity No capital commitments Sequential growth catalysts already bought and paid for: » Rainy River (CY 2017) » Cortez Crossroads (CY 2018) » Peñasquito Pyrite Leach (CY 2019)
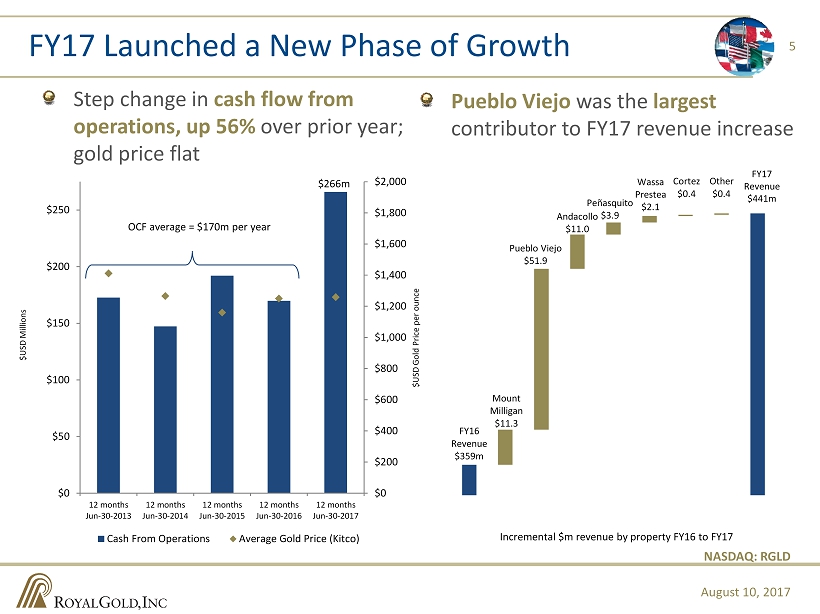
FY16 Revenue $359m Mount Milligan $ 11.3 Pueblo Viejo $51.9 Andacollo $11.0 Peñasquito $3.9 Wassa Prestea $ 2.1 Cortez $0.4 Other $ 0.4 $0 $200 $400 $600 $800 $1,000 $1,200 $1,400 $1,600 $1,800 $2,000 $0 $50 $100 $150 $200 $250 12 months Jun-30-2013 12 months Jun-30-2014 12 months Jun-30-2015 12 months Jun-30-2016 12 months Jun-30-2017 Cash From Operations Average Gold Price (Kitco) Step change in cash flow from operations, up 56% over prior year; gold price flat 5 FY17 Launched a New Phase of Growth NASDAQ: RGLD $USD Millions OCF average = $170m per year $266m $USD Gold Price per ounce August 10, 2017 Pueblo Viejo was the largest contributor to FY17 revenue increase FY17 Revenue $441m Incremental $m revenue by property FY16 to FY17

6 39 Operating Properties Continue to Perform 1 Attributable to Barrick . Please see Barrick’s press release dated July 26, 2017. 2 Please see Golden Star Resources’ press release dated August 1, 2017. 3 Production of which 91,000 to 101,000 ounces of gold and 10 - 12 million pounds of copper expected to be delivered to Royal Gold. Please see Centerra Gold’s press release dated August 1, 2017. Due to timing between production and concentrate shipments, Royal Gold expects to receive gold and copper produced in the qua rte r ended December 31, 2017 in mid - calendar 2018. 4 Based on current public forecasts from the operators, where available, current metals prices, and no changes to our existing portfolio. Forecasts and estimates are subject to risks and uncertainties including but not limited to those described on slide 2. NASDAQ: RGLD » ABX reiterated CY17 gold production guidance of 625 - 650koz 1 » Higher throughput and higher gold recovery in CQ2 » New bio - leach and flotation opportunities being tested » GSR reiterated CY17 gold production guidance of 255 - 280koz 2 » Prestea Underground commercial production expected CQ4 2017 » Streaming Interest expected to increase to 10.5% in CY18 2 » CG reiterated CY17 gold production guidance, low end of 260 - 290koz 3 » C opper stream began deliveries in April 2017 » Throughput and recovery improving » Royal Gold’s overall revenue profile expected to remain ~85% precious metals 4 Wassa & Prestea Mount Milligan Pueblo Viejo August 10, 2017 Mount Milligan FY18 - FY20 Average Estimated Annual Revenue, Portfolio - Wide Precious Metals, 85% Non - Precious Metals, 15%

FQ4 Revenue of $ 109M Effective tax rate of 31% for FQ4 and 22% for FY17 » Q4 increase due to stronger $CAD which impacted valuation of Canadian deferred tax liabilities vs $USD » FY18 effective tax rate forecast range is 20% - 25% FY17 DD&A of ~$ 455 per GEO » FY18 DD&A forecast range is $450 - $500 per GEO Strong liquidity of >$850 million Focus on using free cash flow to reduce debt No additional funding requirements 1 7 FQ4 Financial Results and FY18 Outlook NASDAQ: RGLD August 10, 2017 1 Assuming no changes to our existing portfolio. Date Item ($USD millions) June 30, 2017 Undrawn Revolver $750m June 30, 2017 Working Capital $109m June 30, 2017 Total Available Liquidity $859m Additional Near Term Commitments $0

Upcoming Catalysts Sequential growth catalyst in each of calendar 2017, 2018, and 2019 Peñasquito Mount Milligan Enhancements M ount Milligan Enhancements 8 Pueblo Viejo – Potential Resource Conversion Wassa Underground Development Peñasquito Peñasquito Pyrite Leach Project NASDAQ: RGLD Peñasquito Pyrite Leach Project R ainy River Ball & SAG Mill R ainy River Conveyor & Process Plant » New Gold: First production expected September 2017 1 » Stream on 6.5% of gold and 60% of silver 1 » 3.9Moz gold in reserves; 10Moz silver in reserves 1,2 » Barrick: CY18 startup expected 1 and stripping underway » 4.5% NVR & 5% GSR royalty 2 » 2.7Moz gold in reserves 1 » Goldcorp: Early CY19 startup currently expected 1 » Progress at 6/30/17: construction 14%, engineering 94% 1 » Est. annual production of 100 - 140koz gold and 4 - 6Moz silver 1 Rainy River - 2017 Cortez Crossroads - 2018 Peñasquito Leach - 2019 1 Information has been provided to the Company by the operators of those properties or is publicly available information filed by these ope rat ors with applicable securities regulatory bodies, including the Securities and Exchange Commission. The Company has not verified, and is not in a position to verify, and expressly discl aim s any responsibility for the accuracy, completeness or fairness of such third - party information and refers readers to the public reports filed by the operators for information regarding those properties. 2 See slide 12 for details on the scope of Royal Gold’s streaming and royalty interests. August 10, 2017

Closing Remarks 9 August 10, 2017 Record revenue Record cash flow from operations Record volume Record dividends Repayment of $95 million of debt >$850 million of liquidity No capital commitments Sequential growth catalysts already bought and paid for: » Rainy River (CY 2017) » Cortez Crossroads (CY 2018) » Peñasquito Pyrite Leach (CY 2019) NASDAQ: RGLD

1660 Wynkoop Street, #1000 Denver, CO 80202 - 1132 303.573.1660 info @royalgold.com www.royalgold.com
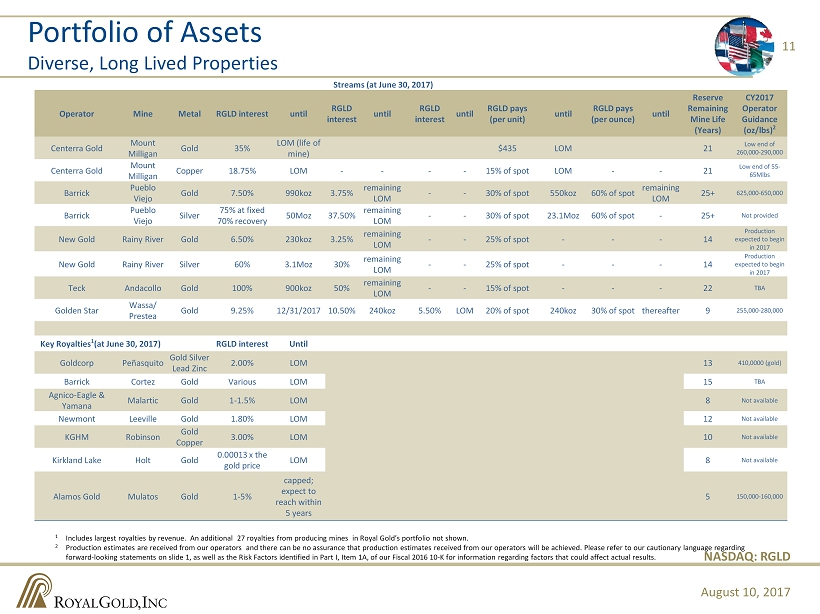
Portfolio of Assets Diverse, Long Lived Properties Streams (at June 30, 2017) Operator Mine Metal RGLD interest until RGLD interest until RGLD interest until RGLD pays (per unit) until RGLD pays (per ounce) until Reserve Remaining Mine Life (Years) CY2017 Operator Guidance (oz/ lbs ) 2 Centerra Gold Mount Milligan Gold 35% LOM (life of mine) $435 LOM 21 Low end of 260,000 - 290,000 Centerra Gold Mount Milligan Copper 18.75% LOM - - - - 15% of spot LOM - - 21 Low end of 55 - 65Mlbs Barrick Pueblo Viejo Gold 7.50% 990koz 3.75% remaining LOM - - 30 % of spot 550koz 60 % of spot remaining LOM 25+ 625,000 - 650,000 Barrick Pueblo Viejo Silver 75 % at fixed 70% recovery 50Moz 37.50% remaining LOM - - 30% of spot 23.1Moz 60% of spot - 25+ Not provided New Gold Rainy River Gold 6.50% 230koz 3.25% remaining LOM - - 25 % of spot - - - 14 Production expected to begin in 2017 New Gold Rainy River Silver 60% 3.1Moz 30% remaining LOM - - 25% of spot - - - 14 Production expected to begin in 2017 Teck Andacollo Gold 100% 900koz 50% remaining LOM - - 15% of spot - - - 22 TBA Golden Star Wassa / Prestea Gold 9.25% 12/31/2017 10.50% 240koz 5.50% LOM 20 % of spot 240koz 30 % of spot thereafter 9 255,000 - 280,000 Key Royalties 1 (at June 30 , 2017) RGLD interest Until Goldcorp Peñasquito Gold Silver Lead Zinc 2.00% LOM 13 410,0000 (gold) Barrick Cortez Gold Various LOM 15 TBA Agnico - Eagle & Yamana Malartic Gold 1 - 1.5% LOM 8 Not available Newmont Leeville Gold 1.80% LOM 12 Not available KGHM Robinson Gold Copper 3.00% LOM 10 Not available Kirkland Lake Holt Gold 0.00013 x the gold price LOM 8 Not available Alamos Gold Mulatos Gold 1 - 5% capped; expect to reach within 5 years 5 150,000 - 160,000 11 1 Includes largest royalties by revenue. An additional 27 royalties from producing mines in Royal Gold’s portfolio not shown . 2 Production estimates are received from our operators and there can be no assurance that production estimates received from our operators will be achieved. Please refer to our cautionary langua ge regarding forward - looking statements on slide 1, as well as the Risk Factors identified in Part I, Item 1A, of our Fiscal 2016 10 - K for information regarding factors that could affect actual results. NASDAQ: RGLD August 10, 2017