Attached files
| file | filename |
|---|---|
| 8-K - 8-K - HYSTER-YALE MATERIALS HANDLING, INC. | d438775d8k.htm |
 Investor Presentation
August 10, 2017
Exhibit 99 Solutions Productivity that DRIVE |
 2 Safe Harbor Statement & Disclosure This presentation includes forward-looking comments subject to important risks
and uncertainties. It may also contain financial measures that are not
in conformance with accounting principles generally accepted in
the United States of America (GAAP).
Refer to Hyster-Yale’s reports filed on Forms 8-K (current),
10-Q (quarterly), and 10-K (annual) for information on
factors that could cause actual results to differ materially from
information in this presentation and for information reconciling
financial measures to GAAP. Past performance may not be representative
of future results.
Guidance noted in the following slides was effective as of the company’s
most recent
earnings release and conference call (August 2, 2017). Nothing in this presentation should be construed as reaffirming or disaffirming such guidance.
This presentation is not an offer to sell or a solicitation of offers to buy
any of Hyster- Yale’s securities.
Solutions Productivity that DRIVE |
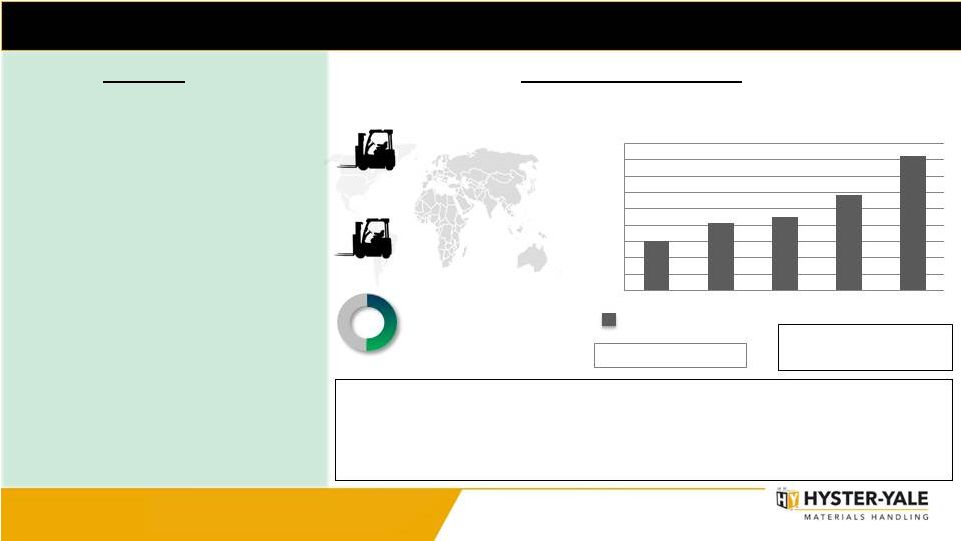
 3 Hyster-Yale at a Glance Hyster-Yale Materials Handling, Inc. (NYSE:HY) is a leading globally integrated, full-line lift truck manufacturer
offering a broad array of solutions aimed at meeting the specific materials
handling needs of its customers.
_____________________
(1) Bolzoni’s financial results include pre-tax charges of $2.7 million of one-time purchase accounting adjustments and $6.2 million of
depreciation and amortization on acquired assets.
(2) EBITDA and ROTCE are non-GAAP measures and should not be considered in isolation or as a substitute for GAAP measures.
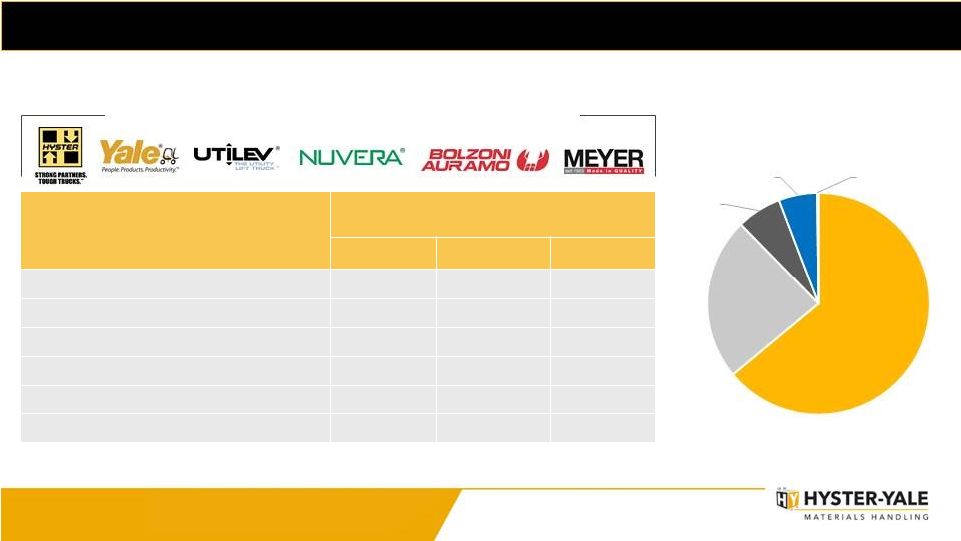
See non-GAAP explanations and the related reconciliations to GAAP measures in the Financial Appendix starting on page 26. Key Metrics In millions (except employee data) LTM 6/30/17 Lift Truck Nuvera Bolzoni Revenue $2,561.1 $5.0 $160.2 Net Income (loss) $86.2 $(27.2) $1.0 (1) EBITDA (2) $139.0 $(43.5) $14.6 ROTCE (2) (Net debt basis) 20.1% n/m n/m (1) Net Debt at end of period $29.2 n/m $31.3 Approximate # of Employees (globally) 5,600 200 800 LTM 6/30/17 Sales by Segment Separate lift truck, attachment and hydrogen power segments Solutions Productivity that DRIVE Americas 64.0% EMEA 23.7% JAPIC 6.5% Bolzoni 5.6% Nuvera 0.2% |
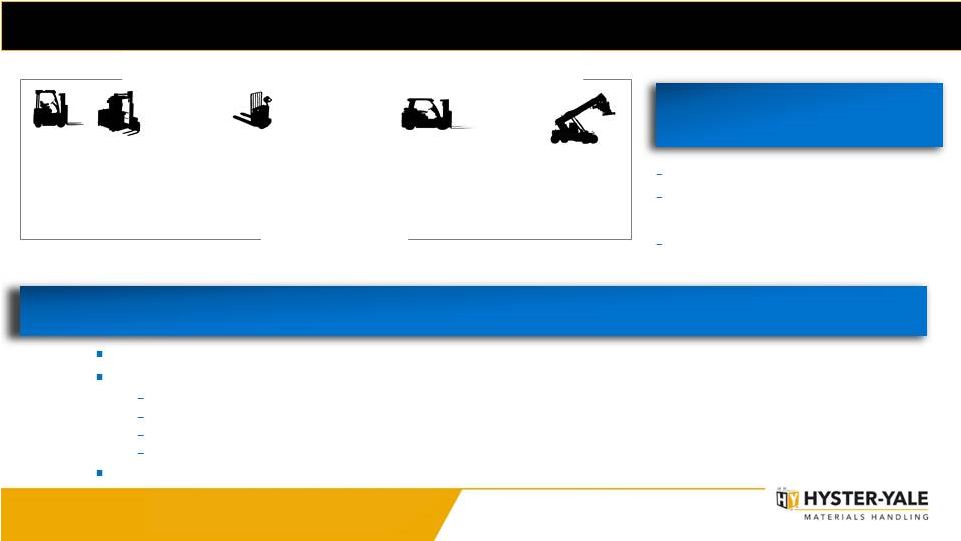
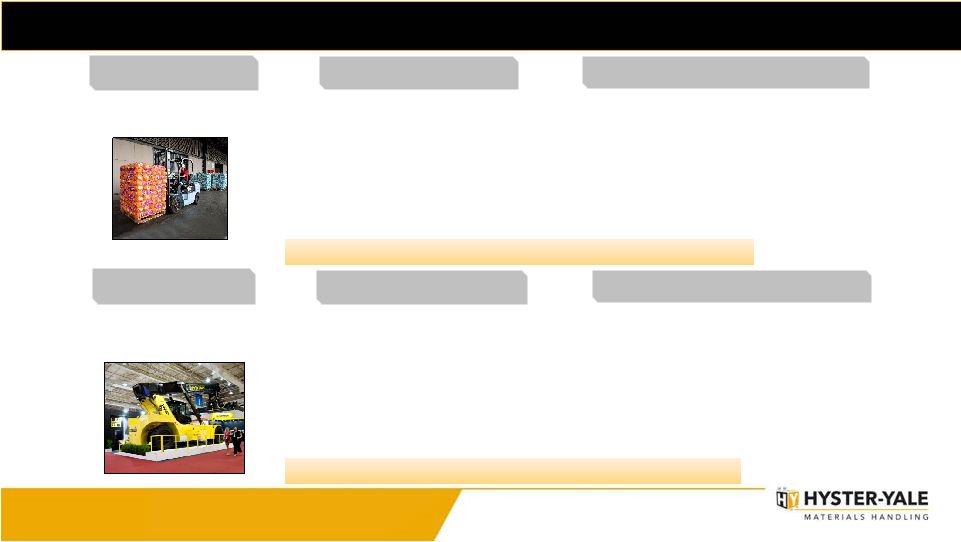
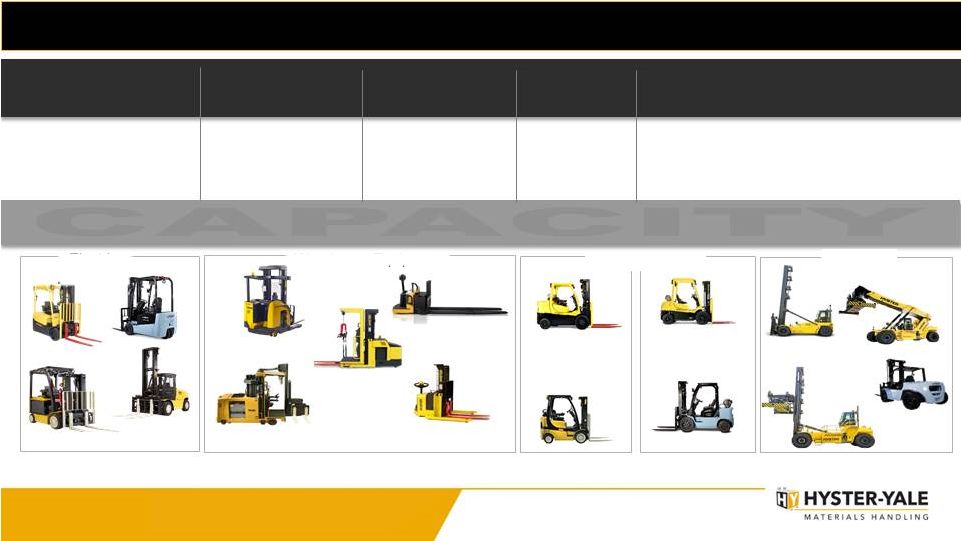 4 4 Forklifts Internal Combustion Engine Lithium-Ion Reach Stackers Big Trucks Very Narrow Aisle Trucks Hyster-Yale is a Full-Line Lift Truck Supplier… Electric Counterbalanced Rider Trucks Electric Narrow Aisle Trucks Electric Hand Trucks Internal Combustion Engine (cushion tire) Internal Combustion Engine (pneumatic tire) 3 wheel Electric 4 wheel Electric Pallet Trucks Stackers Order Pickers Reach Trucks Empty / Laden Warehouse Equipment Warehouse Equipment Over 280 different truck models available Electric CB Electric CB Container Handlers Internal Combustion Engine Counterbalance 1.0T to 5.5T 1.5T to 6.0T 1.5T to 8.0T 1.0T to 7.0T 1.0T to 52.0T CLASS 1 CLASS 2 CLASS 3 CLASS 4 CLASS 5 Solutions Productivity that DRIVE |
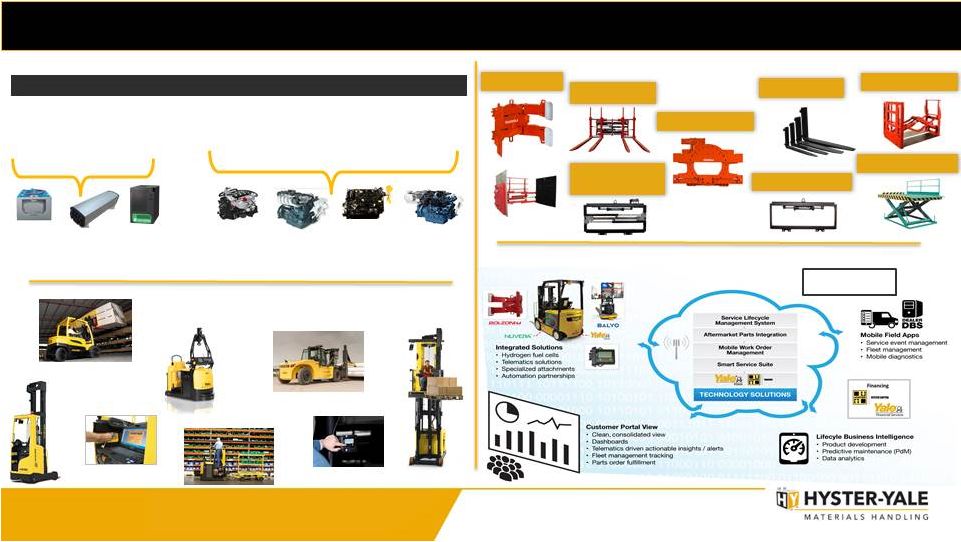 Solutions Productivity that DRIVE 5 …with a Broad Range of Power Options, Attachments and Solutions Electric Counterbalanced Rider Trucks Electric Narrow Aisle Trucks Electric Hand Trucks Internal Combustion Engine (cushion tire) Internal Combustion Engine (pneumatic tire) CLASS 1, 2 & 3 Lead-Acid Battery Fuel-Cell Engine LPG & Bi-fuel Diesel Tier 3 / Stage III LPG & CNG Diesel Tier 4 / Stage IV Lithium-ion Battery CLASS 4 & 5 Power Options 55,000+ assets under management Technology Architecture Solutions Attachments Clamps Multipallets Rotators Sideshifters Fork Positioners Push Pulls Lifting Tables Forks |
 Solutions Productivity that DRIVE 6 Five Key Perspectives to Emphasize Global market unit levels expected to be relatively strong at a high level for next several years Strong recovery underway in key markets and segments that have been depressed 7% operating margin at properly balanced HY factory-produced 115,000 units in this cycle remains Lift Truck business target Programs needed to achieve Lift Truck business target in place; timing of results cannot be forecast with specificity Recent investments reinforce position in Lift Truck business and speed achievement to targeted 115,000 units |
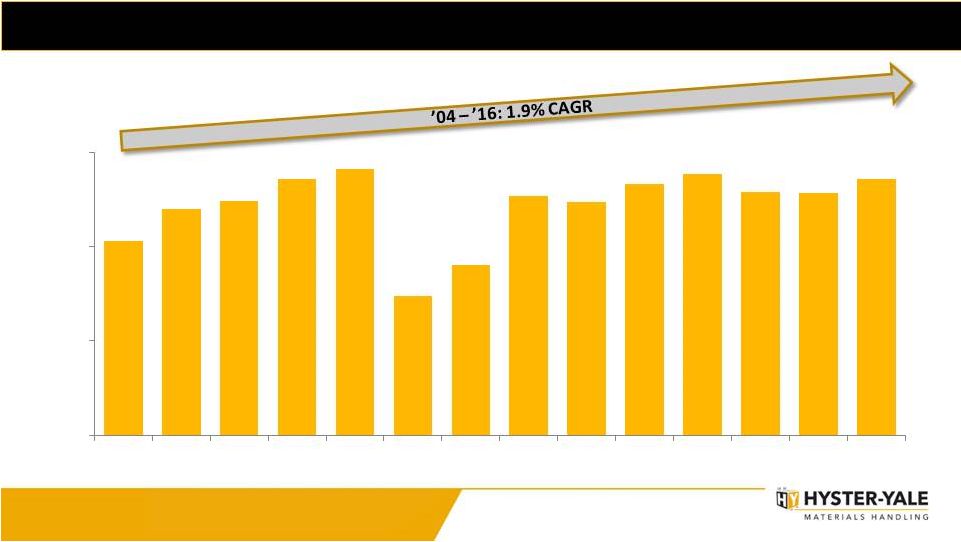
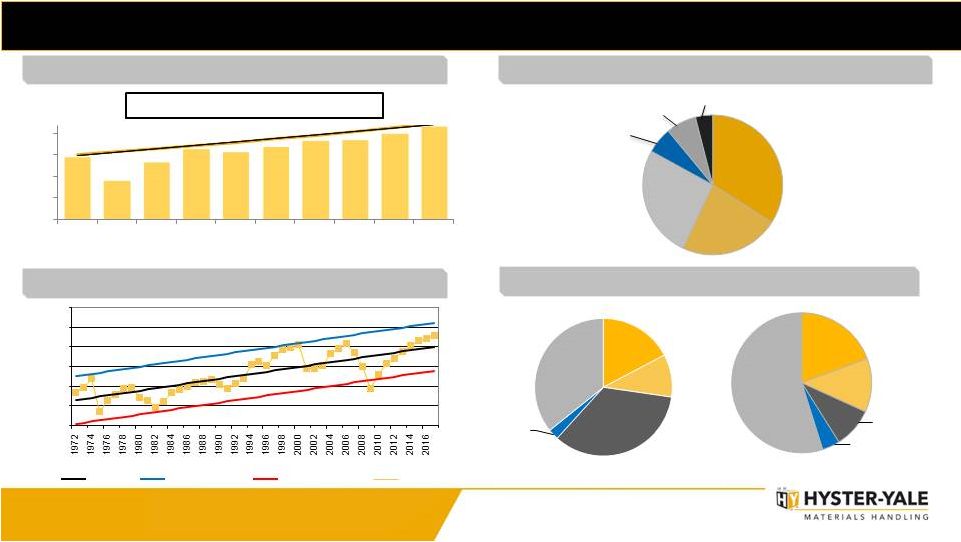 Solutions Productivity that DRIVE 7 Lift Truck Industry Overview (units in thousands) Global Lift Truck Industry Size _____________________ Trend line represents 4.4% long-term CAGR Average Industry Size. Source: WITS. Represents order intake.
North America Retail Lift Truck Below Peak Trend
Long-term CAGR (2004 –
2016) = 4.4% Lift Truck Industry
– Unit Distribution by Class
_____________________
Source: WITS. LTM 6/30/17
Orders Reports.
ICE = Internal Combustion Engine
Total Industry = 1,286k Units
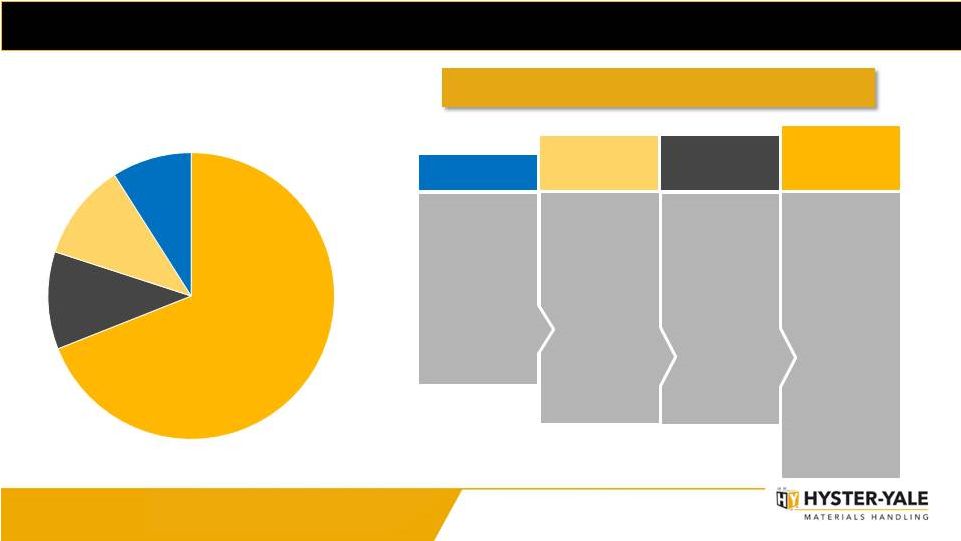
Class 4 ICE 4% Market Size - $ _____________________ Source: Internal Company estimates Market Size - Units Class 5 ICE 55% Class 1 Electric 19% Class 2 Electric 13% Class 3 Electric 9% Estimated Industry Revenue Mix _____________________ Source: WITS. LTM 6/30/17 Orders Reports. Global Lift Truck Industry Breakdown (Units) Trend Upper
Limit Lower Limit NA 872 547 794 975 944 1,010 1,094 1,100 1,182 1,286 0 300 600 900 1,200 2008 2009 2010 2011 2012 2013 2014 2015 2016 LTM Q2 2017 Europe 34% Americas 23% China 26% Japan 6% Asia-Pacific 7% Middle East & Africa 4% - 50,000 100,000 150,000 200,000 250,000 300,000 _____________________ Source: ITA. Represents order intake. Class 1 Electric 17% Class 2 Electric 10% Class 3 Electric 34% Class 4 ICE 3% Class 5 ICE 36% |
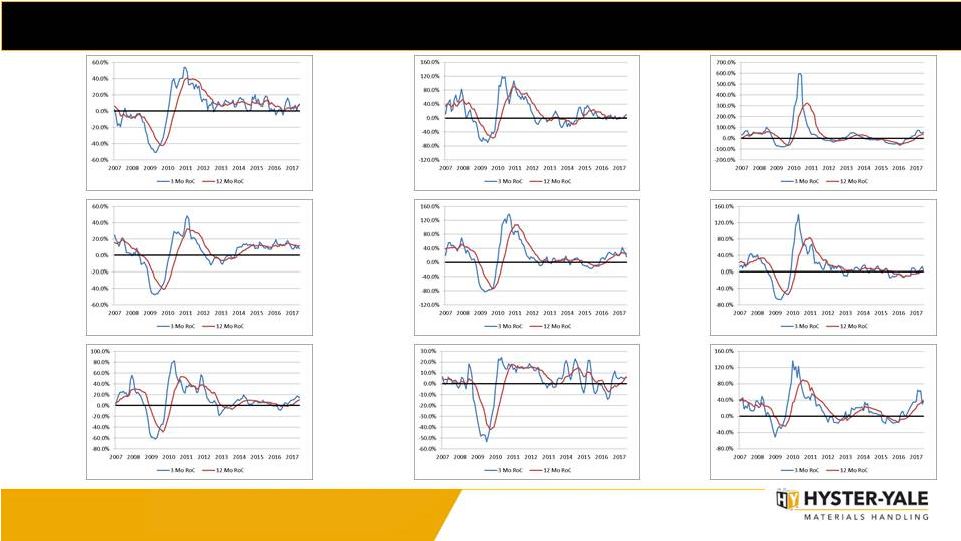 Solutions Productivity that DRIVE 8 Japan Western Europe Eastern Europe Brazil North America Middle East & Africa Latin America (excluding Brazil) Asia (excluding China & Japan) China ( 3 & 12 months rate of change trend) Global Lift Truck Market Rates of Change _____________________ Source: WITS. Bookings Reports. |
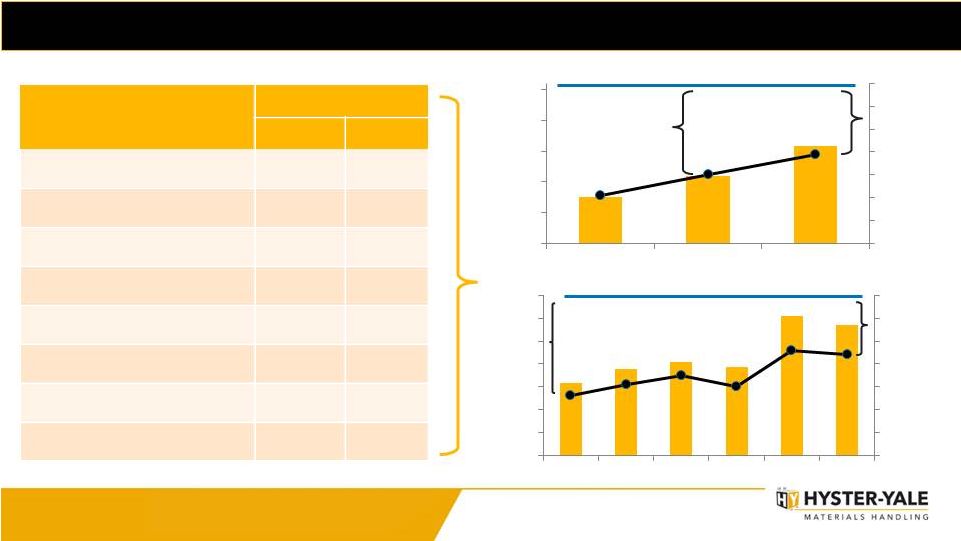 Solutions Productivity that DRIVE 9 A Positive Profitability Trend ($ in millions) 7% OPERATING PROFIT MARGIN TARGET 4.0% Gap 3.1% Gap Key Variables Impacting Performance Impact on HY 2016 2017 Market Cycle by Country _ + Market Size by Industry _ + Market Size by Product _ = / + Commodity Prices = _ Pricing _ + Strength of Dollar _ - / = Operational Effectiveness = + Core SG&A Expenses _ = ($ in millions) 4.4% Gap 2.6% Gap 7% OPERATING PROFIT MARGIN TARGET Prior Cycle Market Peak $57.5 $74.6 $99.0 2.1% 3.0% 3.9% 0.0% 1.0% 2.0% 3.0% 4.0% 5.0% 6.0% 7.0% $20.0 $45.0 $70.0 $95.0 $120.0 $145.0 2007 2016 LTM Q2 2017 $15.8 $19.0 $20.5 $19.3 $30.6 $28.6 2.6% 3.1% 3.5% 3.0% 4.6% 4.4% 0.0% 1.0% 2.0% 3.0% 4.0% 5.0% 6.0% 7.0% $- $5.0 $10.0 $15.0 $20.0 $25.0 $30.0 $35.0 Q1 16 Q2 16 Q3 16 Q4 16 Q1 17 Q2 17 |
 10 Solutions Productivity that DRIVE Volume of 115,000 Units from HY Factories Required to Achieve 7% Target 7,300 Class 1 and 2 trucks 550 Big Trucks Additional units to fill each assembly line 32,400 additional units needed to achieve target Note: 115,000 units does not include volume from non-HY manufacturing plants Increasing unit product profit Decreasing manufacturing variances Leveraging relatively stable SG&A …should increase operating profits to target levels by: 13,250 Class 3 trucks 11,300 Class 4 and 5 trucks Volume increasing based on strong market and share gain programs
Share gain programs gaining traction
Developing relationships with new customers takes time
New customers often test and phase in products
New dealers and dealer improvement programs take time
New products take time to reach full acceptance
All projects tracked – at different stages of maturity Our objective is to sell 115,000 HY-produced units in 2018, but a more realistic timeframe may be 2019-2020
|
 11 Share Gain Drives Our Economic Engine Basic Business Areas Our strategies are designed to drive increased share, which in turn increases the lift truck population, which drives parts and service volumes. Geographic and Product Balance Worldwide Distribution Strength to Drive Market Share Parts and Service Volume Large Lift Truck Population in Service Volume Economies of Scale Design Component Commonality Supply Chain Manufacturing Quality Marketing Parts Infrastructure Capital Requirements Improve Warehouse Position Enhance Independent Distribution Succeed in Asia Enhance Big Truck Market Position Strengthen the Sales and Marketing Organization Low Cost of Ownership Understand Customer Needs Hyster-Yale’s economic engine is driven by increasing unit volume and economies of scale. Core strategic initiatives were
designed to drive the economic engine by increasing
share... Leverage Solutions
and Technology
Drivers A large lift truck population base drives parts and service volume resulting in enhanced profitability for Hyster-Yale and
dealers Solutions
Productivity that DRIVE |
 12 Hydrogen-Powered Lift Truck Advantages & Opportunities • Constant power • As quick as 3 minute refuel • Operator productivity gains • Environmentally clean • No batteries / battery charging rooms Lead to Lower Cost of Ownership Population of Fuel Cell Powered Lift Trucks in North America DOE Hydrogen and Fuel Cells Program Record Record #: 17003 Date: 5/25/2017
Benefits Growth Opportunities Strategy: • Establish production of “best in class” fuel cells for material handling industry
• Engage strength of existing global lift truck distribution network to increase penetration of the
fuel cell market through converting existing fuel cell users, increasing
penetration of existing lead-acid battery users and building
new markets with existing ICE truck users Trend in population of
fuel cell powered lift trucks in North America
expected to continue
25-50%
Estimated up to
can benefit from
Fuel cell solutions
700,000+
electric trucks sold
per year Global N. America electric trucks sold per year 150,000+
Solutions Productivity that DRIVE - 2,000 4,000 6,000 8,000 10,000 12,000 14,000 16,000 18,000 2012 2013 2014 2015 2016 DOE reported N. America |
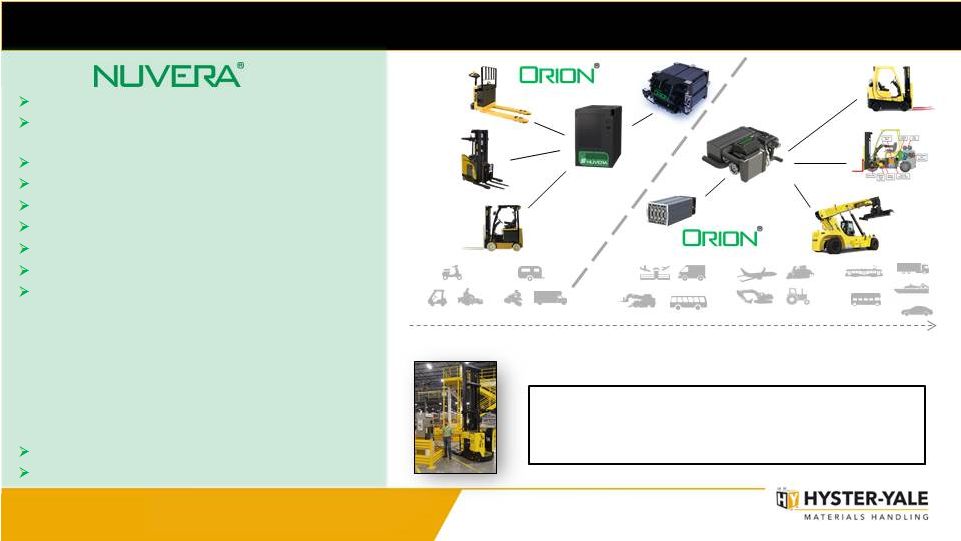 The Nuvera Story Gen1 Drop-In BBR / Integrated Solution Gen2 Fuel Cell Hybrid Truck Engine / Integrated Solution Approximate Engine Power Requirement [kW]
1-3 3-10 10-20 20-30 30-50 50-150 Purchased for a small investment Investing pre-tax expense dollars to commercialize fuel cell technology Solutions span Hydrogen Value Chain Strong IP / Patent portfolio Pipeline of new technologies Rapid usage development in major user fleets Provides strong base for entry into other industries Strong interest from OEM’s Nuvera’s association with HY provides: • Industry and customer expertise • Leverage strong distribution channels • Financial stability • Financing options through HYG Financial Services • Product validation process • Supply chain leverage and expertise • Simplified transaction – single supplier No longer one player niche market Growing core power source alternative for lift trucks The Story Q3 2016 Shipment to Launch Customer • 39 Nuvera® Class I, II, III fuel cell units for Hyster® truck fleet
• Nuvera® on-site hydrogen generation • Hydrogen fuel cells an integral part of sustainability initiative Solutions Productivity that DRIVE 13 |
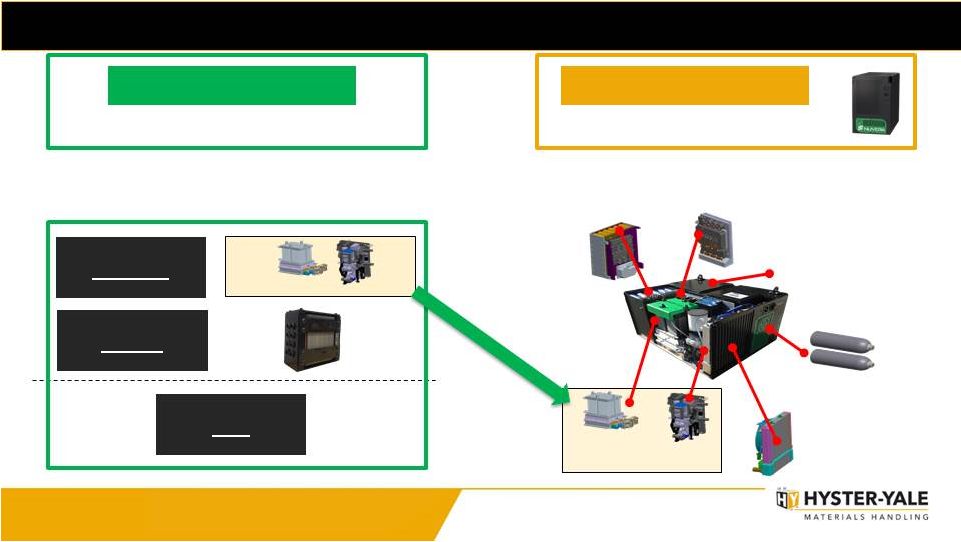 Business Reconfiguration –
Fuel Cells ECP STACK ENGINE BBR/Integrated Solution for Vehicle Stack Sub-System Engine Components Fuel Cell Engine Design, manufacture and sales/marketing of battery-box replacements (BBR) and integrated engine solutions Design, manufacture and sales/marketing of fuel cell stacks and engines, and continued development of hydrogen generation appliance and electrochemical package (ECP) Power Electronics Hybrid Power System Stack Sub- System Engine Components Hydrogen Storage Thermal Management Fuel Cell Engine Enclosure and Counterweight LIFT TRUCK BUSINESS Fuel Cell Stacks & Engines and ECP NUVERA BUSINESS Solutions Productivity that DRIVE 14 |
 Solutions Productivity that DRIVE 15 The Nuvera Plan 2018 + Complete product line up of Battery Box Replacements (BBRs) Ramp up in production of BBR and integrated solutions at Greenville, NC plant to
meet anticipated expanding demand
Continued focus on reducing cost of product to target costs and achieving
targeted fuel cell engine volumes
Launch of Orion® 2 fuel cell stack with increased power density, measured by both volume and weight, as well as lower cost Expansion into EMEA and JAPIC markets Execute partner opportunities Achieve break-even per quarter at target margins sometime in 2018, possibly 2019
Profitability at /above HY target economics over longer term
Launch integrated fuel cell engine solution beyond 2019
Launch of hydrogen compressor technology (improved reliability, smaller
footprint, quiet and efficient) beyond 2020
|
 Bolzoni Bolzoni is one of the worldwide leading manufacturers of lift truck attachments, forks and lift tables with an extensive product range LTM Q2 2017 Sales by Region • Managed as separate business segment • Separation to maintain OEM information integrity 2016 CUSTOMER MIX Lift Truck Manufacturers Dealers of Lift Trucks & Material Handling MARKET – INDUSTRIES Logistics
Automotive Food & Beverage Pulp &
Paper Appliances & Electronics Other
Material Handling Synergy Opportunities
Stand-Alone Supplier
Preferred supplier to HY
Arms-length sales
Commercial confidentiality Key supplier partner Purchasing leverage Broader market access Part of Hyster-Yale Growth of Attachment Business in Americas • Leveraging HY strength in core industries Component resourcing and purchasing leverage Bolzoni as global supplier of forks & basic attachments to HY globally • Convert business from other suppliers to Bolzoni • Reduce purchase price of core components • HY leverage of available Bolzoni manufacturing capacity EMEA 74.3% America 20.3% JAPIC 5.4% 34% 66% Solutions Productivity that DRIVE 16 – OEM |
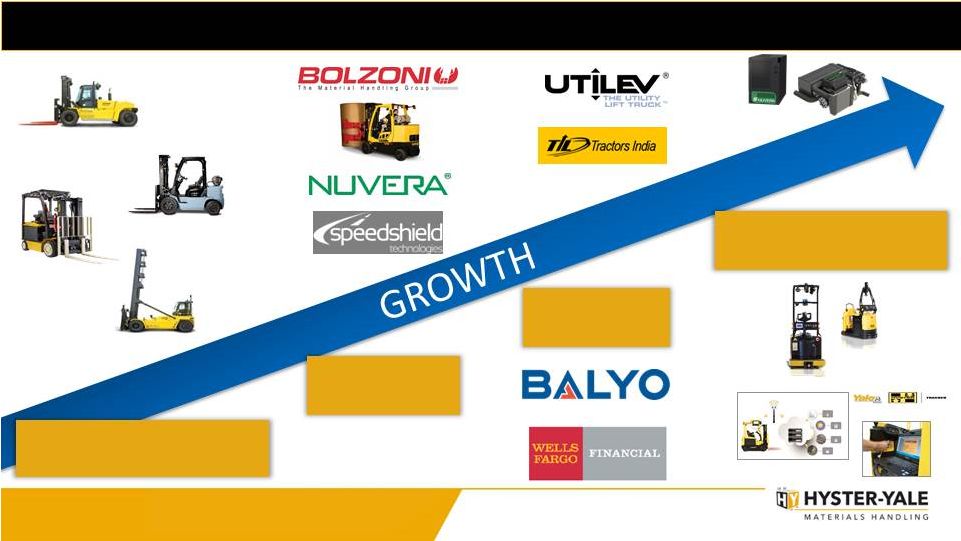 Solutions Productivity that DRIVE 17 HY Path for Future Growth Includes Other Important Elements… Through Core Lift Truck Business Share Gain Through Acquisition Through Partnership Through Investment in New Technologies Fuel Cells Automation Telematics |
 Strategy Roadmap for Share Gain Through New Account Acquisition
Facilitating Structures
• Account Identification teams in each region • New CRM/CPQ global tool • Application Centers • Industry Strategies / Application Guides • Special Truck Engineering for rapid product customization Industry / Customer Focus • Industry cluster identification • Customers by cluster identification (80/20 rule) • Targeted messaging • Disciplined contact management • Established base position and grow penetration over time One-by- One Customer Focus Share Gain Drivers Products & Solutions Focus Geographic Focus Industry Focus Solutions Productivity that DRIVE 18 |
 HY Volume Leverage & Target Economics
As we make progress toward the 115,000 unit production
levels, the Lift Truck business will generate significant
incremental operating profit contribution…
Importance of volume growth to reaching target
Target is to move from significant loss to break
even in 2018, possibly 2019, then to significant
profitability in the long term
Nuvera Expect to exceed 7% operating profit target as programs mature Bolzoni Lift Truck Incremental Units Produced +5,000 Trucks Sales $159m Gross Profit $34m Operating Expenses $11m Operating Profit $23m Incremental Operating Profit % 14.6% Lift Trucks Sold 124,000 Lift Trucks Produced in HY plants 115,000 Revenues $3,590m Gross Profit $640m Operating Expenses $390m Operating Profit $250m Operating Margin 7.0% Solutions Productivity that DRIVE 19 |
 2017 Second Quarter and Outlook
2017 Second Quarter
Highlights
2017
Outlook
2017 Second
Quarter LTM 6/30/17
Results Margins $ / % from Q2 16 Results Margins Consolidated Revenue $685.5 (1) 100.0% $39.9/ 6.2% $2,718.5 (1) 100.0% Consolidated Operating Profit $18.3 2.7% $6.9 / 60.5% $55.5 2.0% Consolidated Net Income $16.4 2.4% $8.1 / 97.6% $59.0 2.2% EBITDA (4) $31.2 4.6% $7.9 / 33.9% $109.8 4.0% Lift Truck Operating Profit $28.6 4.4% (3) $9.6 / 50.5% $99.0 3.9% (3) Bolzoni Operating Profit $0.5 (2) 1.2% (3) $(0.2) / (2.9%) $2.0 (2) 1.2% (3) Nuvera Operating Loss $(10.5) n/m (3) $(2.2) / (26.5%) $(27.2) n/m (3) ($ in millions) LIFT TRUCK • Global market expected to maintain strength but moderate vs. H1 2017 & H2 2016
• Sales volumes and unit & parts revenues expected to increase during H2 2017
• Operating profit expected to decrease in H2 2017, significant decrease in Q3
• Full-year net income increase moderately over 2016 BOLZONI • Revenues expected to increase in H2 2017 • Implementation of key strategic programs expected to generate substantial growth
in operating profit and net income
NUVERA • Realignment continuing to progress as expected • Objective of reaching quarterly break-even during 2018, will reassess timing in Q3
_____________________
(1) Revenues: Lift Truck $647.7m ( LTM $2,561.1m), Bolzoni $41.9m (LTM $160.2m), Nuvera $0.4m (LTM $5.0m) (2) Bolzoni Q2 & LTM Operating Profit includes $1.5m and $6.2m, respectively of amortization on acquired assets
(3) Operating Profit (Loss) Margin % is calculated based on the respective business segment’s revenues for the respective period.
(4) EBITDA is a non-GAAP measure and should not be considered in isolation or as a substitute for GAAP measures. See
non-GAAP explanations and the related reconciliations to GAAP measures in the Financial Appendix starting on page 26 LIFT TRUCK • Shipments increased 5.2%, revenues increased 6.3% over Q2 2016 • Strong bookings and ending backlog • Operating profit margin increased to 4.4% • Benefits of price increases partly offset by increasing material costs BOLZONI • Revenues increased 7.7% over Q2 2016 NUVERA • Nuvera realignment progressing • Operating loss increased to $10.5m Solutions Productivity that DRIVE 20 |
 Hyster-Yale Use of Cash Priorities
Return Cash to Stockholders
Investments in Adjacent or Complementary
Businesses Investments in Hydrogen Power Business Investments in Share Gain Programs Investments in Core Lift Truck Business Strategic initiatives to accelerate growth or enhance margins Acquisitions of technologies and other forklift-related businesses, including Bolzoni Investments to commercialize Nuvera’s technology 2015 2016 YTD 2017 Annual Dividends (1) $18.4m $1.14/share $19.2m $1.18/share $9.9m $1.21/share 2012 to 2014 Share Buyback $49.8m / 694,653 shares of Class A common stock (1) Solutions Productivity that DRIVE 21 Dollars represent total dividends paid during calendar year, while dividend per share represents the annualized dividend rate after each
May increase in 2015, 2016 and 2017 |
 by selling and
producing 115,000 HY-factory trucks In Summary, Over the Next Few Years…. Get to approximately $3.6 billion HY Lift Truck segment revenue irrespective of industry size to Fill existing assembly line capacity through Significant share growth Which leverages Technology accelerators and business acquisitions Solutions Productivity that DRIVE 22 |
 Solutions Productivity that DRIVE 23 Valuation Approach Needs to Vary By Business 23 Lift Truck and Attachment Businesses Lift Truck and Attachment Businesses Hydrogen Power Business Hydrogen Power Business • Board Oversight as Separate Businesses • Incentives Tied to Individual Businesses Strong Operating Cash Generation Market Leading Products and Position Mature Cyclical Industry Value using Traditional Valuation Model of EBITDA Multiple on a Net Debt Basis Multiple should reflect ROIC levels and growth prospects Developing / Technology Industry Distinct Technology / Patents in Fuel Cell and Hydrogen Generation Operating Cash Invested in New Product Commercialization / Ramp Up Value as Venture Business with Developed Technology |
 A
Solid Investment Option 24
HYSTER-YALE
HYSTER-YALE
Strong Balance
Sheet Cash Generation & Commitment to Shareholder Return Investment & Growth in Game Changing Technologies Leading Products & Market Position Strategies to Gain Share in all Segments & Markets Customer Focused & Solutions Oriented Strong Return on Capital Solutions Productivity that DRIVE 24 |
 Financial Appendix
Appendix Solutions Productivity that DRIVE |
 Non-GAAP Disclosure
Adjusted Lift Truck Business Operating Profit, EBITDA and return on total capital employed are not measurements under U.S. GAAP, should not be considered in isolation or as a substitute for GAAP measures, and are not necessarily comparable with similarly titled measures of other companies. Hyster-Yale defines each as the following: Adjusted Lift Truck Business Operating Profit is defined as Lift Truck Operating Profit, as reported, adjusted for the pre-tax effect of the $17.7 million gain on sale from the Brazil land and facility in 2014; EBITDA is defined as income (loss) before income taxes and noncontrolling interest income (loss) plus net interest expense and depreciation and amortization expense; Return on total capital employed (“ROTCE”) is defined as net income (loss) before interest expense, after tax, divided by average capital employed. Average capital employed is defined as average stockholders’ equity plus average debt less average cash. For reconciliations from GAAP measurements to non-GAAP measurements, see the following pages. Solutions Productivity that DRIVE 26 |
 Non-GAAP Reconciliation
_____________________
($ in millions)
Year Ended December 31
Qtr. Trailing 12 Months Consolidated 2013 2014 2015 2016 6/30/17 6/30/17 Reconciliation of EBITDA Net income attributable to stockholders $ 110.0 $ 109.8 $ 74.7 $ 42.8 $ 16.4 $ 59.0 Noncontrolling interest income (loss) 0.2 0.4 0.4 (0.5) - (0.4) Income tax provision (benefit) 17.2 39.9 29.4 (4.0) 1.9 1.6 Interest expense 9.0 3.9 4.7 6.7 2.6 8.0 Interest income (1.8) (1.1) (1.5) (2.0) (0.5) (1.7) Depreciation and amortization expense 30.2 29.7 28.9 39.1 10.8 43.3 EBITDA $ 164.8 $ 182.6 $ 136.6 $ 82.1 $ 31.2 $ 109.8 ($ in millions) Year Ended December 31 Qtr. Trailing 12 Months Lift Truck 2013 2014 2015 2016 6/30/17 6/30/17 Reconciliation of EBITDA Net income attributable to stockholders $ 110.0 $ 111.2 $ 89.3 $ 66.9 $ 23.8 $ 86.2 Noncontrolling interest income (loss) 0.2 0.4 0.4 (0.5) (0.2) (0.6) Income tax provision (benefit) 17.2 40.7 39.4 12.2 5.1 18.5 Interest expense 9.0 3.9 4.7 6.9 2.4 8.2 Interest income (1.8) (1.1) (1.5) (3.0) (0.5) (2.7) Depreciation and amortization expense 30.2 29.6 27.3 28.1 7.6 29.4 EBITDA $ 164.8 $ 184.7 $ 159.6 $ 110.6 $ 38.2 $ 139.0 Solutions Productivity that DRIVE 27 Note: EBITDA in this investor presentation is provided solely as a supplemental disclosure with respect to operating results.
EBITDA does not represent net income (loss), as defined by U.S. GAAP and should not be considered as a substitute for net income or net loss, or as an indicator of operating performance. The Company
defines EBITDA as income (loss) before income taxes and noncontrolling
interest income (loss) plus net interest expense and depreciation and amortization expense. EBITDA is not a measurement under U.S. GAAP and is not necessarily comparable with similarly titled measures of other companies.
|
 Non-GAAP Reconciliation (continued)
_____________________
($ in millions)
Year Ended December 31
Qtr. Trailing 12 Months Nuvera 2014 2015 2016 6/30/17 6/30/17 Reconciliation of EBITDA Net loss attributable to stockholders $ (1.4) $ (14.6) $ (23.8) $ (6.3) $ (27.2) Noncontrolling interest income - - - - - Income tax benefit (0.8) (10.0) (15.8) (4.2) (18.0) Interest expense - - - - - Interest income - - - - - Depreciation and amortization expense 0.1 1.6 1.5 0.4 1.7 EBITDA $ (2.1) $ (23.0) $ (38.1) $ (10.1) $ (43.5) Qtr. Trailing 12 Months Bolzoni 6/30/17 6/30/17 Reconciliation of EBITDA Net income attributable to stockholders $ (0.1) $ 1.0 Noncontrolling interest income 0.2 0.2 Income tax provision 0.3 0.4 Interest expense 0.2
0.8 Interest income - - Depreciation and amortization expense 2.8
12.2 EBITDA $ 3.4
$ 14.6
Note: EBITDA in this investor presentation is provided solely as a
supplemental disclosure with respect to operating results. EBITDA does not represent net income (loss), as defined by U.S. GAAP and should not be considered as a substitute for net income or net loss, or as an indicator of operating performance. The
Company defines EBITDA as income (loss) before income taxes
and noncontrolling interest income (loss) plus net interest expense and depreciation and amortization expense. EBITDA is not a measurement under U.S. GAAP and is not necessarily comparable with similarly titled measures of other
companies. 28 Solutions Productivity that DRIVE ($ in millions) |
 Non-GAAP Reconciliation (continued)
_____________________
($ in millions) Reconciliation of Return on Total Capital Employed (ROTCE) Consolidated Lift Truck (1) Nuvera Bolzoni LTM 6/30/17 LTM 6/30/17 LTM 6/30/17 LTM 6/30/17 Average Stockholders' Equity (6/30/17, 3/31/17, 12/31/16, 9/30/16, and 6/30/16)
$495.4
$538.7
$20.4
$111.8
Average Debt (6/30/17, 3/31/17, 12/31/16, 9/30/16, and
6/30/16) 191.6
150.2
(2.4)
49.0 Average Cash (6/30/17, 3/31/17, 12/31/16, 9/30/16, and 6/30/16) (96.9) (243.3) - (10.8) Average capital employed $590.1 $445.6 $18.0 $150.0 Net income (loss) $59.0 $86.2 $(27.2) $1.0 Plus: Interest expense, net 6.3 5.5 - 0.8 Less: Income taxes on interest expense, net at 38% (2.4) (2.1) - (0.3) Actual return on capital employed = actual net income (loss) before interest expense, net, after tax
$62.9 $89.6 $(27.2) $1.5 Actual return on capital employed percentage 10.7% 20.1% n/m n/m Solutions Productivity that DRIVE 29 Note: Return on capital employed is provided solely as a supplemental disclosure with respect to income generation because
management believes it provides useful information with respect to earnings in a form that is comparable to the Company’s cost of capital employed, which includes both equity and debt securities, net of cash. (1) Lift Truck return on capital employed excludes the average initial investment of $99.3 million for the acquisition of Bolzoni
and continuing average investments of $56.6 million in Nuvera. Investment numbers are based on a 5-point average.
|
 Cash Flow before Financing Calculation
. Consolidated ($ in millions) Year Ended December 31 Qtr. Trailing 12 Months 2013 2014 2015 2016 6/30/17 6/30/17 Reconciliation of Cash Flow before Financing Net cash provided by (used for) operating activities $152.9 $100.0 $89.4 $(48.9) $38.3 $114.3 Net cash used for investing activities (26.1) (44.4) (31.3) (145.1) (15.6) (51.6) Cash Flow before Financing $126.8 $55.6 $58.1 $(194.0) $22.7 $(62.7) Solutions Productivity that DRIVE 30 |
 Supplemental Information
Appendix Solutions Productivity that DRIVE |
 32 Hyster founded in Portland Oregon as the Willamette Ersted Company 1929 1944 1959 Company name officially changed to Hyster Company First Hyster container handling trucks 1875 1920 Yale Lock Mfg. broadens its scope into materials handling Yale and Towne launched a new battery powered low-lift platform truck 1963 Yale forklift truck business merges with Eaton Mfg. Industrial Truck Division 1950 Yale added gas, LP gas and diesel-powered fork lift trucks to its range Hyster introduces the famous Monotrol® pedal 1971 Yale forges a partnership with Sumitomo Ltd 2011 2011 NMHG introduces the UTILEV ® lift truck for the utility segment of the market 2016 2016 1985 Yale acquired by NACCO Industries 1989 Hyster acquired by NACCO Industries NMHG renamed Hyster-Yale Group HY completes acquisition of 100% of Bolzoni S.p.A. The History of Hyster-Yale and its brands 1989 1989 2012 2012 Hyster-Yale formed as independent public company following spin-off by NACCO 2014 2014 NMHG, HY’s operating company, acquires Nuvera to enter the fast-growing hydrogen fuel cell market Hyster and Yale merge to form NACCO Materials Handling Group (NMHG) Solutions Productivity that DRIVE |
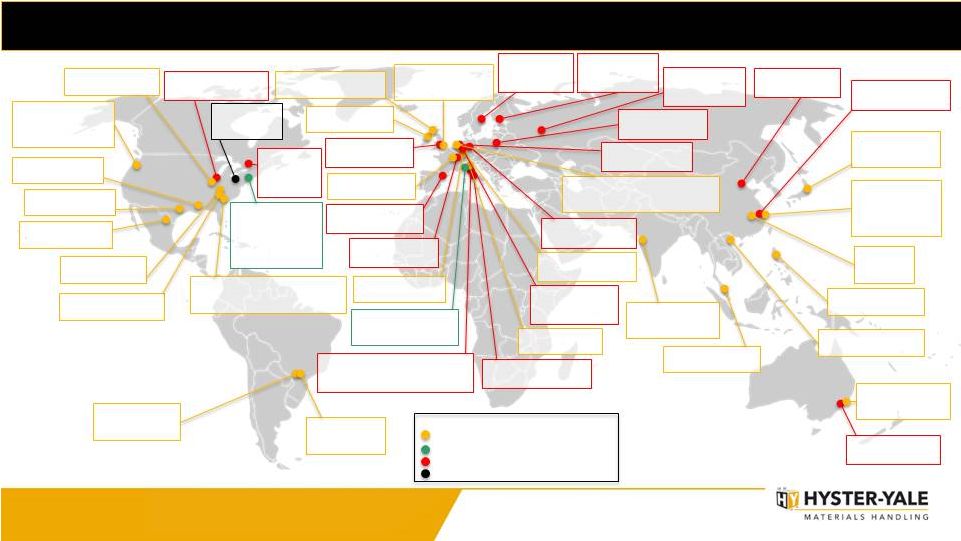 Hyster-Yale’s Global Footprint
Ramos Arizpé, Mexico
Fabrication Manufacture
Sulligent, Alabama
Component Manufacture
Berea, Kentucky
Lift Truck Manufacture
Greenville, North Carolina
Division Headquarters; Lift Truck Manufacture;
Warehouse Development Center
Cleveland, Ohio
Corporate
Headquarters
Danville, Illinois
Parts Distribution Center
Charlotte, North Carolina
Experience Center
Barueri, Brazil
Brazil Marketing and
Administration Center
Itu, Brazil
Lift Truck Manufacture;
Parts Distribution Center
Craigavon, N. Ireland
Lift Truck Manufacture
Nijmegen, Netherlands
Lift Truck Manufacture; Big Truck Development
Center; Parts Distribution Center
Masate, Italy
Lift Truck Manufacture
Shanghai, China (JV)
Lift Truck Manufacture;
Parts Distribution; China
Marketing and
Administration Center
Obu, Japan (JV)
Lift Truck Manufacture;
Parts Distribution
Cavite, Philippines (JV)
Fabrication Manufacture
Irvine, Scotland
European Administration Center
Hanoi, Vietnam (JV)
Component Manufacture
Sydney, Australia
Division Headquarters;
Parts Distribution
Pune, India
Engineering, Supply Chain
and Marketing Center
Frimley, UK
Division Headquarters;
Engineering Concept Center
Kuala Lumpur, Malaysia
Asia Support Office
Hefei, China
Supply Chain
Center Fairview, Oregon Counterbalanced Development Center; Administration Center San Donato, Italy European Offices; Research & Development; Testing Facilities Billerica, Massachusetts Hydrogen Power Business Headquarters; Research and Development; Manufacturing and Sales Homewood, Illinois Attachment Manufacture Piacenza, Italy Bolzoni Headquarters; Attachment, Lift Table and Fork Manufacture Järvenpää, Finland Attachment Manufacture Salzgitter, Germany Attachment Manufacture Wuxi, China Attachment Manufacture Hebei, China Fork Manufacture Pointe-Claire, Canada Commercial Subsidiary Prestons, Australia Commercial Subsidiary Warrington, UK Commercial Subsidiary Montcarda/Reixac, Spain Commercial Subsidiary Forbach, France Commercial Subsidiary Prato, Italy Commercial Subsidiary Lublin, Poland Commercial Subsidiary Moscow, Russia Commercial Subsidiary Korschenbroich, Germany Commercial Subsidiary Gävle, Sweden Commercial Subsidiary Helmond, Netherlands Commercial Subsidiary Lift Truck Business locations Hydrogen Power Business (Nuvera) locations Attachment Business (Bolzoni) locations Global Headquarters LEGEND: Tyler, Texas HY Telematics Chessy, France Commercial Offices Neu-Isenburg, Germany Commercial Offices Weeze, Germany Experience & Test Center Solutions Productivity that DRIVE 33 |
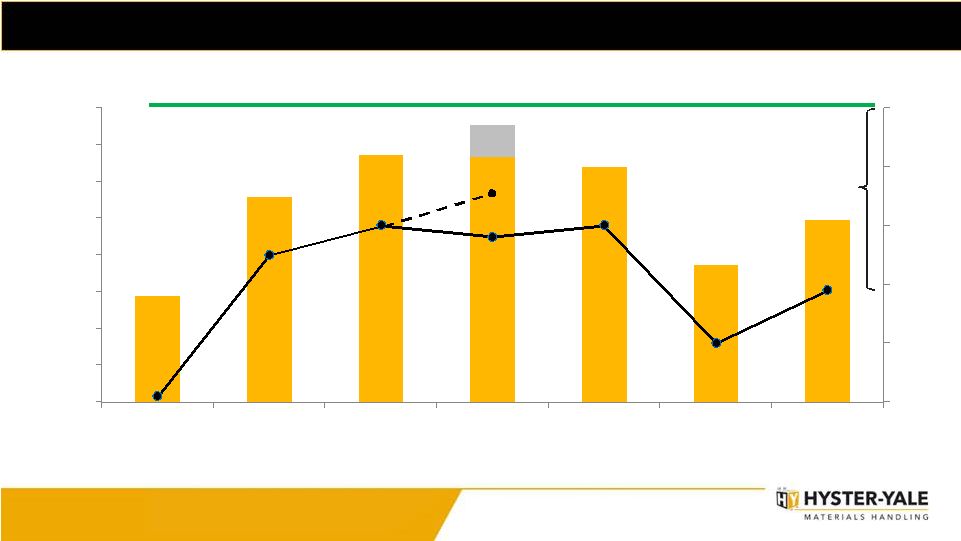 Solutions Productivity that DRIVE 34 _____________________ (1) Lift Truck Segment Operating Profit, as reported (2) Adjusted Lift Truck Segment Operating Profit, which excludes a $17.7 million pre-tax gain on the sale of the Brazil land and
facility, is a non-GAAP measure and should not be considered in isolation or as a substitute for the GAAP measure. Management believes that this measure assists the investor in understanding the results of operations. For discussion
of non-GAAP items and the related reconciliations to GAAP measures, see information in the Financial Appendix starting on page 26. ($ in millions) $57.5 $111.7 $134.4 $133.3 $128.1 $74.6 $99.0 2.1% 4.5% 5.0% 4.8% 5.0% 3.0% 3.9% 2.0% 3.0% 4.0% 5.0% 6.0% 7.0% $0.0 $20.0 $40.0 $60.0 $80.0 $100.0 $120.0 $140.0 $160.0 2007 2012 2013 2014 2015 2016 LTM 6/30/17 $151.0 (1) (2) 5.5% Prior Cycle Market Peak Mid-Cycle Market Lift Truck Business Operating Profit Trends and % of Sales 7% TARGET 3.1% Gap Closure |
 Solutions Productivity that DRIVE 35 Lift Truck Business Target Economics Goal and Gap to Target Achieve 7% operating profit margin target at the next mid-cycle Target Economics gap closure can be achieved with unit volume… Stronger Industry + Share Growth = Volume Leverage LTM 6/30/17 Gap to Target Economics Actual Lift Truck Operating Profit Margin % 3.9% Margin Variances 0.8% Unit margin 1.1% Parts/other (0.3%) Volume Variances 2.3% Manufacturing variances/other 0.6% Operating Expenses 1.7% Lift Truck Operating Profit Margin % Gap 3.1% Lift Truck Operating Profit Margin % Target 7.0% |
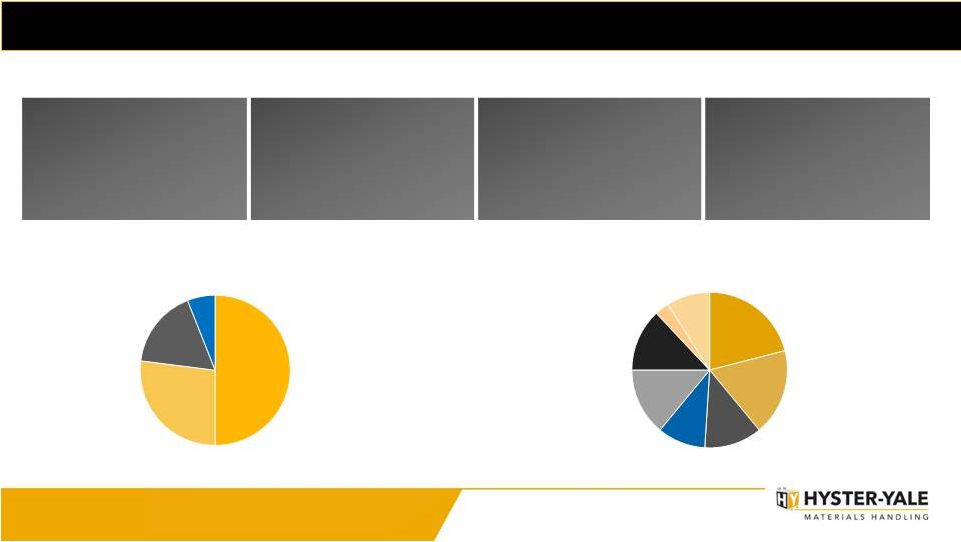 Lift Truck Overview and Sources of Revenue
2016 Worldwide Sales by Product
_____________________
(1) Represents Hyster-Yale North American Lift Truck unit shipments by industry.
(2) Includes Big Truck sales that represent 10.9% of total sales. (3) Bolzoni revenues of $115.6 million included in parts. A leading global lift truck manufacturer in terms of units sold 2016 Retail Shipments by End Market (1) (2) Manufacturing 21% Wholesale Distribution 18% Food & Beverage 12% Rental 10% Home Centers/ Retail 14% Freight & Logistics 13% Paper 3% Other 9% ICE Units 50% Electric Units 27% Parts 17% Other 6% (3) #4 Globally in 2016 Large installed base that drives parts sales Over 827,000 units worldwide at 12/31/16 HY sales of 88,700 units in LTM 6/30/17 82,600 units sold -
produced in HY
plants 6,100 units sold –
produced by JV or other third parties Additional >6,300 units sold in Japan in 2016 Direct sales by JV partner Solutions Productivity that DRIVE 36 |
 Historical Consolidated Revenue
($ in millions)
$2,057 $2,400 $2,489 $2,720 $2,824 $1,475 $1,802 $2,541 $2,469 $2,666 $2,767 $2,578 $2,570 $2,719 $0 $1,000 $2,000 $3,000 2004 2005 2006 2007 2008 2009 2010 2011 2012 2013 2014 2015 2016 LTM Q2 2017 Solutions Productivity that DRIVE 37 |
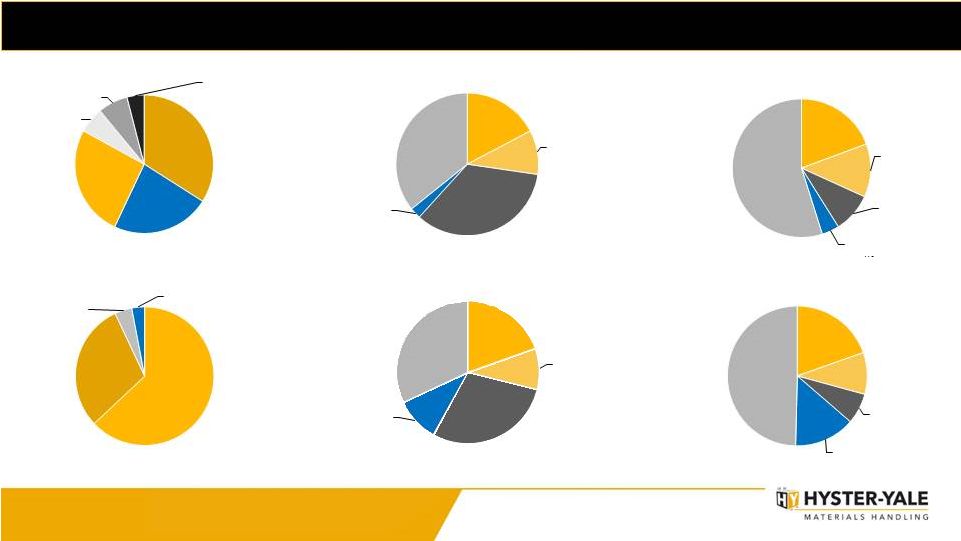 Solutions Productivity that DRIVE 38 Industry Units by Geography Lift Truck Unit Class Shipments _____________________ Source: Company: LTM 6/30/17 Units Shipped Note: Units sold direct by SN JV are not included HY Lift Truck Units Sold by Geography Americas 63% EMEA 30% Asia- Pacific/ Japan 4% China 3% _____________________ Source: WITS. LTM 6/30/17 Orders Reports. Class 1 Electric 17% Class 2 Electric 10% Class 3 Electric 34% Class 4 ICE 3% Class 5 ICE 36% _____________________ Source: WITS. LTM 6/30/17 Orders Reports. ICE = Internal Combustion Engine Class 1 Electric 20% Class 2 Electric 9% Class 3 Electric 29% Class 4 ICE 10% Class 5 ICE 32% _____________________ Source: Company: LTM 6/30/17 Units Shipped Note: Units sold direct by SN JV are not included ICE = Internal Combustion Engine Industry Units by Class HY Lift Truck Units by Class Class 1 Electric 19% Class 2 Electric 13% Class 3 Electric 9% Class 4 ICE 4% Class 5 ICE 55% _____________________ Source: Internal Company estimates Estimated Industry Revenue Mix Industry Unit Revenue by Class HY Lift Truck Unit Revenue by Class _____________________ Source: Company: LTM 6/30/17 Unit Revenues Class 1 Electric 19% Class 2 Electric 10% Class 3 Electric 7% Class 4 ICE 14% Class 5 ICE 50% Europe 34% Americas 23% China 26% Japan 6% Asia- Pacific 7% Middle East & Africa 4% |
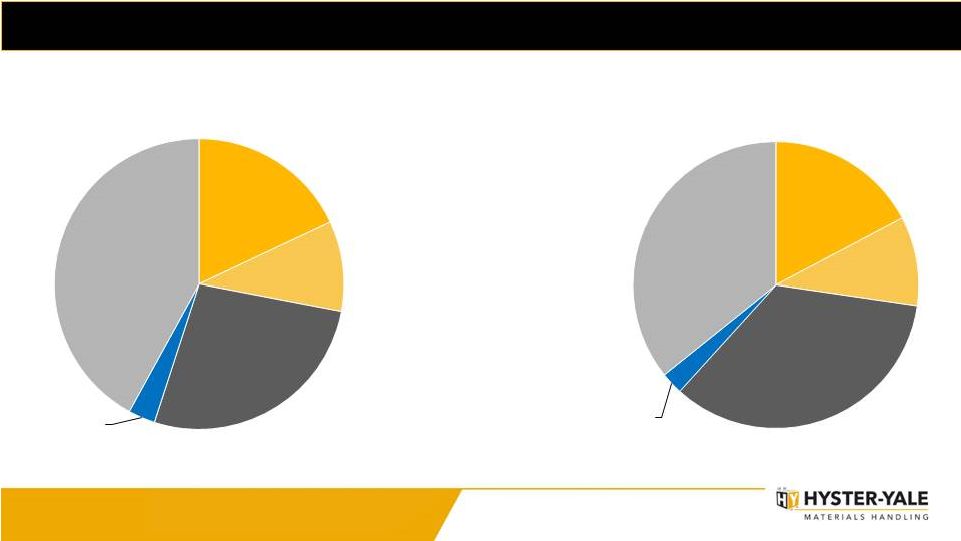 Solutions Productivity that DRIVE 39 Shift in Market Balance from ICE to Electric Today 2017 _____________________ Source: WITS. Orders Reports. ICE = Internal Combustion Engine DRIVERS: • Customer shift • Growth of warehousing and logistics • Environmental, health and safety • Evolving technologies Prior Cycle Market Peak 2007 Class 1 Electric 17% Class 2 Electric 10% Class 1 Electric 18% Class 2 Electric 10% Class 5 ICE 36% Class 4 ICE 3% Class 4 ICE 3% Class 5 ICE 42% Class 3 Electric 27% Class 3 Electric 34% |
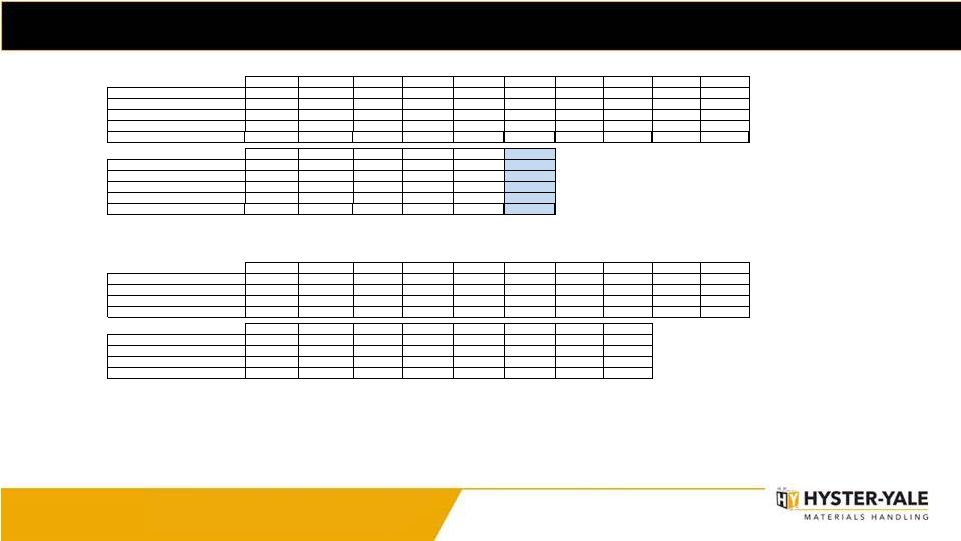 Solutions Productivity that DRIVE 40 Lift Truck Market Size Data Lift Truck Market Size Data WITS Orders Basis (1) 2002 2003 2004 2005 2006 2007 2008 2009 2010 2011 Europe 265,896 278,024 312,455 327,173 380,557 445,583 411,107 222,883 299,387 368,286 North America 147,322 155,191 186,192 198,058 212,953 191,384 159,279 98,338 136,050 169,589 Total Americas 158,388 168,471 206,225 221,155 242,186 234,353 200,178 118,835 180,903 224,501 A/P, China and Japan (1a) 138,452 155,094 185,530 201,062 232,438 271,018 260,246 205,114 314,162 381,795 Global Market 562,736 601,589 704,210 749,390 855,181 950,954 871,531 546,832 794,452 974,582 2012 2013 2014 2015 2016 2017E Europe 351,441 357,452 387,905 412,642 457,333 465,000 North America 181,191 200,939 219,444 235,128 240,836 210,600 Total Americas 229,565 252,930 267,546 277,315 280,827 251,600 A/P, China and Japan (1a) 363,399 399,395 438,510 409,923 443,938 444,338 Global Market 944,405 1,009,777 1,093,961 1,099,880 1,182,098 1,160,938 (1) In 2009, Hyster-Yale switched to tracking Industry data on a World Industrial Truck Statistics ("WITS") Orders Basis. WITS
statistics began in 2002. (1a) Beginning in 2014 includes
India local production Industry forecast (light blue columns) –
source: Derived from DRI-WEFA and Oxford Economic Forecasts
1992 1993 1994 1995 1996 1997 1998 1999 2000 2001 Europe (FEM/JIVA) (3) 150,250 121,922 135,318 152,667 174,953 176,294 187,902 219,615 227,697 274,681 North America (2) (3) 106,590 120,679 154,167 162,725 152,763 178,456 192,192 197,436 205,033 145,967 Total Americas (2) (3) 114,411 127,308 162,261 171,682 168,170 193,413 207,018 209,843 223,499 161,316 A/P, China and Japan (3) 134,635 123,913 119,733 135,050 148,135 148,441 111,848 104,781 122,354 123,780 2002 2003 2004 2005 2006 2007 2008 2009 Europe (FEM/JIVA) (3) 256,717 263,972 286,546 302,158 337,326 382,047 376,945 201,352 North America (2) (3) 144,529 151,911 182,450 194,475 207,919 185,726 149,863 95,562 Total Americas (2) (3) 156,702 166,328 203,552 218,908 238,141 229,509 192,134 115,752 A/P, China and Japan (3) 129,333 146,334 171,000 195,386 222,074 250,684 257,604 199,159 Non-WITS Prior Year Information: Lift truck market size history – source: Industrial Truck Association, Japan Industrials Vehicle Association ("JIVA"), European
Federation of Materials Handling ("FEM"), World Industrial Truck
Association (2) Total Americas numbers for 1992-2008 include North
America Commercial, Government and Latin America. Prior years are
North America Commercial only.
(3) Industry information is based upon the reporting basis of each individual region,
which varies according to the industry trade
groups in that region:
Americas - North America & Government - Retail bookings
Americas - Latin America - Factory bookings
Europe & Japan - Factory shipments
A/P & China - Factory bookings |
 Solutions Productivity that DRIVE 41 Distribution Channel Strength and Diverse Customer Base Approximately 1,100 global dealer locations More than 2,800 application consultants Approximately 10,700 service technicians National Accounts Profile Independent Dealer Network • Focused on strategic customers with centralized purchasing and geographically dispersed operations across dealer territories • Fleet Management Program provides customers with value-added services that include service, aftermarket parts and comprehensive management of materials handling needs • Two brand network strategy optimizes local presence and customer reach • Key differentiating factors: • Long-term relationships with dealers • Territorial exclusivity encourages strong, long-term relationships with customers • Brand exclusivity ensures dealers’ selling efforts focused on Hyster-Yale products 2016 Distribution Mix National Accounts 17% Independent Dealers 83% Blue Chip Customer Base |
 Solutions Productivity that DRIVE 42 Our Long-Term Philosophy Long-term growth Long-term shareholders Shareholder protection Senior management incentivized as long-term shareholders Increase shareholder value Return on Capital Employed and Market Share Increase focus |
 Solutions Productivity that DRIVE 43 Product Philosophy • Full product line • Segmented solutions • Scalable modular platforms • Leverage core assets • Technology partners • Fit for market and application • Reliability and durability • Energy efficiency • Operator productivity • Support growth initiatives • Fill the factories • Differentiation • Innovation Guiding Product Philosophy Guiding Product Philosophy Key Product Attributes Key Product Attributes Product Portfolio Focus Product Portfolio Focus |
 Solutions Productivity that DRIVE 44 Core Strategic Initiatives Update Highlights Initiative Highlights Strategic Objective • Provide the right product and solution to meet the specific needs of different customers across multiple industries • Product fit for application • Premium, Standard and Utility products • Unique innovations • Automation & Telemetry • Leverage Bolzoni relationship • Market leadership in U.S., such as heavy duty industries, e.g. Paper, Automotive • Growing success in trucking industry and beverage industries • Special Truck Engineering organization to address specific customer needs Understand Customer Needs Strategic Objective • Deliver lowest cost of ownership for all customers based on their specific application Initiative Low Cost of Ownership • Improved fuel / energy consumption • Engine to electric conversion • Expanding data services on growing number of telemetry systems (30K+) • Supplier quality, all-time high • Fleet management Outcome: Win in Targeted Major Accounts and Applications Outcome: Competitive Advantage across Product Segments |
 Solutions Productivity that DRIVE 45 Core Strategic Initiatives Update Initiative Initiative Strategic Objective Highlights • Develop the strongest independent, exclusive dealer network Enhance Independent Distribution Strategic Objective Highlights • Strengthen penetration of the growing warehouse segment Improve Warehouse Position • Significant strengthening in core U.S. market • Growth of dual-brand coverage • New dealers appointed in EMEA • Enhanced dealer profitability • Excellence programs in all theaters Outcome: Best Distribution Channels in the Industry Outcome: Be a Top Tier Global Competitor in Warehouse • Major wins in marquee accounts • New products • Industry specialization training regimen • Dealers investing in industry specialization • Expanding industry-focused direct sales force |
 Solutions Productivity that DRIVE 46 Core Strategic Initiatives Update Strategic Objective Highlights Initiative Succeed in Asia Strategic Objective Highlights Initiative Enhance Big Truck Market Position • Expand market penetration throughout Asia • Increase leading market position and become supplier of choice in Big Truck segment Outcome: Increase Share and Strengthen Distribution at Accelerated Pace
Outcome: Enhance leading market position in Big Trucks
• Leveraging Euro cost position in U.S. dollar markets • Focus on industry and solutions • Increased success with large port operators • Successful new product launches • Heart-of-market products under development • Diesel to Electric solutions • Enhancement of dealer network and direct-selling capabilities • Development of long-term strategic partnerships • Development of right local products • Establishment of support infrastructure • Leveraging Big Truck success |
 Solutions Productivity that DRIVE 47 Core Strategic Initiatives Update Strategic Objective Highlights Initiative Strengthen Sales and Marketing Organization • Strengthen and align sales and marketing organization in all geographic regions Outcome: Gain momentum leading to higher unit volumes and enhanced market share
• Smaller sales management areas • Implementing new sales approach to enhance solutions selling skills • Major focus on account identification and coverage • Expanded direct-selling teams in all regions • Solutions organization links Engineering with Sales and Marketing • Increased global account focus • Public websites in development to reflect industry approach Leverage Solutions & Technology Drivers • Acquisition of Bolzoni • Acquisition of Speedshield distribution (telematics), strengthening HY’s telematics offering • Development of Nuvera fuel-cell engines and hydrogen generation units • Leverage expertise of HY and dealer channel • Partnership with BALYO (automation) • Developing Lithium-Ion strategies • Become a one-stop materials handling solutions provider Outcome: Increase business from existing customers and new customers attracted to HY’s integrated solutions
Strategic Objective
Highlights Initiative |
 Solutions Productivity that DRIVE 48 Our Investment in R&D Full Product Line* Lift Truck R&D Investment HY COMPETITORS FULL MIN * Full Product Line – Class 1 through Class 5, including Big Truck $68 $69 $71 $69 $71 2012 2013 2014 2015 2016 2.8% 2.6% 2.6% 2.7% 2.9% % of Revenue $ in millions |
 Cost of Operation / Hour
Factors Impacting Low Cost of Ownership
*Typical truck cost/hour for 5,000lb North American applications
Solutions Productivity that DRIVE 49 Operator 69% Fuel 11% Service& Repair 11% Lease 9% Typical Truck Cost/Hour * Productivity Ergonomics/ fatigue Auto functions Automated trucks Operator Energy usage Alternative powertrains ICE to ER Mode control Fuel Cost/hour Fleet Management Extended Warranty Telematics Service & Repair Fleet optimization Price management Cost control Residuals Lease |
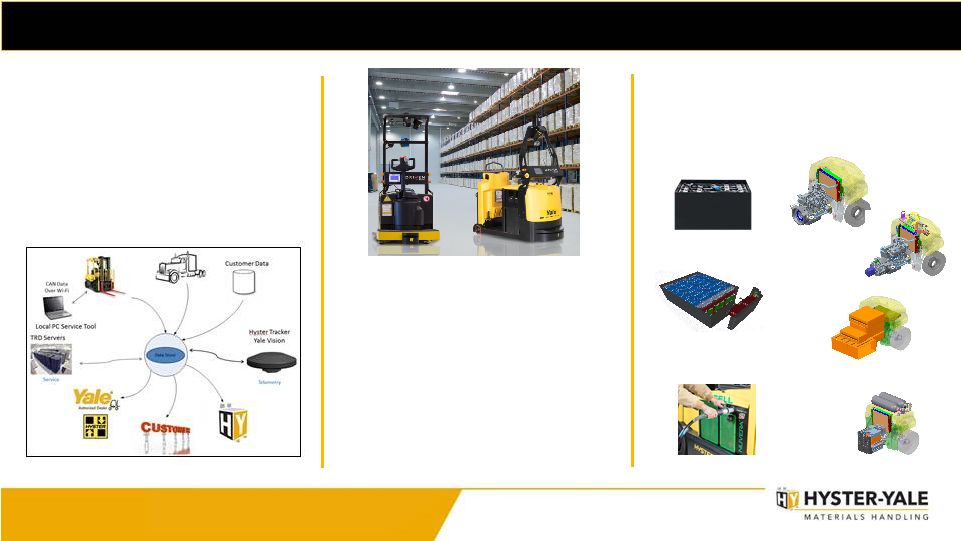 Solutions Productivity that DRIVE 50 Areas of Focus Telematics • Internet of things • Asset management • Fleet and truck data • Use of telematics • Partnered approach • Camera and laser- based systems • Focus on integration and value proposition Automation Alternative Power Lead acid Lithium ion Fuel cell Diesel LPG Lithium ion Fuel cell Battery Box Solutions Integrated solutions |
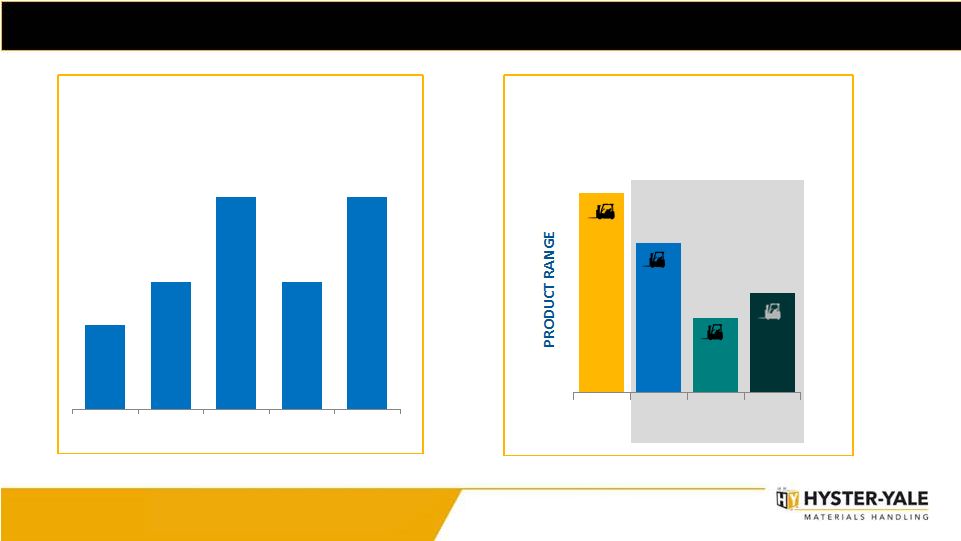
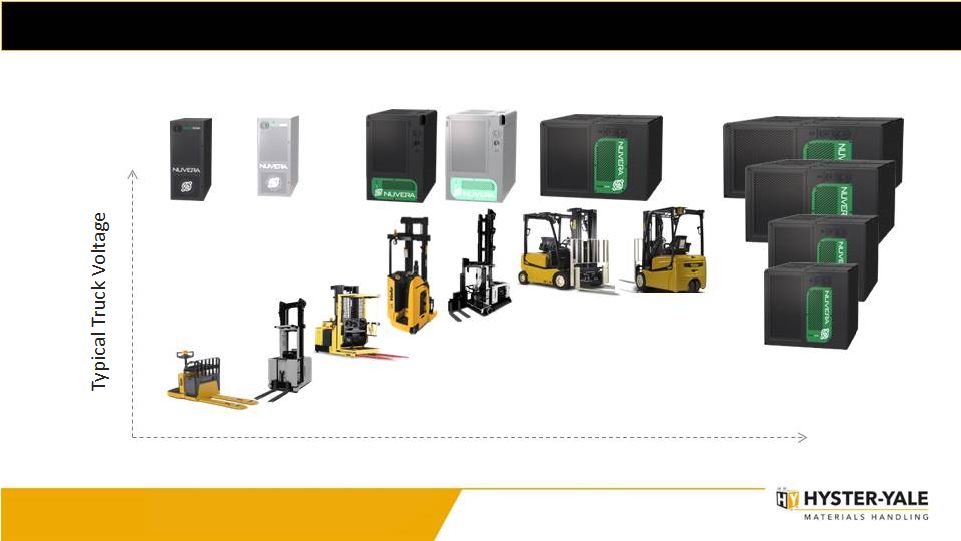 Solutions Productivity that DRIVE 51 Developing Our Product Range Approximate Engine Power Requirement [kW] 24V 36V 48V 1-3 3-10 10-20 Product available in all electric truck classes Minor modifications to address >70% of market |
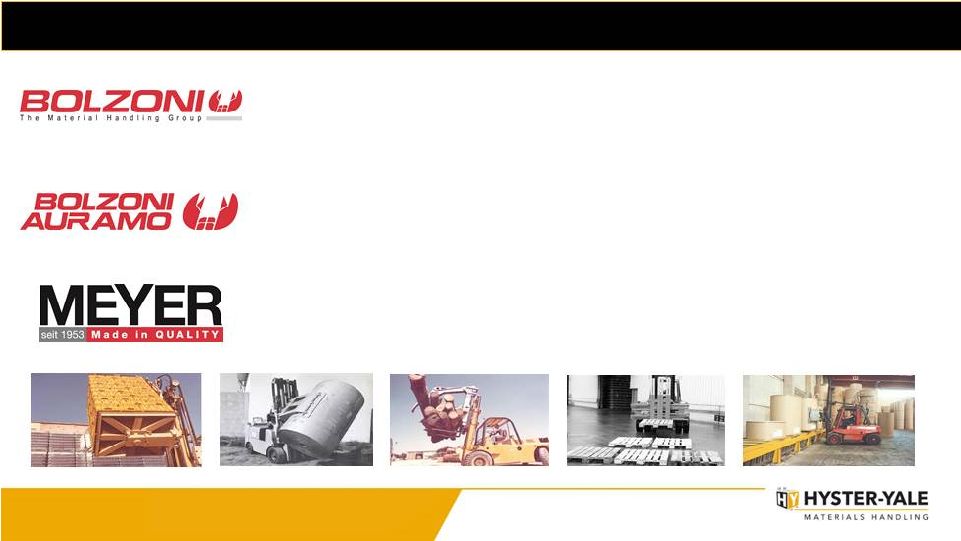 Solutions Productivity that DRIVE 52 Bolzoni’s Brands BOLZONI Founded in Italy in 1945, focus on lift truck attachments, forks and lift tables.
A leading market position through the development of a worldwide network of subsidiaries and dealers, as well as strategic acquisitions. AURAMO Founded in Finland in 1947, focus on paper roll clamps, bale clamps and other specialized handling attachments.
The worldwide recognized paper handling specialist. AURAMO was acquired by BOLZONI Group in 2001. MEYER Founded in Germany in 1953, focus on a wide range of lift truck attachment industry.
The worldwide recognized multiple pallet handler inventor. MEYER was acquired by BOLZONI Group in 2006. |
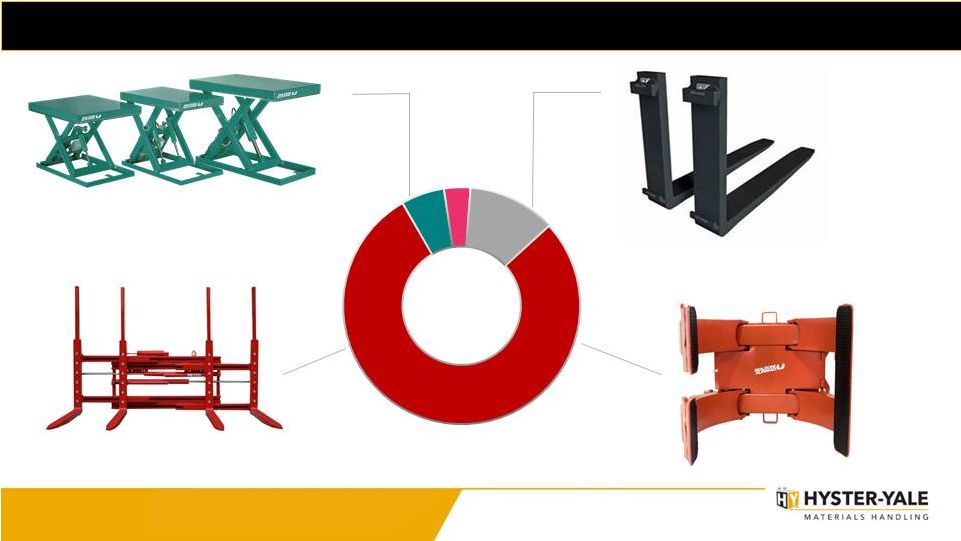 Solutions Productivity that DRIVE 53 LTM Q2 2017 Bolzoni Revenue by Product Line € 146.6 M Other Revenues* € 5,3 M 4% Forks € 17,6 M 12% Lift Table € 8,7 M 6% Attachments € 115,0 M 78% ___________ * Other Revenes – Rental business and Customer care. Note – Revenue by product line and percentages presented represent LTM Q2 2017 revenues in euros. |
 Solutions Productivity that DRIVE 54 • Able to meet customers needs globally • Global economies of scale • Young/ fresh product line • Broad array of power options, including hydrogen • Broad range of attachments • Source of aftermarket profitability • Barrier to entry Global Full Product Line Field Population Dealer Relationships • Independent distribution model • Exclusive distribution • Combine OEM excellence with entrepreneurial distribution focused on customer • Long-term relationships • Able to meet most needs • National Account programs Customer Relationships • High performance metrics • Large fleet program Aftermarket Support Employee Relationships • Engaged workforce • Experienced leadership • Equal treatment Our Competitive Advantages |