Attached files
| file | filename |
|---|---|
| 8-K - 8-K - BlueLinx Holdings Inc. | q22017earnings8k.htm |
| EX-99.1 - EXHIBIT 99.1 - BlueLinx Holdings Inc. | q22017earningsexhibit991.htm |


2
This presentation includes “forward-looking statements” within the meaning of the Private Securities Litigation
Reform Act of 1995. All of these forward-looking statements are based on estimates and assumptions made
by our management that, although believed by us to be reasonable, are inherently uncertain. Forward-looking
statements involve risks and uncertainties, including, but not limited to, economic, competitive, governmental
and technological factors outside of our control, that may cause our business, strategy or actual results to
differ materially from the forward-looking statements. These risks and uncertainties may include, among other
things: changes in the prices, supply, and/or demand for products which we distribute; general economic and
business conditions in the United States; the activities of competitors; changes in significant operating
expenses; changes in the availability of capital and interest rates; adverse weather patterns or conditions; acts
of cyber intrusion; and other factors described in the “Risk Factors” section in the Company’s Annual Report
on Form 10-K for the year ended December 31, 2016, and in its periodic reports filed with the Securities and
Exchange Commission from time to time. Unless otherwise indicated, all forward-looking statements are as of
the date they are made, and we undertake no obligation to update these forward-looking statements, whether
as a result of new information, the occurrence of future events, or otherwise.
Some of the forward-looking statements discuss the company’s plans, strategies, expectations and intentions.
They use words such as “expects”, “may”, “will”, “believes”, “should”, “approximately”, “anticipates”,
“estimates”, “outlook”, and “plans”, and other variations of these and similar words, and one or more of which
may be used in a positive or negative context.
Immaterial Rounding Differences - Immaterial rounding adjustments and differences may exist between
slides, press releases, and previously issued presentations.
Forward-Looking Statements

3
BlueLinx reports its financial results in accordance with accounting principles generally accepted in the United States (“GAAP”). The
Company also believes that presentation of certain non-GAAP measures may be useful to investors. Any non-GAAP measures used
herein are reconciled in the financial tables accompanying this news release. The Company cautions that non-GAAP measures should be
considered in addition to, but not as a substitute for, the Company’s reported GAAP results.
We define Adjusted EBITDA as an amount equal to net income (loss) plus interest expense and all interest expense related items, income
taxes, depreciation and amortization, and further adjusted to exclude certain non-cash items and other adjustments to Consolidated Net
Income (Loss). Further, we also exclude, as an additional measure, the effects of the operational efficiency initiatives, to determine same-
center Adjusted EBITDA, which is useful for period over period comparability.
We present Adjusted EBITDA (and the exclusion of the effects of the operational efficiency initiatives) because it is a primary measure
used by management to evaluate operating performance and, we believe, helps to enhance investors’ overall understanding of the
financial performance and cash flows of our business. However, Adjusted EBITDA is not a presentation made in accordance with GAAP,
and is not intended to present a superior measure of the financial condition from those determined under GAAP. Adjusted EBITDA, as
used herein, is not necessarily comparable to other similarly titled captions of other companies due to differences in methods of
calculation. We believe Adjusted EBITDA is helpful in highlighting operating trends. We also believe that Adjusted EBITDA is frequently
used by securities analysts, investors and other interested parties in their evaluation of companies, many of which present an Adjusted
EBITDA measure when reporting their results. We compensate for the limitations of using non-GAAP financial measures by using them to
supplement GAAP results to provide a more complete understanding of the factors and trends affecting the business than using GAAP
results alone.
The non-GAAP metrics of adjusted same-center net sales and adjusted same-center gross profit excludes the effects of both closed
facilities and the SKU rationalization initiative to arrive at these adjusted non-GAAP metrics. This calculation is not a presentation made in
accordance with GAAP, and is not intended to present a superior measure of the financial condition from those determined under GAAP.
Adjusted same-center net sales and adjusted same-center gross profit, as used herein, are not necessarily comparable to other similarly
titled captions of other companies due to differences in methods of calculation.
We believe adjusted same-center net sales and adjusted same-center gross profit are helpful in presenting comparability across periods
without the effect of our operational efficiency initiatives. We also believe that these non-GAAP metrics are used by securities analysts,
investors, and other interested parties in their evaluation of our company, to illustrate the effects of these initiatives. We compensate for
the limitations of using non-GAAP financial measures by using them to supplement GAAP results to provide a more complete
understanding of the factors and trends affecting the business than using GAAP results alone.
Non-GAAP Financial Measures
4
Key Emphasis for BlueLinx
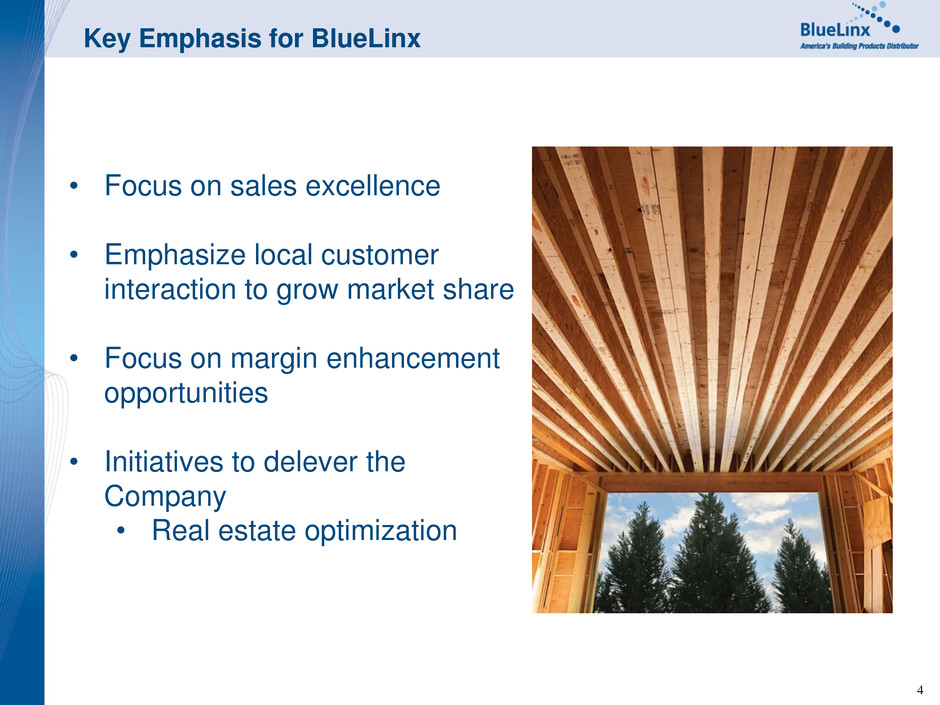
• Focus on sales excellence
• Emphasize local customer
interaction to grow market share
• Focus on margin enhancement
opportunities
• Initiatives to delever the
Company
• Real estate optimization
5
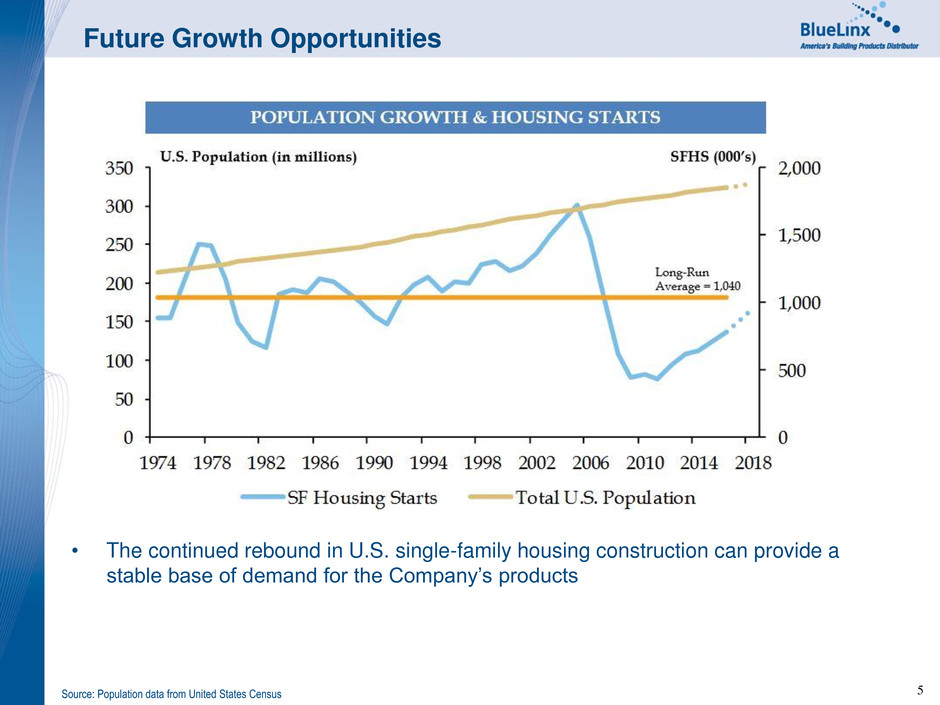
Future Growth Opportunities
• The continued rebound in U.S. single-family housing construction can provide a
stable base of demand for the Company’s products
Source: Population data from United States Census
6

7
Executive Summary – Second Quarter 2017 Highlights
• Net Sales of $474.0 million
• Adjusted same-center net sales increased $23.2 million or 5.1% from
Q2 2016
• Gross Profit of $60.5 million, up $3.2 million from Q2 2016
• Adjusted same-center gross profit increased $3.4 million
• Gross Margin of 12.8%, best second quarter since 2008
• Specialty product margin of 15.3% and Structural product margin of
8.7%
• Net Income of $3.2 million, best second quarter since 2008
• Adjusted EBITDA of $12.8 million, best second quarter since 2008
• Operating Working Capital improved by $21.6 million from Q2 2016
• Excess Availability of $74.2 million, an increase of $8.9 million from Q2 2016
• Debt principal reduction of $76.4 million from Q2 2016
8
Executive Summary – First Half 2017 Highlights
• Net Sales of $902.6 million
• Adjusted same-center net sales increased $32.2 million or 3.7% from
first half of 2016
• Gross Profit of $115.0 million
• Adjusted same-center gross profit increased $6.0 million from first half
of 2016
• Gross Margin of 12.7%, an increase of 100 basis points from first half of
2016
• Net Income of $3.8 million, up $13.1 million from first half of 2016
• Adjusted EBITDA of $20.1 million, up $0.5 million from first half of 2016
• Same-center Adjusted EBITDA increased $1.7 million from first half of
2016
9
Historical Second Quarter Gross Margin
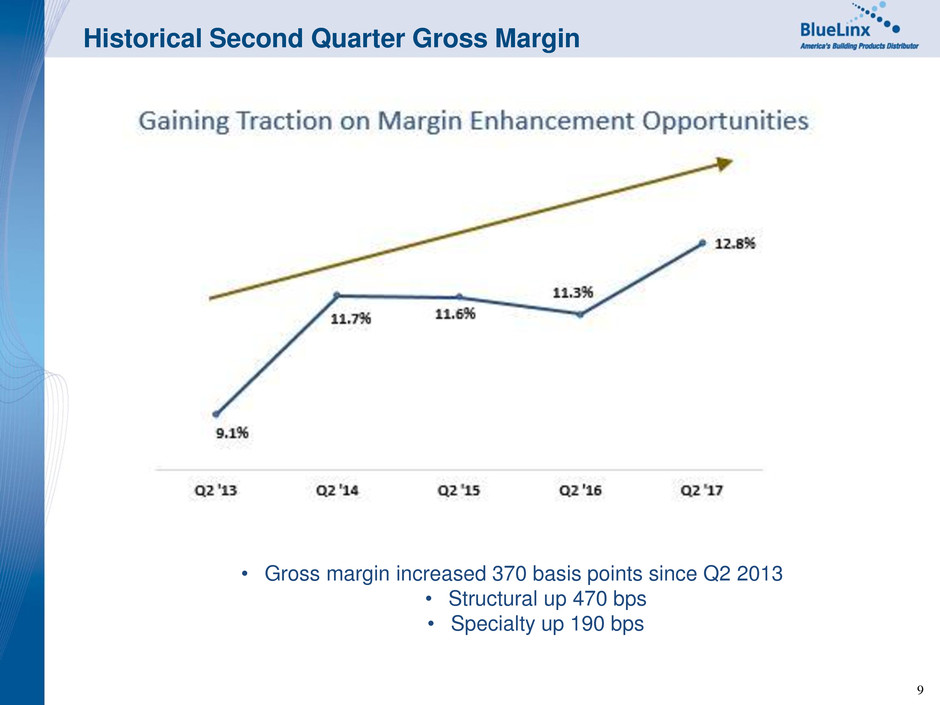
• Gross margin increased 370 basis points since Q2 2013
• Structural up 470 bps
• Specialty up 190 bps
10
Adjusted Same-Center Net Sales
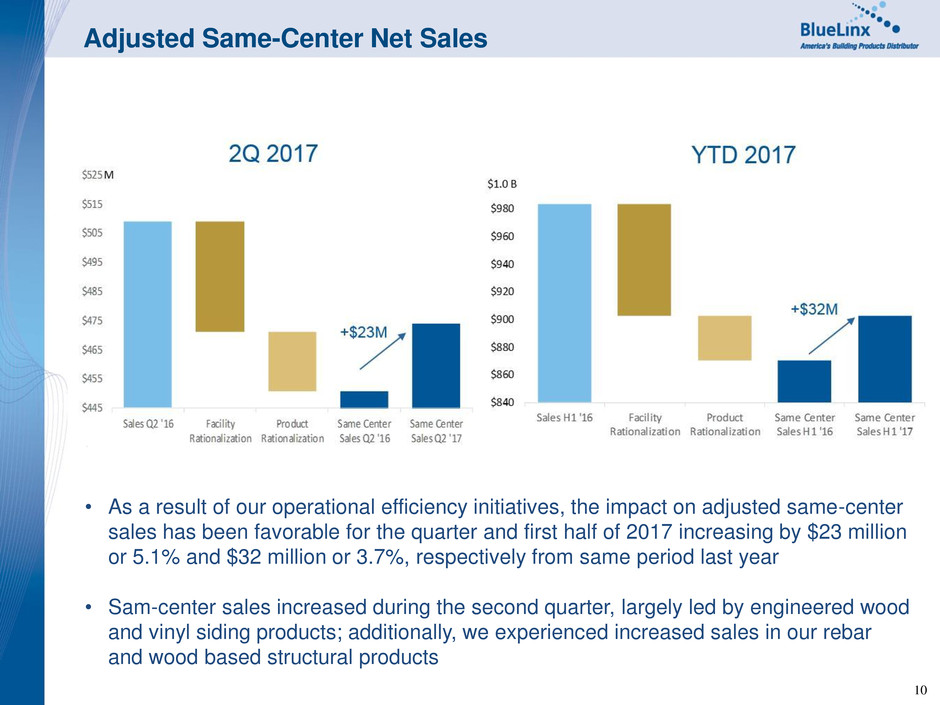
• As a result of our operational efficiency initiatives, the impact on adjusted same-center
sales has been favorable for the quarter and first half of 2017 increasing by $23 million
or 5.1% and $32 million or 3.7%, respectively from same period last year
• Sam-center sales increased during the second quarter, largely led by engineered wood
and vinyl siding products; additionally, we experienced increased sales in our rebar
and wood based structural products

11
Real Estate Valuation
• Property sales in 2016 and YTD 2017 generated gross sales of $68 million
• Our previous valuations are substantiated by sales in the past 18 months
• Collective value of properties sold is consistent with 2015 desktop valuation;
$68 million in property sales had a desktop valuation of $69 million
• Our real estate continues to prove to be a valuable and attractive asset

12
Delevering the Business
• Mortgage and revolving credit facility decreased by $60.9 million and $15.5 million,
respectively from this period last year

13

14
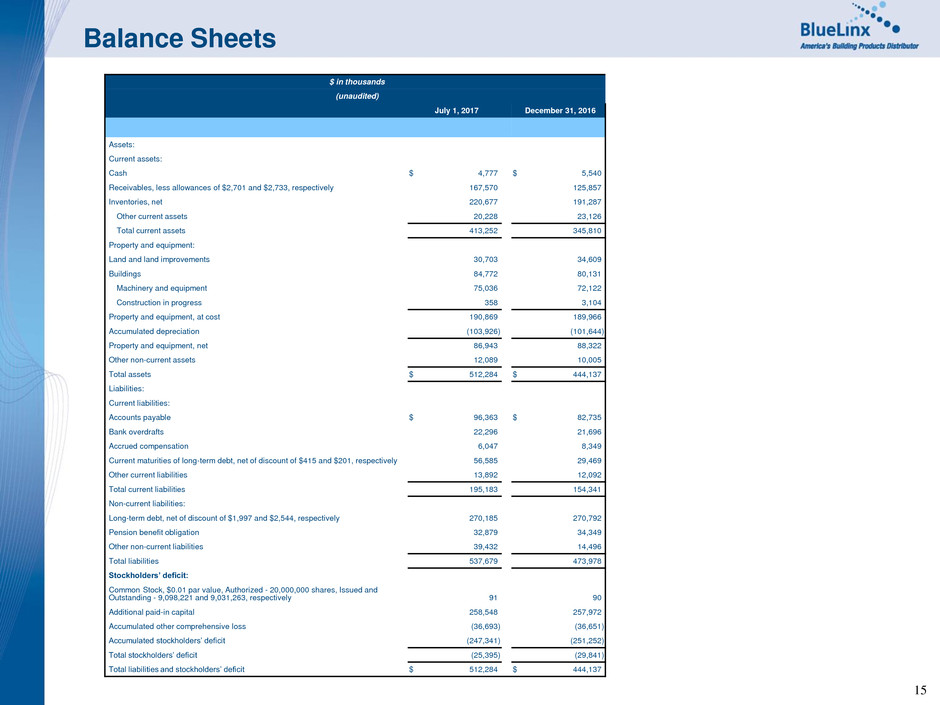
Statements of Operations
$ in thousands except per share amounts
(unaudited)
2017 2016 2017 2016
Q2 Q2 Q2 YTD Q2 YTD
Net sales $ 474,001 $ 509,011 $ 902,609 $ 983,337
Cost of sales 413,455 451,624 787,629 868,354
Gross profit 60,546 57,387 114,980 114,983
Operating expenses (income):
Selling, general, and administrative 49,012 52,678 101,925 107,855
Gains from sales of property — (384 ) (6,700 ) (761 )
Depreciation and amortization 2,253 2,396 4,616 4,871
Total operating expenses 51,265 54,690 99,841 111,965
Operating income 9,281 2,697 15,139 3,018
Non-operating expenses (income):
Interest expense 5,367 6,250 10,610 13,457
Other expense (income), net — 135 (2 ) (237 )
Income (loss) before provision for (benefit from)
income taxes 3,914 (3,688 ) 4,531 (10,202 )
Provision for (benefit from) income taxes 676 (544 ) 709 (913 )
Net income (loss) $ 3,238 $ (3,144 ) $ 3,822 $ (9,289 )
Basic earnings (loss) per share $ 0.36 $ (0.35 ) $ 0.42 $ (1.05 )
Diluted earnings (loss) per share $ 0.35 $ (0.35 ) $ 0.42 $ (1.05 )
15
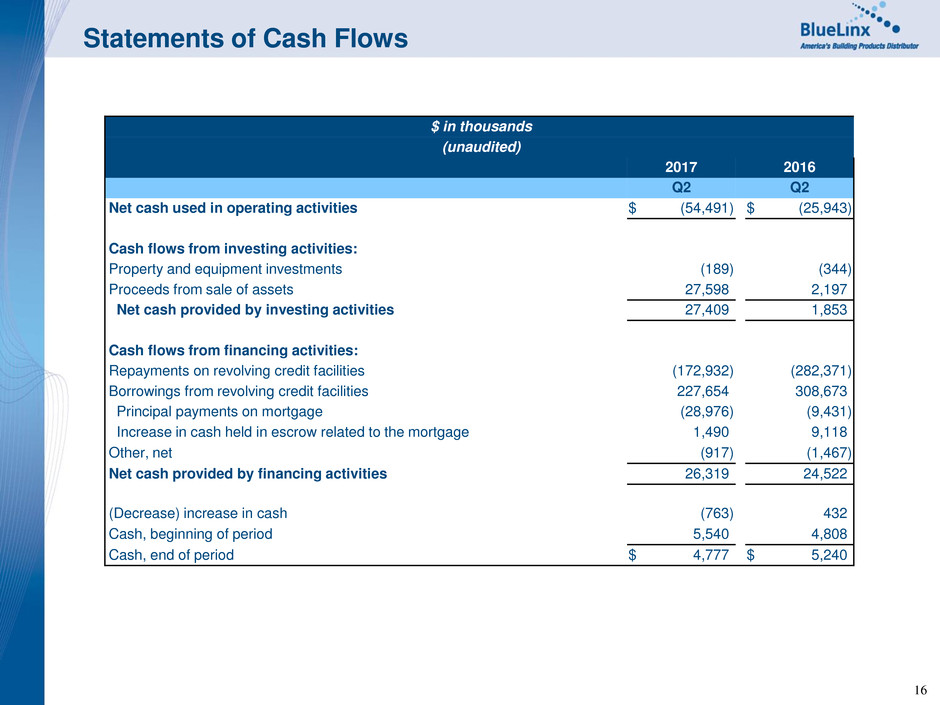
Balance Sheets
$ in thousands
(unaudited)
July 1, 2017 December 31, 2016
Assets:
Current assets:
Cash $ 4,777 $ 5,540
Receivables, less allowances of $2,701 and $2,733, respectively 167,570 125,857
Inventories, net 220,677 191,287
Other current assets 20,228 23,126
Total current assets 413,252 345,810
Property and equipment:
Land and land improvements 30,703 34,609
Buildings 84,772 80,131
Machinery and equipment 75,036 72,122
Construction in progress 358 3,104
Property and equipment, at cost 190,869 189,966
Accumulated depreciation (103,926 ) (101,644 )
Property and equipment, net 86,943 88,322
Other non-current assets 12,089 10,005
Total assets $ 512,284 $ 444,137
Liabilities:
Current liabilities:
Accounts payable $ 96,363 $ 82,735
Bank overdrafts 22,296 21,696
Accrued compensation 6,047 8,349
Current maturities of long-term debt, net of discount of $415 and $201, respectively 56,585 29,469
Other current liabilities 13,892 12,092
Total current liabilities 195,183 154,341
Non-current liabilities:
Long-term debt, net of discount of $1,997 and $2,544, respectively 270,185 270,792
Pension benefit obligation 32,879 34,349
Other non-current liabilities 39,432 14,496
Total liabilities 537,679 473,978
Stockholders’ deficit:
Common Stock, $0.01 par value, Authorized - 20,000,000 shares, Issued and
Outstanding - 9,098,221 and 9,031,263, respectively 91 90
Additional paid-in capital 258,548 257,972
Accumulated other comprehensive loss (36,693 ) (36,651 )
Accumulated stockholders’ deficit (247,341 ) (251,252 )
Total stockholders’ deficit (25,395 ) (29,841 )
Total liabilities and stockholders’ deficit $ 512,284 $ 444,137
16
Statements of Cash Flows
$ in thousands
(unaudited)
2017 2016
Q2 Q2
Net cash used in operating activities $ (54,491 ) $ (25,943 )
Cash flows from investing activities:
Property and equipment investments (189 ) (344 )
Proceeds from sale of assets 27,598 2,197
Net cash provided by investing activities 27,409 1,853
Cash flows from financing activities:
Repayments on revolving credit facilities (172,932 ) (282,371 )
Borrowings from revolving credit facilities 227,654 308,673
Principal payments on mortgage (28,976 ) (9,431 )
Increase in cash held in escrow related to the mortgage 1,490 9,118
Other, net (917 ) (1,467 )
Net cash provided by financing activities 26,319 24,522
(Decrease) increase in cash (763 ) 432
Cash, beginning of period 5,540 4,808
Cash, end of period $ 4,777 $ 5,240

17
Adjusted EBITDA
$ in thousands
2017 2016 2017 2016
Q2 Q2 Q2 YTD Q2 YTD
Net income (loss) $ 3,238 $ (3,144 ) $ 3,822 $ (9,289 )
Adjustments:
Depreciation and amortization 2,253 2,396 4,616 4,871
Interest expense 5,367 6,250 10,610 13,457
Provision for (benefit from) income taxes 676 (544 ) 709 (913 )
Gain from sales of property — (384 ) (6,700 ) (761 )
Share-based compensation expense 695 430 1,459 845
Multi-employer pension withdrawal 1,000 — 5,500 —
Restructuring, severance, and legal, and other (427 ) 7,581 108 8,069
Refinancing-related expenses — 69 — 3,385
Adjusted EBITDA $ 12,802 $ 12,654 $ 20,124 $ 19,664
Adjusted EBITDA $ 12,802 $ 12,654 $ 20,124 $ 19,664
Less: non-GAAP adjustments — 106 — 1,190
Same-center Adjusted EBITDA $ 12,802 $ 12,548 $ 20,124 $ 18,474

18
Comparable Same-Center Schedule
$ in thousands
2017 2016 2017 2016
Q2 Q2 Q2 YTD Q2 YTD
Net sales $ 474,001 $ 509,011 $ 902,609 $ 983,337
Less: non-GAAP adjustments — 58,222 — 112,893
Adjusted same-center net sales $ 474,001 $ 450,789 $ 902,609 $ 870,444
Adjusted year-over-year percentage increase -
sales 5.1 % 3.7 %
Gross profit $ 60,546 $ 57,387 $ 114,980 $ 114,983
Less: non-GAAP adjustments — 224 — 5,959
Adjusted same-center gross profit $ 60,546 $ 57,163 $ 114,980 $ 109,024

19
Debt Principal
$ in thousands
2017 2016
Q2 Q2 Change
Revolving credit facilities - principal $ 231,335 $ 246,858 $ (15,523 )
Mortgage - principal 97,847 158,769 (60,922 )
Total $ 329,182 $ 405,627 $ (76,445 )
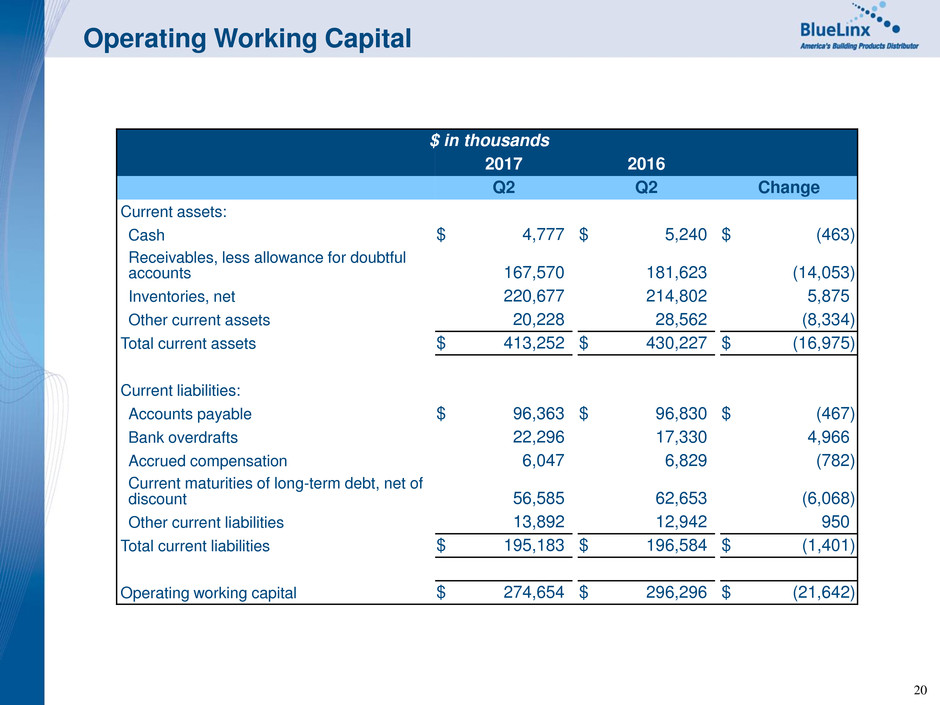
20
Operating Working Capital
$ in thousands
2017 2016
Q2 Q2 Change
Current assets:
Cash $ 4,777 $ 5,240 $ (463 )
Receivables, less allowance for doubtful
accounts 167,570 181,623 (14,053 )
Inventories, net 220,677 214,802 5,875
Other current assets 20,228 28,562 (8,334 )
Total current assets $ 413,252 $ 430,227 $ (16,975 )
Current liabilities:
Accounts payable $ 96,363 $ 96,830 $ (467 )
Bank overdrafts 22,296 17,330 4,966
Accrued compensation 6,047 6,829 (782 )
Current maturities of long-term debt, net of
discount 56,585 62,653 (6,068 )
Other current liabilities 13,892 12,942 950
Total current liabilities $ 195,183 $ 196,584 $ (1,401 )
Operating working capital $ 274,654 $ 296,296 $ (21,642 )

21
