Attached files
| file | filename |
|---|---|
| 8-K - FORM 8-K - RITE AID CORP | v472690_8k.htm |
Exhibit 99.1

August 9, 2017
Safe Harbor Statement CAUTIONARY STATEMENT REGARDING FORWARD-LOOKING STATEMENTS: Statements in this presentation that are not historical are forward-looking statements made pursuant to the safe harbor provisions of the Private Securities Litigation Reform Act of 1995. Such statements include, but are not limited to, statements regarding the expected timing of the closing of the sale of stores and assets to WBA; the ability of the parties to complete the sale and related transactions considering the various closing conditions; the outcome of legal and regulatory matters, including with respect to the outcome of discussions with the Federal Trade Commission and otherwise in connection with the sale of stores and assets of Rite Aid to WBA; the exact timing, series and amounts of Rite Aid indebtedness to be repaid and the premiums associated with such repayments; the expected benefits of the transaction such as improved operations, enhanced revenues and cash flow, growth potential, market profile and financial strength; the competitive ability and position of Rite Aid following completion of the proposed transaction; the ability of Rite Aid to implement new business strategies following the completion of the proposed transaction and any assumptions underlying any of the foregoing. Words such as “anticipate,” “believe,” “continue,” “could,” “estimate,” “expect,” “intend,” “may,” “plan,” “predict,” “project,” “should,” and “will” and variations of such words and similar expressions are intended to identify such forward-looking statements. These forward-looking statements are not guarantees of future performance and involve risks, assumptions and uncertainties, including, but not limited to, our high level of indebtedness and our ability to make interest and principal payments on our debt and satisfy the other covenants contained in our debt agreements; general economic, industry, market, competitive, regulatory and political conditions; our ability to improve the operating performance of our stores in accordance with our long term strategy; the impact of private and public third-party payers continued reduction in prescription drug reimbursements and efforts to encourage mail order; our ability to manage expenses and our investments in working capital; outcomes of legal and regulatory matters; changes in legislation or regulations, including healthcare reform; our ability to achieve the benefits of our efforts to reduce the costs of our generic and other drugs; risks related to the proposed transaction, including the possibility that the transaction may not close, including because a governmental entity (including the Federal Trade Commission) may prohibit, delay or refuse to grant approval for the consummation of the transaction, or may require conditions, limitations or restrictions in connection with such approvals; the risk that there may be a material adverse change of Rite Aid, or the business of Rite Aid may suffer as a result of uncertainty surrounding the proposed transaction; risks related to the ability to realize the anticipated benefits of the proposed transaction; risks associated with the financing of the proposed transaction; disruption from the proposed transaction making it more difficult to maintain business and operational relationships; the effect of the pending sale on Rite Aid's business relationships (including, without limitation, customers and suppliers), operating results and business generally; risks related to diverting management's or employees' attention from ongoing business operations; the risk that Rite Aid's stock price may decline significantly if the proposed transaction is not completed; significant transaction costs; unknown liabilities; the risk of litigation and/or regulatory actions related to the proposed transaction; potential changes to our strategy in the event the proposed transaction does not close, which may include delaying or reducing capital or other expenditures, selling assets or other operations, attempting to restructure or refinance our debt, or seeking additional capital, and other business effects. These and other risks, assumptions and uncertainties are more fully described in Item 1A (Risk Factors) of our most recent Annual Report on Form 10-K, and in other documents that we file or furnish with the Securities and Exchange Commission, which you are encouraged to read. Should one or more of these risks or uncertainties materialize, or should underlying assumptions prove incorrect, actual results may vary materially from those indicated or anticipated by such forward-looking statements. Accordingly, you are cautioned not to place undue reliance on these forward-looking statements, which speak only as of the date they are made. Rite Aid expressly disclaims any current intention to update publicly any forward-looking statement after the distribution of this release, whether as a result of new information, future events, changes in assumptions or otherwise.
Safe Harbor Statement CAUTIONARY NOTE REGARDING PRO FORMA INFORMATION: The following presentation provides certain pro forma information regarding the impact of Rite Aid’s proposed sale of stores and assets to Walgreens Boots Alliance, Inc. on Rite Aid’s results of operations and capital structure. The pro forma information is for illustrative purposes only, was prepared by management in response to investor inquiries and is based upon a number of assumptions. Additional items that may require adjustments to the pro forma information may be identified and could result in material changes to the information contained herein. The information in this presentation is not necessarily indicative of what actual financial results of Rite Aid would have been had the sale occurred on the dates or for the periods indicated, nor does it purport to project the financial results of Rite Aid for any future periods or as of any date. Such pro forma information has not been prepared in conformity with Regulation S-X. Rite Aid’s independent auditors have not audited, reviewed, compiled or performed any procedures with respect to this preliminary financial information. Accordingly, they do not express an opinion or provide any form of assurance with respect thereto. The information in this presentation should not be viewed in replacement of results prepared in compliance with Generally Accepted Accounting Principles or any pro forma financial statements subsequently required by the rules and regulations of the Securities and Exchange Commission.
Non-GAAP Financial Measures The following presentation includes a non-GAAP financial measure, Adjusted EBITDA. Rite Aid defines Adjusted EBITDA as net income excluding the impact of income taxes, interest expense, depreciation and amortization, LIFO adjustments, charges or credits for facility closing and impairment, inventory write-downs related to store closings, debt retirements and other items (including stock-based compensation expense, merger and acquisition-related costs, severance and costs related to distribution center closures, gain or loss on sale of assets and revenue deferrals related to our customer loyalty program). The presentation includes a reconciliation of Adjusted EBITDA to net income, which is the most directly comparable GAAP financial measure.
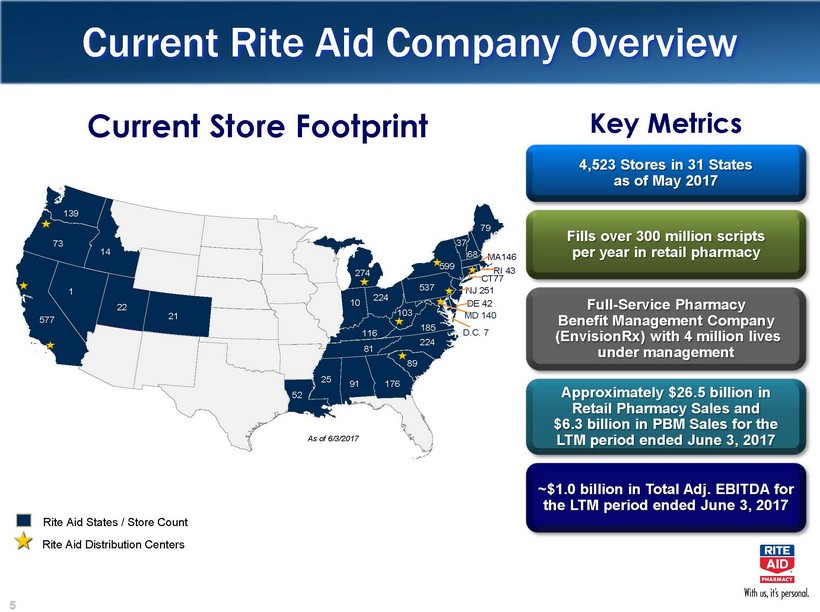
Current Rite Aid Company Overview Key Metrics 4,523 Stores in 31 States as of May 2017 Full-Service Pharmacy Benefit Management Company(EnvisionRx) with 4 million lives under management Fills over 300 million scripts per year in retail pharmacy Approximately $26.5 billion in Retail Pharmacy Sales and $6.3 billion in PBM Sales for the LTM period ended June 3, 2017 ~$1.0 billion in Total Adj. EBITDA for the LTM period ended June 3, 2017 Current Store Footprint Rite Aid States / Store Count Rite Aid Distribution Centers As of 6/3/2017 139 14 73 1 577 22 21 274 10 224 116 81 52 25 91 89 224 537 103 79 185 37 68 MA146 RI 43 CT77 NJ 251 DE 42 D.C. 7 176 599 MD 140

5.0% 4.6% 3.5% 3.2% Recent Financial Performance Adj. EBITDA ($ in millions) Comparable Store Sales Growth Net Leverage Net Debt / Adj. EBITDA Note: Fiscal year ending February. (1)Same store script count adjusted to 30-day equivalents. Adj. EBITDA % Margin: Front End Sales Rx Sales Script Count(1) 1.2% 0.2% 0.2% (1.5%) FY 2015 FY 2016 FY 2017 QY FY 2018 $1,323 $1,402 $1,137 $1,044 FY 2015 FY 2016 FY 2017 Q1 FY 2018 5.8% 1.8% (3.2%) (5.0%) FY 2015 FY 2016 FY 2017 QY FY 2018 4.4% 1.5% 0.1% (1.1%) FY 2015 FY 2016 FY 2017 QY FY 2018 4.1x 4.9x 6.2x 6.7x FY 2015 FY 2016 FY 2017 Q1 FY 2018
Summary of Recent Performance Front end comparable sales growth in line with industry competitors –front end gross margin has improved Recent Rx sales decline driven by reimbursement rate pressure Q1 script count declines driven by the exclusion from certain pharmacy networks that we participated in last year Decline in Adjusted EBITDA due to lower pharmacy gross profit, driven by reimbursement rate pressures that we could not offset with generic purchasing efficiencies
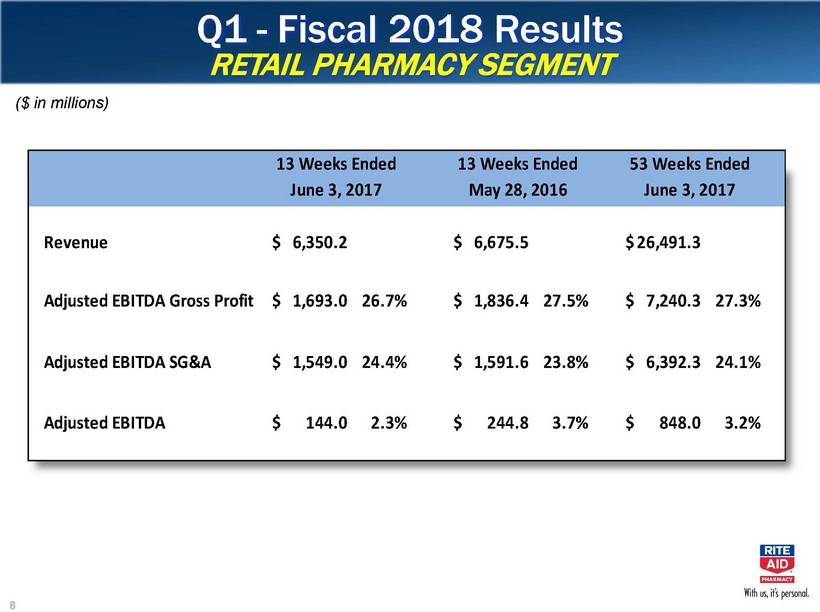
Q1 -Fiscal 2018 ResultsRETAIL PHARMACY SEGMENT ($ in millions) Revenue6,350.2$ 6,675.5$ 26,491.3$ Adjusted EBITDA Gross Profit1,693.0$ 26.7%1,836.4$ 27.5%7,240.3$ 27.3%Adjusted EBITDA SG&A1,549.0$ 24.4%1,591.6$ 23.8%6,392.3$ 24.1%Adjusted EBITDA144.0$ 2.3%244.8$ 3.7%848.0$ 3.2%13 Weeks Ended June 3, 201713 Weeks Ended May 28, 201653 Weeks EndedJune 3, 2017
Near Term InitiativesRETAIL PHARMACY SEGMENT Wellness Store Renovations Prescription File Buys Enhanced Pharmacy Services „{ Immunizations „{ MTM „{ One Trip Refill Loyalty Program Expense Reduction & Control Initiatives
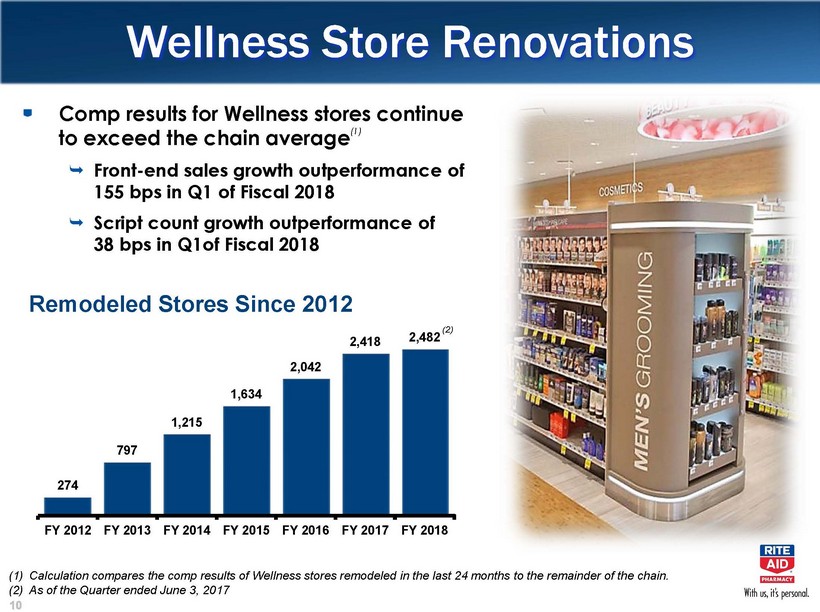
Wellness Store Renovations Comp results for Wellness stores continue to exceed the chain average(1) „{Front-end sales growth outperformance of 155 bps in Q1 of Fiscal 2018 „{Script count growth outperformance of 38 bps in Q1of Fiscal 2018 274 797 1,215 1,634 2,042 2,418 2,482 FY 2012 FY 2013 FY 2014 FY 2015 FY 2016 FY 2017 FY 2018 Remodeled Stores Since 2012 (1) Calculation compares the comp results of Wellness stores remodeled in the last 24 months to the remainder of the chain. (2) As of the Quarter ended June 3, 2017 (2)

Immunization Trends 2,366 2,830 3,235 3,189 3,233 415 436 561 765 804 2,781 3,266 3,796 3,954 4,037 FY2013 FY2014 FY2015 FY2016 FY2017 Flu shots All Other (in thousands)
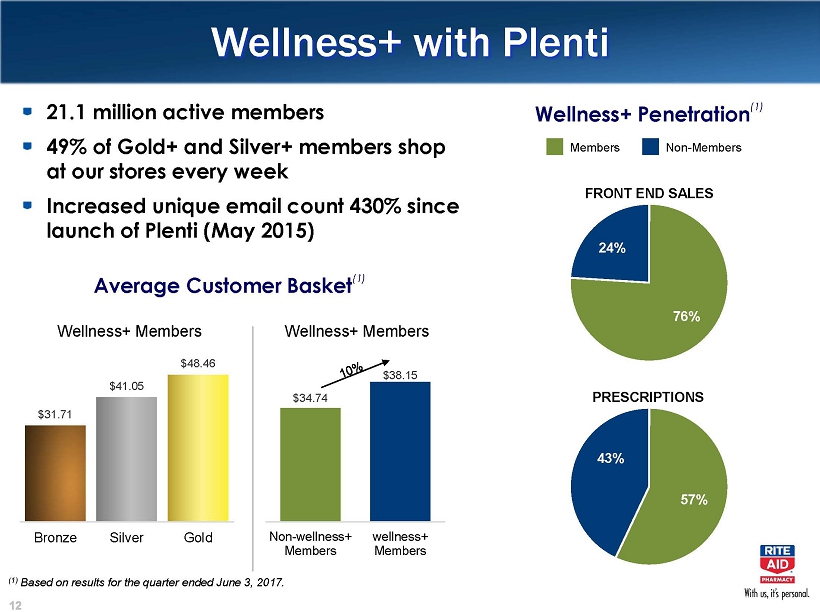
Wellness+ with Plenti 21.1 million active members 49% of Gold+ and Silver+ members shop at our stores every week Increased unique email count 430% since launce of Plenti (May 2015) $31.71 $41.05 $48.46 Bronze Silver Gold Wellness+ Members Wellness+ Penetration(1) $34.74 $38.15 Non-wellness+Members wellness+Members Wellness+ Members Average Customer Basket(1) 76% 24% FRONT END SALES 57% 43% PRESCRIPTIONS Members Non-Members (1) Based on results for the quarter ended June 3, 2017.
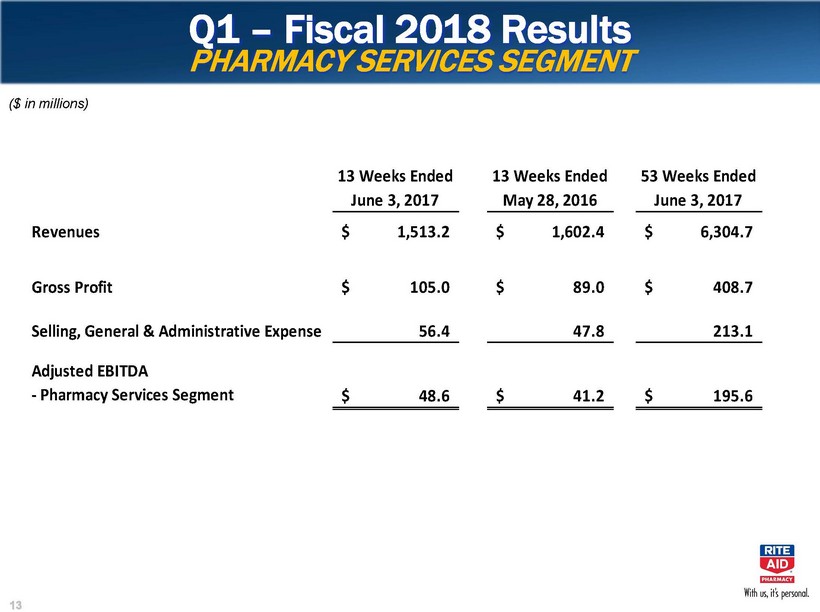
Q1 –Fiscal 2018 ResultsPHARMACY SERVICES SEGMENT ($ in millions) 13 Weeks Ended June 3, 201713 Weeks EndedMay 28, 201653 Weeks EndedJune 3, 2017Revenues1,513.2$ 1,602.4$ 6,304.7$ Gross Profit105.0$ 89.0$ 408.7$ Selling, General & Administrative Expense56.4 47.8 213.1 Adjusted EBITDA - Pharmacy Services Segment48.6$ 41.2$ 195.6$

EnvisionRx Business Overview Highlights • Founded in 2001, operating a pass-through PBM focused on customer alignment and transparency •Added traditional capabilities with MedTrak acquisition •Steadfast commitment to customer savings and service •Recognized as Top-Tier PBM(2) •Over 21 million members nationally •Leading PDP through Envision Insurance Company (“EIC”), serving ~350k members nationally •~$6.3 billion in revenue and $195 million in Adjusted EBITDA for the LTM ended June 3, 2017 •~1,200 employees across all 50 states Rapid Historical Growth (1) Excludes Consumer Discount Card, DesignRx, Laker, and other non-funded PBM lives on the Envision platform. (2)Recognized by URAC, an independent, non-profit organization that provides accreditation to medical care service organizations. $4.3 $5.8 $6.4 FY2015 FY2016 FY2017 Consolidated Revenue ($ Billions) 2.9 3.7 4.0 FY2015 FY2016 FY2017 Total Funded PBM Lives(1) (in Millions)
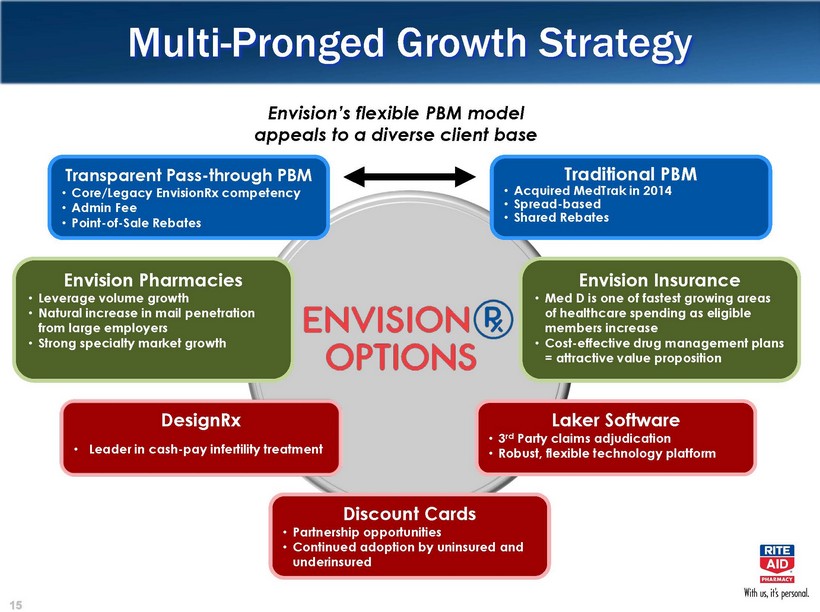
Multi-Pronged Growth Strategy Transparent Pass-through PBM •Core/Legacy EnvisionRxcompetency •Admin Fee •Point-of-Sale Rebates Traditional PBM •Acquired MedTrak in 2014 •Spread-based •Shared Rebates Envision Pharmacies •Leverage volume growth •Natural increase in mail penetration from large employers •Strong specialty market growth DesignRx •Leader in cash-pay infertility treatment Envision Insurance •Med D is one of fastest growing areas of healthcare spending as eligible members increase •Cost-effective drug management plans = attractive value proposition Laker Software • 3rd Party claims adjudication • Robust, flexible technology platform Discount Cards • Partnership opportunities • Continued adoption by uninsured and underinsured Envision’sflexible PBM model appeals to a diverse client base
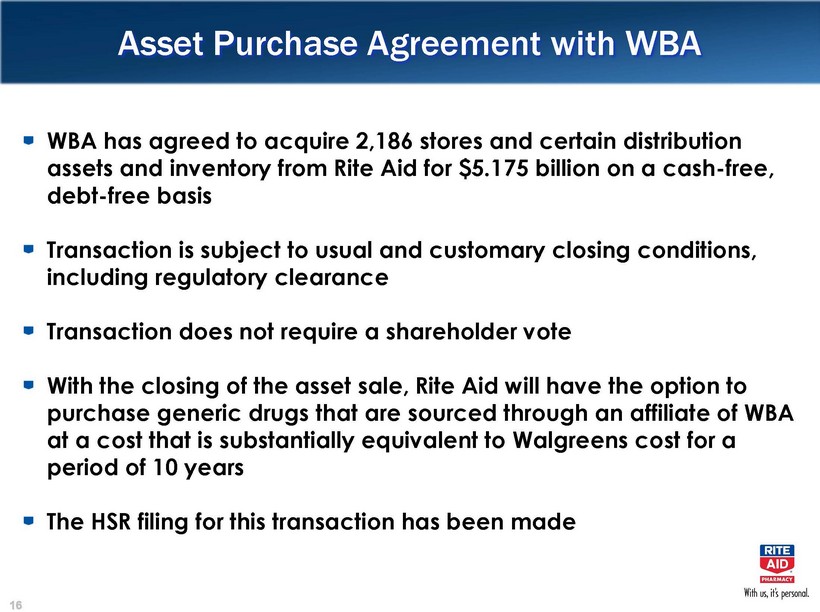
Asset Purchase Agreement with WBA WBA has agreed to acquire 2,186 stores and certain distribution assets and inventory from Rite Aid for $5.175 billion on a cash-free, debt-free basis Transaction is subject to usual and customary closing conditions, including regulatory clearance Transaction does not require a shareholder vote With the closing of the asset sale, Rite Aid will have the option to purchase generic drugs that are sourced through an affiliate of WBA at a cost that is substantially equivalent to Walgreens cost for a period of 10 years The HSR filing for this transaction has been made
Strategic Rationale Allows Rite Aid to significantly reduce leverage and provides flexibility to invest in the business More diversified business model „{ Reduces exposure to reimbursement rate pressure by virtue of reducing relative size of retail pharmacy business „{ Higher percentage of Adjusted EBITDA from higher growth PBM business Strong profile of remaining stores „{ Per store sales & Adjusted EBITDA higher than current chain average „{ Approximately 70% of stores in Wellness or Customer World formats „{ Attractive store base with strong presence in key regions of the country Greater ability to invest in higher growth PBM Participation in Walgreens Boots Alliance Development (¡§WBAD¡¨) agreement provides opportunity to lower drug costs
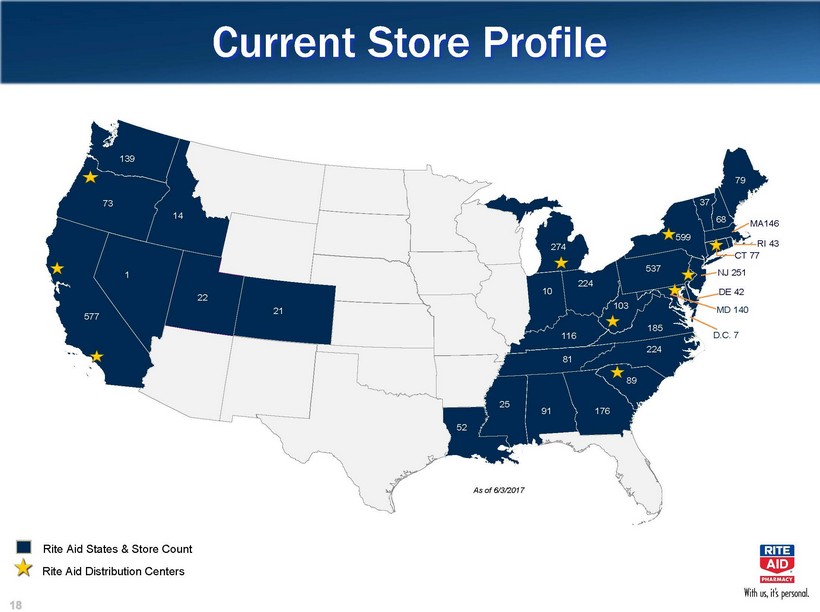
Current Store Profile Rite Aid States & Store Count Rite Aid Distribution Centers As of 6/3/2017 139 14 73 1 577 22 21 274 10 224 116 81 52 25 91 89 224 537 103 79 185 37 68 MA146 RI 43 CT 77 NJ 251 DE 42 D.C. 7 176 599 MD 140\
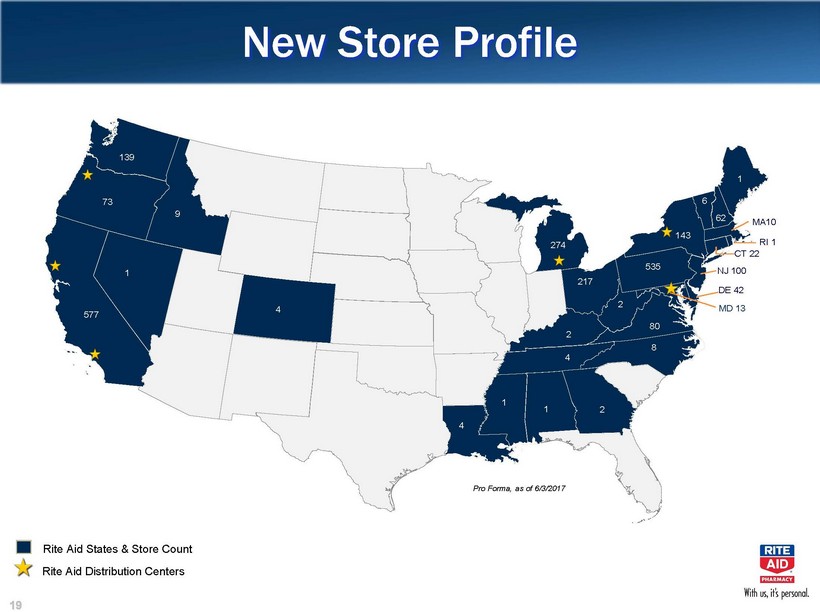
New Store Profile Rite Aid States & Store Count Rite Aid Distribution Centers Pro Forma, as of 6/3/2017 139 9 73 1 577 4 274 217 2 4 4 1 1 8 535 2 1 80 6 62 MA10 RI 1 CT 22 NJ 100 DE 42 . 2 143 MD 13

Strong Presence in Key States Note: Represents our position in CBSA’s where we have a presence, based on store count. Source is from Neilson Trade Dimensions data (February 2017). Stores 1st 2nd 3rd California 577 32% 35% 18% Pennsylvania 535 66% 21% 10% Michigan 274 72% 7% 7% Ohio 217 65% 12% 3% NewYork 143 45% 9% 18% Washington 139 42% 37% 11% Oregon 73 55% 10% 20% Position in CBSA’s
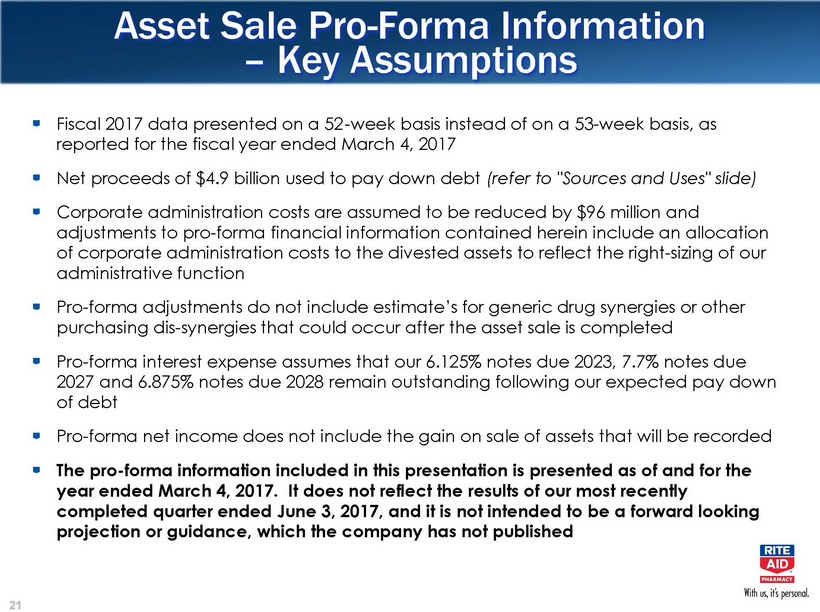
Asset Sale Pro-Forma Information –Key Assumptions Fiscal 2017 data presented on a 52 -week basis instead of on a 53-week basis, as reported for the fiscal year ended March 4, 2017 Net proceeds of $4.9 billion used to pay down debt (refer to "Sources and Uses" slide) Corporate administration costs are assumed to be reduced by $96 million and adjustments to pro-forma financial information contained herein include an allocation of corporate administration costs to the divested assets to reflect the right-sizing of our administrative function Pro -forma adjustments do not include estimate’s for generic drug synergies or other purchasing dis-synergies that could occur after the asset sale is completed Pro -forma interest expense assumes that our 6.125% notes due 2023, 7.7% notes due 2027 and 6.875% notes due 2028 remain outstanding following our expected pay down of debt Pro -forma net income does not include the gain on sale of assets that will be recorded The pro -forma information included in this presentation is presented as of and for the year ended March 4, 2017. It does not reflect the results of our most recently completed quarter ended June 3, 2017, and it is not intended to be a forward looking projection or guidance, which the company has not published
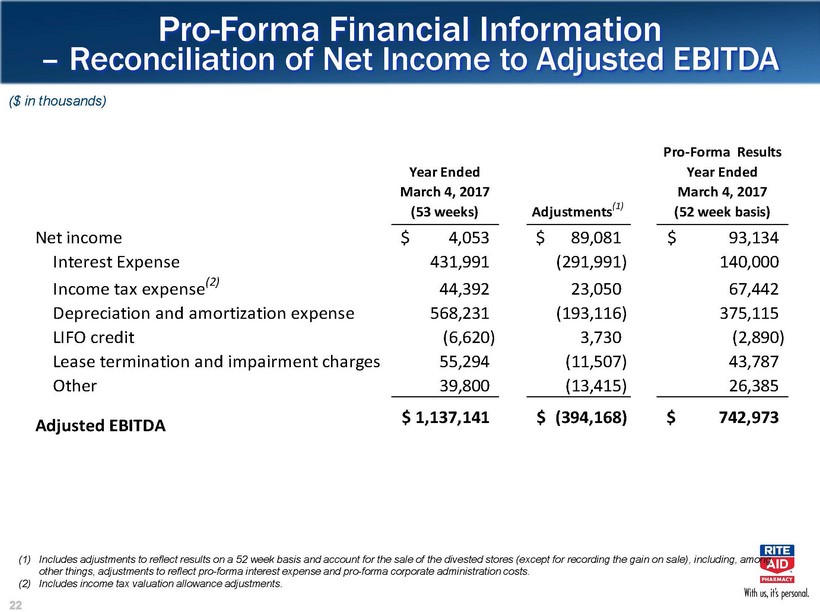
Pro-Forma Financial Information –Reconciliation of Net Income to Adjusted EBITDA ($ in thousands) (1) Includes adjustments to reflect results on a 52 week basis and account for the sale of the divested stores (except for recordingthe gain on sale), including, among other things, adjustments to reflect pro-forma interest expense and pro-forma corporate administration costs. (2)Includes income tax valuation allowance adjustments. Year EndedMarch 4, 2017(53 weeks)Adjustments(1)Pro-Forma ResultsYear EndedMarch 4, 2017(52 week basis)Net income4,053$ 89,081$ 93,134$ Interest Expense431,991 (291,991) 140,000 Income tax expense(2)44,392 23,050 67,442 Depreciation and amortization expense568,231 (193,116) 375,115 LIFO credit(6,620) 3,730 (2,890) Lease termination and impairment charges55,294 (11,507) 43,787 Other39,800 (13,415) 26,385 Adjusted EBITDA1,137,141$ (394,168)$ 742,973$

Pro-Forma Sources & Uses ($ in millions) SourcesEstimated Purchase Price(1)5,175$ Merger Termination Fee325Total Sources5,500$ UsesEstimated Accrued Liabilities (Net of Retained Assets)(2)369$ Estimated Restructuring Charges and Transaction Costs100Estimated Income Tax Expense on Sale of Assets(3)111Estimated Debt Repayments4,920Total Uses5,500$ (1) Purchase price assumes that all 2,186 stores are sold. The final number and composition of stores sold could differ, which could impact the final purchase price. (2)Based on net liability balances as of March 4, 2017. (3)Based on the expected ability as of the date hereof to use the company’s current federal and state tax net operating loss carryforwards, and assumes no change in control for purposes of Section 382 under the Internal Revenue Code occurs prior to the closing of the transaction.
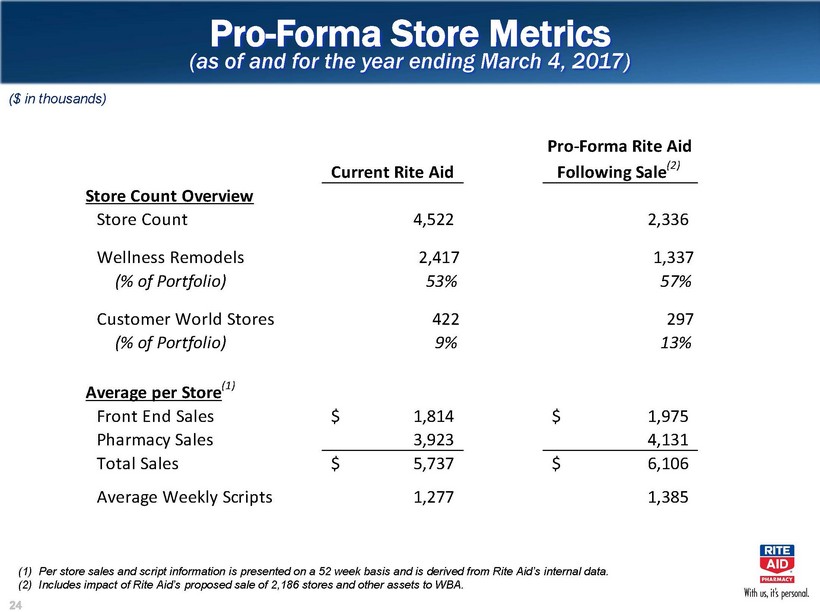
Pro-Forma Store Metrics(as of and for the year ending March 4, 2017) (1) Per store sales and script information is presented on a 52 week basis and is derived from Rite Aid’s internal data. (2) Includes impact of Rite Aid’s proposed sale of 2,186 stores and other assets to WBA. Current Rite AidPro-Forma Rite AidFollowing Sale(2)Store Count OverviewStore Count4,5222,336Wellness Remodels2,4171,337(% of Portfolio)53%57%Customer World Stores422297(% of Portfolio)9%13%Average per Store(1)Front End Sales1,814$ 1,975$ Pharmacy Sales3,923 4,131 Total Sales5,737$ 6,106$ Average Weekly Scripts1,2771,385 ($ in thousands)
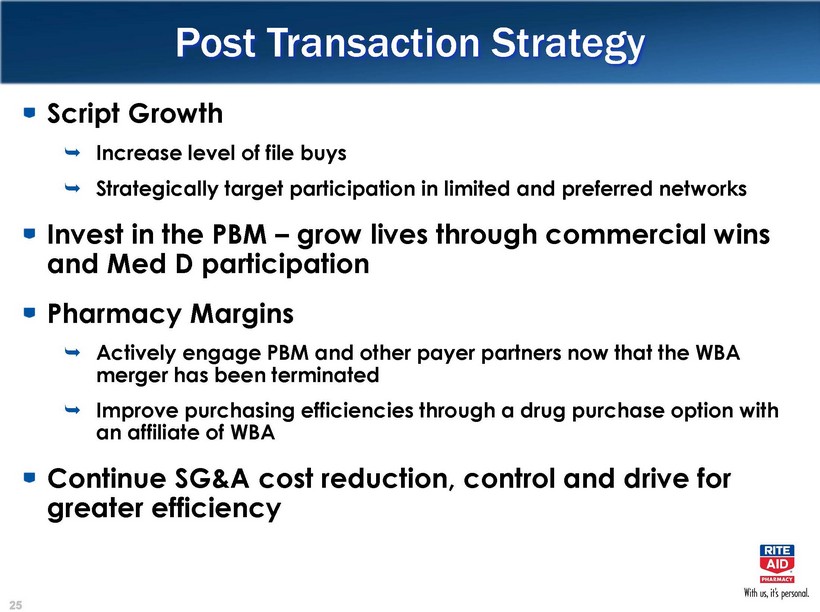
Post Transaction Strategy Script Growth „{ Increase level of file buys „{ Strategically target participation in limited and preferred networks Invest in the PBM ¡Vgrow lives through commercial wins and Med D participation Pharmacy Margins „{ Actively engage PBM and other payer partners now that the WBA merger has been terminated „{ Improve purchasing efficiencies through a drug purchase option with an affiliate of WBA Continue SG&A cost reduction, control and drive for greater efficiency

with us, its’s personal.
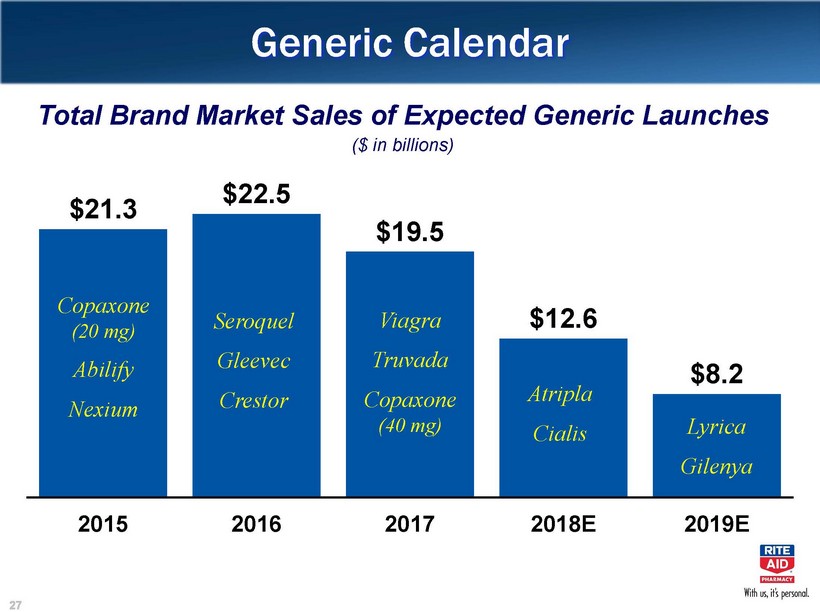
Generic Calendar $21.3 $22.5 $19.5 $12.6 $8.2 2015 2016 2017 2018E 2019E Total Brand Market Sales of Expected Generic Launches Copaxone(20 mg) Abilify Nexium Seroquel Gleevec Crestor Viagra Truvada Copaxone(40 mg) Atripla Cialis Lyrica Gilenya ($ in billions)
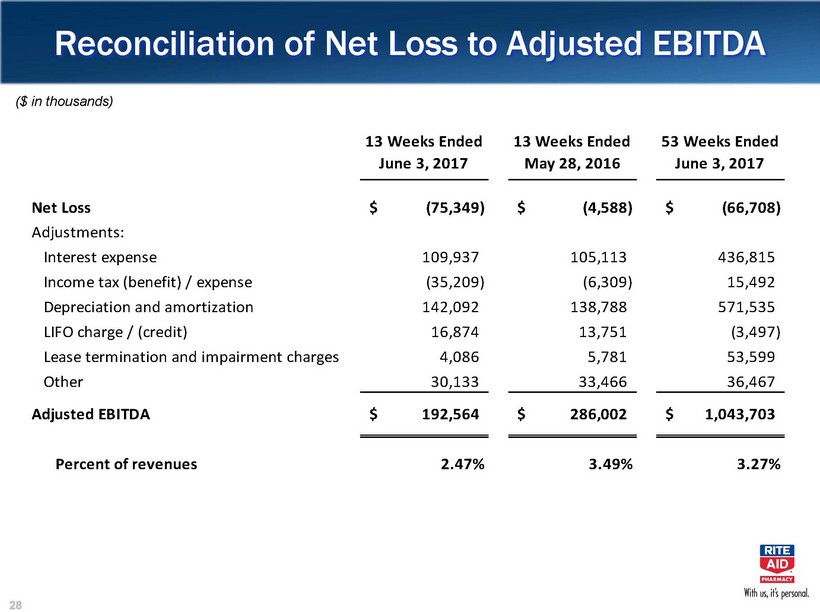
Reconciliation of Net Loss to Adjusted EBITDA ($ in thousands) 13 Weeks EndedJune 3, 201713 Weeks Ended May 28, 201653 Weeks Ended June 3, 2017Net Loss(75,349)$ (4,588)$ (66,708)$ Adjustments:Interest expense109,937 105,113 436,815 Income tax (benefit) / expense(35,209) (6,309) 15,492 Depreciation and amortization142,092 138,788 571,535 LIFO charge / (credit) 16,874 13,751 (3,497) Lease termination and impairment charges4,086 5,781 53,599 Other30,133 33,466 36,467 Adjusted EBITDA192,564$ 286,002$ 1,043,703$ Percent of revenues2.47%3.49%3.27%

Reconciliation of Adjusted EBITDA Gross ProfitRETAIL PHARMACY SEGMENT ($ in thousands) 13 Weeks EndedJune 3, 201713 Weeks Ended May 28, 201653 Weeks Ended June 3, 2017Revenues6,350,208$ 6,675,548$ 26,491,328$ Gross Profit1,654,062 1,805,367 7,230,028 Addback:LIFO charge / (credit)16,874 13,750 (3,497) Customer loyalty card program revenue deferral15,986 13,037 (9,759) Depreciation and amortization (COGS portion only)4,529 3,938 18,323 Other1,592 318 5,222 Adjusted EBITDA Gross Profit1,693,043$ 1,836,410$ 7,240,317$ Adjusted EBITDA Gross Profit as a percent of revenue26.66%27.51%27.33%

Reconciliation of Adjusted EBITDA SG&ARETAIL PHARMACY SEGMENT ($ in thousands) 13 Weeks Ended June 3, 201713 Weeks Ended May 28, 201653 Weeks Ended June 3, 2017Total Revenues6,350,208$ 6,675,548$ 26,491,328$ Selling, general and administrative expenses1,682,391 1,723,903 6,907,348 Less:Depreciation and amortization (SG&A portion only)115,037 113,263 463,269 Stock based compensation expense9,038 11,143 21,375 Other9,240 7,911 30,431 Adjusted EBITDA SG&A1,549,076$ 1,591,586$ 6,392,273$ Adjusted EBITDA SG&A as a percent of revenue24.39%23.84%24.13%
with us, it’s personal.