Attached files
| file | filename |
|---|---|
| EX-99.2 - EXHIBIT 99.2 - Global Brokerage, Inc. | s107096_ex99-2.htm |
| EX-99.1 - EXHIBIT 99.1 - Global Brokerage, Inc. | s107096_ex99-1.htm |
| 8-K - Global Brokerage, Inc. | s107096_8k.htm |
Exhibit 99.3
1 Second Quarter 2017 Financial and Operating Results August 9, 2017
2 Thispresentationmaycontain"forward-lookingstatements"withinthemeaningofSection27AoftheSecuritiesActof1933,Section21EoftheSecurities ExchangeActof1934and/orthePrivateSecuritiesLitigationReformActof1995,whichreflectGlobalBrokerage'scurrentviewswithrespectto,amongother things,itsoperationsandfinancialperformanceinthefuture.Theseforward-lookingstatementsarenothistoricalfactsandarebasedoncurrentexpectations, estimatesandprojectionsaboutGlobalBrokerage’sindustry,businessplans,management'sbeliefsandcertainassumptionsmadebymanagement,manyofwhich, bytheirnature,areinherentlyuncertainandbeyondourcontrol.Accordingly,readersarecautionedthatanysuchforward-lookingstatementsarenotguarantees offutureperformanceandaresubjecttocertainrisks,uncertaintiesandassumptionsthataredifficulttopredictincluding,withoutlimitation,risksassociatedwith GlobalBrokerage’sstrategytofocusonitsoperationsoutsidetheUnitedStates,risksassociatedwiththeeventsthattookplaceinthecurrencymarketsonJanuary 15,2015andtheirimpactonGlobalBrokerage'scapitalstructure,risksassociatedwithGlobalBrokerage'sabilitytorecoveralloraportionofanycapitallosses, risksassociatedwiththepotentialdelistingofGlobalBrokerage'scommonstockfromtheNasdaqGlobalSelectMarketandthepotentialconsequencesofsucha delistingunderGlobalBrokerage'sfinancingagreements,risksrelatingtotheabilityofGlobalBrokeragetosatisfythetermsandconditionsoformakepayments pursuanttothetermsofthefinanceagreementswithLeucadia,aswellasrisksassociatedwithGlobalBrokerage’sobligationsunderitsotherfinancing agreements,risksrelatedtoGlobalBrokerage'sdependenceonFXmarketmakers,marketconditions,risksassociatedwiththeoutcomeofanypotentiallitigation orregulatoryinquiriestowhichGlobalBrokeragemaybecomesubject,risksassociatedwithpotentialreputationaldamagetoGlobalBrokerageresultingfromits saleofUScustomeraccounts,andthoseotherrisksdescribedunder"RiskFactors"inGlobalBrokerage’sAnnualReportonForm10-K,GlobalBrokerage’slatest QuarterlyReportonForm10-Q,andotherreportsordocumentsGlobalBrokeragefileswiththeSECfromtimetotime,whichareaccessibleontheSECwebsiteat sec.gov.ThisinformationshouldalsobereadinconjunctionwithGlobalBrokerage'sConsolidatedFinancialStatementsandtheNotestheretocontainedinGlobal Brokerage’sAnnualReportonForm10-K,GlobalBrokerage’slatestQuarterlyReportonForm10-Q,andinotherreportsordocumentsthatGlobalBrokeragefiles withtheSECfromtimetotime,whichareaccessibleontheSECwebsiteatsec.gov. Global Brokerage undertakes no obligation to publicly update or review any forward-looking statement, whether as a result of new information, future developments or otherwise. Non-GAAP Financial Measures: This presentation presents certain non-GAAP financial measures. These measures should not be considered in isolation from, or as a substitute for, measures prepared in accordance with generally accepted accounting principles. See the appendix to this presentation for reconciliations of these non-GAAP financial measures to the most comparable measures calculated and presented in accordance with GAAP. Safe Harbor
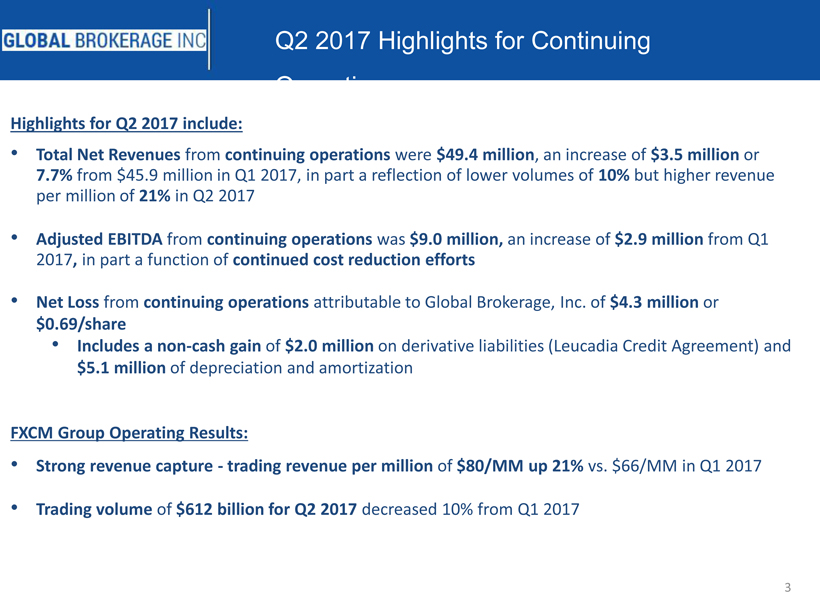
3 Q2 2017 Highlights for Continuing Operations Highlights for Q2 2017 include: • Total Net Revenues from continuing operations were $49.4 million, an increase of $3.5 million or 7.7%from $45.9 million in Q1 2017, in part a reflection of lower volumes of 10%but higher revenue per million of 21%in Q2 2017 • AdjustedEBITDAfrom continuing operationswas $9.0 million,an increase of $2.9 million from Q1 2017,in part a function of continued cost reduction efforts • Net Loss fromcontinuing operations attributable to Global Brokerage, Inc. of$4.3million or $0.69/share • Includes a non-cash gain of$2.0 million on derivative liabilities (Leucadia Credit Agreement) and $5.1 million of depreciation and amortization FXCM Group Operating Results: • Strong revenue capture -trading revenue per million of $80/MM up 21% vs. $66/MM in Q1 2017 • Trading volume of $612 billion for Q2 2017 decreased 10% from Q1 2017
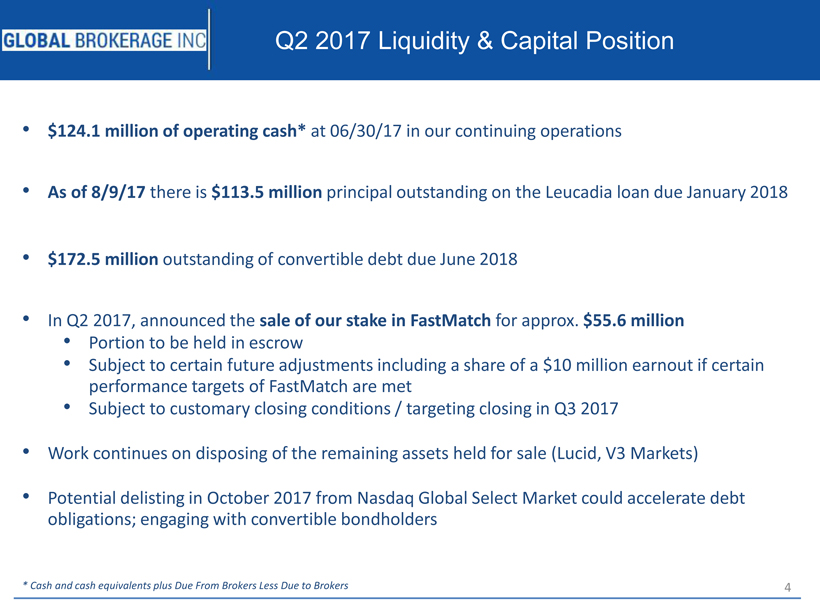
4 • $124.1 million of operating cash*at 06/30/17 in our continuing operations • As of 8/9/17 there is $113.5 million principaloutstanding on the Leucadia loan due January 2018 • $172.5 million outstanding of convertible debt due June 2018 • In Q2 2017, announced the sale of our stake in FastMatchfor approx. $55.6 million • Portion to be held in escrow • Subject to certain future adjustments including a share of a $10 million earnoutif certain performance targets of FastMatchare met • Subject to customary closing conditions / targeting closing in Q3 2017 • Work continues on disposing of the remaining assets held for sale (Lucid, V3 Markets) • Potential delisting in October 2017 from Nasdaq Global Select Market could accelerate debt obligations; engaging with convertible bondholders Q2 2017 Liquidity & Capital Position * Cash and cash equivalents plus Due From Brokers Less Due to Brokers
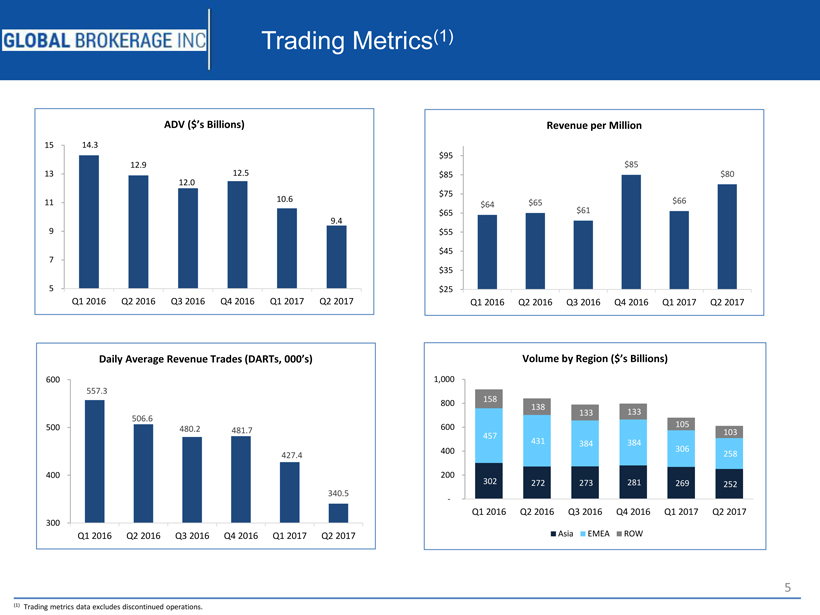
5 Trading Metrics (1) 14.3 12.9 12.0 12.5 10.6 9.4 5 7 9 11 13 15 Q1 2016 Q2 2016 Q3 2016 Q4 2016 Q1 2017 Q2 2017 ADV ($’s Billions) $64 $65 $61 $85 $66 $80 $25 $35 $45 $55 $65 $75 $85 $95 Q1 2016 Q2 2016 Q3 2016 Q4 2016 Q1 2017 Q2 2017 Revenue per Million 557.3 506.6 480.2 481.7 427.4 340.5 300 400 500 600 Q1 2016 Q2 2016 Q3 2016 Q4 2016 Q1 2017 Q2 2017 Daily Average Revenue Trades (DARTs, 000’s) 302 272 273 281 269 252 457 431 384 384 306 258 158 138 133 133 105 103 - 200 400 600 800 1,000 Q1 2016 Q2 2016 Q3 2016 Q4 2016 Q1 2017 Q2 2017 Volume by Region ($’s Billions) Asia EMEA ROW (1) Trading metrics data excludes discontinued operations.
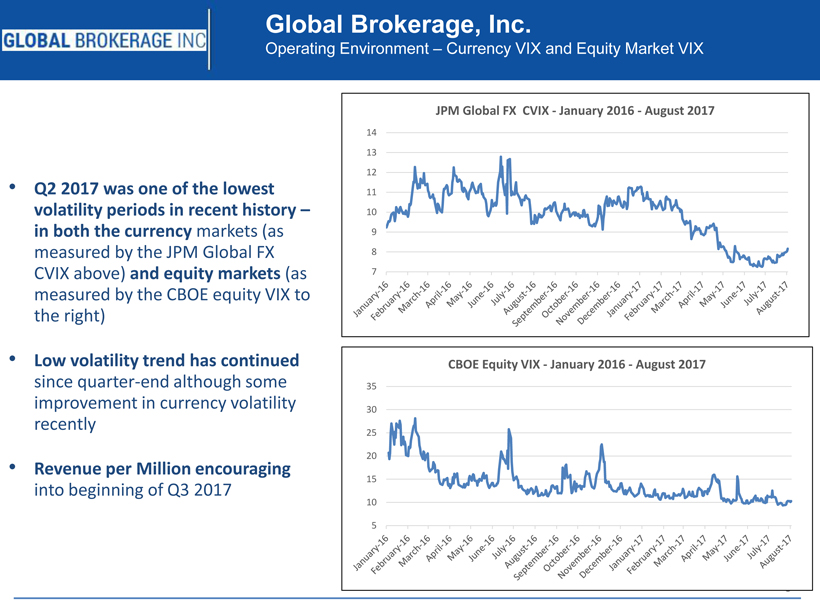
6 Global Brokerage, Inc. Operating Environment –Currency VIX and Equity Market VIX • Q2 2017 was one of the lowest volatility periods in recent history – in both the currency markets (as measured by the JPM Global FX CVIX above) and equity markets (as measured by the CBOE equity VIX to the right) • Low volatility trend has continued since quarter-end although some improvement in currency volatility recently • Revenue per Million encouraging into beginning of Q3 2017 7 8 9 10 11 12 13 14 JPM Global FX CVIX -January 2016 -August 2017 5 10 15 20 25 30 35 CBOE Equity VIX -January 2016 -August 2017
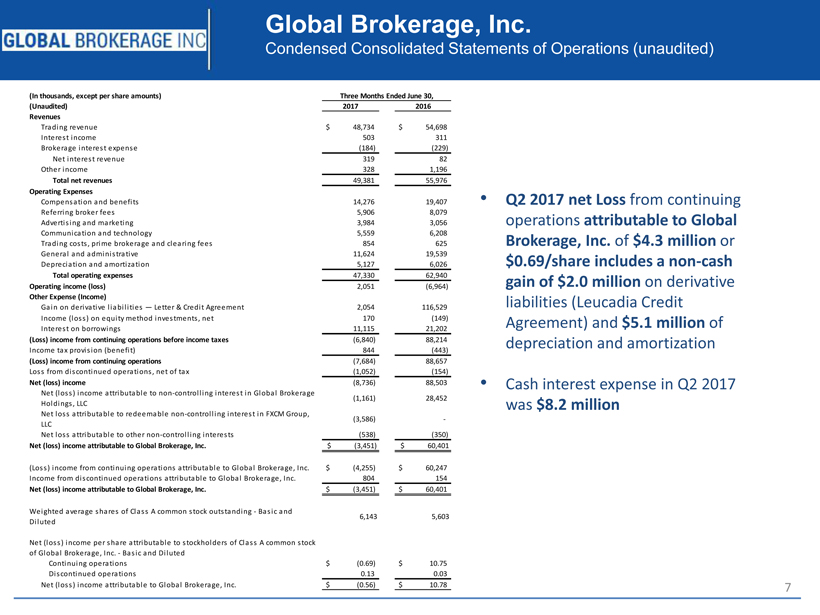
7 Global Brokerage, Inc. Condensed Consolidated Statements of Operations (unaudited) • Q2 2017 net Loss from continuing operationsattributable to Global Brokerage, Inc. of$4.3 million or $0.69/share includes a non-cash gain of $2.0 million on derivative liabilities (Leucadia Credit Agreement) and $5.1 million of depreciation and amortization • Cash interest expense in Q2 2017 was $8.2 million (In thousands, except per share amounts) (Unaudited) 2017 2016 Revenues Trading revenue $ 48,734 $ 54,698 Interest income 503 311 Brokerage interest expense (184) (229) Net interest revenue 319 82 Other income 328 1,196 Total net revenues 49,381 55,976 Operating Expenses Compensation and benefits 14,276 19,407 Referring broker fees 5,906 8,079 Advertising and marketing 3,984 3,056 Communication and technology 5,559 6,208 Trading costs, prime brokerage and clearing fees 854 625 General and administrative 11,624 19,539 Depreciation and amortization 5,127 6,026 Total operating expenses 47,330 62,940 Operating income (loss) 2,051 (6,964) Other Expense (Income) Gain on derivative liabilities — Letter & Credit Agreement 2,054 116,529 Income (loss) on equity method investments, net 170 (149) Interest on borrowings 11,115 21,202 (Loss) income from continuing operations before income taxes (6,840) 88,214 Income tax provision (benefit) 844 (443) (Loss) income from continuing operations (7,684) 88,657 Loss from discontinued operations, net of tax (1,052) (154) Net (loss) income (8,736) 88,503 Net (loss) income attributable to non-controlling interest in Global Brokerage Holdings, LLC (1,161) 28,452 Net loss attributable to redeemable non-controlling interest in FXCM Group, LLC (3,586) - Net loss attributable to other non-controlling interests (538) (350) Net (loss) income attributable to Global Brokerage, Inc. $ (3,451) $ 60,401 (Loss) income from continuing operations attributable to Global Brokerage, Inc. $ (4,255) $ 60,247 Income from discontinued operations attributable to Global Brokerage, Inc. 804 154 Net (loss) income attributable to Global Brokerage, Inc. $ (3,451) $ 60,401 Weighted average shares of Class A common stock outstanding - Basic and Diluted 6,143 5,603 Net (loss) income per share attributable to stockholders of Class A common stock of Global Brokerage, Inc. - Basic and Diluted Continuing operations $ (0.69) $ 10.75 Discontinued operations 0.13 0.03 Net (loss) income attributable to Global Brokerage, Inc. $ (0.56) $ 10.78 Three Months Ended June 30,
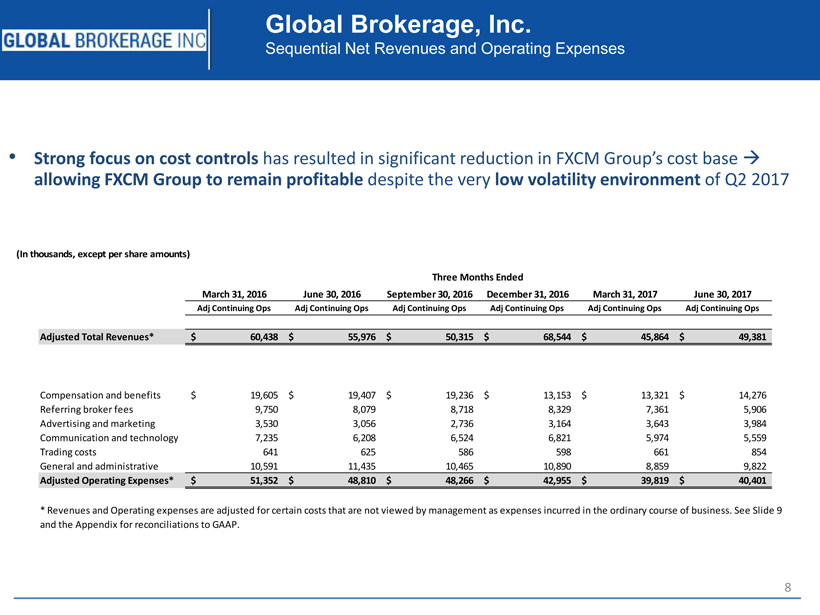
8 Global Brokerage, Inc. Sequential Net Revenues and Operating Expenses (In thousands, except per share amounts) • Strong focus on cost controls has resulted in significant reduction in FXCM Group’s cost base allowing FXCM Group to remain profitable despite the very low volatility environment of Q2 2017 March 31, 2016 June 30, 2016 September 30, 2016 December 31, 2016 March 31, 2017 June 30, 2017 Adj Continuing Ops Adj Continuing Ops Adj Continuing Ops Adj Continuing Ops Adj Continuing Ops Adj Continuing Ops Adjusted Total Revenues* 60,438$ 55,976$ 50,315$ 68,544$ 45,864$ 49,381$ Compensation and benefits 19,605$ 19,407$ 19,236$ 13,153$ 13,321$ 14,276$ Referring broker fees 9,750 8,079 8,718 8,329 7,361 5,906 Advertising and marketing 3,530 3,056 2,736 3,164 3,643 3,984 Communication and technology 7,235 6,208 6,524 6,821 5,974 5,559 Trading costs 641 625 586 598 661 854 General and administrative 10,591 11,435 10,465 10,890 8,859 9,822 Adjusted Operating Expenses* 51,352$ 48,810$ 48,266$ 42,955$ 39,819$ 40,401$ * Revenues and Operating expenses are adjusted for certain costs that are not viewed by management as expenses incurred in the ordinary course of business. See Slide 9 and the Appendix for reconciliations to GAAP. Three Months Ended
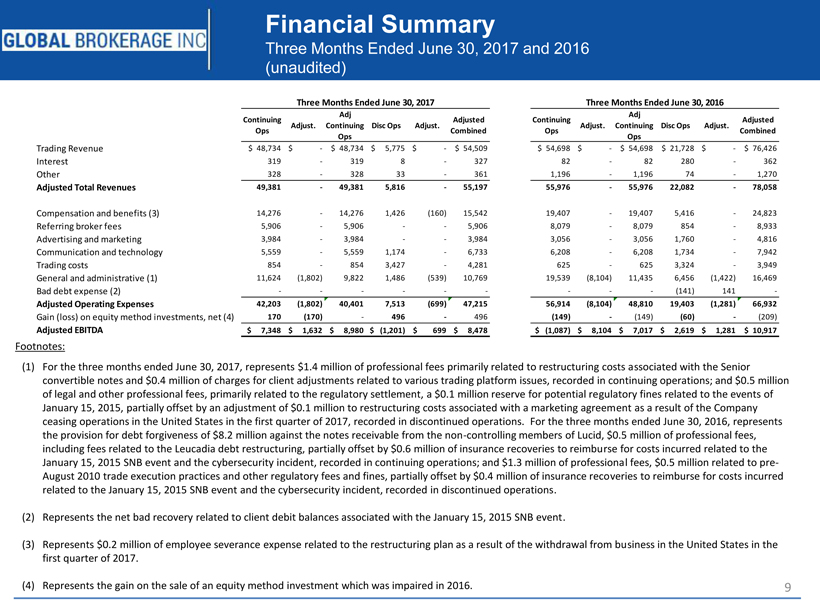
9 Financial Summary Three Months Ended June 30, 2017 and 2016 (unaudited) Footnotes: (1) For the three months ended June 30, 2017, represents $1.4 million of professional fees primarily related to restructuring costs associated with the Senior convertible notes and $0.4 million of charges for client adjustments related to various trading platform issues, recorded in continuing operations; and $0.5 million of legal and other professional fees, primarily related to the regulatory settlement, a $0.1 million reserve for potential regulatory fines related to the events of January 15, 2015, partially offset by an adjustment of $0.1 million to restructuring costs associated with a marketing agreementas a result of the Company ceasing operations in the United States in the first quarter of 2017, recorded in discontinued operations.For the three monthsended June 30, 2016, represents the provision for debt forgiveness of $8.2 million against the notes receivable from the non-controlling members of Lucid, $0.5 million of professional fees, including fees related to the Leucadia debt restructuring, partially offset by $0.6 million of insurance recoveries to reimbursefor costs incurred related to the January 15, 2015 SNB event and the cybersecurity incident, recorded in continuing operations; and $1.3 million of professional fees, $0.5 million related to pre- August 2010 trade execution practices and other regulatory fees and fines, partially offset by $0.4 million of insurance recoveries to reimburse for costs incurred related to the January 15, 2015 SNB event and the cybersecurity incident, recorded in discontinued operations. (2) Represents the net bad recovery related to client debit balances associated with the January 15, 2015 SNB event. (3) Represents $0.2 million of employee severance expense related to the restructuring plan as a result of the withdrawal from business in the United States in the first quarter of 2017. (4) Represents the gain on the sale of an equity method investment which was impaired in 2016. Continuing Ops Adjust. Adj Continuing Ops Disc Ops Adjust. Adjusted Combined Continuing Ops Adjust. Adj Continuing Ops Disc Ops Adjust. Adjusted Combined Trading Revenue $ 48,734 $ - $ 48,734 $ 5,775 $ - $ 54,509 $ 54,698 $ - $ 54,698 $ 21,728 $ - $ 76,426 Interest 319 - 319 8 - 327 82 - 82 280 - 362 Other 328 - 328 33 - 361 1,196 - 1,196 74 - 1,270 Adjusted Total Revenues 49,381 - 49,381 5,816 - 55,197 55,976 - 55,976 22,082 - 78,058 Compensation and benefits (3) 14,276 - 14,276 1,426 (160) 15,542 19,407 - 19,407 5,416 - 24,823 Referring broker fees 5,906 - 5,906 - - 5,906 8,079 - 8,079 854 - 8,933 Advertising and marketing 3,984 - 3,984 - - 3,984 3,056 - 3,056 1,760 - 4,816 Communication and technology 5,559 - 5,559 1,174 - 6,733 6,208 - 6,208 1,734 - 7,942 Trading costs 854 - 854 3,427 - 4,281 625 - 625 3,324 - 3,949 General and administrative (1) 11,624 (1,802) 9,822 1,486 (539) 10,769 19,539 (8,104) 11,435 6,456 (1,422) 16,469 Bad debt expense (2) - - - - - - - - - (141) 141 - Adjusted Operating Expenses 42,203 (1,802) 40,401 7,513 (699) 47,215 56,914 (8,104) 48,810 19,403 (1,281) 66,932 Gain (loss) on equity method investments, net (4) 170 (170) - 496 - 496 (149) - (149) (60) - (209) Adjusted EBITDA $ 7,348 $ 1,632 $ 8,980 $ (1,201) $ 699 $ 8,478 $ (1,087) $ 8,104 $ 7,017 $ 2,619 $ 1,281 $ 10,917 Three Months Ended June 30, 2016Three Months Ended June 30, 2017
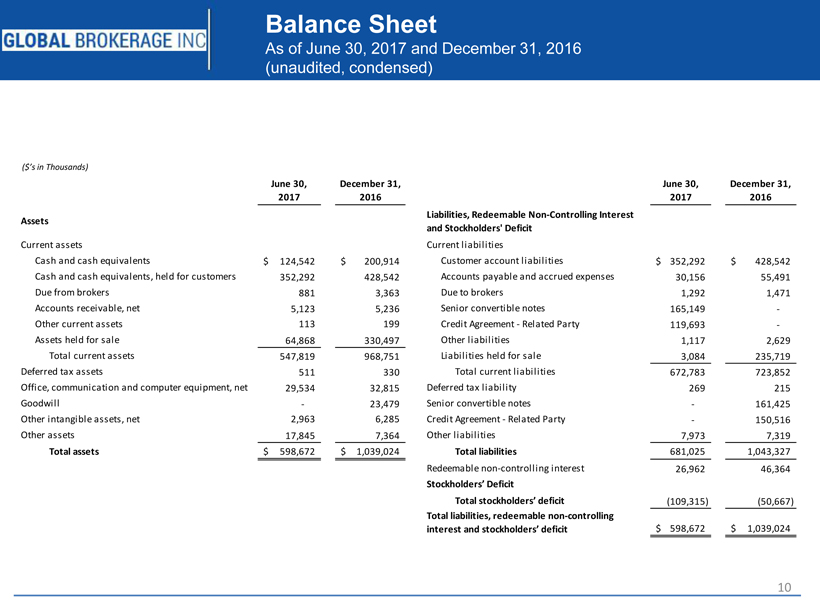
10 Balance Sheet As of June 30, 2017 and December 31, 2016 (unaudited, condensed) ($’s in Thousands) June 30, 2017 December 31, 2016 June 30, 2017 December 31, 2016 Assets Liabilities, Redeemable Non-Controlling Interest and Stockholders' Deficit Current assets Current liabilities Cash and cash equivalents 124,542$ 200,914$ Customer account liabilities 352,292$ 428,542$ Cash and cash equivalents, held for customers 352,292 428,542 Accounts payable and accrued expenses 30,156 55,491 Due from brokers 881 3,363 Due to brokers 1,292 1,471 Accounts receivable, net 5,123 5,236 Senior convertible notes 165,149 - Other current assets 113 199 Credit Agreement - Related Party 119,693 - Assets held for sale 64,868 330,497 Other liabilities 1,117 2,629 Total current assets 547,819 968,751 Liabilities held for sale 3,084 235,719 Deferred tax assets 511 330 Total current liabilities 672,783 723,852 Office, communication and computer equipment, net 29,534 32,815 Deferred tax liability 269 215 Goodwill - 23,479 Senior convertible notes - 161,425 Other intangible assets, net 2,963 6,285 Credit Agreement - Related Party - 150,516 Other assets 17,845 7,364 Other liabilities 7,973 7,319 Total assets 598,672$ 1,039,024$ Total liabilities 681,025 1,043,327 Redeemable non-controlling interest 26,962 46,364 Stockholders’ Deficit Total stockholders’ deficit (109,315) (50,667) Total liabilities, redeemable non-controlling interest and stockholders’ deficit 598,672$ 1,039,024$
11 Appendix
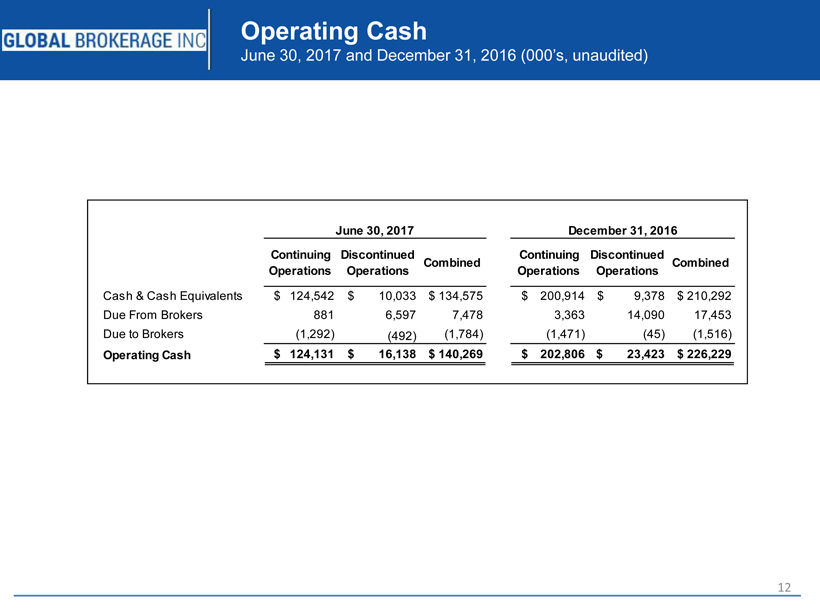
12 Operating Cash June 30, 2017 and December 31, 2016 (000’s, unaudited) Continuing Operations Discontinued Operations Combined Continuing Operations Discontinued Operations Combined Cash & Cash Equivalents $ 124,542 $ 10,033 $ 134,575 $ 200,914 $ 9,378 $ 210,292 Due From Brokers 881 6,597 7,478 3,363 14,090 17,453 Due to Brokers (1,292) (492) (1,784) (1,471) (45) (1,516) Operating Cash $ 124,131 $ 16,138 $ 140,269 $ 202,806 $ 23,423 $ 226,229 June 30, 2017 December 31, 2016
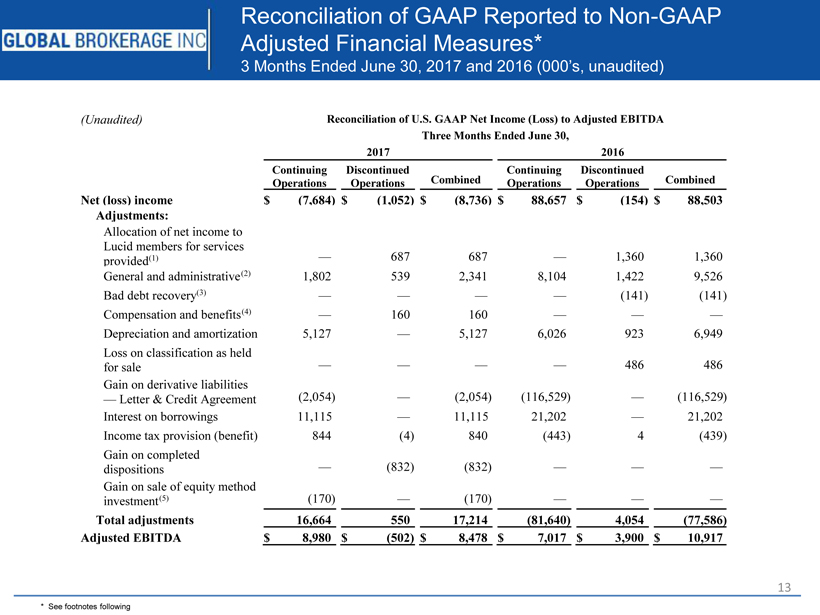
13 Reconciliation of GAAP Reported to Non-GAAP Adjusted Financial Measures* 3 Months Ended June 30, 2017 and 2016 (000’s, unaudited) * See footnotes following (Unaudited) Reconciliation of U.S. GAAP Net Income (Loss) to Adjusted EBITDA Three Months Ended June 30, 2017 2016 Continuing Operations Discontinued Operations Combined Continuing Operations Discontinued Operations Combined Net (loss) income $ (7,684 ) $ (1,052 ) $ (8,736 ) $ 88,657 $ (154 ) $ 88,503 Adjustments: Allocation of net income to Lucid members for services provided (1) — 687 687 — 1,360 1,360 General and administrative (2) 1,802 539 2,341 8,104 1,422 9,526 Bad debt recovery (3) — — — — (141 ) (141 ) Compensation and benefits (4) — 160 160 — — — Depreciation and amortization 5,127 — 5,127 6,026 923 6,949 Loss on classification as held for sale — — — — 486 486 Gain on derivative liabilities — Letter & Credit Agreement (2,054 ) — (2,054 ) (116,529 ) — (116,529 ) Interest on borrowings 11,115 — 11,115 21,202 — 21,202 Income tax provision (benefit) 844 (4 ) 840 (443 ) 4 (439 ) Gain on completed dispositions — (832 ) (832 ) — — — Gain on sale of equity method investment (5) (170 ) — (170 ) — — — Total adjustments 16,664 550 17,214 (81,640 ) 4,054 (77,586 ) Adjusted EBITDA $ 8,980 $ (502 ) $ 8,478 $ 7,017 $ 3,900 $ 10,917
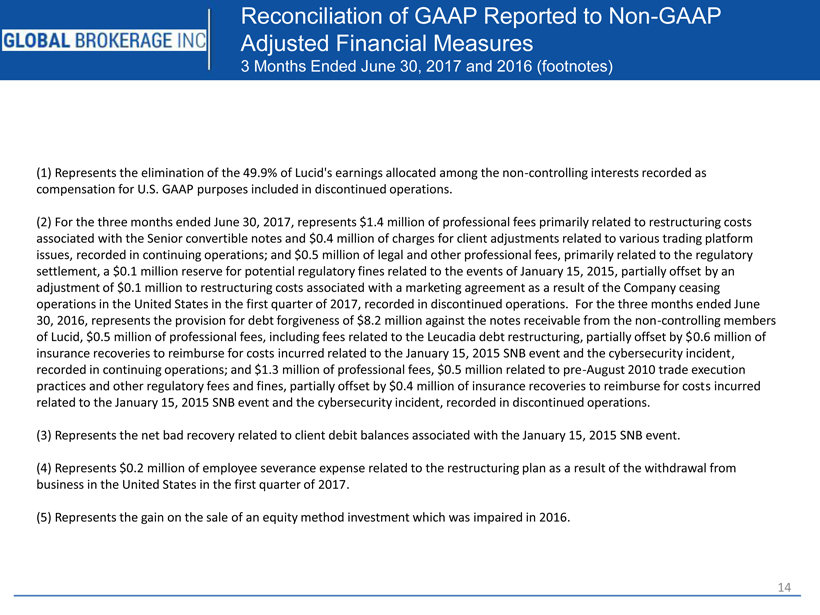
14 Reconciliation of GAAP Reported to Non-GAAP Adjusted Financial Measures 3Months Ended June 30, 2017 and 2016 (footnotes) (1) Represents the elimination of the 49.9% of Lucid's earnings allocated among the non-controlling interests recorded as compensation for U.S. GAAP purposes included in discontinued operations. (2) For the three months ended June 30, 2017, represents $1.4 million of professional fees primarily related to restructuring costs associated with the Senior convertible notes and $0.4 million of charges for client adjustments related to various trading platform issues, recorded in continuing operations; and $0.5 million of legal and other professional fees, primarily related to the regulatory settlement, a $0.1 million reserve for potential regulatory fines related to the events of January 15, 2015, partially offsetbyan adjustment of $0.1 million to restructuring costs associated with a marketing agreement as a result of the Company ceasing operations in the United States in the first quarter of 2017, recorded in discontinued operations.For the three months ended June 30, 2016, represents the provision for debt forgiveness of $8.2 million against the notes receivable from the non-controlling members of Lucid, $0.5 million of professional fees, including fees related to the Leucadia debt restructuring, partially offset by $0.6million of insurance recoveries to reimburse for costs incurred related to the January 15, 2015 SNB event and the cybersecurity incident, recorded in continuing operations; and $1.3 million of professional fees, $0.5 million related to pre-August 2010 trade execution practices and other regulatory fees and fines, partially offset by $0.4 million of insurance recoveries to reimburse for costs incurred related to the January 15, 2015 SNB event and the cybersecurity incident, recorded in discontinued operations. (3) Represents the net bad recovery related to client debit balances associated with the January 15, 2015 SNB event. (4) Represents $0.2 million of employee severance expense related to the restructuring plan as a result of the withdrawal from business in the United States in the first quarter of 2017. (5) Represents the gain on the sale of an equity method investment which was impaired in 2016.
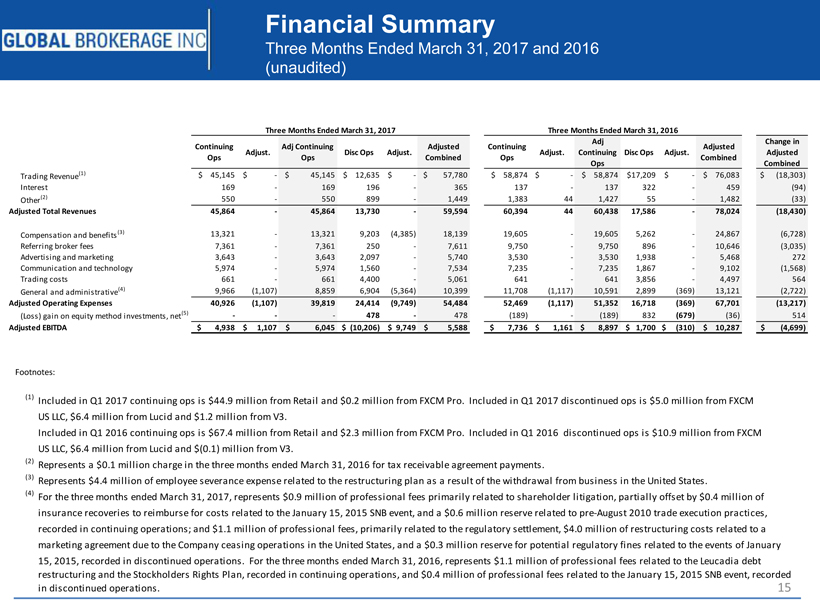
15 Financial Summary Three Months Ended March 31, 2017 and 2016 (unaudited) Footnotes: Continuing Ops Adjust. Adj Continuing Ops Disc Ops Adjust. Adjusted Combined Continuing Ops Adjust. Adj Continuing Ops Disc Ops Adjust. Adjusted Combined Change in Adjusted Combined Trading Revenue (1) $ 45,145 $ - $ 45,145 $ 12,635 $ - $ 57,780 $ 58,874 $ - $ 58,874 $17,209 $ - $ 76,083 $ (18,303) Interest 169 - 169 196 - 365 137 - 137 322 - 459 (94) Other (2) 550 - 550 899 - 1,449 1,383 44 1,427 55 - 1,482 (33) Adjusted Total Revenues 45,864 - 45,864 13,730 - 59,594 60,394 44 60,438 17,586 - 78,024 (18,430) Compensation and benefits (3) 13,321 - 13,321 9,203 (4,385) 18,139 19,605 - 19,605 5,262 - 24,867 (6,728) Referring broker fees 7,361 - 7,361 250 - 7,611 9,750 - 9,750 896 - 10,646 (3,035) Advertising and marketing 3,643 - 3,643 2,097 - 5,740 3,530 - 3,530 1,938 - 5,468 272 Communication and technology 5,974 - 5,974 1,560 - 7,534 7,235 - 7,235 1,867 - 9,102 (1,568) Trading costs 661 - 661 4,400 - 5,061 641 - 641 3,856 - 4,497 564 General and administrative (4) 9,966 (1,107) 8,859 6,904 (5,364) 10,399 11,708 (1,117) 10,591 2,899 (369) 13,121 (2,722) Adjusted Operating Expenses 40,926 (1,107) 39,819 24,414 (9,749) 54,484 52,469 (1,117) 51,352 16,718 (369) 67,701 (13,217) (Loss) gain on equity method investments, net (5) - - - 478 - 478 (189) - (189) 832 (679) (36) 514 Adjusted EBITDA $ 4,938 $ 1,107 $ 6,045 $ (10,206) $ 9,749 $ 5,588 $ 7,736 $ 1,161 $ 8,897 $ 1,700 $ (310) $ 10,287 $ (4,699) Three Months Ended March 31, 2017 Three Months Ended March 31, 2016 (1) Included in Q1 2017 continuing ops is $44.9 million from Retail and $0.2 million from FXCM Pro. Included in Q1 2017 discontinued ops is $5.0 million from FXCM US LLC, $6.4 million from Lucid and $1.2 million from V3. Included in Q1 2016 continuing ops is $67.4 million from Retail and $2.3 million from FXCM Pro. Included in Q1 2016 discontinued ops is $10.9 million from FXCM US LLC, $6.4 million from Lucid and $(0.1) million from V3. (2) Represents a $0.1 million charge in the three months ended March 31, 2016 for tax receivable agreement payments. (3) Represents $4.4 million of employee severance expense related to the restructuring plan as a result of the withdrawal from business in the United States. (4) For the three months ended March 31, 2017, represents $0.9 million of professional fees primarily related to shareholder litigation, partially offset by $0.4 million of insurance recoveries to reimburse for costs related to the January 15, 2015 SNB event, and a $0.6 million reserve related to pre-August 2010 trade execution practices, recorded in continuing operations; and $1.1 million of professional fees, primarily related to the regulatory settlement, $4.0 million of restructuring costs related to a marketing agreement due to the Company ceasing operations in the United States, and a $0.3 million reserve for potential regulatory fines related to the events of January 15, 2015, recorded in discontinued operations. For the three months ended March 31, 2016, represents $1.1 million of professional fees related to the Leucadia debt restructuring and the Stockholders Rights Plan, recorded in continuing operations, and $0.4 million of professional fees related to the January 15, 2015 SNB event, recorded in discontinued operations.
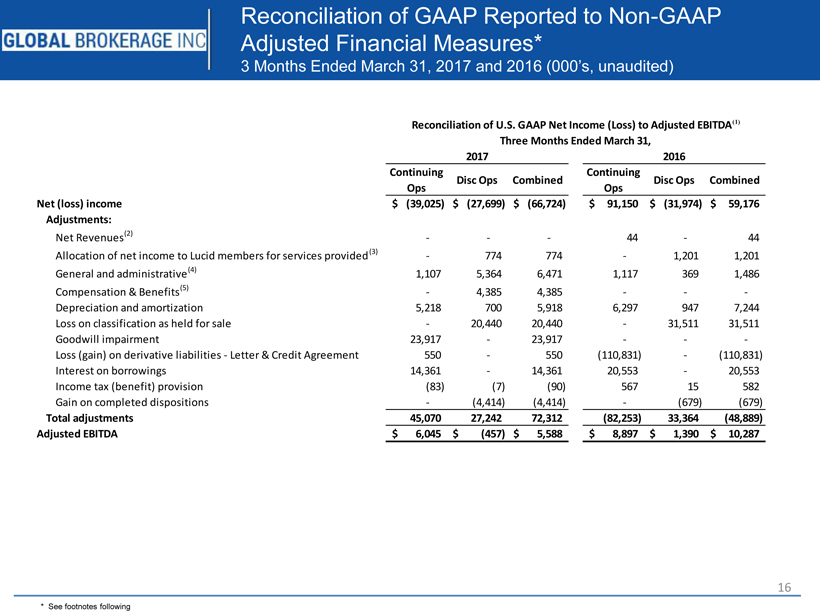
16 Reconciliation of GAAP Reported to Non-GAAP Adjusted Financial Measures* 3 Months Ended March 31, 2017 and 2016 (000’s, unaudited) * See footnotes following Continuing Ops Disc Ops Combined Continuing Ops Disc Ops Combined Net (loss) income (39,025)$ (27,699)$ (66,724)$ 91,150$ (31,974)$ 59,176$ Adjustments: Net Revenues (2) - - - 44 - 44 Allocation of net income to Lucid members for services provided (3) - 774 774 - 1,201 1,201 General and administrative (4) 1,107 5,364 6,471 1,117 369 1,486 Compensation & Benefits (5) - 4,385 4,385 - - - Depreciation and amortization 5,218 700 5,918 6,297 947 7,244 Loss on classification as held for sale - 20,440 20,440 - 31,511 31,511 Goodwill impairment 23,917 - 23,917 - - - Loss (gain) on derivative liabilities - Letter & Credit Agreement 550 - 550 (110,831) - (110,831) Interest on borrowings 14,361 - 14,361 20,553 - 20,553 Income tax (benefit) provision (83) (7) (90) 567 15 582 Gain on completed dispositions - (4,414) (4,414) - (679) (679) Total adjustments 45,070 27,242 72,312 (82,253) 33,364 (48,889) Adjusted EBITDA 6,045$ (457)$ 5,588$ 8,897$ 1,390$ 10,287$ Reconciliation of U.S. GAAP Net Income (Loss) to Adjusted EBITDA (1) Three Months Ended March 31, 2017 2016
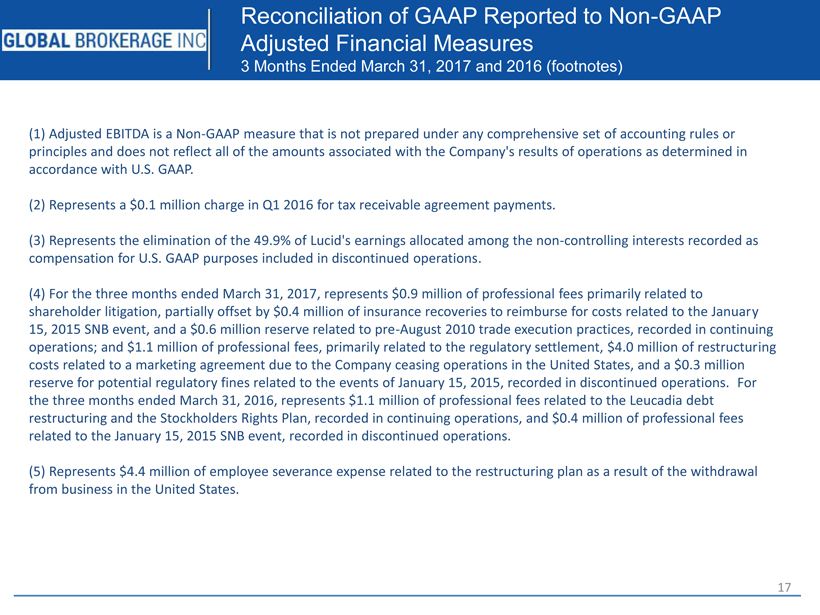
17 Reconciliation of GAAP Reported to Non-GAAP Adjusted Financial Measures 3Months Ended March 31, 2017 and 2016 (footnotes) (1) Adjusted EBITDA is a Non-GAAP measure that is not prepared under any comprehensive set of accounting rules or principles and does not reflect all of the amounts associated with the Company's results of operations as determined in accordance with U.S. GAAP. (2) Represents a $0.1 million charge in Q1 2016 for tax receivable agreement payments. (3) Represents the elimination of the 49.9% of Lucid'searnings allocated among the non-controlling interests recorded as compensation for U.S. GAAP purposes included in discontinued operations. (4) For the three months ended March 31, 2017, represents $0.9 million of professional fees primarily related to shareholder litigation, partially offset by $0.4 million of insurance recoveries to reimburse for costs related to the January 15, 2015 SNB event, and a $0.6 million reserve related to pre-August 2010 trade execution practices, recorded in continuing operations; and $1.1 million of professional fees, primarily related to the regulatory settlement, $4.0 million of restructuring costs related to a marketing agreement due to the Company ceasing operations in the United States, and a $0.3 million reserve for potential regulatory fines related to the events of January 15, 2015, recorded in discontinued operations. For the three months ended March 31, 2016, represents $1.1 million of professional fees related to the Leucadia debt restructuring and the Stockholders Rights Plan, recorded in continuing operations, and $0.4 million of professional fees related to the January 15, 2015 SNB event, recorded in discontinued operations. (5) Represents $4.4 million of employee severance expense related to the restructuring plan as a result of the withdrawal from business in the United States.

18 Financial Summary Three Months Ended September 30, 2016 (unaudited) ($’s in Thousands) Footnotes: (1) Included in Q3 2016 continuing ops is $47.4 million from Retail and $0.6 million from FXCM Pro. Included in Q3 2016 discontinued ops is $9.8 million from FXCM US LLC, $5.8 million from Lucid and $3.0 million from V3. (2) Represents $1.3 million of professional fees including fees related to the Leucadia Restructuring Transaction and other SNB related costs included in continuing operations and $0.7 million of regulatory and legal costs related to the SNB event in discontinued operations. Continuing Ops Adjust. Adj Continuing Ops Disc Ops Adjust. Adjusted Combined Trading Revenue(1) $ 48,042 $ - $ 48,042 $ 18,609 $ - $ 66,651 Interest 320 - 320 255 - 575 Other 1,954 - 1,954 1,042 - 2,996 Adjusted Total Revenues 50,315 - 50,315 19,907 - 70,222 Compensation and benefits 19,236 - 19,236 4,875 - 24,111 Referring broker fees 8,718 - 8,718 817 - 9,535 Advertising and marketing 2,736 - 2,736 2,333 - 5,069 Communication and technology 6,524 - 6,524 1,766 - 8,290 Trading costs 586 - 586 3,252 - 3,838 General and administrative(2) 11,814 (1,349) 10,465 3,279 (729) 13,015 Bad debt expense - - - - - - Adjusted Operating Expenses 49,615 (1,349) 48,266 16,321 (729) 63,858 (Loss) gain on equity method investments, net (140) - (140) 149 - 9 Adjusted EBITDA $ 560 $ 1,349 $ 1,909 $ 3,735 $ 729 $ 6,373 Three Months Ended September 30, 2016
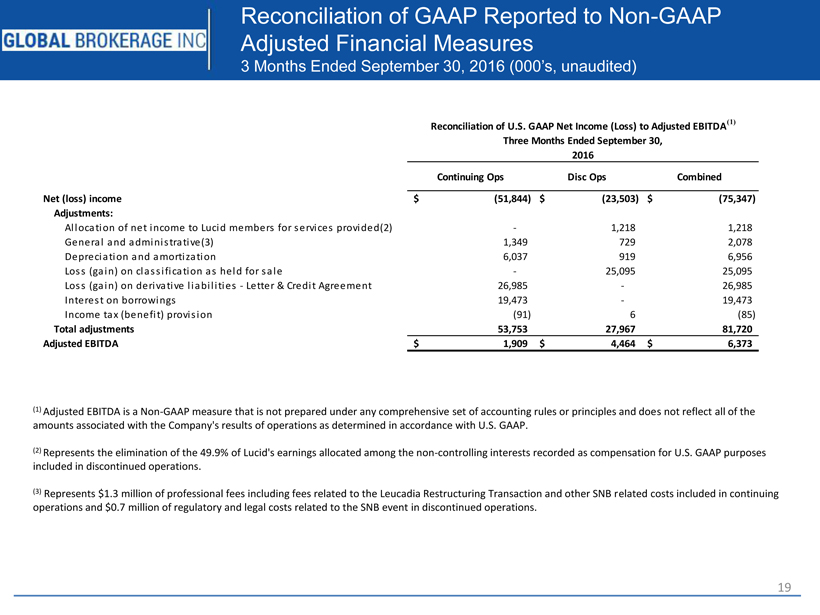
19 Reconciliation of GAAP Reported to Non-GAAP Adjusted Financial Measures 3 Months Ended September 30, 2016 (000’s, unaudited) (1) Adjusted EBITDA is a Non-GAAP measure that is not prepared under any comprehensive set of accounting rules or principles and does not reflect all of the amounts associated with the Company's results of operations as determined in accordance with U.S. GAAP. (2) Represents the elimination of the 49.9% of Lucid'searnings allocated among the non-controlling interests recorded as compensation for U.S. GAAP purposes included in discontinued operations. (3) Represents $1.3 million of professional fees including fees related to the Leucadia Restructuring Transaction and other SNB related costs included in continuing operations and $0.7 million of regulatory and legal costs related to the SNB event in discontinued operations. Continuing Ops Disc Ops Combined Net (loss) income (51,844)$ (23,503)$ (75,347)$ Adjustments: Allocation of net income to Lucid members for services provided(2) - 1,218 1,218 General and administrative(3) 1,349 729 2,078 Depreciation and amortization 6,037 919 6,956 Loss (gain) on classification as held for sale - 25,095 25,095 Loss (gain) on derivative liabilities - Letter & Credit Agreement 26,985 - 26,985 Interest on borrowings 19,473 - 19,473 Income tax (benefit) provision (91) 6 (85) Total adjustments 53,753 27,967 81,720 Adjusted EBITDA 1,909$ 4,464$ 6,373$ Reconciliation of U.S. GAAP Net Income (Loss) to Adjusted EBITDA (1) Three Months Ended September 30, 2016
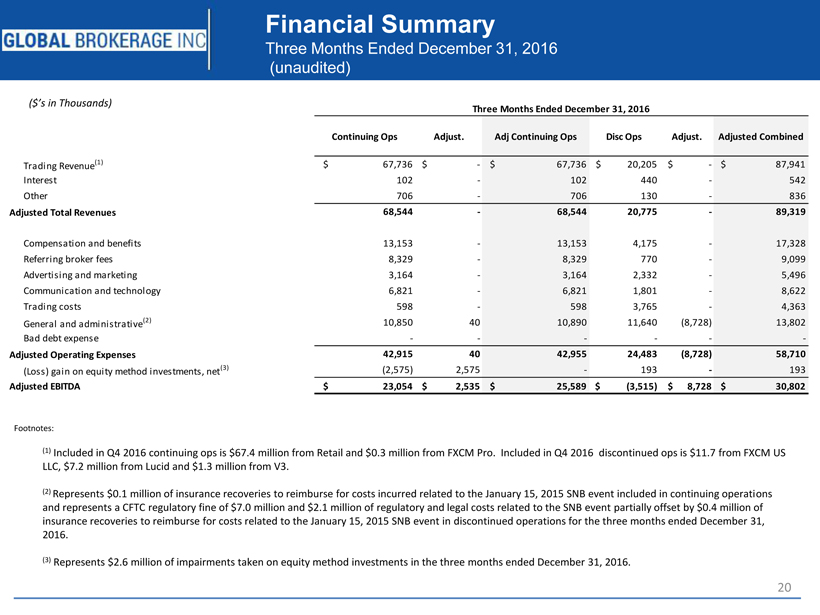
20 Financial Summary Three Months Ended December 31, 2016 (unaudited) ($’s in Thousands) Footnotes: (1) Included in Q4 2016 continuing ops is $67.4 million from Retail and $0.3 million from FXCM Pro. Included in Q4 2016 discontinued ops is $11.7 from FXCM US LLC, $7.2 million from Lucid and $1.3 million from V3. (2) Represents $0.1 million of insurance recoveries to reimburse for costs incurred related to the January 15, 2015 SNB event included in continuing operations and represents a CFTC regulatory fine of $7.0 million and $2.1 million of regulatory and legal costs related to the SNB event partially offset by $0.4 million of insurance recoveries to reimburse for costs related to the January 15, 2015 SNB event in discontinued operations for the three months ended December 31, 2016. (3) Represents $2.6 million of impairments taken on equity method investments in the three months ended December 31, 2016. Continuing Ops Adjust. Adj Continuing Ops Disc Ops Adjust. Adjusted Combined Trading Revenue (1) $ 67,736 $ - $ 67,736 $ 20,205 $ - $ 87,941 Interest 102 - 102 440 - 542 Other 706 - 706 130 - 836 Adjusted Total Revenues 68,544 - 68,544 20,775 - 89,319 Compensation and benefits 13,153 - 13,153 4,175 - 17,328 Referring broker fees 8,329 - 8,329 770 - 9,099 Advertising and marketing 3,164 - 3,164 2,332 - 5,496 Communication and technology 6,821 - 6,821 1,801 - 8,622 Trading costs 598 - 598 3,765 - 4,363 General and administrative (2) 10,850 40 10,890 11,640 (8,728) 13,802 Bad debt expense - - - - - - Adjusted Operating Expenses 42,915 40 42,955 24,483 (8,728) 58,710 (Loss) gain on equity method investments, net (3) (2,575) 2,575 - 193 - 193 Adjusted EBITDA $ 23,054 $ 2,535 $ 25,589 $ (3,515) $ 8,728 $ 30,802 Three Months Ended December 31, 2016
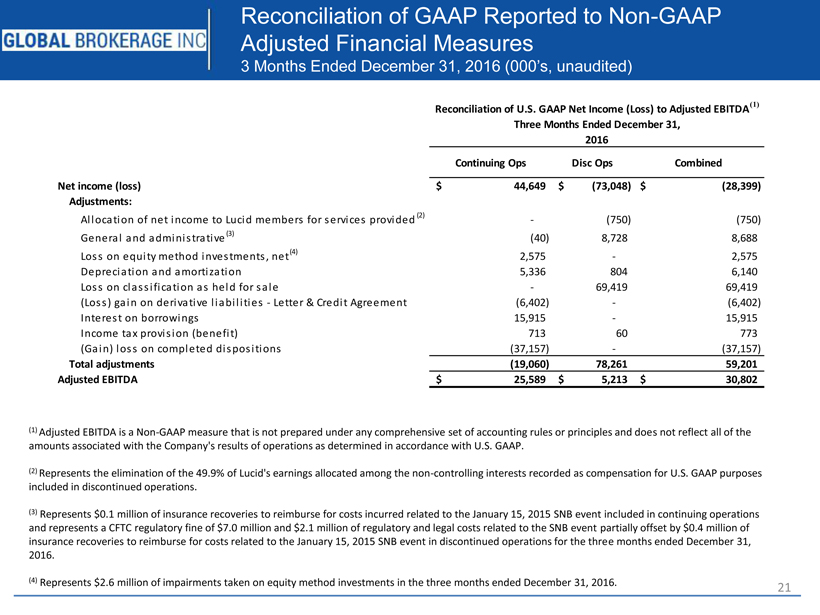
21 Reconciliation of GAAP Reported to Non-GAAP Adjusted Financial Measures 3 Months Ended December 31, 2016 (000’s, unaudited) (1) Adjusted EBITDA is a Non-GAAP measure that is not prepared under any comprehensive set of accounting rules or principles and does not reflect all of the amounts associated with the Company's results of operations as determined in accordance with U.S. GAAP. (2) Represents the elimination of the 49.9% of Lucid'searnings allocated among the non-controlling interests recorded as compensation for U.S. GAAP purposes included in discontinued operations. (3) Represents $0.1 million of insurance recoveries to reimburse for costs incurred related to the January 15, 2015 SNB event included in continuing operations and represents a CFTC regulatory fine of $7.0 million and $2.1 million of regulatory and legal costs related to the SNB eventpartially offset by $0.4 million of insurance recoveries to reimburse for costs related to the January 15, 2015 SNB event in discontinued operations for the three months ended December 31, 2016. (4) Represents $2.6 million of impairments taken on equity method investments in the three months ended December 31, 2016. Continuing Ops Disc Ops Combined Net income (loss) 44,649$ (73,048)$ (28,399)$ Adjustments: Allocation of net income to Lucid members for services provided (2) - (750) (750) General and administrative (3) (40) 8,728 8,688 Loss on equity method investments, net (4) 2,575 - 2,575 Depreciation and amortization 5,336 804 6,140 Loss on classification as held for sale - 69,419 69,419 (Loss) gain on derivative liabilities - Letter & Credit Agreement (6,402) - (6,402) Interest on borrowings 15,915 - 15,915 Income tax provision (benefit) 713 60 773 (Gain) loss on completed dispositions (37,157) - (37,157) Total adjustments (19,060) 78,261 59,201 Adjusted EBITDA 25,589$ 5,213$ 30,802$ 2016 Reconciliation of U.S. GAAP Net Income (Loss) to Adjusted EBITDA (1) Three Months Ended December 31,