Attached files
| file | filename |
|---|---|
| EX-99.2 - EX-99.2 - Clear Channel Outdoor Holdings, Inc. | d409381dex992.htm |
| 8-K - 8-K - Clear Channel Outdoor Holdings, Inc. | d409381d8k.htm |
Exhibit 99.1
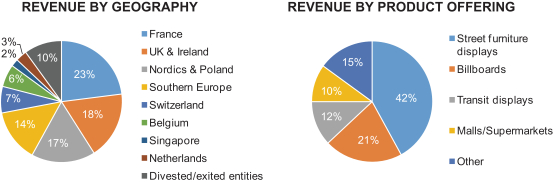
The charts below summarize the breakdown of our revenue by geography and product offering for the year ended December 31, 2016. For a description of the major markets in which we operate, see “Business—Our Major Markets.”
SUMMARY HISTORICAL CONSOLIDATED FINANCIAL DATA
The following table sets forth summary historical consolidated financial data as of the dates and for the periods indicated. The summary historical consolidated financial data for the years ended December 31, 2016, 2015 and 2014, and as of December 31, 2016 and 2015, are derived from our audited consolidated financial statements, which are included elsewhere in this offering circular. The summary historical consolidated financial data for the six months ended June 30, 2017 and 2016 and as of June 30, 2017 are derived from our unaudited consolidated financial statements, which are included elsewhere in this offering circular. The summary historical consolidated financial data as of December 31, 2014 and June 30, 2016 are derived from our audited and unaudited consolidated financial statements, respectively, which are not included in this offering circular. In the opinion of management, the interim financial data reflects all adjustments (consisting only of normal and recurring adjustments) necessary for a fair presentation of the results for the interim periods. The summary historical financial information for the twelve months ended June 30, 2017 are derived by adding the historical financial information for the six months ended June 30, 2017 to the historical financial information for the year ended December 31, 2016 and subtracting the historical financial information for the six months ended June 30, 2016. Historical results are not necessarily indicative of the results to be expected for future periods and the interim results are not necessarily indicative of the results that may be expected for the full year.
The summary historical consolidated financial and other data should be read in conjunction with “Risk Factors,” “Management’s Discussion and Analysis of Financial Condition and Results of Operations,” “Selected Issuer, Guarantor and Non-Guarantor Financial Data” and our consolidated financial statements and the related notes thereto included elsewhere in this offering circular. The amounts in the tables may not sum due to rounding.
1
| Year Ended December 31, |
Six Months Ended June 30, |
Twelve Months Ended June 30, |
||||||||||||||||||||||
| (U.S. dollars in thousands) | 2016 | 2015 | 2014 | 2017 | 2016 | 2017 | ||||||||||||||||||
| Results of Operations Data: |
||||||||||||||||||||||||
| Revenue |
$ | 1,168,707 | $ | 1,222,400 | $ | 1,381,653 | $ | 502,712 | $ | 574,492 | $ | 1,096,927 | ||||||||||||
| Operating expenses: |
||||||||||||||||||||||||
| Direct operating expenses |
753,610 | 792,566 | 897,136 | 345,353 | 376,160 | 722,803 | ||||||||||||||||||
| Selling, general and administrative expenses |
247,277 | 254,004 | 279,237 | 109,091 | 127,663 | 228,705 | ||||||||||||||||||
| Corporate expenses |
37,179 | 37,745 | 45,996 | 24,459 | 19,889 | 41,749 | ||||||||||||||||||
| Depreciation and amortization |
97,607 | 118,892 | 138,878 | 35,250 | 48,534 | 84,323 | ||||||||||||||||||
| Impairment charges |
7,274 | — | — | — | — | 7,274 | ||||||||||||||||||
| Other operating income (expense)—net |
74,980 | 4,617 | 4,539 | 7,866 | (55,908 | ) | 138,754 | |||||||||||||||||
|
|
|
|
|
|
|
|
|
|
|
|
|
|||||||||||||
| Operating income (loss) |
100,740 | 23,810 | 24,945 | (3,575 | ) | (53,662 | ) | 150,827 | ||||||||||||||||
| Interest expense—net |
37,899 | 68,112 | 72,147 | 16,893 | 20,175 | 34,617 | ||||||||||||||||||
| Equity in earnings (loss) of equity method investees |
(2,837 | ) | (1,935 | ) | 2,038 | (805 | ) | (1,333 | ) | (2,309 | ) | |||||||||||||
| Other income (expense)—net |
(9,246 | ) | (3,381 | ) | 6,176 | (1,353 | ) | (6,839 | ) | (3,760 | ) | |||||||||||||
|
|
|
|
|
|
|
|
|
|
|
|
|
|||||||||||||
| Net income (loss) from continuing operations before income taxes |
50,758 | (49,618 | ) | (38,988 | ) | (22,626 | ) | (82,009 | ) | 110,141 | ||||||||||||||
| Income tax (benefit) expense |
(32,315 | ) | 12,282 | 4,244 | 4,717 | 11,005 | (38,603 | ) | ||||||||||||||||
|
|
|
|
|
|
|
|
|
|
|
|
|
|||||||||||||
| Consolidated net income (loss) |
83,073 | (61,900 | ) | (43,232 | ) | (27,343 | ) | (93,014 | ) | 148,744 | ||||||||||||||
| Less amount attributable to noncontrolling interest |
6,167 | 7,095 | 8,814 | 1 | 2,919 | 3,249 | ||||||||||||||||||
|
|
|
|
|
|
|
|
|
|
|
|
|
|||||||||||||
| Net income (loss) attributable to the Company |
76,906 | (68,995 | ) | (52,046 | ) | (27,344 | ) | (95,933 | ) | 145,495 | ||||||||||||||
| Other comprehensive income (loss), net of tax |
105,434 | 98,576 | 103,443 | (23,829 | ) | 58,430 | 23,175 | |||||||||||||||||
|
|
|
|
|
|
|
|
|
|
|
|
|
|||||||||||||
| Comprehensive income (loss) |
182,340 | 29,581 | 51,397 | (51,173 | ) | (37,503 | ) | 168,670 | ||||||||||||||||
| Less amount attributable to noncontrolling interest |
1,444 | (4,026 | ) | (3,916 | ) | 108 | 1,006 | 546 | ||||||||||||||||
|
|
|
|
|
|
|
|
|
|
|
|
|
|||||||||||||
| Comprehensive income (loss) attributable to the Company |
$ | 180,896 | $ | 33,607 | $ | 55,313 | $ | (51,281 | ) | $ | (38,509 | ) | $ | 168,124 | ||||||||||
|
|
|
|
|
|
|
|
|
|
|
|
|
|||||||||||||
| Cash Flow Data: |
||||||||||||||||||||||||
| Capital expenditures |
$ | 88,522 | $ | 70,222 | $ | 57,453 | $ | 43,716 | $ | 39,810 | $ | 92,428 | ||||||||||||
| Net cash provided by (used for) operating activities |
135,592 | 46,322 | 39,452 | (9,356 | ) | 23,476 | 102,760 | |||||||||||||||||
| Net cash provided by (used for) investing activities |
99,130 | (319,681 | ) | (45,095 | ) | (32,052 | ) | (39,854 | ) | 106,932 | ||||||||||||||
| Net cash provided by (used for) financing activities |
(214,928 | ) | 282,342 | (26,407 | ) | 3,072 | (1,352 | ) | (210,504 | ) | ||||||||||||||
| Other Financial Data: |
||||||||||||||||||||||||
| EBITDA (1) |
186,264 | 137,386 | 172,037 | 29,517 | (13,300 | ) | 229,081 | |||||||||||||||||
| OIBDAN (1) |
135,274 | 140,732 | 161,837 | 24,427 | 53,619 | 106,082 | ||||||||||||||||||
| Adjusted EBITDA (1) |
134,483 | 160,485 | 162,079 | 118,337 | ||||||||||||||||||||
2
| Year Ended December 31, |
Six Months Ended June 30, |
Twelve Months Ended June 30, |
||||||||||||||||||||||
| (U.S. dollars in thousands) | 2016 | 2015 | 2014 | 2017 | 2016 | 2017 | ||||||||||||||||||
| Other Adjusted Financial Data: |
||||||||||||||||||||||||
| Revenue, excluding results from Australia and Turkey businesses sold (2)(3)(4) |
1,050,950 | 1,078,709 | 1,219,014 | 502,712 | 503,097 | 1,050,565 | ||||||||||||||||||
| OIBDAN, excluding results from Australia and Turkey businesses sold (2)(3)(4) |
110,447 | 110,496 | 122,824 | 24,427 | 40,441 | 94,433 | ||||||||||||||||||
| Capital expenditures, excluding capital expenditures from Australia and Turkey businesses sold (2)(3)(4) |
73,439 | 60,780 | 48,354 | 43,716 | 30,150 | 87,005 | ||||||||||||||||||
| Ratio of senior debt to Adjusted EBITDA after giving effect to the notes offered hereby (1)(5) |
|
3.0:1 | ||||||||||||||||||||||
| Balance Sheet Data (at end of period): |
||||||||||||||||||||||||
| Cash and cash equivalents |
$ | 64,437 | $ | 47,869 | $ | 43,938 | $ | 29,267 | $ | 29,469 | $ | 29,267 | ||||||||||||
| Current assets |
393,767 | 467,522 | 464,650 | 395,063 | 408,990 | 395,063 | ||||||||||||||||||
| Property, plant and equipment—net |
265,658 | 343,131 | 397,302 | 290,809 | 331,126 | 290,809 | ||||||||||||||||||
| Total assets |
1,203,207 | 1,347,340 | 1,182,372 | 1,249,536 | 1,283,503 | 1,249,536 | ||||||||||||||||||
| Current liabilities |
369,799 | 416,984 | 417,411 | 382,518 | 386,724 | 382,518 | ||||||||||||||||||
| Related party subordinated notes payable |
963,706 | 986,089 | 1,745,056 | 1,045,868 | 1,011,579 | 1,045,868 | ||||||||||||||||||
| Shareholder’s deficit |
(470,070 | ) | (380,690 | ) | (1,080,061 | ) | (526,210 | ) | (443,518 | ) | (526,210 | ) | ||||||||||||
| (1) | We define EBITDA as consolidated net income (loss) before interest expense, net, income tax (benefit) expense, depreciation and amortization. We define OIBDAN as EBITDA adjusted for non-cash compensation expenses and the following line items presented in our Consolidated Statements of Comprehensive Income (Loss): impairment charges, other operating income, net, equity in income (loss) of non-consolidated affiliates and other income (expense), net. We define Adjusted EBITDA as OIBDAN adjusted for costs incurred in connection with severance, retention charges and other activities, non-cash charges, management and advisory fees, disposals and other items. Each of EBITDA, OIBDAN and Adjusted EBITDA is a non-GAAP financial measure. Generally, a non-GAAP financial measure is a numerical measure of a company’s performance, financial position or cash flows that either excludes or includes amounts that are not normally included or excluded in the most directly comparable measure calculated and presented in accordance with GAAP. EBITDA, OIBDAN and Adjusted EBITDA do not represent and should not be considered as alternatives to net income or cash flow from operations, as determined under GAAP. We believe that EBITDA, OIBDAN and Adjusted EBITDA provide investors with helpful information with respect to our operations. We present EBITDA, OIBDAN and Adjusted EBITDA to provide additional information with respect to our ability to meet our future debt service, capital expenditures and working capital requirements. |
3
| The following table summarizes the calculation of our historical EBITDA, OIBDAN and Adjusted EBITDA and provides a reconciliation to our consolidated net income (loss) for the periods indicated: |
| Year Ended December 31, |
Six Months Ended June 30, |
Twelve Months Ended June 30, |
||||||||||||||||||||||
| (U.S. dollars in thousands) | 2016 | 2015 | 2014 | 2017 | 2016 | 2017 | ||||||||||||||||||
| Consolidated net income (loss) |
$ | 83,073 | $ | (61,900 | ) | $ | (43,232 | ) | $ | (27,343 | ) | $ | (93,014 | ) | $ | 148,744 | ||||||||
| Interest expense, net |
37,899 | 68,112 | 72,147 | 16,893 | 20,175 | 34,617 | ||||||||||||||||||
| Income tax expense (benefit) |
(32,315 | ) | 12,282 | 4,244 | 4,717 | 11,005 | (38,603 | ) | ||||||||||||||||
| Depreciation and amortization |
97,607 | 118,892 | 138,878 | 35,250 | 48,534 | 84,323 | ||||||||||||||||||
|
|
|
|
|
|
|
|
|
|
|
|
|
|||||||||||||
| EBITDA |
$ | 186,264 | $ | 137,386 | $ | 172,037 | $ | 29,517 | $ | (13,300 | ) | $ | 229,081 | |||||||||||
|
|
|
|
|
|
|
|
|
|
|
|
|
|||||||||||||
| Shared-based compensation |
$ | 4,633 | $ | 2,647 | $ | 2,553 | $ | 618 | $ | 2,839 | $ | 2,412 | ||||||||||||
| Other (income) expense, net |
9,246 | 3,381 | (6,176 | ) | 1,353 | 6,839 | 3,760 | |||||||||||||||||
| Equity in (earnings) loss of nonconsolidated affiliates |
2,837 | 1,935 | (2,038 | ) | 805 | 1,333 | 2,309 | |||||||||||||||||
| Other operating (income) expense, net |
(74,980 | ) | (4,617 | ) | (4,539 | ) | (7,866 | ) | 55,908 | (138,754 | ) | |||||||||||||
| Impairment charges |
7,274 | — | — | — | — | 7,274 | ||||||||||||||||||
|
|
|
|
|
|
|
|
|
|
|
|
|
|||||||||||||
| OIBDAN |
$ | 135,274 | $ | 140,732 | $ | 161,837 | $ | 24,427 | $ | 53,619 | $ | 106,082 | ||||||||||||
|
|
|
|
|
|
|
|
|
|
|
|
|
|||||||||||||
| Costs incurred in connection with severance, retention charges and other activities |
11,893 | 35,276 | 19,250 | 13,969 | ||||||||||||||||||||
| Non-cash charges (a) |
10,582 | 15,178 | 18,492 | 7,831 | ||||||||||||||||||||
| Management and advisory fees (b) |
1,345 | 1,547 | 1,368 | 1,341 | ||||||||||||||||||||
| Disposals (c) |
(24,827 | ) | (30,236 | ) | (39,013 | ) | (11,649 | ) | ||||||||||||||||
| Other items (d) |
216 | (2,012 | ) | 145 | 763 | |||||||||||||||||||
|
|
|
|
|
|
|
|
|
|||||||||||||||||
| Adjusted EBITDA |
$ | 134,483 | $ | 160,485 | $ | 162,079 | $ | 118,337 | ||||||||||||||||
|
|
|
|
|
|
|
|
|
|||||||||||||||||
| (a) | Represents $10.2 million, $17.2 million, $16.0 million and $6.6 million, respectively, of straight-line rent adjustments and $0.4 million, $(2.0) million, $2.5 million and $1.2 million, respectively, of adjustments related to changes in accruals. |
| (b) | Represents our portion of the management fees payable to iHeartCommunications and Parent for management, monitoring, consulting, transaction and advisory fees and related expenses. |
| (c) | Represents the effect of the dispositions of our Turkey and Australia businesses as if they occurred at the beginning of the relevant period. |
| (d) | Represents the net amount of any other non-cash activity not otherwise included in the calculation of EBITDA required to be deducted from Adjusted EBITDA under the terms of the indenture governing the existing notes and the notes offered hereby. |
| (2) | Excluding the $32.0 million and $176.2 million impact, respectively, from fluctuations in foreign exchange, revenue, excluding the results from our Turkey and Australia businesses sold, increased $4.3 million, or 0.4%, during 2016 compared to 2015, and increased $35.9 million, or 2.9%, during 2015 compared to 2014. Excluding the $24.4 million impact from fluctuations in foreign exchange rates, revenue, excluding the results from our Turkey and Australia businesses sold, increased $24.0 million, or 4.8%, during the six months ended June 30, 2017 compared to the same period of 2016. |
| Excluding the $5.6 million and $19.9 million impact, respectively, from fluctuations in foreign exchange rates, OIBDAN, excluding the results from our Turkey and Australia businesses sold, increased $5.5 million, or 5.0%, during 2016 compared to 2015, and increased $7.5 million, or 6.1%, during 2015 compared to 2014. Excluding the $2.1 million impact from fluctuations in foreign exchange rates, OIBDAN, excluding the results from our Turkey and Australia businesses sold, decreased $13.9 million, or 34.4%, during the six months ended June 30, 2017 compared to the same period of 2016. |
| Excluding the $4.9 million and $7.7 million impact, respectively, from fluctuations in foreign exchange rates, capital expenditures, excluding the capital expenditures from our Turkey and Australia businesses sold, increased $17.6 million, or 29.0%, during 2016 compared to 2015, and increased $20.1 million, or 41.6%, during 2015 compared to 2014. Excluding the $2.5 million impact from fluctuations in foreign exchange rates, capital expenditures, excluding the capital expenditures from our Turkey and Australia businesses sold, increased $16.0 million, or 53.2%, during the six months ended June 30, 2017 compared to the same period of 2016. |
4
| (3) | The impact of foreign exchange rates fluctuations is calculated by applying the prior comparative period foreign currency exchange rates to the current applicable period financial data in local currencies. |
| (4) | The following tables summarize the reconciliation of “Revenue, excluding results from Australia and Turkey businesses sold” to “Revenue”, “OIBDAN, excluding the results from Australia and Turkey businesses sold” to “OIBDAN” and “Capital expenditures, excluding capital expenditures from Australia and Turkey businesses sold” to “Capital expenditures”: |
| Year Ended December 31, |
Six Months Ended June 30, |
Twelve Months Ended June 30, |
||||||||||||||||||||||
| (U.S. dollars in thousands) | 2016 | 2015 | 2014 | 2017 | 2016 | 2017 | ||||||||||||||||||
| Revenue |
$ | 1,168,707 | $ | 1,222,400 | $ | 1,381,653 | $ | 502,712 | $ | 574,492 | $ | 1,096,927 | ||||||||||||
| Excluding: Revenue from Australia and Turkey businesses |
117,757 | 143,691 | 162,639 | — | 71,395 | 46,362 | ||||||||||||||||||
|
|
|
|
|
|
|
|
|
|
|
|
|
|||||||||||||
| Revenue, excluding results from Australia and Turkey businesses sold |
$ | 1,050,950 | $ | 1,078,709 | $ | 1,219,014 | $ | 502,712 | $ | 503,097 | $ | 1,050,565 | ||||||||||||
|
|
|
|
|
|
|
|
|
|
|
|
|
|||||||||||||
| Year Ended December 31, |
Six Months Ended June 30, |
Twelve Months Ended June 30, |
||||||||||||||||||||||
| (U.S. dollars in thousands) | 2016 | 2015 | 2014 | 2017 | 2016 | 2017 | ||||||||||||||||||
| OIBDAN |
$ | 135,274 | $ | 140,732 | $ | 161,837 | $ | 24,427 | $ | 53,619 | $ | 106,082 | ||||||||||||
| Excluding: Disposals of Australia and Turkey businesses |
24,827 | 30,236 | 39,013 | — | 13,178 | 11,649 | ||||||||||||||||||
|
|
|
|
|
|
|
|
|
|
|
|
|
|||||||||||||
| OIBDAN, excluding results from Australia and Turkey businesses sold |
$ | 110,447 | $ | 110,496 | $ | 122,824 | $ | 24,427 | $ | 40,441 | $ | 94,433 | ||||||||||||
|
|
|
|
|
|
|
|
|
|
|
|
|
|||||||||||||
| Year Ended December 31, | Six Months Ended June 30, |
Twelve Months Ended June 30, |
||||||||||||||||||||||
| (U.S. dollars in thousands) | 2016 | 2015 | 2014 | 2017 | 2016 | 2017 | ||||||||||||||||||
| Capital expenditures |
$ | 88,522 | $ | 70,222 | $ | 57,453 | $ | 43,716 | $ | 39,810 | $ | 92,428 | ||||||||||||
| Excluding: Capital expenditures from Australia and Turkey businesses |
15,083 | 9,442 | 9,099 | — | 9,660 | 5,423 | ||||||||||||||||||
|
|
|
|
|
|
|
|
|
|
|
|
|
|||||||||||||
| Capital expenditures, excluding capital expenditures from Australia and Turkey businesses sold |
$ | 73,439 | $ | 60,780 | $ | 48,354 | $ | 43,716 | $ | 30,150 | $ | 87,005 | ||||||||||||
|
|
|
|
|
|
|
|
|
|
|
|
|
|||||||||||||
| (5) | Does not reflect indebtedness outstanding under the related party subordinated notes payable. See “Certain Relationships and Related Party Transactions—Related Party Subordinated Notes Payable” for further information regarding the related party subordinated notes payable. |
5
Our Major Markets
As of June 30, 2017, we owned and operated more than 400,000 advertising displays across 17 countries in eight major markets: France, the United Kingdom and Ireland, Nordics and Poland (comprised of Denmark, Finland, Norway, Sweden, Estonia, Lithuania, Latvia and Poland), Southern Europe (comprised of Italy and Spain), Switzerland, Belgium, Singapore and the Netherlands. For the year ended December 31, 2016, each of these regions represented 23%, 18%, 17%, 14%, 7%, 6%, 2% and 3% of our revenues, respectively.
Our display count includes displays with multiple faces on a single structure, as well as displays with one face on a single structure.
The major European markets in which we operate include France, the United Kingdom, Italy, Sweden, Switzerland, Belgium and Spain.
France
As of June 30, 2017, we owned or operated more than 100,000 advertising displays in France, which were sold primarily through our local and national sales teams. The market in France has a long-established out-of-home tradition.
Our strategy in France focuses on building commercial capability, innovating our product offering (including providing digital creative services and audience-based selling), and proactively optimizing our portfolio. Our efforts to optimize the French portfolio concentrate on refocusing our national classic street furniture network, streamlining our billboard portfolio and building the largest retail presence within our business. Our expansion into the retail space has resulted in strong relationships with retailers.
United Kingdom
As of June 30, 2017, we owned or operated more than 44,000 advertising displays in the United Kingdom.
Our strategy in the United Kingdom focuses principally on fostering and maintaining strong relationships with advertisers and advertising agencies as well as on proactively transforming our portfolio. Our efforts to transform our portfolio concentrate on expanding the use of digital displays. For the six month period ended June 30, 2017, a significant portion of revenues in the United Kingdom were generated by our digital networks, which currently include a national digital street furniture network, digital networks at the point-of-sale in malls and supermarkets and super-premium digital billboards.
Italy
As of June 30, 2017, we owned or operated more than 35,000 advertising displays in Italy. We believe we are a market leader in Italy. To support our operations in Italy, we have implemented a Sales Force Effectiveness program, implemented our innovative SmartBike program, and deployed new digital screens.
6
Switzerland
As of June 30, 2017, we owned or operated more than 17,000 advertising displays in Switzerland. Due in great part to our historical focus on billboards, our business in Switzerland is similar to that of Clear Channel in the United States with private landlords owning a majority of the sites we lease. Our strategy in Switzerland focuses on upgrading our commercial capabilities, expanding our portfolio, and developing innovative advertiser solutions. Such solutions include:
| • | Mobility Map, which enables advertisers to plan campaigns using mapping software and a database including information on all of our assets in Switzerland, average daily traffic and pedestrian flows around the country, and behavioral data; and |
| • | through a strategic partnership, tools that enable advertisers to retarget people who have seen a particular campaign on our out-of-home displays on their mobile phone. |
We believe we will benefit from the upcoming digitalization of the market in Switzerland in the coming years.
Sweden
As of June 30, 2017, we owned or operated more than 115,000 advertising displays in Sweden, which primarily included smaller transit displays, but excluded over 288,000 displays on supermarket trollies. We believe we are a market leader in Sweden due to our position in Stockholm. Our strategy in Sweden focuses principally on leveraging data and expertise to price, package and sell our assets in an optimal way, while continuing to optimize our portfolio.
Belgium
As of June 30, 2017, we owned or operated more than 12,000 advertising displays in Belgium. We offer four national street furniture networks that allow us to support national advertising campaigns. We also offer premium billboards.
Spain
As of June 30, 2017, we owned or operated more than 32,000 advertising displays in Spain. We have presence in 45 out of 50 Spanish provinces. We also operate a successful SmartBike program in several cities in the country. Our main focus in Spain is on expanding our reach, driving relationships with the creative and advertising community and expanding our digital presence.
7