Attached files
| file | filename |
|---|---|
| 8-K - FORM 8-K - Time Inc. | d364361d8k.htm |
Exhibit 99.1

Management Presentation August 2017
Caution Concerning Statements and Non-GAAP Financial Measures This presentation contains forward-looking statements within the meaning of the Private Securities Litigation Reform Act of 1995; particularly statements regarding future financial and operating results of Time Inc. (the “Company”) and its business. These statements are based on management’s current expectations or beliefs, and are subject to uncertainty and changes in circumstances. Actual results may vary materially from those expressed or implied in this presentation due to changes in economic, business, competitive, technological, strategic, regulatory and/or other factors. More detailed information about these factors may be found in the Company’s filings with the Securities and Exchange Commission, including its most recent Annual Report on Form 10-K and subsequent Quarterly Reports on Form 10-Q. The Company is under no obligation, and expressly disclaims any such obligation, to update or alter its forward-looking statements, whether as a result of new information, future events or otherwise. Non-GAAP financial measures such as Operating income (loss) excluding Depreciation and Amortization of intangible assets (“OIBDA”), Adjusted OIBDA, Adjusted Net Income, Adjusted Diluted Earnings Per Share (“EPS”) and Free cash flow, are supplemental measures that are not calculated in accordance with U.S. Generally Accepted Accounting Principles (“GAAP”). Definitions of these measures and reconciliations to the most directly-comparable U.S. GAAP measures are included at the end of this presentation deck or on our website. Our non-GAAP financial measures have limitations as analytical and comparative tools and you should consider OIBDA, Adjusted OIBDA, Adjusted Net Income, Adjusted Diluted EPS and Free cash flow in addition to, and not as a substitute for, the Company’s Operating income (loss), Net income (loss) attributable to Time Inc., Diluted EPS and various cash flow measures (e.g., Cash provided by (used in) operations), as well as other measures of financial performance and liquidity reported in accordance with U.S. GAAP. Note: Throughout the presentation, certain numbers may not sum to the total due to rounding. All trademarks and service marks referenced herein are owned by the respective trademark or service mark owners. ©2017 Time Inc. Published 2017.
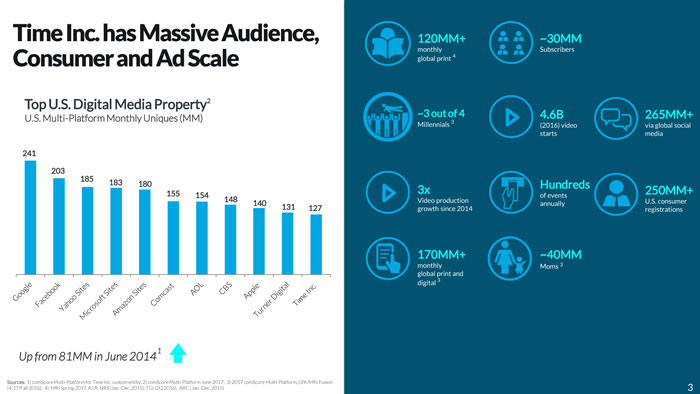
Time Inc. has Massive Audience, Consumer and Ad Scale Top U.S. Digital Media Property2 U.S. Multi-Platform Monthly Uniques (MM) Up from 81MM in June 2014 120MM+ ~30MM ~3 out of 4 4.6B 265MM+ 3x Hundreds 250MM+ 170MM+ ~40MM monthly global print 4 Subscribers Millennials 3 (2016) video starts via global social media Video production growth since 2014 of events annually U.S. consumer registrations monthly global print and digital 3 Moms 3 Sources: 1) comScore Multi-Platform for Time Inc. custom entity; 2) comScore Multi-Platform June 2017; 3) 2017 comScore Multi-Platform, GfK/MRI Fusion (4-17/Fall 2016); 4) MRI Spring 2017, A.I.R. NRS (Jan.-Dec. 2015), TGI (2Q 2016), ABC (Jan.-Dec. 2015)
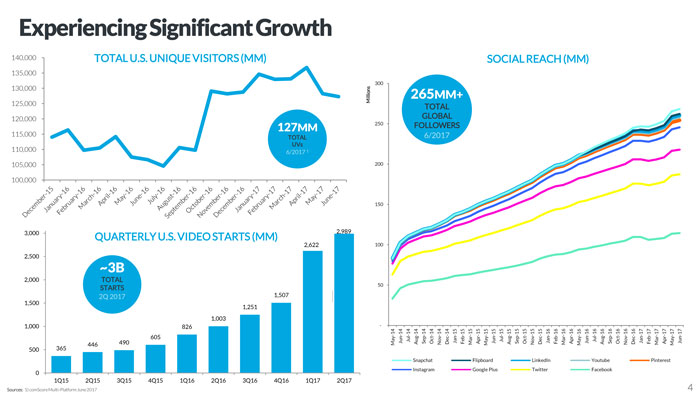
Experiencing Significant Growth TOTAL U.S. UNIQUE VISITORS (MM) SOCIAL REACH (MM) 127MM TOTAL UVs 6/2017 1 265MM+ TOTAL GLOBAL FOLLOWERS 6/2017 QUARTERLY U.S. VIDEO STARTS (MM) ~3B TOTAL STARTS 2Q 2017 Sources: 1) comScore Multi-Platform June 2017
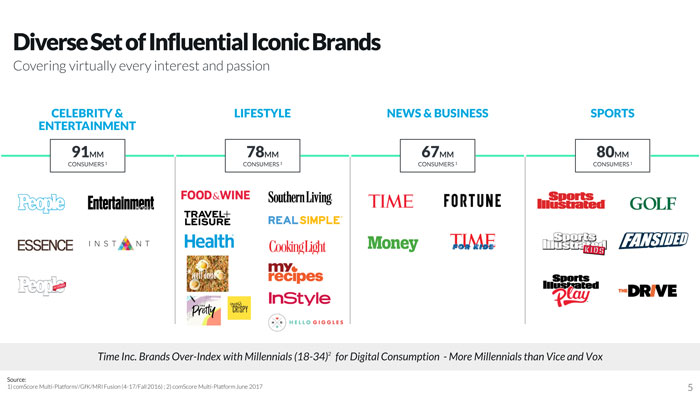
Diverse Set of Influential Iconic Brands Covering virtually every interest and passion CELEBRITY & ENTERTAINMENT LIFESTYLE NEWS & BUSINESS SPORTS 91MM CONSUMERS 1 78MM CONSUMERS 1 67MM CONSUMERS 1 80MM CONSUMERS 1 Time Inc. Brands Over-Index with Millennials (18-34)2 for Digital Consumption - More Millennials than Vice and Vox Source: 1) comScore Multi-Platform//GfK/MRI Fusion (4-17/Fall 2016) ; 2) comScore Multi-Platform June 2017
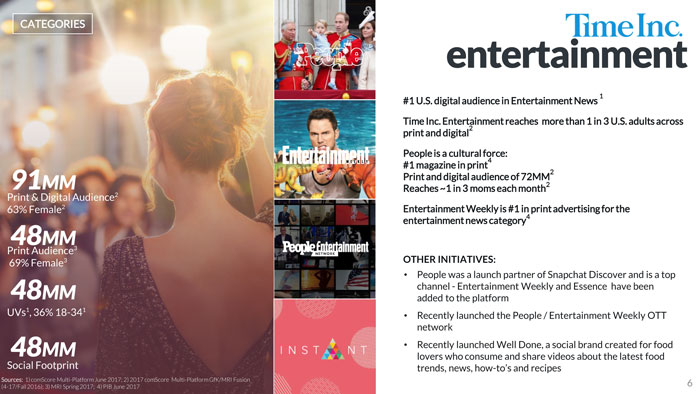
CATEGORIES entertainment #1 U.S. digital audience in Entertainment News 1 Time Inc. Entertainment reaches more than 1 in 3 U.S. adults across print and digital2 People is a cultural force: #1 magazine in print4 Print and digital audience of 72MM2 Reaches ~1 in 3 moms each month2 Entertainment Weekly is #1 in print advertising for the entertainment news category4 OTHER INITIATIVES: • People was a launch partner of Snapchat Discover and is a top channel - Entertainment Weekly and Essence have been added to the platform • Recently launched the People / Entertainment Weekly OTT network • Recently launched Well Done, a social brand created for food lovers who consume and share videos about the latest food trends, news, how-to’s and recipes 91MM Print & Digital Audience2 63% Female2 48MM Print Audience3 69% Female3 48MM UVs1, 36% 18-341 48MM Social Footprint Sources: 1) comScore Multi-Platform June 2017; 2) 2017 comScore Multi-Platform GfK/MRI Fusion (4-17/Fall 2016); 3) MRI Spring 2017; 4) PIB June 2017
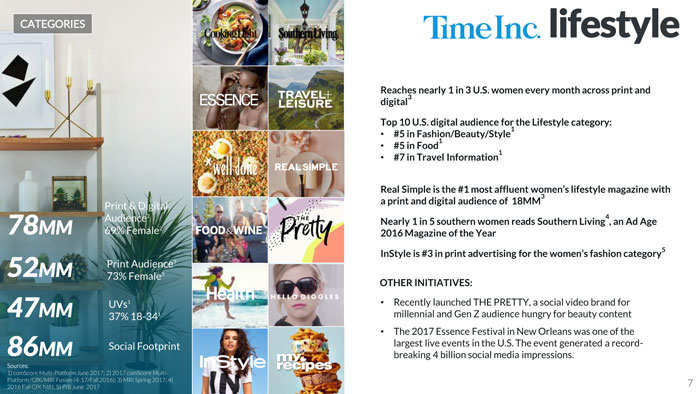
CATEGORIES lifestyle 78MM 52MM 47MM 86MM Sources: 1) comScore Multi-Platform June 2017; 2) 2017 comScore Multi- Platform /GfK/MRI Fusion (4-17/Fall 2016); 3) MRI Spring 2017; 4)2016 Fall GfK MRI; 5) PIB June 2017 Print & Digital Audience2 69% Female2 Print Audience3 73% Female3 UVs1 37% 18-341 Social Footprint Reaches nearly 1 in 3 U.S. women every month across print and digital3 Top 10 U.S. digital audience for the Lifestyle category: • #5 in Fashion/Beauty/Style1 • #5 in Food1 • #7 in Travel Information1 Real Simple is the #1 most affluent women’s lifestyle magazine with a print and digital audience of 18MM3 Nearly 1 in 5 southern women reads Southern Living4, an Ad Age 2016 Magazine of the Year InStyle is #3 in print advertising for the women’s fashion category5 OTHER INITIATIVES: • Recently launched THE PRETTY, a social video brand for millennial and Gen Z audience hungry for beauty content • The 2017 Essence Festival in New Orleans was one of the largest live events in the U.S. The event generated a record- breaking 4 billion social media impressions.
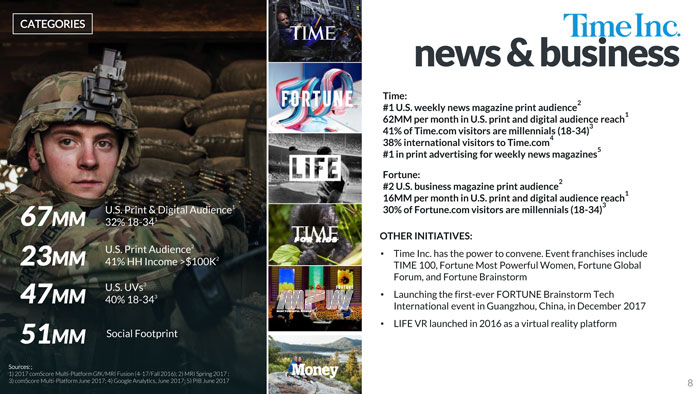
CATEGORIES news & business Time: #1 U.S. weekly news magazine print audience2 62MM per month in U.S. print and digital audience reach1 41% of Time.com visitors are millennials (18-34)3 38% international visitors to Time.com4 #1 in print advertising for weekly news magazines5 Fortune: #2 U.S. business magazine print audience2 16MM per month in U.S. print and digital audience reach1 30% of Fortune.com visitors are millennials (18-34)3 OTHER INITIATIVES: • Time Inc. has the power to convene. Event franchises include TIME 100, Fortune Most Powerful Women, Fortune Global Forum, and Fortune Brainstorm • Launching the first-ever FORTUNE Brainstorm Tech International event in Guangzhou, China, in December 2017 • LIFE VR launched in 2016 as a virtual reality platform 67MM 23MM 47MM 51MM U.S. Print & Digital Audience1 32% 18-34 U.S. Print Audience2 41% HH Income >$100K2 U.S. UVs3 40% 18-343 Social Footprint Sources: ; 1) 2017 comScore Multi-Platform GfK/MRI Fusion (4-17/Fall 2016); 2) MRI Spring 2017 ; 3) comScore Multi-Platform June 2017; 4) Google Analytics, June 2017; 5) PIB June 2017
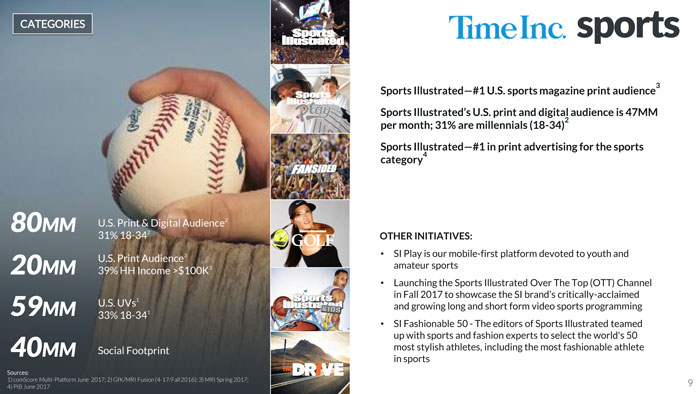
sports Sports Illustrated—#1 U.S. sports magazine print audience3 Sports Illustrated’s U.S. print and digital audience is 47MM per month; 31% are millennials (18-34)2 Sports Illustrated—#1 in print advertising for the sports category4 OTHER INITIATIVES: • SI Play is our mobile-first platform devoted to youth and amateur sports • Launching the Sports Illustrated Over The Top (OTT) Channel in Fall 2017 to showcase the SI brand’s critically-acclaimed and growing long and short form video sports programming • SI Fashionable 50 - The editors of Sports Illustrated teamed up with sports and fashion experts to select the world’s 50 most stylish athletes, including the most fashionable athlete in sports 80MM 20MM 59MM 40MM U.S. Print & Digital Audience2 31% 18-34 U.S. Print Audience3 39% HH Income >$100K3 U.S. UVs1 33% 18-341 Social Footprint Sources: 1) comScore Multi-Platform June 2017; 2) GfK/MRI Fusion (4-17/Fall 2016); 3) MRI Spring 2017; 4) PIB June 2017

Publisher to Platform
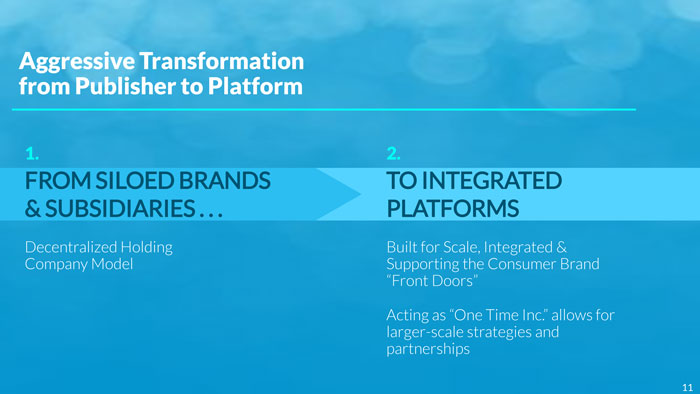
Aggressive Transformation from Publisher to Platform FROM SILOED BRANDS & SUBSIDIARIES . . . TO INTEGRATED PLATFORMS Decentralized Holding Company Model Built for Scale, Integrated & Supporting the Consumer Brand “Front Doors” Acting as “One Time Inc.” allows for larger-scale strategies and partnerships
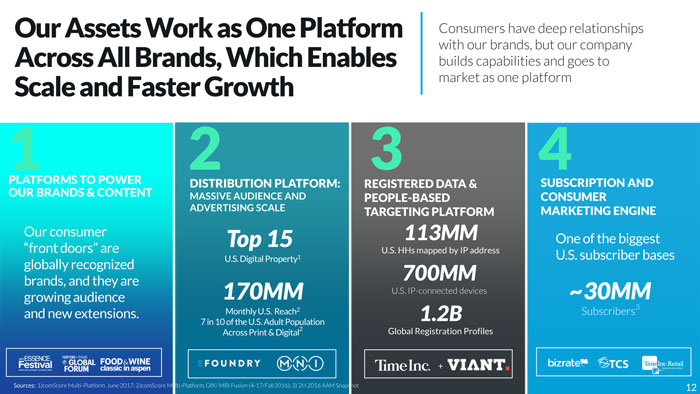
Our Assets Work as One Platform Across All Brands, Which Enables Scale and Faster Growth Consumers have deep relationships with our brands, but our company builds capabilities and goes to market as one platform PLATFORMS TO POWER OUR BRANDS & CONTENT Our consumer “front doors” are globally recognized brands, and they are growing audience and new extensions. DISTRIBUTION PLATFORM: MASSIVE AUDIENCE AND ADVERTISING SCALE Top 15 U.S. Digital Property1 170MM Monthly U.S. Reach2 7 in 10 of the U.S. Adult Population Across Print & Digital2 REGISTERED DATA & PEOPLE-BASED TARGETING PLATFORM 113MM U.S. HHs mapped by IP address 700MM U.S. IP-connected devices 1.2B Global Registration Profiles SUBSCRIPTION AND CONSUMER MARKETING ENGINE One of the biggest U.S. subscriber bases ~30MM Subscribers3 Sources: 1)comScore Multi-Platform June 2017; 2)comScore Multi-Platform, GfK/ MRI Fusion (4-17/Fall 2016); 3) 2H 2016 AAM Snapshot
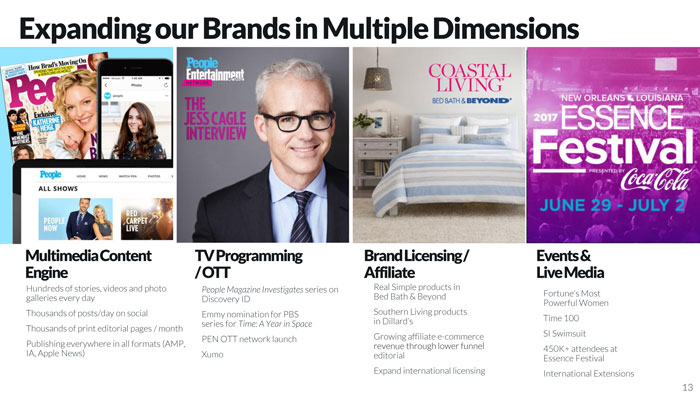
Expanding our Brands in Multiple Dimensions MultimediaContent Engine Hundreds of stories, videos and photo galleries every day Thousands of posts/day on social Thousands of print editorial pages / month Publishing everywhere in all formats (AMP, IA, Apple News) TVProgramming /OTT People Magazine Investigates series on Discovery ID Emmy nomination for PBS series for Time: A Year in Space PEN OTT network launch Xumo BrandLicensing/ Affiliate Real Simple products in Bed Bath & Beyond Southern Living products in Dillard’s Growing affiliate e-commerce revenue through lower funnel editorial Expand international licensing Events& LiveMedia Fortune’s Most Powerful Women Time 100 SI Swimsuit 450K+ attendees at Essence Festival International Extensions
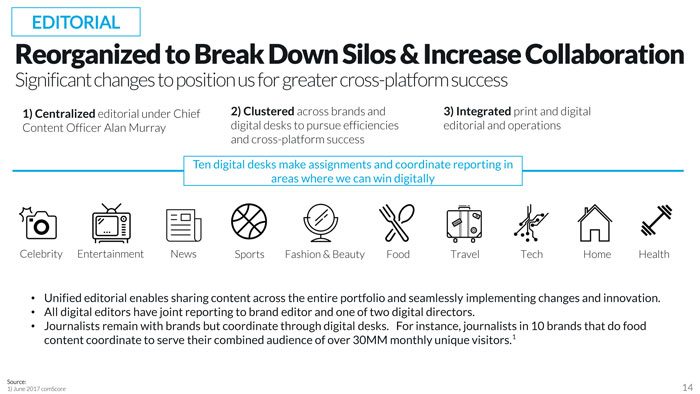
EDITORIAL Reorganized to Break Down Silos & Increase Collaboration Significant changes to position us for greater cross-platform success 1) Centralized editorial under Chief Content Officer Alan Murray 2) Clustered across brands and digital desks to pursue efficiencies and cross-platform success 3) Integrated print and digital editorial and operations Ten digital desks make assignments and coordinate reporting in areas where we can win digitally Celebrity Entertainment News Sports Fashion & Beauty Food Travel Tech Home Health • Unified editorial enables sharing content across the entire portfolio and seamlessly implementing changes and innovation. • All digital editors have joint reporting to brand editor and one of two digital directors. • Journalists remain with brands but coordinate through digital desks. For instance, journalists in 10 brands that do food content coordinate to serve their combined audience of over 30MM monthly unique visitors.1 Source: 1) June 2017 comScore
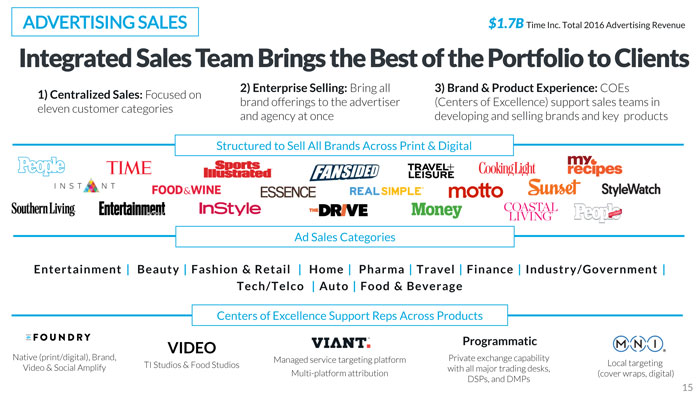
ADVERTISING SALES $1.7B Time Inc. Total 2016 Advertising Revenue Integrated Sales Team Brings the Best of the Portfolio to Clients 1) Centralized Sales: Focused on eleven customer categories 2) Enterprise Selling: Bring all brand offerings to the advertiser and agency at once 3) Brand & Product Experience: COEs (Centers of Excellence) support sales teams in developing and selling brands and key products Structured to Sell All Brands Across Print & Digital Ad Sales Categories Centers of Excellence Support Reps Across Products E n t e r t a i n m e n t | B e a u t y | F a s h i o n & R e t a i l | H o m e | P h a r m a | T r a v e l | F i n a n c e | I n d u s t r y / G o v e r n m e n t | T e c h / T e l c o | A u t o | F o o d & B e v e r a g e Centers of Excellence Support Reps Across Products Native (print/digital), Brand, Video & Social Amplify TI Studios & Food Studios Managed service targeting platform Multi-platform attribution Private exchange capability with all major trading desks, DSPs, and DMPs Local targeting (cover wraps, digital)
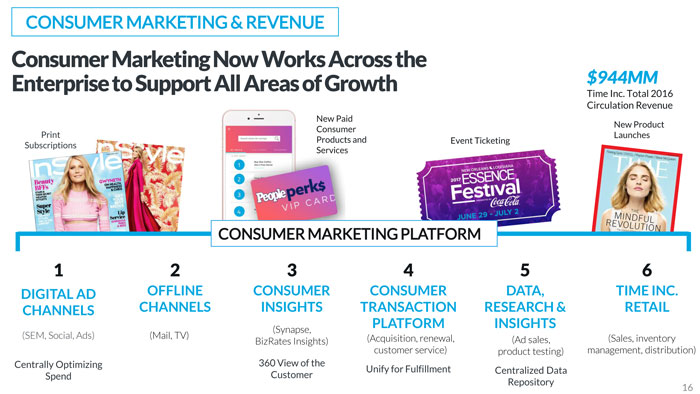
CONSUMER MARKETING & REVENUE Consumer Marketing Now Works Across the Enterprise to Support All Areas of Growth $944MM Time Inc. Total 2016 Circulation Revenue Print Subscriptions New Paid Consumer Products and Services Event Ticketing New Product Launches CONSUMER MARKETING PLATFORM DIGITAL AD CHANNELS (SEM, Social, Ads) Centrally Optimizing Spend (Mail, TV) OFFLINE CHANNELS CONSUMER INSIGHTS (Synapse, BizRates Insights) 360 View of the Customer CONSUMER TRANSACTION PLATFORM (Acquisition, renewal, customer service) Unify for Fulfillment DATA, RESEARCH & INSIGHTS (Ad sales, product testing) Centralized Data Repository TIME INC. RETAIL (Sales, inventory management, distribution)

Strategic Transformation Program
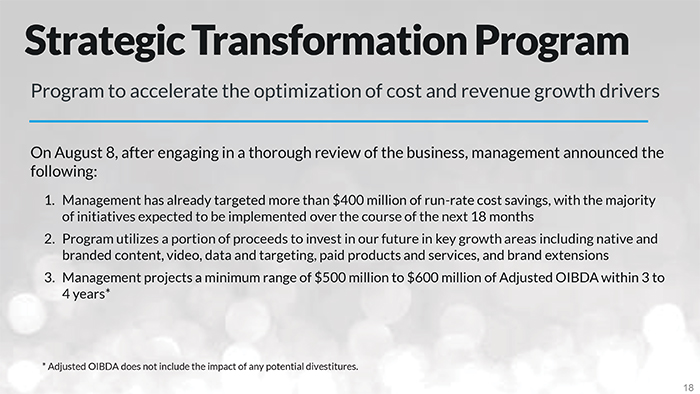
Strategic Transformation Program Program to accelerate the optimization of cost and revenue growth drivers On August 8, after engaging in a thorough review of the business, management announced the following: 1. Management has already targeted more than $400 million of run-rate cost savings, with the majority of initiatives expected to be implemented over the course of the next 18 months 2. Program utilizes a portion of proceeds to invest in our future in key growth areas including native and branded content, video, data and targeting, paid products and services, and brand extensions 3. Management projects a minimum range of $500 million to $600 million of Adjusted OIBDA within 3 to 4 years* * Adjusted OIBDA does not include the impact of any potential divestitures.

Key Growth Areas
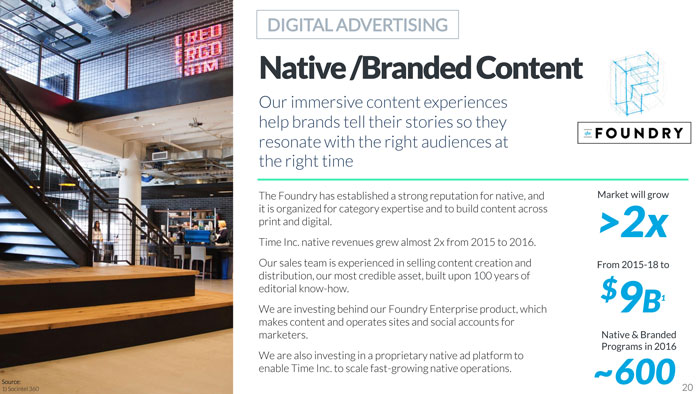
DIGITAL ADVERTISING Native /Branded Content Our immersive content experiences help brands tell their stories so they resonate with the right audiences at the right time The Foundry has established a strong reputation for native, and it is organized for category expertise and to build content across print and digital. Time Inc. native revenues grew almost 2x from 2015 to 2016. Our sales team is experienced in selling content creation and distribution, our most credible asset, built upon 100 years of editorial know-how. We are investing behind our Foundry Enterprise product, which makes content and operates sites and social accounts for marketers. We are also investing in a proprietary native ad platform to enable Time Inc. to scale fast-growing native operations. Market will grow From 2015-18 to Native & Branded Programs in 2016 >2x $9B1 ~600
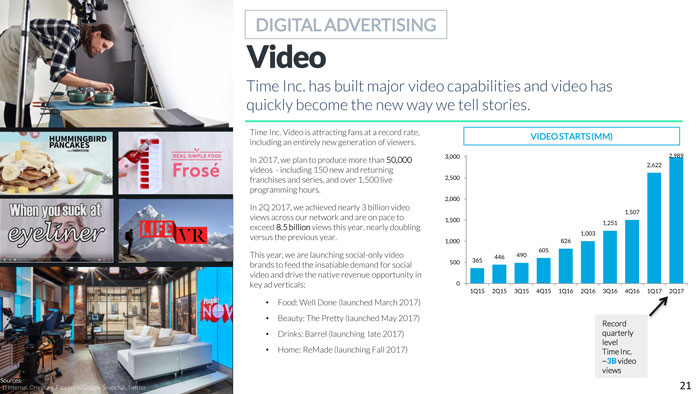
DIGITAL ADVERTISING Video Time Inc. has built major video capabilities and video has quickly become the new way we tell stories. VIDEO STARTS (MM) Record quarterly level Time Inc. ~3B video views Time Inc. Video is attracting fans at a record rate, including an entirely new generation of viewers. In 2017, we plan to produce more than 50,000 videos - including 150 new and returning franchises and series, and over 1,500 live programming hours. In 2Q 2017, we achieved nearly 3 billion video views across our network and are on pace to exceed 8.5 billion views this year, nearly doubling versus the previous year. This year, we are launching social-only video brands to feed the insatiable demand for social video and drive the native revenue opportunity in key ad verticals: • Food: Well Done (launched March 2017) • Beauty: The Pretty (launched May 2017) • Drinks: Barrel (launching late 2017) • Home: ReMade (launching Fall 2017)
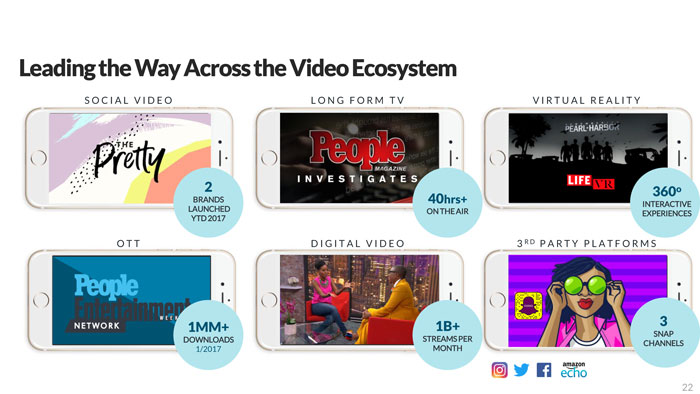
Leading the Way Across the Video Ecosystem SOCIAL VIDEO LONG FORM TV VIRTUAL REALITY OTT DIGITAL VIDEO 3RD PARTY PLATFORMS 2 BRANDS LAUNCHED YTD 2017 40hrs+ ON THE AIR 360o INTERACTIVE EXPERIENCES 1MM+ DOWNLOADS 1/2017 1B+ STREAMS PER MONTH 3 SNAP CHANNELS 6/2017
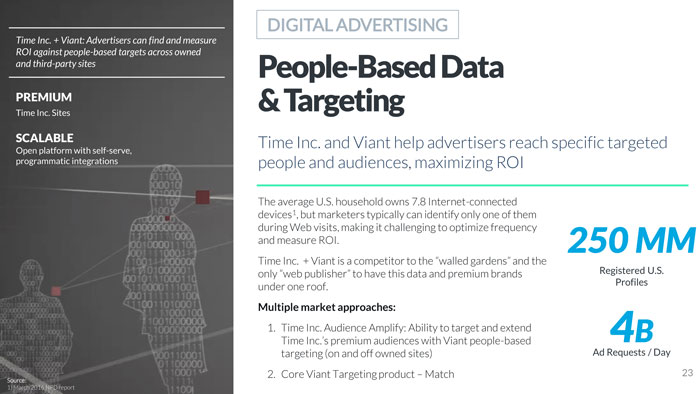
DIGITAL ADVERTISING Time Inc. + Viant: Advertisers can find and measure ROI against people-based targets across owned and third-party sites PREMIUM Time Inc. Sites SCALABLE Open platform with self-serve, programmatic integrations Source: 1) March 2016 NPD report People-Based Data & Targeting Time Inc. and Viant help advertisers reach specific targeted people and audiences, maximizing ROI The average U.S. household owns 7.8 Internet-connected devices1, but marketers typically can identify only one of them during Web visits, making it challenging to optimize frequency and measure ROI. Time Inc. + Viant is a competitor to the “walled gardens” and the only “web publisher” to have this data and premium brands under one roof. Multiple market approaches: 250 MM Registered U.S. Profiles Ad Requests / Day 4B Core Viant Targeting product – Match 1. Time Inc. Audience Amplify: Ability to target and extend Time Inc.’s premium audiences with Viant people-based targeting (on and off owned sites)
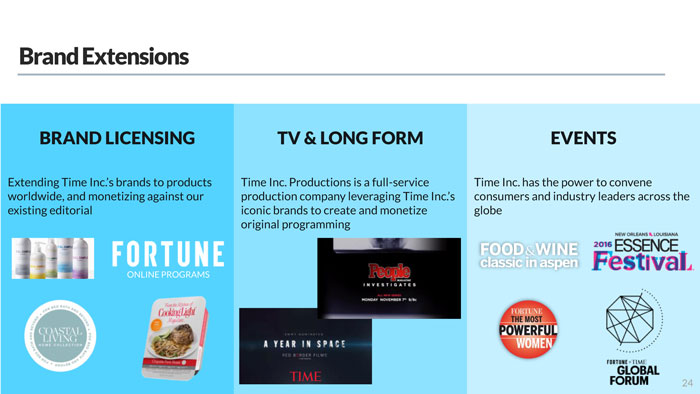
Brand Extensions BRAND LICENSING TV & LONG FORM EVENTS Extending Time Inc.’s brands to products worldwide, and monetizing against our existing editorial Time Inc. Productions is a full-service production company leveraging Time Inc.’s iconic brands to create and monetize original programming Time Inc. has the power to convene consumers and industry leaders across the globe
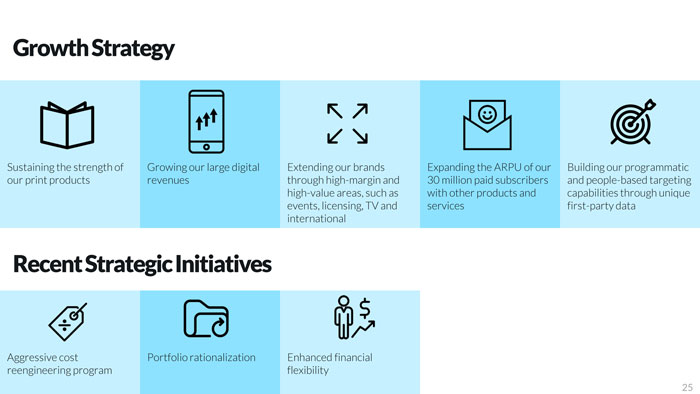
Growth Strategy Sustaining the strength of our print products Growing our large digital revenues Extending our brands through high-margin and high-value areas, such as events, licensing, TV and international Expanding the ARPU of our 30 million paid subscribers with other products and services Building our programmatic and people-based targeting capabilities through unique first-party data Recent Strategic Initiatives Aggressive cost reengineering program Portfolio rationalization Enhanced financial flexibility

Financial Highlights
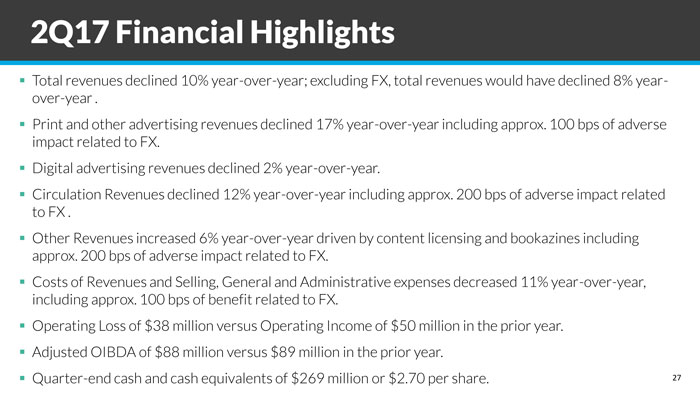
2Q17 Financial Highlights Total revenues declined 10% year-over-year; excluding FX, total revenues would have declined 8% year- over-year . Print and other advertising revenues declined 17% year-over-year including approx. 100 bps of adverse impact related to FX. Digital advertising revenues declined 2% year-over-year. Circulation Revenues declined 12% year-over-year including approx. 200 bps of adverse impact related to FX . Other Revenues increased 6% year-over-year driven by content licensing and bookazines including approx. 200 bps of adverse impact related to FX. Costs of Revenues and Selling, General and Administrative expenses decreased 11% year-over-year, including approx. 100 bps of benefit related to FX. Operating Loss of $38 million versus Operating Income of $50 million in the prior year. Adjusted OIBDA of $88 million versus $89 million in the prior year. Quarter-end cash and cash equivalents of $269 million or $2.70 per share.

Appendix
Schedule I
TIME INC.
RECONCILIATION OF OPERATING INCOME (LOSS) TO ADJUSTED OIBDA
(Unaudited; in millions)
| Three Months Ended | Six Months Ended | |||||||||||||||
| June 30, | June 30, | |||||||||||||||
| 2017 | 2016 | 2017 | 2016 | |||||||||||||
| Operating income (loss) |
$ | (38 | ) | $ | 50 | $ | (64 | ) | $ | 47 | ||||||
| Depreciation |
15 | 14 | 28 | 27 | ||||||||||||
| Amortization of intangible assets |
19 | 20 | 39 | 41 | ||||||||||||
|
|
|
|
|
|
|
|
|
|||||||||
| OIBDA(1) |
(4 | ) | 84 | 3 | 115 | |||||||||||
| Asset impairments |
5 | 1 | 5 | 1 | ||||||||||||
| Goodwill impairment |
50 | — | 50 | — | ||||||||||||
| Restructuring and severance costs |
31 | 10 | 47 | 11 | ||||||||||||
| (Gain) loss on operating assets, net(2) |
(2 | ) | (13 | ) | (4 | ) | (16 | ) | ||||||||
| Other costs(3) |
8 | 7 | 10 | 21 | ||||||||||||
|
|
|
|
|
|
|
|
|
|||||||||
| Adjusted OIBDA(4) |
$ | 88 | $ | 89 | $ | 111 | $ | 132 | ||||||||
|
|
|
|
|
|
|
|
|
|||||||||
| (1) | OIBDA is defined as Operating income (loss) excluding Depreciation and Amortization of intangible assets. |
| (2) | (Gain) loss on operating assets, net primarily reflects the recognition of a gain on sale of certain of our titles and of the deferred gain from the sale-leaseback of the Blue Fin Building that was completed in the fourth quarter of 2015. |
| (3) | Other costs related to mergers, acquisitions, investments and dispositions, and integration and transformation costs during the periods presented are included within Selling, general and administrative expenses within the Statements of Operations. |
| (4) | Adjusted OIBDA is defined as OIBDA adjusted for impairments of Goodwill, intangible assets, fixed assets and investments; Restructuring and severance costs; (Gain) loss on operating assets, net; Pension settlements/curtailments; and Other costs related to mergers, acquisitions, investments and dispositions, and integration and transformation costs. |

|
29 |
Schedule II
TIME INC.
RECONCILIATION OF OPERATING INCOME (LOSS) TO ADJUSTED OIBDA -
2017 & 2021 OUTLOOK
(Unaudited; in millions)
| Full Year 2017 Outlook Range | Full Year 2021 Outlook Range | |||
| Adjusted OIBDA(1) |
$400 to 414 | $500 to 600 | ||
| Asset impairments, Goodwill impairment, Restructuring and severance costs, (Gains) losses on operating assets, net; Pension settlements/curtailments; and Other costs related to mergers, acquisitions, investments and dispositions, and integration and transformation costs |
Unable to estimate beyond the $108 recognized from January 1, 2017 through June 30, 2017 |
Unable to estimate | ||
|
|
| |||
| OIBDA(2) |
Unable to estimate | Unable to estimate | ||
| Amortization of intangible assets |
~$75 | Unable to estimate | ||
| Depreciation |
~$60 | Unable to estimate | ||
|
|
| |||
| Operating income (loss) |
Unable to estimate | Unable to estimate | ||
|
|
|
| (1) | Adjusted OIBDA is defined as OIBDA adjusted for impairments of Goodwill, intangible assets, fixed assets and investments; Restructuring and severance costs; (Gain) loss on operating assets, net; Pension settlements/curtailments; and Other costs related to mergers, acquisitions, investments and dispositions, and integration and transformation costs. Adjusted OIBDA does not include the impact of any potential divestitures. |
| (2) | OIBDA is defined as Operating income (loss) excluding Depreciation and Amortization of intangible assets. |
|
|
30 |

Management Presentation