Attached files
| file | filename |
|---|---|
| 8-K - FORM 8-K - First Savings Financial Group, Inc. | v472673_8k.htm |
Exhibit 99.1

I NVESTOR P RESENTATION AUGUST 8, 2017
I MPORTANT D ISCLOSURES 2 Unless the context indicates otherwise, all references in this presentation refer to “First Savings Financial Group,” “Compan y,” “we,” “us” and “our” refer to First Savings Financial Group and its subsidiaries. CAUTIONARY NOTE REGARDING FORWARD LOOKING STATEMENTS This presentation contains forward - looking statements that are based on assumptions and may describe future plans, strategies and expectations of First Savings Financial Group, Inc. These forward - looking statements are generally identified by use of the word s “believe,” “expect,” “intend,” “anticipate,” “estimate,” “project” or similar expressions. First Savings Financial Group’s ab ili ty to predict results or the actual effect of future plans or strategies is inherently uncertain. Factors which could have a material adver se effect on the operations of First Savings Financial Group and its subsidiaries include, but are not limited to, changes in interest rates, national and regional economic conditions, legislative and regulatory changes, monetary and fiscal policies of the U.S. government, in clu ding policies of the U.S. Treasury and the Federal Reserve Board, the quality and composition of the loan or investment portfolios , d emand for loan products, deposit flows, competition, demand for financial services in First Savings Financial Group’s market area, cha nges in real estate market values in First Savings Financial Group’s market area, changes in relevant accounting principles and guidelines, ability to complete and successfully integrate pending acquisition, and inability of third party service providers to perform. Additional factors that may affect our results are discussed in Item 1A to our Annual Report on Form 10 - K titled “Risk Factors ”. These risks and uncertainties should be considered in evaluating forward - looking statements and undue reliance should not be placed on such statements. Except as required by applicable law or regulation, First Savings Financial Group does not undertake, and specifically disclaims any obligation, to release publicly the result of any revisions that may be made to any forward - looking s tatements to reflect events or circumstances after the date of the statements or to reflect the occurrence of anticipated or unanticipa ted events. NON - GAAP FINANCIAL MEASURES These slides contain non - GAAP financial measures. Form purposes of Regulation G, a non - GAAP financial measure is a numerical measure of the registrant’s historical or future financial performance, financial position or cash flows that excludes amount s, or is subject to adjustments that have the effect of excluding amounts, that are included in the most directly comparable measure c alc ulated and presented in accordance with GAAP in the balance sheet, statements of income or statement of cash flows (or equivalent statements) of the registrant; or includes amounts, or is subject to adjustments that have the effect of including amounts, that are excluded from the most directly comparable measure so calculated and presented. In this regard, GAAP refers to accounting principles generally accepted in the United States of America. Pursuant to the requirements of Regulation G, First Savings F ina ncial Group has provided reconciliations within these slides, as necessary, of the non - GAAP financial measures to the most directly comparable GAAP financial measure.
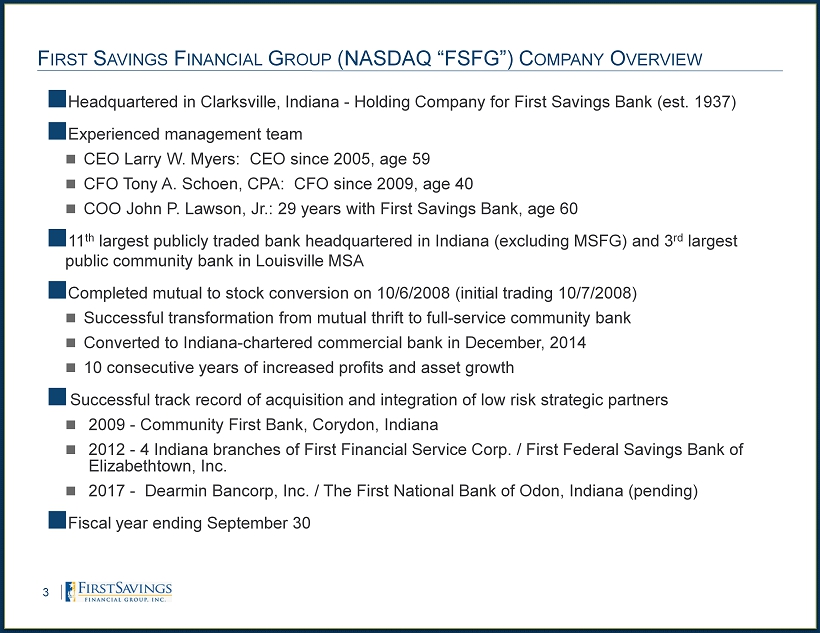
F IRST S AVINGS F INANCIAL G ROUP (NASDAQ “FSFG”) C OMPANY O VERVIEW 3 ■ Headquartered in Clarksville, Indiana - Holding Company for First Savings Bank (est. 1937) ■ Experienced management team CEO Larry W. Myers: CEO since 2005, age 59 CFO Tony A. Schoen, CPA: CFO since 2009, age 40 COO John P. Lawson, Jr.: 29 years with First Savings Bank, age 60 ■ 11 th largest publicly traded bank headquartered in Indiana (excluding MSFG) and 3 rd largest public community bank in Louisville MSA ■ Completed mutual to stock conversion on 10/6/2008 (initial trading 10/7/2008) Successful transformation from mutual thrift to full - service community bank Converted to Indiana - chartered commercial bank in December, 2014 10 consecutive years of increased profits and asset growth ■ Successful track record of acquisition and integration of low risk strategic partners 2009 - Community First Bank, Corydon, Indiana 2012 - 4 Indiana branches of First Financial Service Corp. / First Federal Savings Bank of Elizabethtown, Inc. 2017 - Dearmin Bancorp, Inc. / The First National Bank of Odon, Indiana (pending) ■ Fiscal year ending September 30
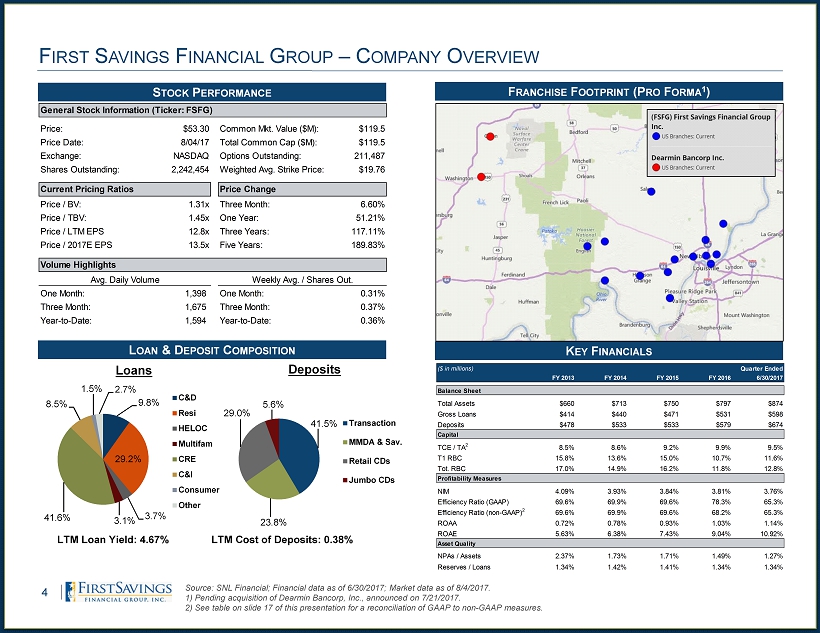
K EY F INANCIALS F IRST S AVINGS F INANCIAL G ROUP – C OMPANY O VERVIEW S TOCK P ERFORMANCE 4 L OAN & D EPOSIT C OMPOSITION 9.8% 29.2% 3.7% 3.1% 41.6% 8.5% 1.5% 2.7% Loans C&D Resi HELOC Multifam CRE C&I Consumer Other F RANCHISE F OOTPRINT (P RO F ORMA 1 ) Source: SNL Financial; Financial data as of 6/30/2017; Market data as of 8/4/2017. 1) Pending acquisition of Dearmin Bancorp, Inc., announced on 7/21/2017 . 2) See table on slide 17 of this presentation for a reconciliation of GAAP to non - GAAP measures. 41.5% 23.8% 29.0% 5.6% Deposits Transaction MMDA & Sav. Retail CDs Jumbo CDs LTM Loan Yield: 4.67% LTM Cost of Deposits: 0.38% General Stock Information (Ticker: FSFG) Price: $53.30 Common Mkt. Value ($M): $119.5 Price Date: 8/04/17 Total Common Cap ($M): $119.5 Exchange: NASDAQ Options Outstanding: 211,487 Shares Outstanding: 2,242,454 Weighted Avg. Strike Price: $19.76 Current Pricing Ratios Price Change Price / BV: 1.31x Three Month: 6.60% Price / TBV: 1.45x One Year: 51.21% Price / LTM EPS 12.8x Three Years: 117.11% Price / 2017E EPS 13.5x Five Years: 189.83% Volume Highlights Avg. Daily Volume Weekly Avg. / Shares Out. One Month: 1,398 One Month: 0.31% Three Month: 1,675 Three Month: 0.37% Year-to-Date: 1,594 Year-to-Date: 0.36% ($ in millions) Quarter Ended FY 2013 FY 2014 FY 2015 FY 2016 6/30/2017 Balance Sheet Total Assets $660 $713 $750 $797 $874 Gross Loans $414 $440 $471 $531 $598 Deposits $478 $533 $533 $579 $674 Capital TCE / TA 2 8.5% 8.6% 9.2% 9.9% 9.5% T1 RBC 15.8% 13.6% 15.0% 10.7% 11.6% Tot. RBC 17.0% 14.9% 16.2% 11.8% 12.8% Profitability Measures NIM 4.09% 3.93% 3.84% 3.81% 3.76% Efficiency Ratio (GAAP) 69.6% 69.9% 69.6% 78.3% 65.3% Efficiency Ratio (non-GAAP) 2 69.6% 69.9% 69.6% 68.2% 65.3% ROAA 0.72% 0.78% 0.93% 1.03% 1.14% ROAE 5.63% 6.38% 7.43% 9.04% 10.92% Asset Quality NPAs / Assets 2.37% 1.73% 1.71% 1.49% 1.27% Reserves / Loans 1.34% 1.42% 1.41% 1.34% 1.34%

S IGNIFICANT C ORPORATE P RESENCE IN M ARKET – T OP L OUISVILLE MSA E MPLOYERS 5
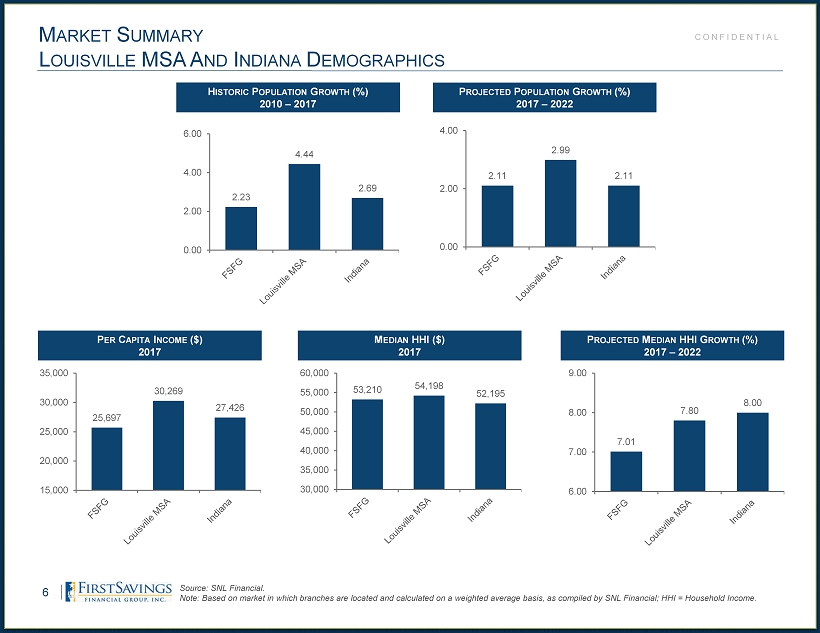
M ARKET S UMMARY L OUISVILLE MSA A ND I NDIANA D EMOGRAPHICS 6 Source: SNL Financial. Note: Based on market in which branches are located and calculated on a weighted average basis, as compiled by SNL Financial; HH I = Household Income. CONFIDENTIAL 2.11 2.99 2.11 0.00 2.00 4.00 P ROJECTED P OPULATION G ROWTH (%) 2017 – 2022 53,210 54,198 52,195 30,000 35,000 40,000 45,000 50,000 55,000 60,000 7.01 7.80 8.00 6.00 7.00 8.00 9.00 M EDIAN HHI ($) 2017 P ROJECTED M EDIAN HHI G ROWTH (%) 2017 – 2022 25,697 30,269 27,426 15,000 20,000 25,000 30,000 35,000 P ER C APITA I NCOME ($) 2017 2.23 4.44 2.69 0.00 2.00 4.00 6.00 H ISTORIC P OPULATION G ROWTH (%) 2010 – 2017
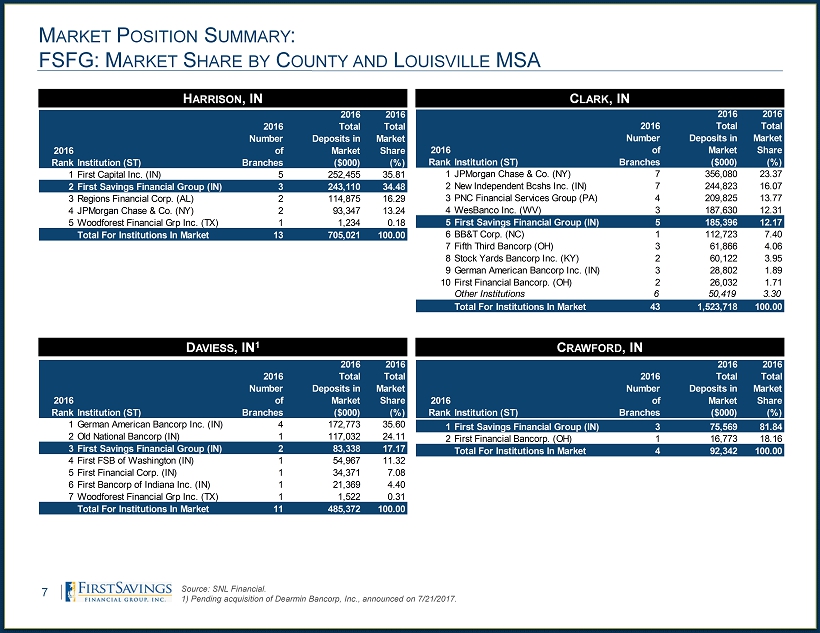
M ARKET P OSITION S UMMARY : FSFG: M ARKET S HARE BY C OUNTY AND L OUISVILLE MSA 7 H ARRISON , IN C LARK , IN D AVIESS , IN 1 C RAWFORD , IN 2016 RankInstitution (ST) 2016 Number of Branches 2016 Total Deposits in Market ($000) 2016 Total Market Share (%) 1First Capital Inc. (IN) 5 252,455 35.81 2First Savings Financial Group (IN) 3 243,110 34.48 3Regions Financial Corp. (AL) 2 114,875 16.29 4JPMorgan Chase & Co. (NY) 2 93,347 13.24 5Woodforest Financial Grp Inc. (TX) 1 1,234 0.18 Total For Institutions In Market 13 705,021 100.00 2016 RankInstitution (ST) 2016 Number of Branches 2016 Total Deposits in Market ($000) 2016 Total Market Share (%) 1JPMorgan Chase & Co. (NY) 7 356,080 23.37 2New Independent Bcshs Inc. (IN) 7 244,823 16.07 3PNC Financial Services Group (PA) 4 209,825 13.77 4WesBanco Inc. (WV) 3 187,630 12.31 5First Savings Financial Group (IN) 5 185,396 12.17 6BB&T Corp. (NC) 1 112,723 7.40 7Fifth Third Bancorp (OH) 3 61,866 4.06 8Stock Yards Bancorp Inc. (KY) 2 60,122 3.95 9German American Bancorp Inc. (IN) 3 28,802 1.89 10First Financial Bancorp. (OH) 2 26,032 1.71 Other Institutions 6 50,419 3.30 Total For Institutions In Market 43 1,523,718 100.00 2016 RankInstitution (ST) 2016 Number of Branches 2016 Total Deposits in Market ($000) 2016 Total Market Share (%) 1German American Bancorp Inc. (IN) 4 172,773 35.60 2Old National Bancorp (IN) 1 117,032 24.11 3First Savings Financial Group (IN) 2 83,338 17.17 4First FSB of Washington (IN) 1 54,967 11.32 5First Financial Corp. (IN) 1 34,371 7.08 6First Bancorp of Indiana Inc. (IN) 1 21,369 4.40 7Woodforest Financial Grp Inc. (TX) 1 1,522 0.31 Total For Institutions In Market 11 485,372 100.00 2016 RankInstitution (ST) 2016 Number of Branches 2016 Total Deposits in Market ($000) 2016 Total Market Share (%) 1First Savings Financial Group (IN) 3 75,569 81.84 2First Financial Bancorp. (OH) 1 16,773 18.16 Total For Institutions In Market 4 92,342 100.00 Source: SNL Financial. 1 ) Pending acquisition of Dearmin Bancorp, Inc., announced on 7/21/2017.
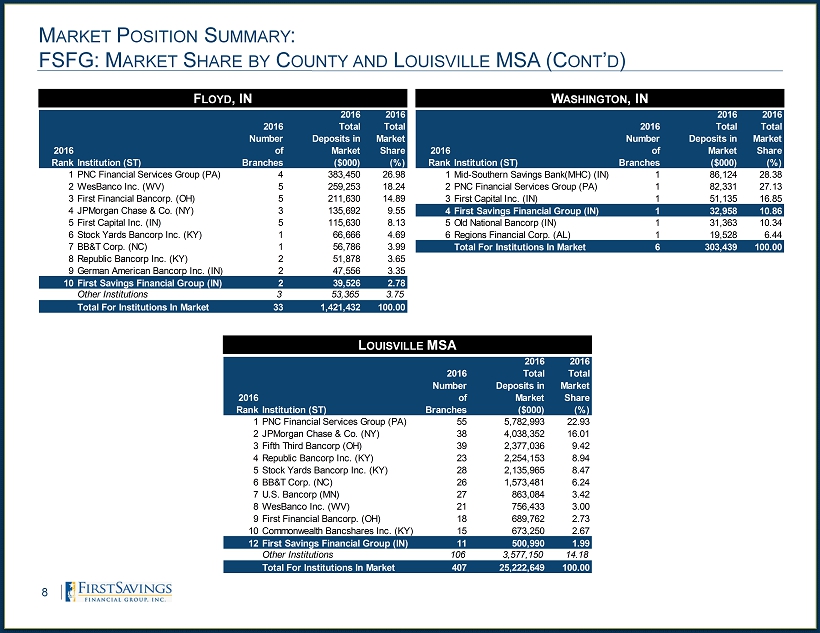
M ARKET P OSITION S UMMARY : FSFG: M ARKET S HARE BY C OUNTY AND L OUISVILLE MSA (C ONT ’ D ) 8 F LOYD , IN W ASHINGTON , IN L OUISVILLE MSA 2016 RankInstitution (ST) 2016 Number of Branches 2016 Total Deposits in Market ($000) 2016 Total Market Share (%) 1PNC Financial Services Group (PA) 4 383,450 26.98 2WesBanco Inc. (WV) 5 259,253 18.24 3First Financial Bancorp. (OH) 5 211,630 14.89 4JPMorgan Chase & Co. (NY) 3 135,692 9.55 5First Capital Inc. (IN) 5 115,630 8.13 6Stock Yards Bancorp Inc. (KY) 1 66,666 4.69 7BB&T Corp. (NC) 1 56,786 3.99 8Republic Bancorp Inc. (KY) 2 51,878 3.65 9German American Bancorp Inc. (IN) 2 47,556 3.35 10First Savings Financial Group (IN) 2 39,526 2.78 Other Institutions 3 53,365 3.75 Total For Institutions In Market 33 1,421,432 100.00 2016 RankInstitution (ST) 2016 Number of Branches 2016 Total Deposits in Market ($000) 2016 Total Market Share (%) 1Mid-Southern Savings Bank(MHC) (IN) 1 86,124 28.38 2PNC Financial Services Group (PA) 1 82,331 27.13 3First Capital Inc. (IN) 1 51,135 16.85 4First Savings Financial Group (IN) 1 32,958 10.86 5Old National Bancorp (IN) 1 31,363 10.34 6Regions Financial Corp. (AL) 1 19,528 6.44 Total For Institutions In Market 6 303,439 100.00 2016 RankInstitution (ST) 2016 Number of Branches 2016 Total Deposits in Market ($000) 2016 Total Market Share (%) 1PNC Financial Services Group (PA) 55 5,782,993 22.93 2JPMorgan Chase & Co. (NY) 38 4,038,352 16.01 3Fifth Third Bancorp (OH) 39 2,377,036 9.42 4Republic Bancorp Inc. (KY) 23 2,254,153 8.94 5Stock Yards Bancorp Inc. (KY) 28 2,135,965 8.47 6BB&T Corp. (NC) 26 1,573,481 6.24 7U.S. Bancorp (MN) 27 863,084 3.42 8WesBanco Inc. (WV) 21 756,433 3.00 9First Financial Bancorp. (OH) 18 689,762 2.73 10Commonwealth Bancshares Inc. (KY) 15 673,250 2.67 12First Savings Financial Group (IN) 11 500,990 1.99 Other Institutions 106 3,577,150 14.18 Total For Institutions In Market 407 25,222,649 100.00
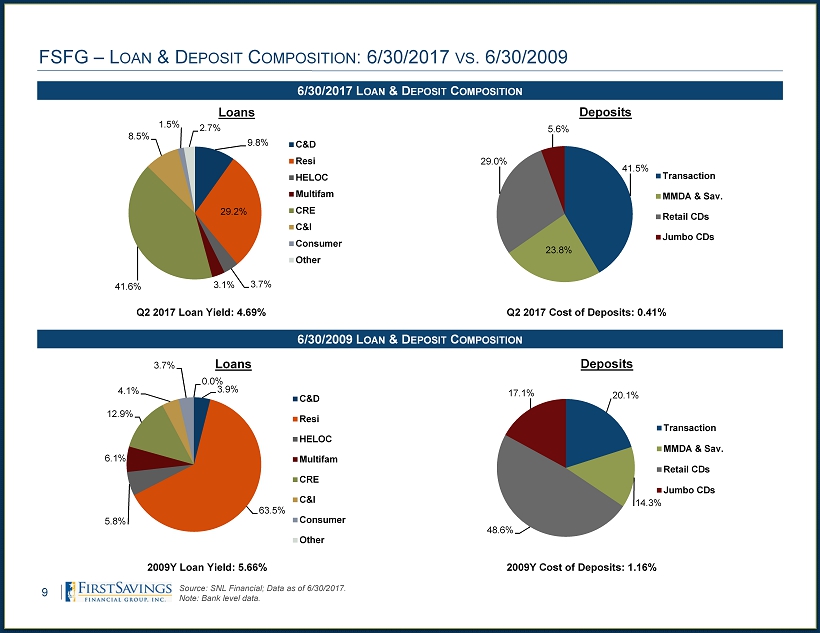
FSFG – L OAN & D EPOSIT C OMPOSITION : 6/30/2017 VS . 6/30/2009 6/30/2017 L OAN & D EPOSIT C OMPOSITION 9 Source: SNL Financial; Data as of 6/30/2017. Note: Bank level data. 9.8% 29.2% 3.7% 3.1% 41.6% 8.5% 1.5% 2.7% Loans C&D Resi HELOC Multifam CRE C&I Consumer Other 41.5% 23.8% 29.0% 5.6% Deposits Transaction MMDA & Sav. Retail CDs Jumbo CDs Q2 2017 Loan Yield: 4.69% Q2 2017 Cost of Deposits: 0.41% 6/30/2009 L OAN & D EPOSIT C OMPOSITION 3.9% 63.5% 5.8% 6.1% 12.9% 4.1% 3.7% 0.0% Loans C&D Resi HELOC Multifam CRE C&I Consumer Other 20.1% 14.3% 48.6% 17.1% Deposits Transaction MMDA & Sav. Retail CDs Jumbo CDs 2009Y Loan Yield: 5.66% 2009Y Cost of Deposits: 1.16%
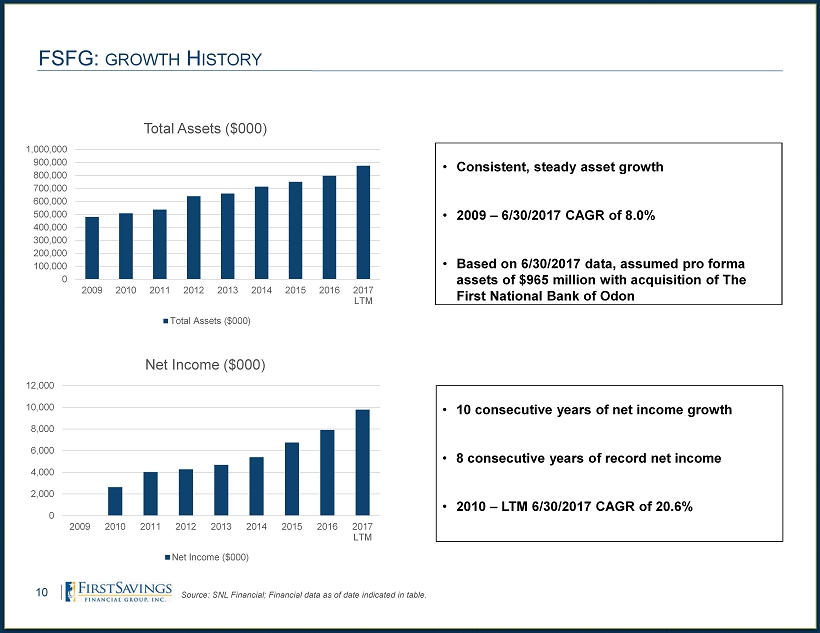
10 FSFG: GROWTH H ISTORY Source: SNL Financial; Financial data as of date indicated in table. 0 100,000 200,000 300,000 400,000 500,000 600,000 700,000 800,000 900,000 1,000,000 2009 2010 2011 2012 2013 2014 2015 2016 2017 LTM Total Assets ($000) Total Assets ($000) 0 2,000 4,000 6,000 8,000 10,000 12,000 2009 2010 2011 2012 2013 2014 2015 2016 2017 LTM Net Income ($000) Net Income ($000) • 10 consecutive years of net income growth • 8 consecutive years of record net income • 2010 – LTM 6/30/2017 CAGR of 20.6% • Consistent, steady asset growth • 2009 – 6/30/2017 CAGR of 8.0% • Based on 6/30/2017 data, assumed pro forma assets of $965 million with acquisition of The First National Bank of Odon
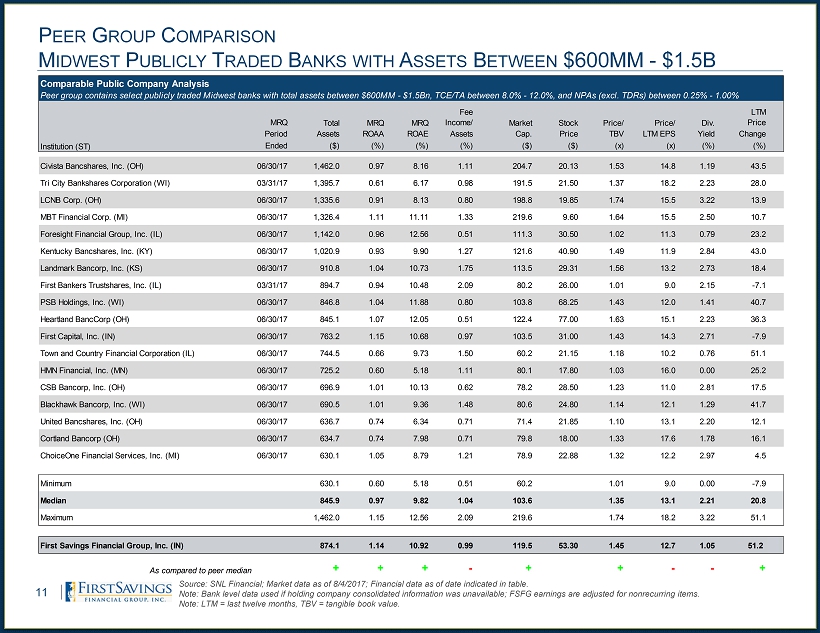
11 Source : SNL Financial; Market data as of 8/4/2017; Financial data as of date indicated in table. Note: Bank level data used if holding company consolidated information was unavailable; FSFG earnings are adjusted for nonrecurring items. Note: LTM = last twelve months, TBV = tangible book value. P EER G ROUP C OMPARISON M IDWEST P UBLICLY T RADED B ANKS WITH A SSETS B ETWEEN $600MM - $1.5B LTM MRQ Total MRQ MRQ MRQ Fee Income/ Market Stock Price/ Price/ Div. LTM Price Period Assets ROAA ROAE Assets Cap. Price TBV LTM EPS Yield Change Institution (ST) Ended ($) (%) (%) (%) ($) ($) (x) (x) (%) (%) Civista Bancshares, Inc. (OH) 06/30/17 1,462.0 0.97 8.16 1.11 204.7 20.13 1.53 14.8 1.19 43.5 Tri City Bankshares Corporation (WI) 03/31/17 1,395.7 0.61 6.17 0.98 191.5 21.50 1.37 18.2 2.23 28.0 LCNB Corp. (OH) 06/30/17 1,335.6 0.91 8.13 0.80 198.8 19.85 1.74 15.5 3.22 13.9 MBT Financial Corp. (MI) 06/30/17 1,326.4 1.11 11.11 1.33 219.6 9.60 1.64 15.5 2.50 10.7 Foresight Financial Group, Inc. (IL) 06/30/17 1,142.0 0.96 12.56 0.51 111.3 30.50 1.02 11.3 0.79 23.2 Kentucky Bancshares, Inc. (KY) 06/30/17 1,020.9 0.93 9.90 1.27 121.6 40.90 1.49 11.9 2.84 43.0 Landmark Bancorp, Inc. (KS) 06/30/17 910.8 1.04 10.73 1.75 113.5 29.31 1.56 13.2 2.73 18.4 First Bankers Trustshares, Inc. (IL) 03/31/17 894.7 0.94 10.48 2.09 80.2 26.00 1.01 9.0 2.15 -7.1 PSB Holdings, Inc. (WI) 06/30/17 846.8 1.04 11.88 0.80 103.8 68.25 1.43 12.0 1.41 40.7 Heartland BancCorp (OH) 06/30/17 845.1 1.07 12.05 0.51 122.4 77.00 1.63 15.1 2.23 36.3 First Capital, Inc. (IN) 06/30/17 763.2 1.15 10.68 0.97 103.5 31.00 1.43 14.3 2.71 -7.9 Town and Country Financial Corporation (IL) 06/30/17 744.5 0.66 9.73 1.50 60.2 21.15 1.18 10.2 0.76 51.1 HMN Financial, Inc. (MN) 06/30/17 725.2 0.60 5.18 1.11 80.1 17.80 1.03 16.0 0.00 25.2 CSB Bancorp, Inc. (OH) 06/30/17 696.9 1.01 10.13 0.62 78.2 28.50 1.23 11.0 2.81 17.5 Blackhawk Bancorp, Inc. (WI) 06/30/17 690.5 1.01 9.36 1.48 80.6 24.80 1.14 12.1 1.29 41.7 United Bancshares, Inc. (OH) 06/30/17 636.7 0.74 6.34 0.71 71.4 21.85 1.10 13.1 2.20 12.1 Cortland Bancorp (OH) 06/30/17 634.7 0.74 7.98 0.71 79.8 18.00 1.33 17.6 1.78 16.1 ChoiceOne Financial Services, Inc. (MI) 06/30/17 630.1 1.05 8.79 1.21 78.9 22.88 1.32 12.2 2.97 4.5 Minimum 630.1 0.60 5.18 0.51 60.2 1.01 9.0 0.00 -7.9 Median 845.9 0.97 9.82 1.04 103.6 1.35 13.1 2.21 20.8 Maximum 1,462.0 1.15 12.56 2.09 219.6 1.74 18.2 3.22 51.1 First Savings Financial Group, Inc. (IN) 874.1 1.14 10.92 0.99 119.5 53.30 1.45 12.7 1.05 51.2 As compared to peer median + + + - + + - - + Comparable Public Company Analysis Peer group contains select publicly traded Midwest banks with total assets between $600MM - $1.5Bn, TCE/TA between 8.0% - 12.0%, and NPAs (excl. TDRs) between 0.25% - 1.00%
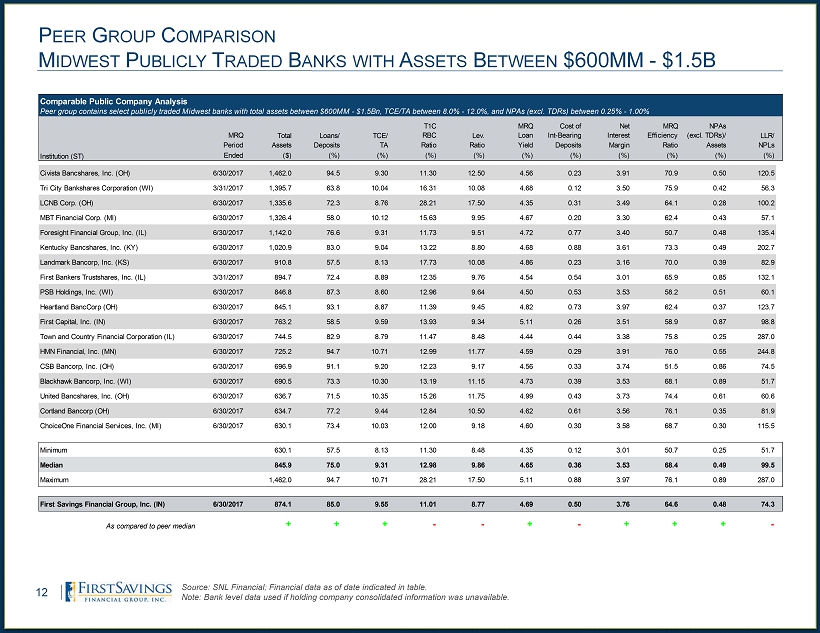
12 P EER G ROUP C OMPARISON M IDWEST P UBLICLY T RADED B ANKS WITH A SSETS B ETWEEN $600MM - $1.5B Source: SNL Financial; Financial data as of date indicated in table. Note: Bank level data used if holding company consolidated information was unavailable. Peer group contains select publicly traded Midwest banks with total assets between $600MM - $1.5Bn, TCE/TA between 8.0% - 12.0%, and NPAs (excl. TDRs) between 0.25% - 1.00% MRQ Total Loans/ TCE/ T1C RBC Lev. MRQ Loan MRQ Cost of Int-Bearing MRQ Net Interest MRQ Efficiency NPAs (excl. TDRs)/ LLR/ Period Assets Deposits TA Ratio Ratio Yield Deposits Margin Ratio Assets NPLs Institution (ST) Ended ($) (%) (%) (%) (%) (%) (%) (%) (%) (%) (%) Civista Bancshares, Inc. (OH) 6/30/2017 1,462.0 94.5 9.30 11.30 12.50 4.56 0.23 3.91 70.9 0.50 120.5 Tri City Bankshares Corporation (WI) 3/31/2017 1,395.7 63.8 10.04 16.31 10.08 4.68 0.12 3.50 75.9 0.42 56.3 LCNB Corp. (OH) 6/30/2017 1,335.6 72.3 8.76 28.21 17.50 4.35 0.31 3.49 64.1 0.28 100.2 MBT Financial Corp. (MI) 6/30/2017 1,326.4 58.0 10.12 15.63 9.95 4.67 0.20 3.30 62.4 0.43 57.1 Foresight Financial Group, Inc. (IL) 6/30/2017 1,142.0 76.6 9.31 11.73 9.51 4.72 0.77 3.40 50.7 0.48 135.4 Kentucky Bancshares, Inc. (KY) 6/30/2017 1,020.9 83.0 9.04 13.22 8.80 4.68 0.88 3.61 73.3 0.49 202.7 Landmark Bancorp, Inc. (KS) 6/30/2017 910.8 57.5 8.13 17.73 10.08 4.86 0.23 3.16 70.0 0.39 82.9 First Bankers Trustshares, Inc. (IL) 3/31/2017 894.7 72.4 8.89 12.35 9.76 4.54 0.54 3.01 65.9 0.85 132.1 PSB Holdings, Inc. (WI) 6/30/2017 846.8 87.3 8.60 12.96 9.64 4.50 0.53 3.53 58.2 0.51 60.1 Heartland BancCorp (OH) 6/30/2017 845.1 93.1 8.87 11.39 9.45 4.82 0.73 3.97 62.4 0.37 123.7 First Capital, Inc. (IN) 6/30/2017 763.2 58.5 9.59 13.93 9.34 5.11 0.26 3.51 58.9 0.87 98.8 Town and Country Financial Corporation (IL) 6/30/2017 744.5 82.9 8.79 11.47 8.48 4.44 0.44 3.38 75.8 0.25 287.0 HMN Financial, Inc. (MN) 6/30/2017 725.2 94.7 10.71 12.99 11.77 4.59 0.29 3.91 76.0 0.55 244.8 CSB Bancorp, Inc. (OH) 6/30/2017 696.9 91.1 9.20 12.23 9.17 4.56 0.33 3.74 51.5 0.86 74.5 Blackhawk Bancorp, Inc. (WI) 6/30/2017 690.5 73.3 10.30 13.19 11.15 4.73 0.39 3.53 68.1 0.89 51.7 United Bancshares, Inc. (OH) 6/30/2017 636.7 71.5 10.35 15.26 11.75 4.99 0.43 3.73 74.4 0.61 60.6 Cortland Bancorp (OH) 6/30/2017 634.7 77.2 9.44 12.84 10.50 4.62 0.61 3.56 76.1 0.35 81.9 ChoiceOne Financial Services, Inc. (MI) 6/30/2017 630.1 73.4 10.03 12.00 9.18 4.60 0.30 3.58 68.7 0.30 115.5 Minimum 630.1 57.5 8.13 11.30 8.48 4.35 0.12 3.01 50.7 0.25 51.7 Median 845.9 75.0 9.31 12.98 9.86 4.65 0.36 3.53 68.4 0.49 99.5 Maximum 1,462.0 94.7 10.71 28.21 17.50 5.11 0.88 3.97 76.1 0.89 287.0 First Savings Financial Group, Inc. (IN) 6/30/2017 874.1 85.0 9.55 11.01 8.77 4.69 0.50 3.76 64.6 0.48 74.3 Buckeye data as of June 30, 2016 As compared to peer median + + + - - + - + + + - Comparable Public Company Analysis
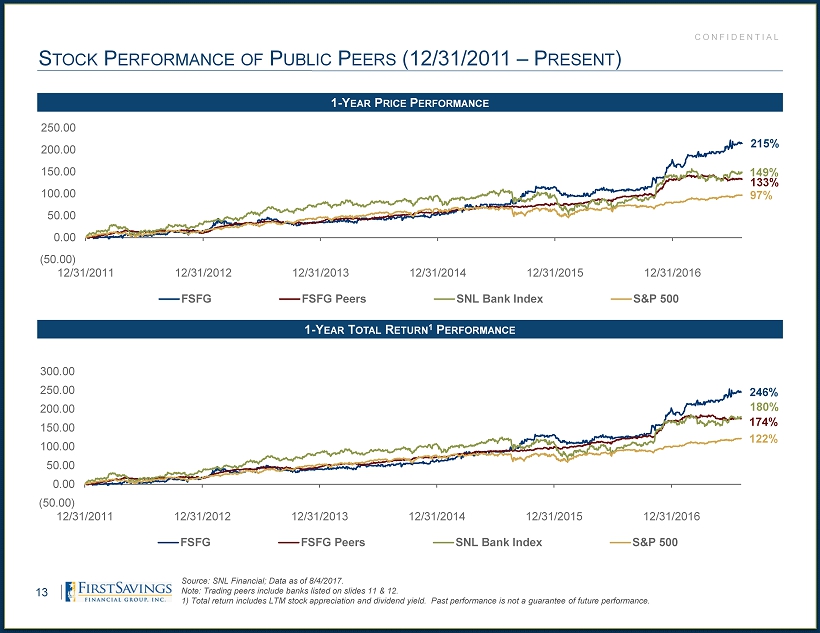
S TOCK P ERFORMANCE OF P UBLIC P EERS (12/31/2011 – P RESENT ) 1 - Y EAR P RICE P ERFORMANCE 13 1 - Y EAR T OTAL R ETURN 1 P ERFORMANCE 215% 133% 149% 97% (50.00) 0.00 50.00 100.00 150.00 200.00 250.00 12/31/2011 12/31/2012 12/31/2013 12/31/2014 12/31/2015 12/31/2016 FSFG FSFG Peers SNL Bank Index S&P 500 Source: SNL Financial; Data as of 8/4/2017. Note : Trading peers include banks listed on slides 11 & 12. 1 ) Total return includes LTM stock appreciation and dividend yield. Past performance is not a guarantee of future performance. CONFIDENTIAL 246% 174% 180% 122% (50.00) 0.00 50.00 100.00 150.00 200.00 250.00 300.00 12/31/2011 12/31/2012 12/31/2013 12/31/2014 12/31/2015 12/31/2016 FSFG FSFG Peers SNL Bank Index S&P 500
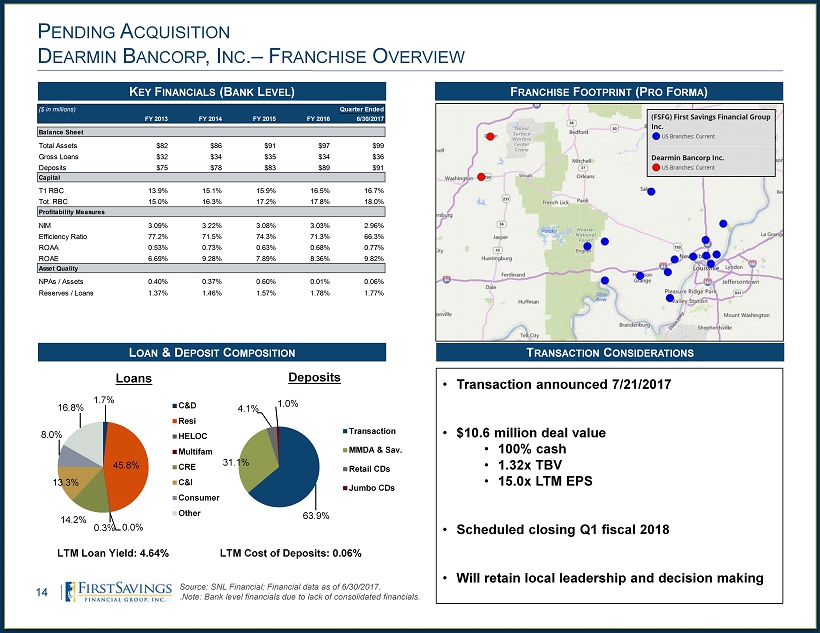
P ENDING A CQUISITION D EARMIN B ANCORP , I NC . – F RANCHISE O VERVIEW 14 L OAN & D EPOSIT C OMPOSITION 1.7% 45.8% 0.3% 0.0% 14.2% 13.3% 8.0% 16.8% Loans C&D Resi HELOC Multifam CRE C&I Consumer Other F RANCHISE F OOTPRINT (P RO F ORMA ) Source: SNL Financial; Financial data as of 6/30/2017. .Note: Bank level financials due to lack of consolidated financials. 63.9% 31.1% 4.1% 1.0% Deposits Transaction MMDA & Sav. Retail CDs Jumbo CDs LTM Loan Yield: 4.64% LTM Cost of Deposits: 0.06% T RANSACTION C ONSIDERATIONS K EY F INANCIALS (B ANK L EVEL ) • Transaction announced 7/21/2017 • $10.6 million deal value • 100% cash • 1.32x TBV • 15.0x LTM EPS • Scheduled closing Q1 fiscal 2018 • Will retain local leadership and decision making ($ in millions) Quarter Ended FY 2013 FY 2014 FY 2015 FY 2016 6/30/2017 Balance Sheet Total Assets $82 $86 $91 $97 $99 Gross Loans $32 $34 $35 $34 $36 Deposits $75 $78 $83 $89 $91 Capital T1 RBC 13.9% 15.1% 15.9% 16.5% 16.7% Tot. RBC 15.0% 16.3% 17.2% 17.8% 18.0% Profitability Measures NIM 3.09% 3.22% 3.08% 3.03% 2.96% Efficiency Ratio 77.2% 71.5% 74.3% 71.3% 66.3% ROAA 0.53% 0.73% 0.63% 0.68% 0.77% ROAE 6.69% 9.28% 7.89% 8.36% 9.82% Asset Quality NPAs / Assets 0.40% 0.37% 0.60% 0.01% 0.06% Reserves / Loans 1.37% 1.46% 1.57% 1.78% 1.77%
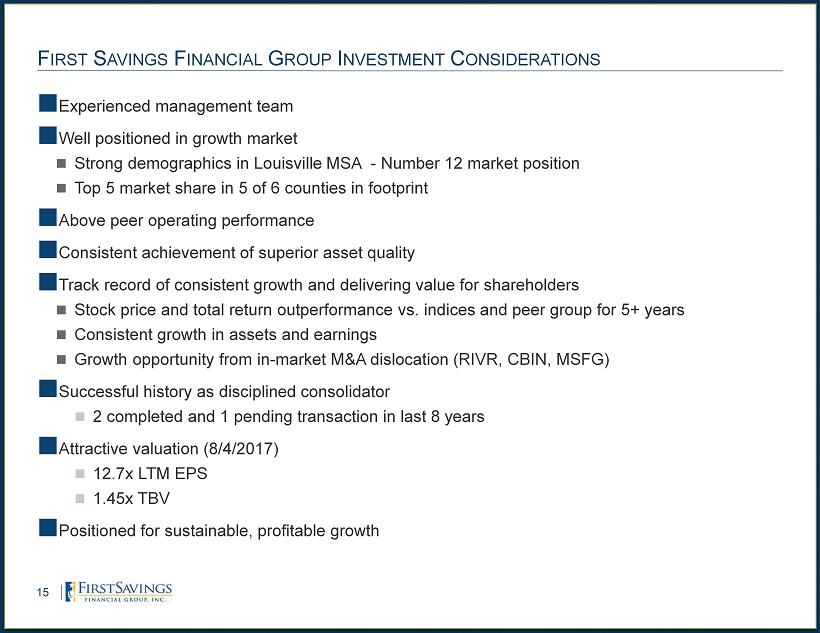
F IRST S AVINGS F INANCIAL G ROUP I NVESTMENT C ONSIDERATIONS 15 ■ Experienced management team ■ Well positioned in growth market Strong demographics in Louisville MSA - Number 12 market position Top 5 market share in 5 of 6 counties in footprint ■ Above peer operating performance ■ Consistent achievement of superior asset quality ■ Track record of consistent growth and delivering value for shareholders Stock price and total return outperformance vs. indices and peer group for 5+ years Consistent growth in assets and earnings Growth opportunity from in - market M&A dislocation (RIVR, CBIN, MSFG) ■ Successful history as disciplined consolidator 2 completed and 1 pending transaction in last 8 years ■ Attractive valuation (8/4/2017) 12.7x LTM EPS 1.45x TBV ■ Positioned for sustainable, profitable growth

N OTES / Q UESTIONS 16
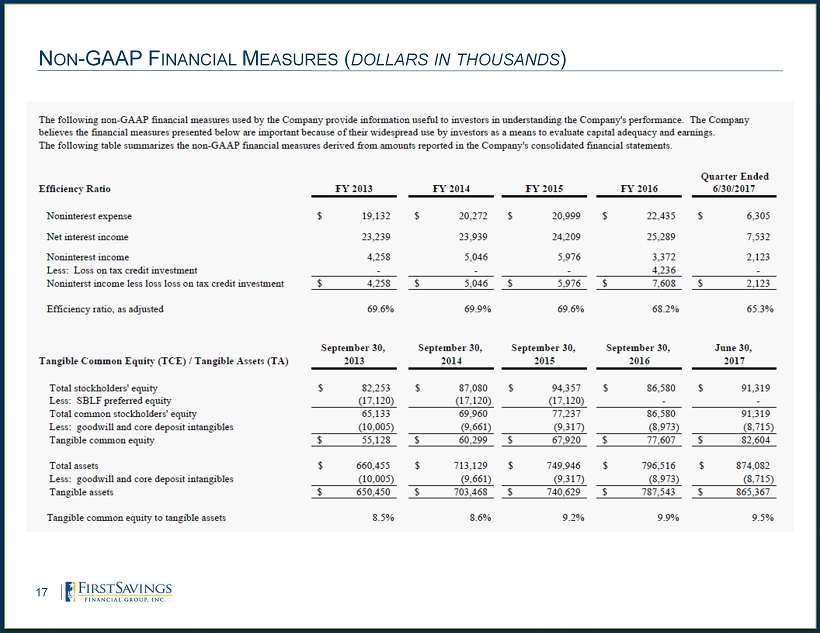
N ON - GAAP F INANCIAL M EASURES ( DOLLARS IN THOUSANDS ) 17