Attached files
| file | filename |
|---|---|
| 8-K - CURRENT REPORT - FAUQUIER BANKSHARES, INC. | form8kinvestor.htm |

_____________________FAUQUIER BANKSHARES, INC. Boenning & Scattergood PresentationAugust 9, 2017NASDAQ: FBSS

Safe Harbor Statement Today’s presentations may include forward-looking statements. These statements represent the company's beliefs regarding future events that, by their nature, are uncertain and outside of the company’s control. The company’s actual results and financial condition may differ, possibly materially, from what is indicated in these forward-looking statements. Additional information concerning the Company and its business, including additional factors that could materially affect the Company’s financial results, is included in the Company’s Annual Report on Form 10-K for the year ended December 31, 2016 under “Management’s Discussion and Analysis of Financial Condition and Results of Operation.” * FAUQUIER BANKSHARES, INC.

* Summary Statistics FAUQUIER BANKSHARES, INC. Founded 1902Headquarters Warrenton, VirginiaTotal Assets $646 millionTotal Loans, net $463 millionShares Outstanding 3,769,201Insider Ownership 4.04%Institutional Ownership 18.14% Shareholders 332All data provided as of June 30, 2017, unless otherwise noted.
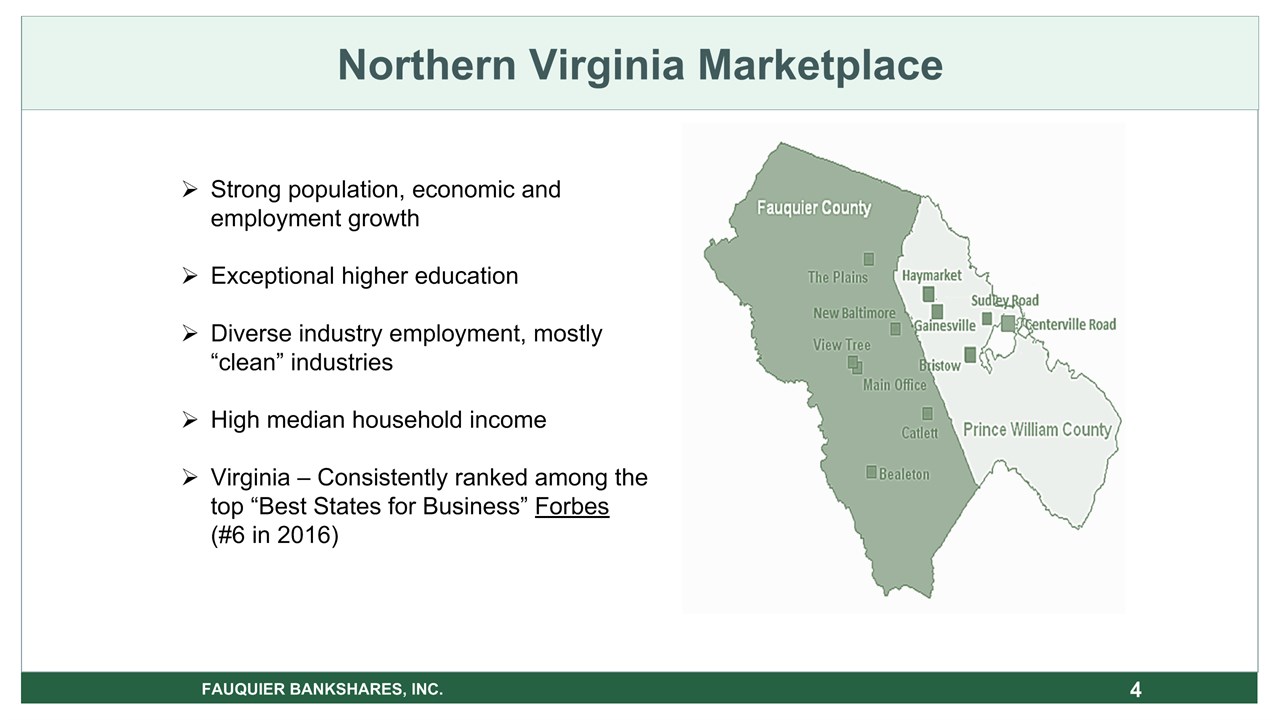
* Northern Virginia Marketplace FAUQUIER BANKSHARES, INC. Strong population, economic and employment growthExceptional higher educationDiverse industry employment, mostly “clean” industriesHigh median household incomeVirginia – Consistently ranked among the top “Best States for Business” Forbes (#6 in 2016)

* Sustainable Growth Demographics FAUQUIER BANKSHARES, INC. Market National Ranking by Median HH Income 2017 TotalPopulation2017(actual) PopulationChange2010 - 2017(%) ProjectedChange2017-2022(%) Unemployment Rate 2017(%) TotalHouseholds2017(actual) MedianHH Income2017($) Projected HHIncome Change2017-2022(%) Per Capita Income2017($) City of Falls Church 1 14,425 16.97 8.32 2.8 5,855 128,077 4.73 74,457 Loudoun County 2 392,258 25.60 9.97 3.2 129,202 125,178 3.35 53,363 Fairfax County 3 1,148,944 6.21 4.53 3.1 415,552 114,537 2.67 56,925 Arlington County 6 235,951 13.64 7.27 2.7 112,970 111,870 3.78 72,967 City of Fairfax 10 24,090 6.76 4.80 3.2 8,876 106,138 3.76 53,427 Fauquier County 22 69,383 6.41 4.55 3.3 25,224 96,850 6.02 44,980 Prince William County 26 459,770 14.37 7.50 3.5 147,252 94,725 (0.96) 39,153 City of Alexandria 36 159,248 13.78 7.30 3.0 77,811 91,995 4.90 63,895 Source: SNL Financial. Note: All Data as of June 30, 2017, except unemployment rate which is as of May 31, 2017.

* Financial Highlights FAUQUIER BANKSHARES, INC. For the Quarter Ended, For the Quarter Ended, For the Quarter Ended, For the Quarter Ended, For the Quarter Ended, June 30, 2017 Mar. 31, 2017 Dec. 31, 2016 Sept. 30, 2016 June 30, 2016* Return on Average Assets 0.63% 0.50% 0.51% 0.44% 1.02% Return on Average Equity 7.10% 5.68% 5.91% 5.11% 11.73% Efficiency Ratio 76.81% 83.95% 83.01% 79.03% 82.75% Assets ($000) 646,265 630,032 624,445 623,877 619,192 Loans, Net ($000) 463,309 451,166 458,608 452,874 451,093 Deposits ($000) 571,902 551,103 546,157 545,402 540,391 Net Income ($000) 990 768 808 698 1,562 Net Interest Income ($000) 5,204 4,946 5,080 4,965 4,869 * Results reflect effect of one-time event of a $1.13 million negative provision resulting from a recovery on a loan charged-off in 2015.

Return on Average Assets (ROA) * FAUQUIER BANKSHARES, INC. Peer Group consists of 16 comparable Bank Holding Companies and Commercial Banks located in Virginia, Maryland and West Virginia. Averages of reported data used. (Source: SNL) FBSS 2017 YTD0.57%

Peer Group consists of 16 comparable Bank Holding Companies and Commercial Banks located in Virginia, Maryland and West Virginia. Averages of reported data used. (Source: SNL) Return on Average Equity (ROE) 8 FAUQUIER BANKSHARES, INC. FBSS 2017 YTD6.40%
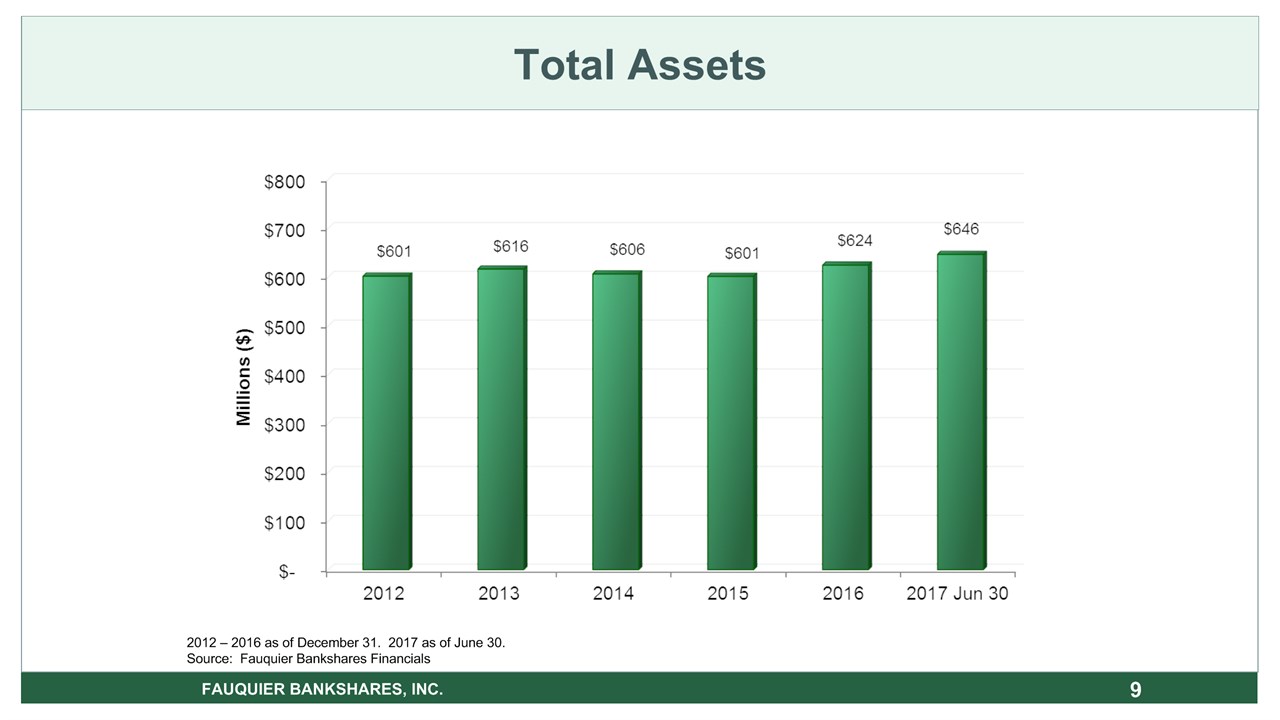
* 2012 – 2016 as of December 31. 2017 as of June 30.Source: Fauquier Bankshares Financials Total Assets FAUQUIER BANKSHARES, INC.

* 2012 – 2016 as of December 31. 2017 as of June 30.Source: Fauquier Bankshares Financials Loans, Net FAUQUIER BANKSHARES, INC.

* Source: Fauquier Bankshares Financials *Includes $12MM in U.S. Government Guaranteed Student Loans Loan PortfolioAt June 30, 2017 FAUQUIER BANKSHARES, INC.

Nonperforming Loans to Period End Loans 12 Peer Group consists of 16 comparable Bank Holding Companies and Commercial Banks located in Virginia, Maryland and West Virginia. Averages of reported data used. (Source: SNL) FAUQUIER BANKSHARES, INC. FBSS 2017 YTD0.50%

* 2012 – 2016 as of December 31. 2017 as of June 30.Source: Fauquier Bankshares Financials Total Deposits FAUQUIER BANKSHARES, INC.

* Source: Fauquier Bankshares Financials Deposit PortfolioAt June 30, 2017 FAUQUIER BANKSHARES, INC. * Includes large-dollar investments of local depositories in insured CDs and MMAs through exchange with other FDIC insured institutions.
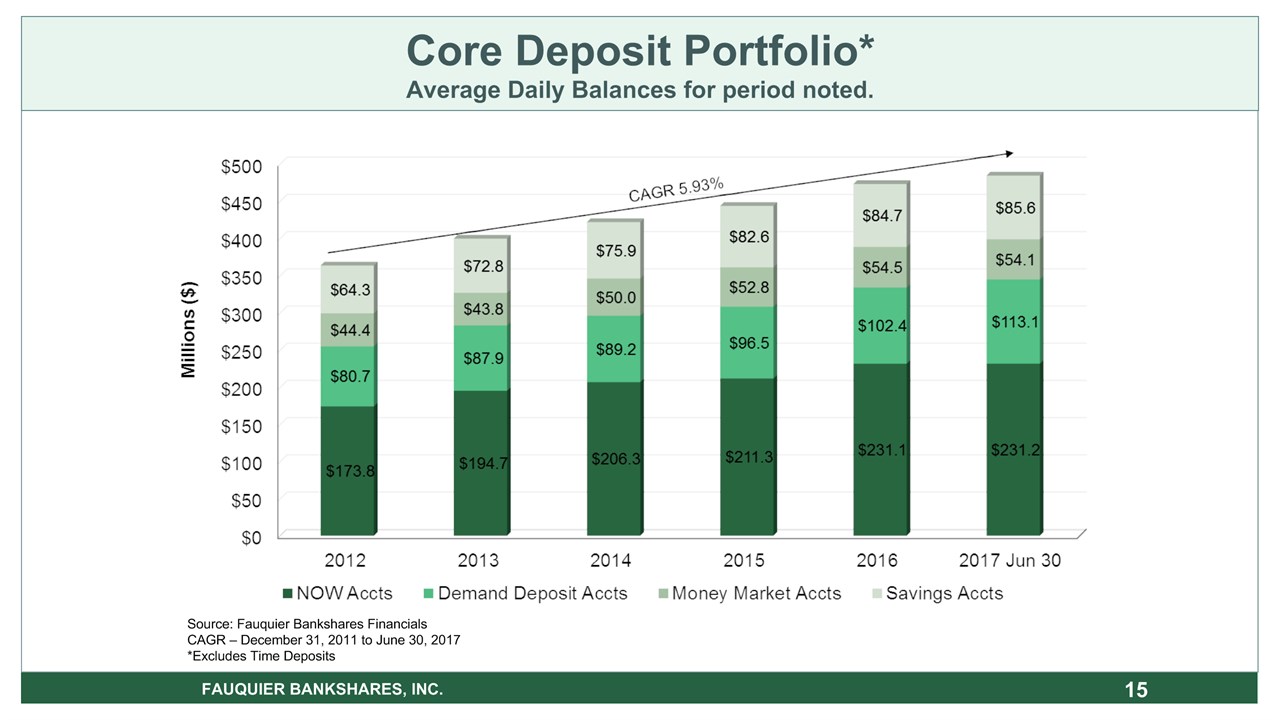
Source: Fauquier Bankshares FinancialsCAGR – December 31, 2011 to June 30, 2017*Excludes Time Deposits * Core Deposit Portfolio*Average Daily Balances for period noted. FAUQUIER BANKSHARES, INC.

Cost of Funds 16 Peer Group consists of 16 comparable Bank Holding Companies and Commercial Banks located in Virginia, Maryland and West Virginia. Averages of reported data used. (Source: SNL) FAUQUIER BANKSHARES, INC. FBSS 2017 YTD0.35%

Net Interest Margin* 17 Peer Group consists of 16 comparable Bank Holding Companies and Commercial Banks located in Virginia, Maryland and West Virginia. Averages of reported data used. (Source: SNL) FAUQUIER BANKSHARES, INC. FBSS 2017 YTD3.56%

Total Non-Interest IncomeAs a Percent of Average Assets 18 FAUQUIER BANKSHARES, INC. Peer Group consists of 16 comparable Bank Holding Companies and Commercial Banks located in Virginia, Maryland and West Virginia. Averages of reported data used. (Source: SNL) FBSS 2017 YTD0.89%
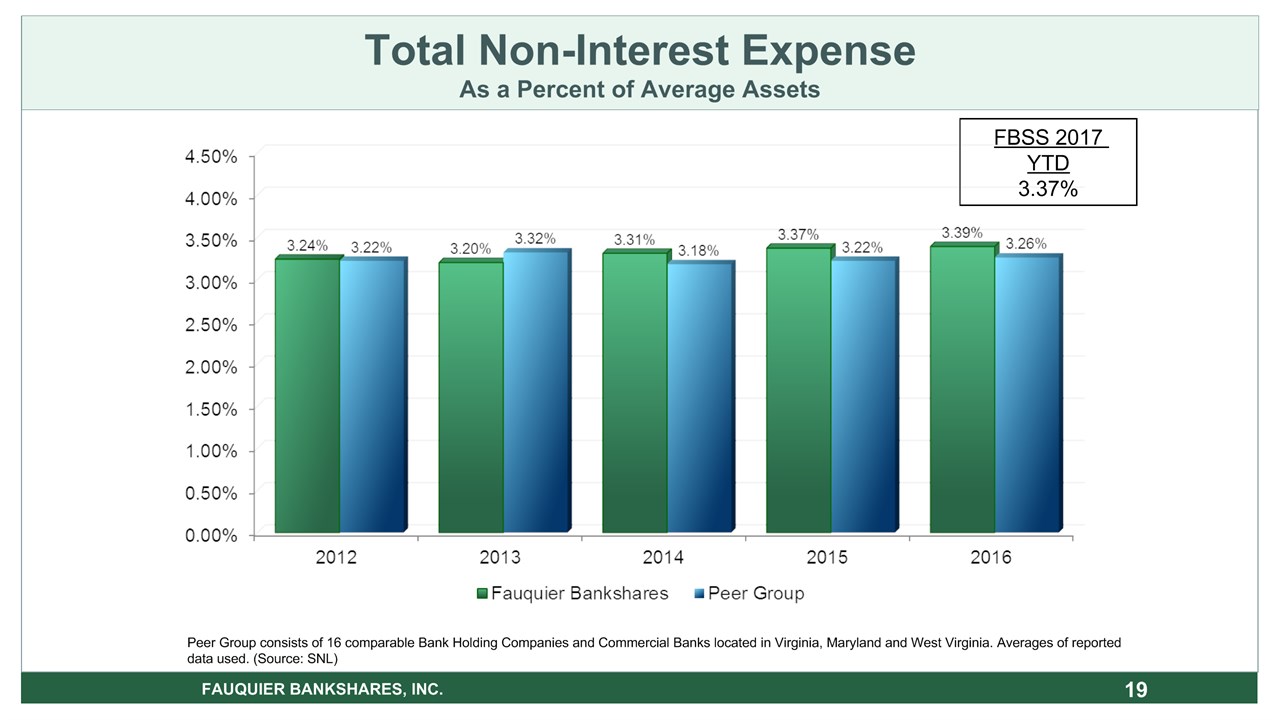
Total Non-Interest ExpenseAs a Percent of Average Assets 19 FAUQUIER BANKSHARES, INC. Peer Group consists of 16 comparable Bank Holding Companies and Commercial Banks located in Virginia, Maryland and West Virginia. Averages of reported data used. (Source: SNL) FBSS 2017 YTD3.37%

Assets Under Management(At Market Value) 20 FAUQUIER BANKSHARES, INC. Source: Wealth Management Services Statement of Condition and Yahoo Finance – 2012 – 2016 as of December 31. 2017 as of June 30.

Efficiency Ratio* * Peer Group consists of 16 comparable Bank Holding Companies and Commercial Banks located in Virginia, Maryland and West Virginia. Averages of reported data used. (Source: SNL) *Efficiency ratio is computed by dividing non-interest expense by adjusted operating income on a taxable equivalent basis. Includes gains and losses on the sale or impairment of securities and OREO. FAUQUIER BANKSHARES, INC. FBSS 2017 YTD80.3%
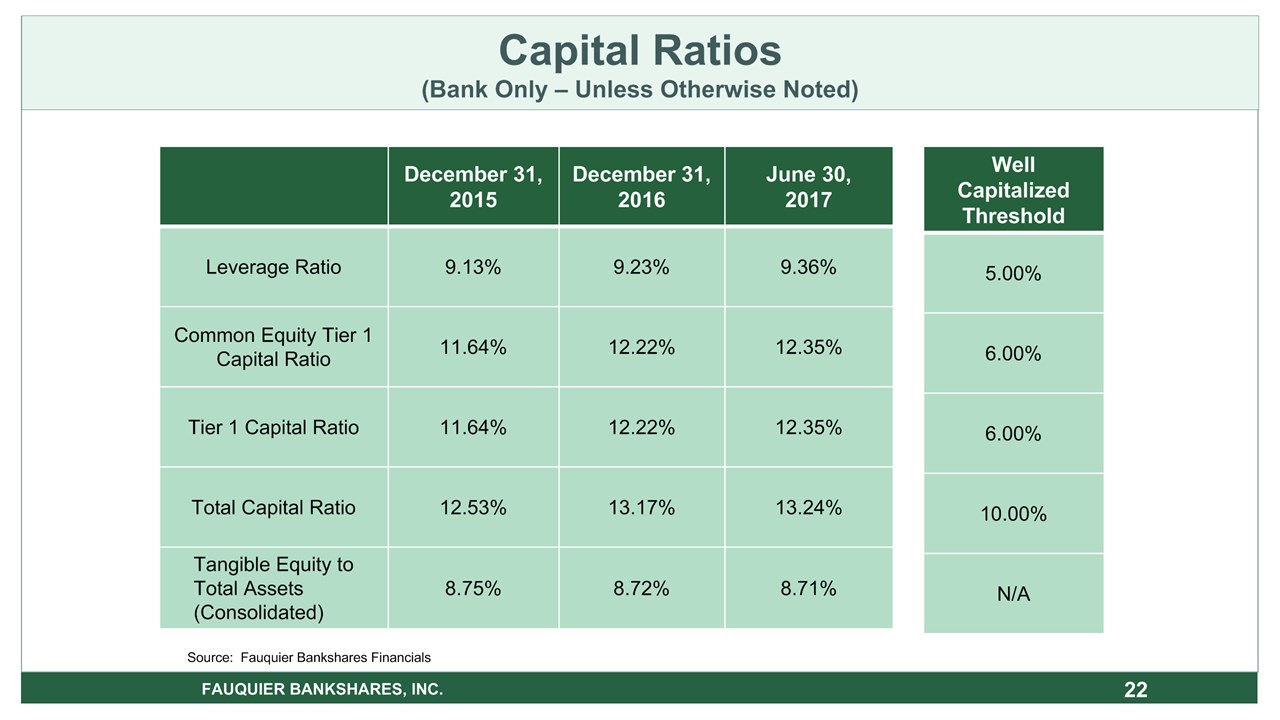
* Capital Ratios(Bank Only – Unless Otherwise Noted) FAUQUIER BANKSHARES, INC. December 31, 2015 December 31, 2016 June 30, 2017 Leverage Ratio 9.13% 9.23% 9.36% Common Equity Tier 1 Capital Ratio 11.64% 12.22% 12.35% Tier 1 Capital Ratio 11.64% 12.22% 12.35% Total Capital Ratio 12.53% 13.17% 13.24% Tangible Equity to Total Assets (Consolidated) 8.75% 8.72% 8.71% Well Capitalized Threshold 5.00% 6.00% 6.00% 10.00% N/A Source: Fauquier Bankshares Financials

* Strategic Initiatives FAUQUIER BANKSHARES, INC.

* Shareholders FAUQUIER BANKSHARES, INC.

* Tangible Book Value Improvement FAUQUIER BANKSHARES, INC. 12/31/2015 12/31/2016 6/30/2017 Book Value $14.06 $14.51 $14.93 Change from 12/31/2015 Book Value $0.45 $0.87 Plus: Dividends Paid $0.48 $0.72 Total Change $0.93 $1.59 Percentage Change 6.61% 11.31%

Stock Price – Total Return % 26 FAUQUIER BANKSHARES, INC. Source: SNL Financial – As of end of day Monday, July 31, 2017

Peer Group Defined 27 FAUQUIER BANKSHARES, INC. Bank of Botetourt (VA)Bank of the James Financial Group, Inc. (VA)Blue Ridge Bankshares, Inc. (VA)County First Bank (MD)Eagle Financial Services, Inc. (VA)Farmers Bankshares, Inc. (VA)Freedom Bank of Virginia (VA)Highlands Bankshares, Inc. (VA) HomeTown Bankshares Corp. (VA)New Peoples Bankshares, Inc. (VA)Oak View National Bank (VA)Pinnacle Bankshares Corp. (VA)Potomac Bancshares, Inc. (WV)Virginia Community Bankshares, Inc. (VA)Virginia National Bankshares Corp. (VA)Virginia Partners Bank (VA) Peer group is comprised of Community Banks under $1 billion in TFB’s market area.

Investor Relations ContactsMarc J. BoganPresident & Chief Executive Officer marc.bogan@tfb.bankChristine E. HeadlyExecutive Vice President& Chief Financial Officerchris.headly@tfb.bankDanielle JenkinsShareholder Relations Specialistdanielle.jenkins@tfb.bankwww.tfb.bank MAIN OFFICE THE PLAINS VIEW TREE BEALETON GAINESVILLE SUDLEY ROAD NEW BALTIMORE CATLETT BRISTOW HAYMARKET CENTERVILLE ROAD Contact Information 28 FAUQUIER BANKSHARES, INC.