Attached files
| file | filename |
|---|---|
| EX-99.2 - EXHIBIT 99.2 - CARVANA CO. | a9928-kq22017.htm |
| 8-K - 8-K - CARVANA CO. | q2178-k.htm |
Exhibit 99.1
Carvana Co. Q2 2017 Shareholder Letter
Tempe, Arizona
August 8, 2017
Dear Shareholders,
We’re pleased to announce our second quarter 2017 results. In the second quarter, we continued to execute our plan of rapidly growing while simultaneously improving unit economics and delivering great customer experiences. Compared to Q2 2016, we grew total retail units sold by 145%, we grew total revenue by 142%, and we increased total gross profit by 166%. We look forward to discussing our Q2 results with you on our conference call at 2 p.m. Pacific Time today.
Summary of Q2 Results
In Q2, we continued to see significant improvements across a number of key metrics. Our results this quarter exceeded the guidance we provided in our Q1 shareholder letter, as we achieved several operating goals faster than anticipated. All financial comparisons are versus Q2 2016, unless otherwise noted. Complete financial tables appear at the end of this letter.
• | Retail units sold totaled 10,682, an increase of 145% |
• | Revenue totaled $209.4 million, an increase of 142% |
• | Total gross profit was $16.0 million, an increase of 166% |
• | Total gross profit per unit was $1,501, an increase of $332 per unit compared to Q1 2017 |
• | Net loss was $38.9 million, an increase of 115% |
• | EBITDA margin was (16.1%), an improvement from (21.6%) in Q1 2017 |
• | GAAP basic and diluted net loss per Class A share was $0.28 based on 15 million shares of Class A common stock outstanding |
• | Adjusted net loss per Class A share, a non-GAAP measure, was $0.28, based on 136.7 million adjusted shares of Class A common stock outstanding assuming the exchange of all outstanding LLC Units for shares of Class A common stock |
• | We opened 7 new markets, bringing our end-of-quarter total to 30 |
• | We acquired fellow automotive tech disruptor Carlypso |
• | On August 4, 2017, we upsized our inventory facility with Ally Bank to $275 million through December 31, 2017 and then $350 million through December 31, 2018 |
Q3 and Fiscal 2017 Outlook
We anticipate further unit and revenue growth, as well as total gross profit per unit and EBITDA margin improvement. For Q3 2017, we expect:
• | Retail unit sales of 11,500 - 13,000, an increase of 129% - 159% year-over-year |
• | Total revenue of $225 million - $255 million, an increase of 128% - 158% year-over-year |
• | Total gross profit per unit of $1,625 - $1,725 |
• | EBITDA margin of (14%) - (16%) |
We are reiterating our FY 2017 guidance as follows:
• | Retail unit sales of 44,000 - 46,000, an increase of 135% - 145% year-over-year |
• | Revenue of $850 million - $910 million, an increase of 133% - 149% year-over-year |
• | Total gross profit per unit of $1,475- $1,575 |
• | EBITDA margin of (14%) - (16%) |
• | 16 - 18 new market openings, bringing our end-of-year total to 37 - 39 |
For more information regarding the non-GAAP financial measures discussed in this letter, please see the reconciliations of our non-GAAP measurements to their most directly comparable GAAP-based financial measurements included at the end of this letter. Guidance for EBITDA margin excludes depreciation and amortization expense and interest expense. We have not reconciled EBITDA guidance to GAAP net loss as a result of the uncertainty regarding, and the potential variability of, interest expense. Accordingly, a reconciliation of the non-GAAP financial measure guidance to the corresponding GAAP measure is not available
1
without unreasonable effort. Depreciation and amortization expense, which is a component of the reconciliation between EBITDA and GAAP net loss, is expected to be between 1.0% and 1.5% of total revenues for both Q3 2017 and FY 2017.
Management Objectives
Our mission is to change the way people buy cars. Consistent with this mission, our management team continues to focus on three primary objectives to drive the long-term success of our business: (1) Grow Retail Units and Revenue; (2) Increase Total Gross Profit Per Unit; (3) Demonstrate Operating Leverage. We’re pleased to report meaningful achievements in each area during Q2.
For more information on our mission and objectives, please visit https://investors.carvana.com/events-and-presentations.
Objective #1: Grow Retail Units and Revenue
We believe retail units sold is the most important metric in our business. Q2 was another exceptional growth quarter, as retail units sold increased to 10,682, better than our guidance and up 145% from 4,355 in the prior year period. Revenue in Q2 grew to $209.4 million, better than our guidance and up 142% from $86.5 million in Q2 2016.

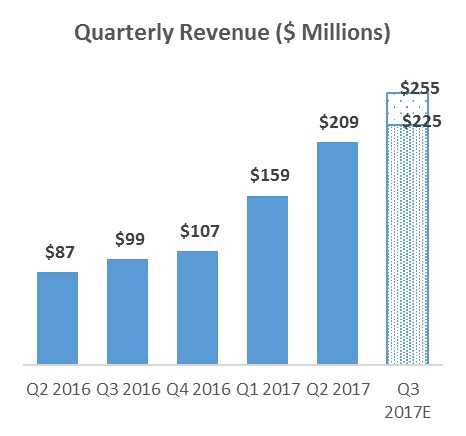
*Q3 2017E bars represent high and low end points of quarterly retail unit sales and quarterly total revenue guidance ranges.
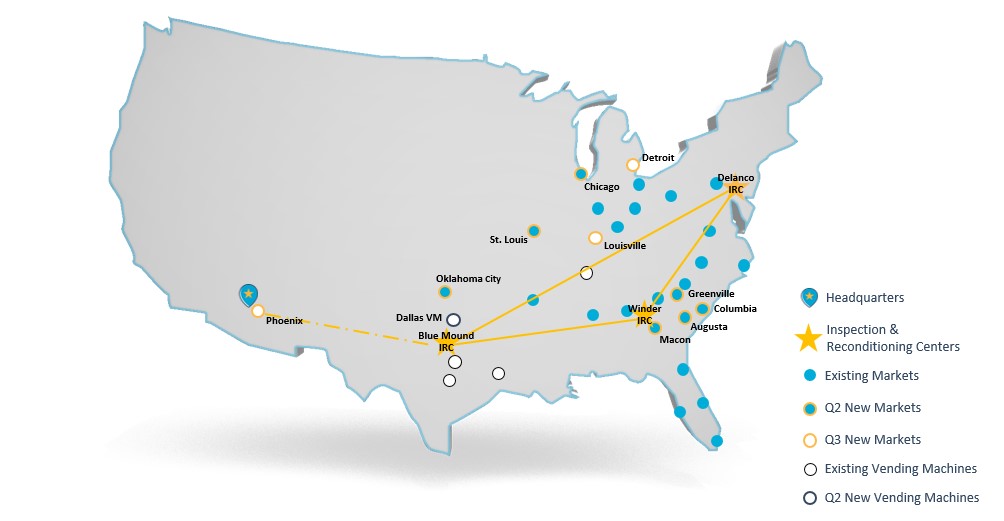
Markets
We launched a record 7 new markets in the second quarter - St. Louis, Chicago, Greenville, Columbia, Macon, Augusta, and Oklahoma City. This brought our total number of markets to 30 on June 30, 2017. This expansion increases the total percentage of the U.S. population our markets collectively serve to 27.1%, up from 19.7% at the end of 2016. Since June 30, we have opened an additional three markets: Louisville, Detroit, and Phoenix. Phoenix represents a meaningful geographic expansion of our logistics network and sets the stage for other markets in the Southwest and on the West Coast.
2
We believe the 7 market openings in Q2, including our largest market to date (Chicago), evidence our ability to quickly and efficiently enter new markets with a playbook that is replicable and capital-light. This playbook provides flexibility to opportunistically accelerate or decelerate our market expansion speed as we deem appropriate.
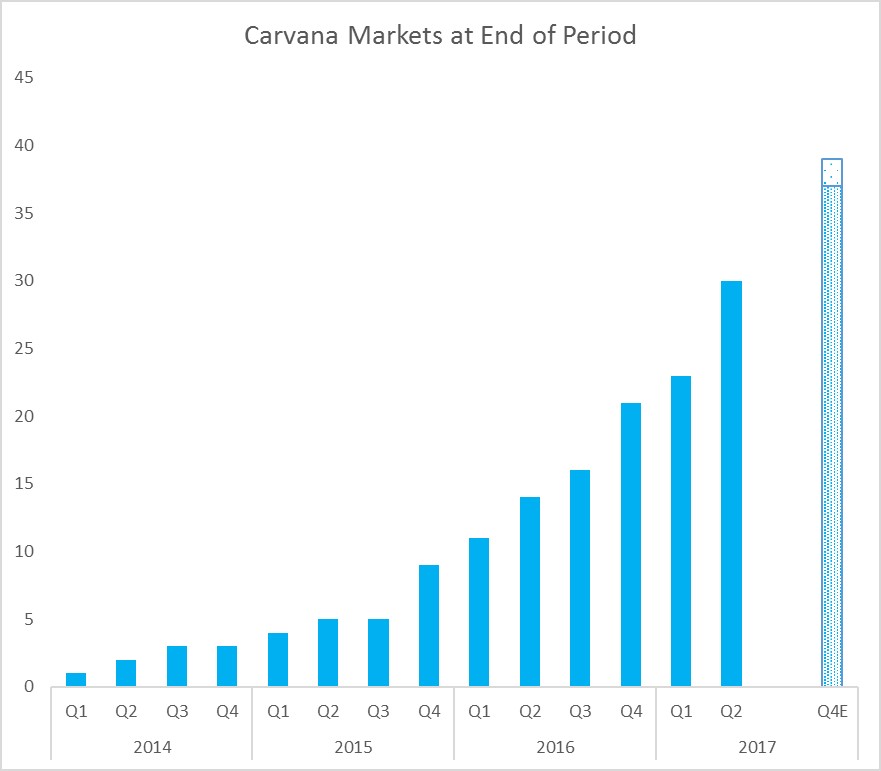
*Q4 2017E bar represents high and low end points of end-of-year total market guidance range.
Vending Machines
We build our proprietary car vending machines (“VMs”) in certain markets because they provide a unique and fun customer pickup experience that bolsters our brand and generates additional awareness. VMs also reduce variable fulfillment costs in their markets because last-mile delivery services are not required when customers choose to pick up their vehicle at a VM.
During Q2 we opened a VM in our Dallas, TX market, bringing our total number of VMs to five. Similar to our Nashville, Houston, Austin and San Antonio markets, our market penetration in Dallas has increased following the VM launch. This is further evidence that VMs provide a significant ROI as an incremental investment in a market.

3
In addition, in Q2 we completed a sale/leaseback transaction for our Austin VM with an institutional real estate investor. These transactions provide liquidity and enhance the VM ROI by lowering our cost of capital on the VM, and we plan to pursue similar opportunities for our other VM properties in the future.
Inspection and Reconditioning Centers
Construction on our fourth inspection and reconditioning center (“IRC”) location near Phoenix remains on schedule, and we expect to begin reconditioning vehicles there later this year. As previously mentioned, we intend to use this IRC to support expansion into the Southwest and West Coast.
Inventory Financing Upsize and Extension
To support our expected sales and inventory growth, we are excited to announce that on August 4, 2017 we increased our floorplan financing facility with Ally Bank from $200 million to $275 million, which will further increase to $350 million on January 1, 2018. In connection with this upsize, we have also extended the facility to December 31, 2018, providing us with greater financial flexibility.
Carlypso Acquisition
This quarter we continued to invest in technology to enable a seamless e-commerce experience in automotive retail. Notably, we purchased Carlypso, a Silicon Valley automotive disruptor founded by Christopher Coleman and Nicholas Hinrichsen, and integrated their team into our product department in Phoenix. Carlypso focused on ingesting, normalizing, and organizing data on vehicles that they could not physically inspect, and scaling that process to analyze over 200,000 cars each day. This included developing proprietary big data, analytics, and machine learning tools to dynamically filter, value and price cars nearly instantaneously without ever actually seeing them, tools that can integrate with and significantly augment similarly purposed proprietary technology Carvana has created. We believe acquiring Carlypso’s talent and technology will drive improvements in retail units sold and total gross profit per unit, which aligns well with our core management objectives.
4
Marketing
With the addition of 7 new markets in Q2, we increased our advertising spend on national ads, as we believe national advertising will allow us to more cost effectively drive brand awareness. While historically we relied on buying local television advertising in each of our markets, our growth is reaching an inflection point where national cable television advertising on certain channels costs less than purchasing local television in dozens of individual markets. As we operate in more markets, we expect the efficiency advantages of national advertising to become more pronounced, lowering our customer acquisition cost.

Screenshot from national cable ad
Objective #2: Increase Total Gross Profit Per Unit
Total gross profit per unit (“GPU”) in Q2 2017 grew to $1,501 per unit, an increase of $332 compared to the previous quarter. We expect to continue improving total GPU in Q3 as we steadily work toward our mid-term goal of $3,000.
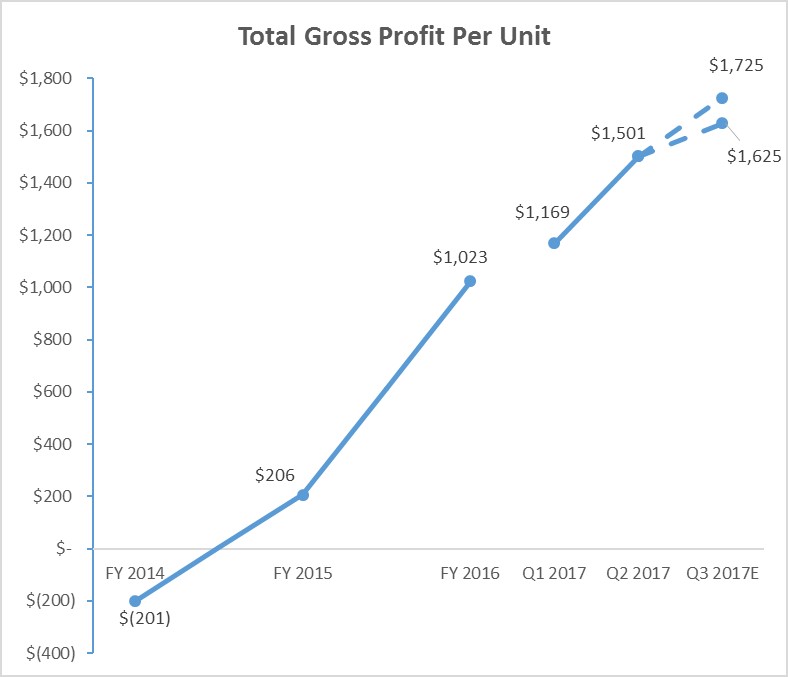
*Q3 2017E points represent high and low end of total GPU guidance range.
5
Our gains in total GPU came from all parts of the transaction. Used vehicle GPU increased to $765 in Q2 from $555 in Q1, wholesale gross profit divided by retail units sold increased to $25 in Q2 from $19 in Q1, and other GPU increased to $711 in Q2 from $596 in Q1. These increases reflect continued execution of our plan, including leveraging our infrastructure for cost efficiencies, optimizing purchasing and pricing, and increasing the profitability of ancillary products. Additionally, in June we began offering a new product, GAP waiver protection, to a small subset of customers and thus far have seen positive results.
We increased GPU despite an increase in average days to sale to 105 days in Q2 from 93 days in Q1. As we discussed on our Q1 conference call, an increase in average days to sale was expected in Q2 as we sold through vehicles we held prior to tax season. We expect average days to sale to decline in future quarters and are targeting average days to sale of approximately 80 in Q4 as we expand our number of markets and increase penetration in existing markets, while growing inventory at a slower rate than sales growth.
Our anticipated declines in average days to sale in the second half of the year are a result of our inventory strategy. New markets added in Q2 draw upon our existing inventory pool, highlighting a benefit of our e-commerce model. In the brick-and-mortar automotive retail model, launching a new market requires constructing a new dealership in that market and building a local inventory to fill the dealership lot. In the e-commerce model, launching a new market requires connecting the market to an existing inventory pool through a logistics network. This means new markets can be added without increasing inventory size. For example, sales increased from 5,600 in Q4 2016 to 10,682 in Q2 2017, an increase of 91%, while inventory available on our website stayed relatively flat. We expect inventory to remain relatively flat through Q3 and to increase beginning in Q4.
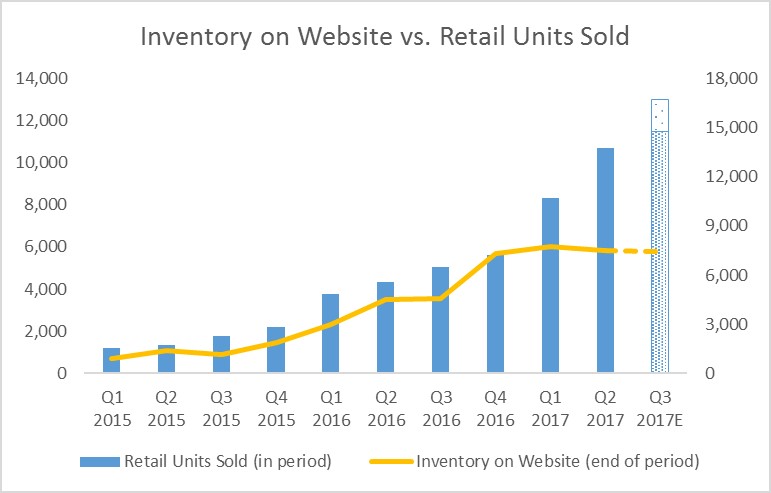
*Q3 2017E points represent high and low end of retail unit sales guidance range and estimated end of period website units available.
Objective #3: Demonstrate Operating Leverage
This quarter we again saw meaningful leverage as our business scaled.
• | Total SG&A as a percent of revenue fell to 24.8%, compared to 28.9% in Q1, a reduction of 14.2% quarter-over-quarter |
• | Advertising expense totaled 5.9% of revenue in Q2, a decline of 18.1% quarter-over-quarter |
• | Compensation and other overhead costs declined to 9.0% and 7.8% of revenue, respectively, a reduction of 11.8% and 13.3% from Q1 2017, respectively |
• | Logistics expense as a percent of revenue declined to 1.5% in Q2 2017 from 1.8% in Q1 2017, a decrease of 16.7% quarter-over-quarter |
• | Market occupancy expense as a percent of revenue increased to 0.7% in Q2 2017, compared to 0.6% in Q1 2017 |
Our net loss for the quarter was $38.9 million. GAAP basic and diluted net loss per Class A share was $0.28, based on 15.0 million shares of Class A common stock outstanding for purposes of computing net loss per share. Adjusted net loss per Class A share, a non-GAAP measure, was $0.28, based on 136.7 million adjusted shares of Class A common stock outstanding assuming the
6
exchange of all outstanding LLC Units for shares of Class A common stock. A reconciliation of adjusted net loss per share to its most directly comparable GAAP measure is provided in the appendix.
As previously mentioned, we consider EBITDA margin to be an important measure of the leverage in our business. EBITDA margin in the second quarter of 2017 was (16.1%), a sequential improvement of 25% from (21.6%). We believe this demonstrates clear progress on our path to profitability. A reconciliation of EBITDA, a non-GAAP measure, to net loss, its most directly comparable GAAP measure, is provided in the appendix.
Summary
We are executing on our vision of fundamentally changing the way people buy cars. Our strong second quarter results point to our ability to execute and capitalize on the large opportunity before us. We continue our nationwide expansion and are particularly excited about recent launches in Chicago (now our largest market) and Phoenix (which will open up the Southwest and Western United States). We look forward to seeing analysts and investors at upcoming financial conferences and our facility tours.
Sincerely,
Ernie Garcia, III, Chairman and CEO
Mark Jenkins, CFO
Appendix
Conference Call Details
Carvana will host a conference call today, Aug. 8, 2017, at 2 p.m. PDT (5 p.m. EDT) to discuss financial results. To participate in the live call, analysts and investors should dial (877) 270-2148 or (412) 902-6510. A live audio webcast of the conference call along with supplemental financial information will also be accessible on the company's website at investors.carvana.com. Following the webcast, an archived version will be available on the website for one year. A telephonic replay of the conference call will be available until Tuesday, Aug. 15, 2017, by dialing (877) 344-7529 or (412) 317-0088 and entering passcode 10109151#.
Forward Looking Statements
This letter contains forward-looking statements within the meaning of the Private Securities Litigation Reform Act of 1995. These forward-looking statements reflect Carvana’s current expectations and projections with respect to, among other things, its financial condition, results of operations, plans, objectives, future performance, and business. These statements may be preceded by, followed by or include the words "aim," "anticipate," "believe," "estimate," "expect," "forecast," "intend," "likely," "outlook," "plan," "potential," "project," "projection," "seek," "can," "could," "may," "should," "would," "will," the negatives thereof and other words and terms of similar meaning.
Forward-looking statements include all statements that are not historical facts. Such forward-looking statements are subject to various risks and uncertainties. Accordingly, there are or will be important factors that could cause actual outcomes or results to differ materially from those indicated in these statements. Among these factors are risks related to: (1) our history of losses and ability to maintain profitability in the future, (2) our ability to effectively manage our rapid growth, (3) our limited operating history, (4) the seasonal and other fluctuations in our quarterly operating results, (5) our relationship with DriveTime Automotive Group, Inc.,(6) our management’s accounting judgments and estimates, as well as changes to accounting policies, (7) our ability to compete in the highly competitive industry in which we participate, (8) the changes in prices of new and used vehicles, (9) our ability to acquire desirable inventory, (10) our ability to sell our inventory expeditiously, (11) our ability to sell and generate gains on the sale of automotive finance receivables, (12) our dependence on the sale of automotive finance receivables for a substantial portion of our gross profits, (13) our reliance on potentially fraudulent credit data for the automotive finance receivables we sell, (14) our ability to successfully market and brand our business; (15) our reliance on Internet searches to drive traffic to our website, (16) our ability to comply with the laws and regulations to which we are subject, (17) the changes in the laws and regulations to which we are subject, (18) our ability to comply with the Telephone Consumer Protection Act of 1991;(19) the evolution of regulation of the Internet and eCommerce, (20) our ability to maintain reputational integrity and enhance our brand, (21) our ability to grow complementary product and service offerings, (22) our ability to address the shift to mobile device technology by our customers, (23) risks related to the larger automotive ecosystem, (24) the geographic concentration where we provide services, (25) our ability to raise additional capital, (26) our ability to maintain adequate relationships with the third parties that finance our vehicle inventory purchases, (27) the representations we make in our finance receivables we sell, (28) our reliance on our proprietary credit scoring model in the forecasting of loss rates, (29) our reliance on internal and external logistics to transport our vehicle inventory, (30) the risks associated with the construction and operation of our inspection and reconditioning centers, fulfillment
7
centers and vending machines, including our dependence on one supplier for construction and maintenance for our vending machines, (31) our ability to protect the personal information and other data that we collect, process and store, (32) disruptions in availability and functionality of our website, (33) our ability to protect our intellectual property, technology and confidential information, (34) our ability to defend against claims that our employees, consultants or advisors have wrongfully used or disclosed trade secrets or intellectual property, (35) our ability to defend against intellectual property disputes, (36) our ability to comply with the terms of open source licenses, (37) conditions affecting automotive manufacturers, including manufacturer recalls, (38) our reliance on third party technology to complete critical business functions, (39) our dependence on key personnel to operate our business, (40) the costs associated with becoming a public company, (41) the diversion of management’s attention and other disruptions associated with potential future acquisitions, (42) the legal proceedings to which we may be subject in the ordinary course of business, (43) potential errors in our retail installment contracts with our customers that could render them unenforceable and (44) risks relating to our corporate structure and tax receivable agreements.
There is no assurance that any forward-looking statements will materialize. You are cautioned not to place undue reliance on forward-looking statements, which reflect expectations only as of this date. Carvana does not undertake any obligation to publicly update or review any forward-looking statement, whether as a result of new information, future developments, or otherwise.
Use of Non-GAAP Financial Measures
As appropriate, we supplement our results of operations determined in accordance with U.S. generally accepted accounting principles (“GAAP”) with certain non-GAAP financial measurements that are used by management, and which we believe are useful to investors, as supplemental operational measurements to evaluate our financial performance. These measurements should not be considered in isolation or as a substitute for reported GAAP results because they may include or exclude certain items as compared to similar GAAP-based measurements, and such measurements may not be comparable to similarly-titled measurements reported by other companies. Rather, these measurements should be considered as an additional way of viewing aspects of our operations that provide a more complete understanding of our business. We strongly encourage investors to review our consolidated financial statements included in publicly filed reports in their entirety and not rely solely on any one, single financial measurement or communication.
Reconciliations of our non-GAAP measurements to their most directly comparable GAAP-based financial measurements are included at the end of this letter.
8
CARVANA CO. AND SUBSIDIARIES
CONDENSED CONSOLIDATED BALANCE SHEETS
(Unaudited)
(In thousands)
June 30, 2017 | December 31, 2016 | ||||||
ASSETS | |||||||
Current assets: | |||||||
Cash and cash equivalents | $ | 144,433 | $ | 39,184 | |||
Restricted cash | 10,339 | 10,266 | |||||
Accounts receivable, net | 13,759 | 5,692 | |||||
Finance receivables held for sale, net | 24,049 | 24,771 | |||||
Vehicle inventory | 174,369 | 185,506 | |||||
Other current assets | 9,914 | 9,822 | |||||
Total current assets | 376,863 | 275,241 | |||||
Property and equipment, net | 106,127 | 60,592 | |||||
Other assets | 1,893 | — | |||||
Total assets | $ | 484,883 | $ | 335,833 | |||
LIABILITIES, TEMPORARY EQUITY & STOCKHOLDERS' EQUITY / MEMBERS’ DEFICIT | |||||||
Current liabilities: | |||||||
Accounts payable and accrued liabilities | $ | 32,955 | $ | 28,164 | |||
Accounts payable due to related party | 2,169 | 1,884 | |||||
Floor plan facility | 166,840 | 165,313 | |||||
Current portion of long-term debt | 1,873 | 1,057 | |||||
Total current liabilities | 203,837 | 196,418 | |||||
Long-term debt, excluding current portion | 10,279 | 4,404 | |||||
Other liabilities | 5,337 | — | |||||
Total liabilities | 219,453 | 200,822 | |||||
Commitments and contingencies | |||||||
Temporary equity - Class C redeemable preferred units - 0 and 43,089 units authorized and outstanding as of June 30, 2017 and December 31, 2016, respectively | — | 250,972 | |||||
Stockholders' equity / members' deficit: | |||||||
Members' deficit | — | (115,961 | ) | ||||
Preferred stock, $.01 par value - 50,000 shares authorized, none issued and outstanding as of June 30, 2017 | — | — | |||||
Class A common stock, $0.001 par value - 500,000 shares authorized, 15,523 shares issued and outstanding as of June 30, 2017 | 16 | — | |||||
Class B common stock, $0.001 par value - 125,000 shares authorized, 117,236 shares issued and outstanding as of June 30, 2017 | 117 | — | |||||
Additional paid in capital | 34,145 | — | |||||
Accumulated deficit | (3,039 | ) | — | ||||
Total stockholders' equity / members' deficit attributable to Carvana Co. | 31,239 | (115,961 | ) | ||||
Non-controlling interests | 234,191 | — | |||||
Total stockholders' equity / members’ deficit | 265,430 | (115,961 | ) | ||||
Total liabilities, temporary equity & stockholders' equity / members’ deficit | $ | 484,883 | $ | 335,833 | |||
9
CARVANA CO. AND SUBSIDIARIES
CONDENSED CONSOLIDATED STATEMENTS OF OPERATIONS
(Unaudited)
(In thousands, except per share amounts)
Three Months Ended June 30, | Six Months Ended June 30, | ||||||||||||||
2017 | 2016 | 2017 | 2016 | ||||||||||||
Sales and operating revenues: | |||||||||||||||
Used vehicle sales, net | $ | 193,947 | $ | 80,488 | $ | 342,329 | $ | 148,983 | |||||||
Wholesale vehicle sales(3) | 7,818 | 2,475 | 13,544 | 4,034 | |||||||||||
Other sales and revenues, including $1,898, $0, $3,656 and $0, respectively, from related parties | 7,600 | 3,563 | 12,565 | 6,460 | |||||||||||
Net sales and operating revenues | 209,365 | 86,526 | 368,438 | 159,477 | |||||||||||
Cost of sales | 193,326 | 80,489 | 342,653 | 149,483 | |||||||||||
Gross profit | 16,039 | 6,037 | 25,785 | 9,994 | |||||||||||
Selling, general and administrative expenses | 52,011 | 23,344 | 97,919 | 43,976 | |||||||||||
Interest expense, including $1,241, $0, $1,382 and $0, respectively, to related parties | 2,507 | 796 | 4,566 | 1,506 | |||||||||||
Other expense (income), net | 391 | 5 | 609 | (55 | ) | ||||||||||
Net loss before income taxes | (38,870 | ) | (18,108 | ) | (77,309 | ) | (35,433 | ) | |||||||
Income tax provision | — | — | — | — | |||||||||||
Net loss | (38,870 | ) | (18,108 | ) | (77,309 | ) | (35,433 | ) | |||||||
Less: net loss attributable to non-controlling interests | (24,328 | ) | — | (24,328 | ) | — | |||||||||
Net loss attributable to Carvana Co. | $ | (14,542 | ) | $ | (18,108 | ) | $ | (52,981 | ) | $ | (35,433 | ) | |||
Net loss per share of Class A common stock, basic and diluted(1) | $ | (0.28 | ) | $ | (0.13 | ) | $ | (0.56 | ) | $ | (0.26 | ) | |||
Weighted-average shares of Class A common stock, basic and diluted(1)(2) | 15,026 | 15,000 | 15,013 | 15,000 | |||||||||||
(1) Amounts for periods prior to the initial public offering have been retrospectively adjusted to give effect to 15.0 million shares of Class A common stock issued in the initial public offering and the Organizational Transactions.
(2) Weighted-average shares of Class A common stock outstanding have been adjusted for unvested restricted stock awards.
(3) Wholesale vehicle sales revenue generated from 1,580 and 2,868 wholesale units sold during the three and six months ended June 30, 2017, respectively, and 629 and 1,133 wholesale units sold during the three and six months ended June 30, 2016, respectively.
10
CARVANA CO. AND SUBSIDIARIES
CONDENSED CONSOLIDATED STATEMENT OF STOCKHOLDERS' EQUITY / MEMBERS' DEFICIT
(Unaudited)
(In thousands)
Class A | Class B | ||||||||||||||||||||||||||||||||
Members' Deficit | Shares | Amount | Shares | Amount | Additional Paid-in Capital | Accumulated Deficit | Non-controlling Interests | Total Stockholders' Equity | |||||||||||||||||||||||||
Balance, December 31, 2016 | $ | (115,961 | ) | — | $ | — | — | $ | — | $ | — | $ | — | $ | — | $ | — | ||||||||||||||||
Equity-based compensation expense prior to Organizational Transactions | 158 | — | — | — | — | — | — | — | — | ||||||||||||||||||||||||
Accrued return on Class C Redeemable Preferred Units prior to Organizational Transactions | (9,439 | ) | — | — | — | — | — | — | — | — | |||||||||||||||||||||||
Net loss prior to Organizational Transactions | (49,942 | ) | — | — | — | — | — | — | — | — | |||||||||||||||||||||||
Conversion of Class C Redeemable Preferred Units for Class A Units | 260,411 | — | — | — | — | — | — | — | — | ||||||||||||||||||||||||
Effect of Organizational Transactions | (85,227 | ) | — | — | 117,236 | 117 | (174,255 | ) | — | 259,365 | 85,227 | ||||||||||||||||||||||
Issuance of Class A common stock sold in initial public offering, net of underwriters' discounts and commissions and offering expenses | — | 15,000 | 15 | — | — | 205,910 | — | — | 205,925 | ||||||||||||||||||||||||
Net loss subsequent to Organizational Transactions | — | — | — | — | — | — | (3,039 | ) | (24,328 | ) | (27,367 | ) | |||||||||||||||||||||
Adjustments to the non-controlling interests | — | — | — | — | — | 846 | — | (846 | ) | — | |||||||||||||||||||||||
Issuance of restricted stock awards, net of forfeitures | — | 544 | 1 | — | — | (1 | ) | — | — | — | |||||||||||||||||||||||
Restricted stock surrendered in lieu of withholding taxes | — | (21 | ) | — | — | — | (299 | ) | — | — | (299 | ) | |||||||||||||||||||||
Equity-based compensation expense recognized subsequent to Organizational Transactions | — | — | — | — | — | 1,944 | — | — | 1,944 | ||||||||||||||||||||||||
Balance, June 30, 2017 | $ | — | 15,523 | $ | 16 | 117,236 | $ | 117 | $ | 34,145 | $ | (3,039 | ) | $ | 234,191 | $ | 265,430 | ||||||||||||||||
11
CARVANA CO. AND SUBSIDIARIES
CONDENSED CONSOLIDATED STATEMENTS OF CASH FLOWS
(Unaudited)
(In thousands)
Six Months Ended June 30, | |||||||
2017 | 2016 | ||||||
Cash Flows from Operating Activities: | |||||||
Net loss | $ | (77,309 | ) | $ | (35,433 | ) | |
Adjustments to reconcile net loss to net cash used in operating activities: | |||||||
Depreciation and amortization expense | 4,645 | 1,824 | |||||
Loss on disposal of property and equipment | 565 | — | |||||
Provision for bad debt and valuation allowance | 494 | 684 | |||||
Gain on loan sales | (8,390 | ) | (3,792 | ) | |||
Equity-based compensation expense | 2,102 | 283 | |||||
Amortization and write-off of debt issuance costs | 1,250 | — | |||||
Originations of finance receivables | (223,843 | ) | (100,955 | ) | |||
Proceeds from sale of finance receivables | 231,942 | 166,748 | |||||
Proceeds from sale of finance receivables to related party | — | 1,531 | |||||
Purchase of finance receivables from related party | — | (74,589 | ) | ||||
Changes in assets and liabilities: | |||||||
Accounts receivable | (8,293 | ) | (874 | ) | |||
Vehicle inventory | 11,668 | (48,601 | ) | ||||
Other current assets | (1,538 | ) | (1,425 | ) | |||
Other assets | (1,148 | ) | — | ||||
Accounts payable and accrued liabilities | 942 | 6,779 | |||||
Accounts payable to related party | 285 | (12,772 | ) | ||||
Other liabilities | 5,337 | — | |||||
Net cash used in operating activities | (61,291 | ) | (100,592 | ) | |||
Cash Flows from Investing Activities: | |||||||
Purchases of property and equipment | (42,576 | ) | (12,691 | ) | |||
Change in restricted cash | (73 | ) | (1,642 | ) | |||
Net cash used in investing activities | (42,649 | ) | (14,333 | ) | |||
Cash Flows from Financing Activities: | |||||||
Proceeds from floor plan facility | 397,082 | 161,241 | |||||
Payments on floor plan facility | (395,555 | ) | (129,048 | ) | |||
Proceeds from Verde Credit Facility | 35,000 | — | |||||
Payments on Verde Credit Facility | (35,000 | ) | — | ||||
Proceeds from long-term debt | 2,980 | — | |||||
Payments on long-term debt | (641 | ) | (47 | ) | |||
Payments of debt issuance costs, including $1,000 and $0 to related parties | (1,000 | ) | (228 | ) | |||
Proceeds from issuance of Class C redeemable preferred units | — | 100,000 | |||||
Class C redeemable preferred units issuance costs | — | (38 | ) | ||||
Net proceeds from initial public offering | 206,323 | — | |||||
Net cash provided by financing activities | 209,189 | 131,880 | |||||
Net increase in cash and cash equivalents | 105,249 | 16,955 | |||||
Cash and cash equivalents at beginning of period | 39,184 | 43,134 | |||||
Cash and cash equivalents at end of period | $ | 144,433 | $ | 60,089 | |||
Supplemental cash flow information: | |||||||
Cash payments for interest to third parties | $ | 3,839 | $ | 1,188 | |||
Cash payments for interest to related parties | $ | 382 | $ | 30 | |||
Non-cash investing and financing activities: | |||||||
Capital expenditures included in accounts payable and accrued liabilities | $ | 7,601 | $ | 1,089 | |||
Capital expenditures financed through long-term debt | $ | 4,522 | $ | 1,430 | |||
Tax withholdings related to equity awards included in accounts payable and accrued liabilities | $ | 299 | $ | — | |||
Accrual of return on Class C redeemable preferred units | $ | 9,439 | $ | 6,247 | |||
Class C subscription proceeds included in restricted cash and Class C subscription liability | $ | — | $ | 9,725 | |||
Conversion of Class C units to Class A units | $ | 260,411 | $ | — | |||
12
CARVANA CO. AND SUBSIDIARIES
COMPONENTS OF SG&A
(Unaudited)
(In thousands)
Three Months Ended | ||||||||
June 30, 2017 | March 31, 2017 | |||||||
Compensation and benefits (1) | $ | 18,789 | $ | 16,303 | ||||
Advertising expense | 12,385 | 11,439 | ||||||
Market occupancy costs (2) | 1,424 | 983 | ||||||
Logistics (3) | 3,116 | 2,808 | ||||||
Other overhead costs (4) | 16,297 | 14,375 | ||||||
Total | $ | 52,011 | $ | 45,908 | ||||
(1) Compensation and benefits includes all payroll and related costs, including benefits, payroll taxes, and unit-based compensation, except those related to reconditioning vehicles which are included in cost of sales. | ||||||||
(2) Market occupancy costs includes rent, utilities, security, repairs and maintenance, and depreciation of buildings and improvements, including vending machines and fulfillment centers, excluding the portion related to reconditioning vehicles which is included in cost of sales, and excluding the portion related to our corporate office which is included in other overhead costs. | ||||||||
(3) Logistics includes fuel, maintenance, and depreciation related to owning and operating our own transportation fleet, and third party transportation fees. | ||||||||
(4) Other overhead costs include all other overhead and depreciation expenses such as IT expenses, limited warranty, travel, insurance, bad debt, title and registration, and other administrative expenses. | ||||||||
13
CARVANA CO. AND SUBSIDIARIES
RECONCILIATION OF GAAP TO NON-GAAP FINANCIAL MEASURES
(Unaudited)
(In thousands, except per share amounts)
Adjusted Net Loss and Adjusted Net Loss per Share
Adjusted net loss and adjusted net loss per share are supplemental measures of operating performance that do not represent and should not be considered alternatives to net loss and net loss per share, as determined under GAAP. We believe that adjusted net loss and adjusted net loss per share supplement GAAP measures and enable us to more effectively evaluate our performance period-over-period and relative to our competitors. A reconciliation of adjusted net loss to net loss attributable to Carvana Co., the most directly comparable GAAP measure, and the computation of adjusted net loss per share are as follows:
Three Months Ended June 30, 2017 | ||||||
Numerator: | ||||||
Net loss attributable to Carvana Co. | $ | (14,542 | ) | |||
Add: Net loss attributable to non-controlling interests (1) | (24,328 | ) | ||||
Adjusted net loss attributable to Carvana Co. | $ | (38,870 | ) | |||
Denominator: | ||||||
Weighted-average shares of Class A common stock outstanding | 15,026 | |||||
Adjustments:(2) | ||||||
Assumed exchange of LLC Units for shares of Class A common stock (1) | 121,666 | |||||
Adjusted shares of Class A common stock outstanding | 136,692 | |||||
Adjusted net loss per share | $ | (0.28 | ) | |||
(1) Assumes exchange of all outstanding LLC Units for shares of Class A common stock retroactively applied as if the exchanges had occurred at the beginning of each period presented under the terms of the exchange agreement.
(2) Excludes approximately 0.5 million restricted stock awards and 0.5 million stock options outstanding at June 30, 2017, because they were determined to be anti-dilutive.
EBITDA and EBITDA Margin
EBITDA and EBITDA Margin are non-GAAP supplemental measures of operating performance that do not represent and should not be considered an alternative to net loss or cash flow from operations, as determined by GAAP. EBITDA is defined as net loss before interest expense, income tax expense and depreciation and amortization expense. EBITDA Margin is EBITDA as a percentage of total revenues. We use EBITDA to measure the operating performance of our business, excluding specifically identified items that we do not believe directly reflect our core operations and may not be indicative of our recurring operations. We use EBITDA Margin to measure our operating performance relative to our total revenues. EBITDA and EBITDA Margin may not be comparable to similarly titled measures provided by other companies due to potential differences in methods of calculations. A reconciliation of EBITDA to net loss, the most directly comparable GAAP measure, and calculation of EBITDA Margin is as follows:
Three Months Ended | Year Ended December 31, | |||||||||||||||||||||||
June 30, 2017 | March 31, 2017 | June 30, 2016 | 2016 | 2015 | 2014 | |||||||||||||||||||
Net loss | $ | (38,870 | ) | $ | (38,439 | ) | $ | (18,108 | ) | $ | (93,112 | ) | $ | (36,780 | ) | $ | (15,238 | ) | ||||||
Depreciation and amortization expense | 2,584 | 2,061 | 958 | 4,658 | 2,800 | 1,706 | ||||||||||||||||||
Interest expense | 2,507 | 2,059 | 796 | 3,587 | 1,412 | 108 | ||||||||||||||||||
EBITDA | $ | (33,779 | ) | $ | (34,319 | ) | $ | (16,354 | ) | $ | (84,867 | ) | $ | (32,568 | ) | $ | (13,424 | ) | ||||||
Total revenues | $ | 209,365 | $ | 159,073 | $ | 86,526 | $ | 365,148 | $ | 130,392 | $ | 41,679 | ||||||||||||
EBITDA Margin | (16.1 | )% | (21.6 | )% | (18.9 | )% | (23.2 | )% | (25.0 | )% | (32.2 | )% | ||||||||||||
14