Attached files
| file | filename |
|---|---|
| EX-99.1 - EXHIBIT 99.1 - Atkore Inc. | atkr3q17exhibit991.htm |
| 8-K - 8-K - Atkore Inc. | atkrq3178k.htm |

PRINTING INSTRUCTIONS
CHECK TOC BEFORE PRINTING
Color/grayscale: Color (regardless of printing in b/w)
Scale to fit paper: OFF
Print hidden slides: OFF
POWERPOINT OPTIONS > ADVANCED > PRINT
Print in background: OFF
Third Quarter 2017 Earnings Presentation
August 8, 2017

1
Cautionary statements
This presentation contains forward-looking statements that are subject to known and unknown risks and uncertainties, many of which are beyond our control. All statements other than statements of historical
fact included in this presentation are forward-looking statements. Forward-looking statements appearing throughout this presentation include, without limitation, statements regarding our intentions, beliefs,
assumptions or current expectations concerning, among other things, financial position; results of operations; cash flows; prospects; growth strategies or expectations; customer retention; the outcome (by
judgment or settlement) and costs of legal, administrative or regulatory proceedings, investigations or inspections, including, without limitation, collective, representative or any other litigation; and the impact of
prevailing economic conditions. You can identify forward-looking statements by the fact that they do not relate strictly to historical or current facts. These statements may include words such as “believes,”
“expects,” “may,” “will,” “shall,” “should,” “would,” “could,” “seeks,” “aims,” “projects,” “is optimistic,” “intends,” “plans,” “estimates,” “anticipates” and other comparable terms. We caution you that forward-looking
statements are not guarantees of future performance or outcomes and that actual performance and outcomes, including, without limitation, our actual results of operations, financial condition and liquidity, and
the development of the market in which we operate, may differ materially from those made in or suggested by the forward-looking statements contained in this presentation. In addition, even if our results of
operations, financial condition and cash flows, and the development of the market in which we operate, are consistent with the forward-looking statements contained in this presentation, those results or
developments may not be indicative of results or developments in subsequent periods. A number of important factors, including, without limitation, the risks and uncertainties discussed under the captions “Risk
Factors” and Management’s Discussion and Analysis of Financial Condition and Results of Operations” in the Quarterly Report on Form 10-Q for the fiscal quarter ended June 30, 2017, filed with the U.S.
Securities and Exchange Commission on August 8, 2017 (File No. 001-37793), could cause actual results and outcomes to differ materially from those reflected in the forward-looking statements. Because of
these risks, we caution that you should not place undue reliance on any of our forward-looking statements. New risks and uncertainties arise from time to time, and it is impossible for us to predict those events
or how they may affect us. Further, any forward-looking statement speaks only as of the date on which it is made. We undertake no obligation to revise the forward-looking statements in this presentation after
the date of this presentation.
Market data and industry information used throughout this presentation are based on management’s knowledge of the industry and the good faith estimates of management. We also relied, to the extent
available, upon management’s review of independent industry surveys, forecasts and publications and other publicly available information prepared by a number of third party sources. All of the market data
and industry information used in this presentation involves a number of assumptions and limitations which we believe to be reasonable, and you are cautioned not to give undue weight to such estimates.
Although we believe that these sources are reliable, we cannot guarantee the accuracy or completeness of this information, and we have not independently verified this information. While we believe the
estimated market position, market opportunity and market size information included in this presentation are generally reliable, such information, which is derived in part from management’s estimates and
beliefs, is inherently uncertain and imprecise. Projections, assumptions and estimates of our future performance and the future performance of the industry in which we operate are subject to a high degree of
uncertainty and risk due to a variety of factors, including those described above. These and other factors could cause results to differ materially from those expressed in our estimates and beliefs and in the
estimates prepared by independent parties.
We present Adjusted EBITDA, Adjusted EBITDA margin, Adjusted net income, Adjusted earnings per share, Net debt (total debt less cash and cash equivalents), and Leverage ratio (net debt or total debt less
cash and cash equivalents, over Adjusted EBITDA on trailing twelve month basis) to help us describe our operating and financial performance. Adjusted EBITDA, Adjusted EBITDA margin, Adjusted net
income, Adjusted earnings per share, and Leverage ratio are non-GAAP financial measures commonly used in our industry and have certain limitations and should not be construed as alternatives to net
income, net sales and other income data measures (as determined in accordance with generally accepted accounting principles in the United States, or GAAP), or as better indicators of operating performance.
Adjusted EBITDA, Adjusted EBITDA margin, Adjusted net income, Adjusted earnings per share, Net debt (total debt less cash and cash equivalents), and Leverage ratio (net debt or total debt less cash and
cash equivalents over Adjusted EBITDA on a trailing twelve month basis), as defined by us may not be comparable to similar non-GAAP measures presented by other issuers. Our presentation of such
measures should not be construed as an inference that our future results will be unaffected by unusual or non-recurring items. See the appendix to this presentation for a reconciliation of Adjusted EBITDA to
net income, Adjusted net income to adjusted net income per share, and net debt over Adjusted EBITDA on a trailing twelve month basis.
Fiscal Periods - The Company has a fiscal year that ends on September 30th. It is the Company's practice to establish quarterly closings using a 4-5-4 calendar. The Company's fiscal quarters end on the last
Friday in December, March and June.

2
Financial Highlights – Q3 2017
($’s in millions)
Q3
2017
Q3
2016
Y/Y
Change
Net Sales $397.7 $395.7 0.5%
Net Income $27.5 $20.6 33.0%
Adjusted EBITDA(1) $62.0 $67.2 (7.7%)
Net Income Margin 6.9% 5.2% +170 bps
Adjusted EBITDA
Margin(1)
15.6% 17.0% (140 bps)
Net Income per
Share
$0.41 $0.33 24.2%
Adjusted Net Income
per Share(1)
$0.44 $0.43 2.3%
Market remained consistent with prior quarters;
Forward indicators point to improvement over
medium term
Passing through YTD commodity inflation to
market; Q3 pricing environment was more
challenging in some products
Adjusted EBITDA margin decline due to;
• Dollar for dollar pass through of raw
material inflation (100 bps)
• Net price/mix vs cost, productivity, and
cost management (40 bps)
Closed two M&A transactions in quarter
(1) See non-GAAP reconciliation in appendix
Q3 Performance in line with
our guidance

3
U.S. Construction Market
F2017EAverage20102007
Prior peak Trough 45-year average Today
US Nonresidential building construction starts (millions of square feet )
1,666
1,275
1,031
Historical US single-family and multi-family housing starts (thousands of dwellings)
2005 2009 F2017EAverage
Prior peak Trough 45-year average Today
2,068
554
1,450
1,240
679
Source: Dodge Data & Analytics
F2016
Prior
Year
1,047
F2016
Prior
Year
1,220
-(2%)
+2%
Key markets that drive Atkore volume
• 60% US Nonresidential Construction
• 10% US Residential Construction
• 16% Original Equipment Manufacturers
• 8% International Nonresidential
Construction
• 6% Other
Atkore volumes are driven by Nonresidential
construction starts in square feet vs. dollars
May Dodge Data & Analytics forecast for
nonresidential construction points to
contraction in 2017 and growth in 2018
(Influences 60% of Net Sales)
(Influences 10% of Net Sales)
Actual and Projected Business
Volumes linked to Market Activity

4
Electrical Raceway Segment – Q3 Highlights
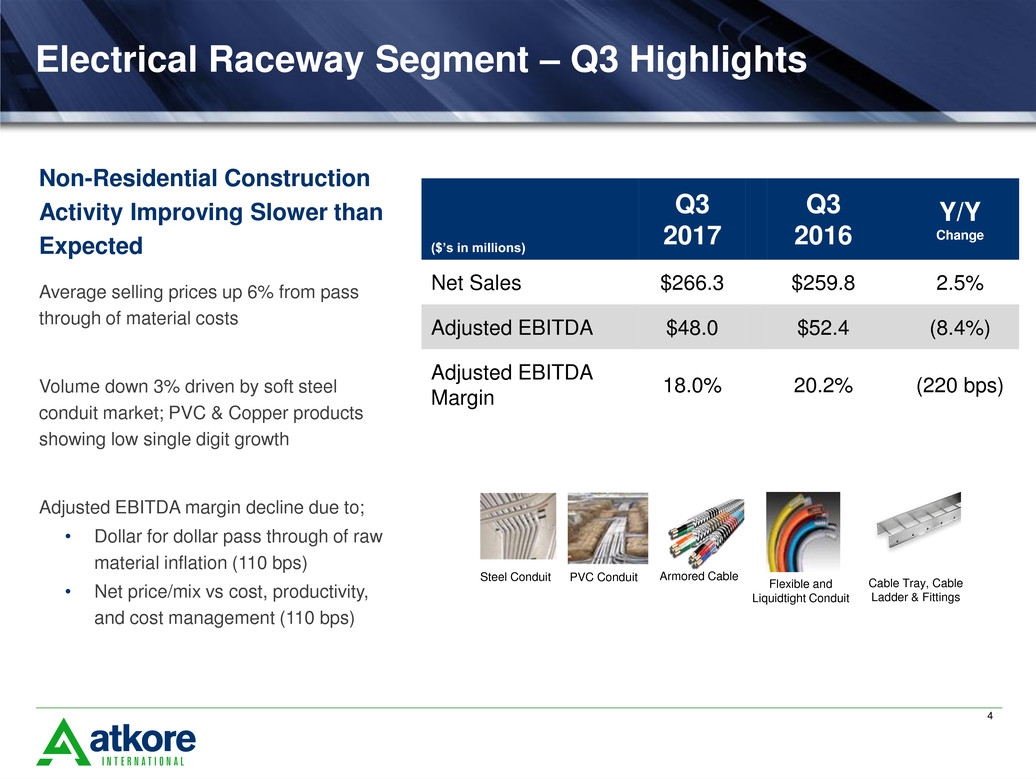
Average selling prices up 6% from pass
through of material costs
Volume down 3% driven by soft steel
conduit market; PVC & Copper products
showing low single digit growth
Adjusted EBITDA margin decline due to;
• Dollar for dollar pass through of raw
material inflation (110 bps)
• Net price/mix vs cost, productivity,
and cost management (110 bps)
Steel Conduit
PVC Conduit
Armored Cable
Flexible and
Liquidtight Conduit
Cable Tray, Cable
Ladder & Fittings
($’s in millions)
Q3
2017
Q3
2016
Y/Y
Change
Net Sales $266.3 $259.8 2.5%
Adjusted EBITDA $48.0 $52.4 (8.4%)
Adjusted EBITDA
Margin
18.0% 20.2% (220 bps)
Non-Residential Construction
Activity Improving Slower than
Expected

5
Mechanical Products & Solutions Segment Highlights
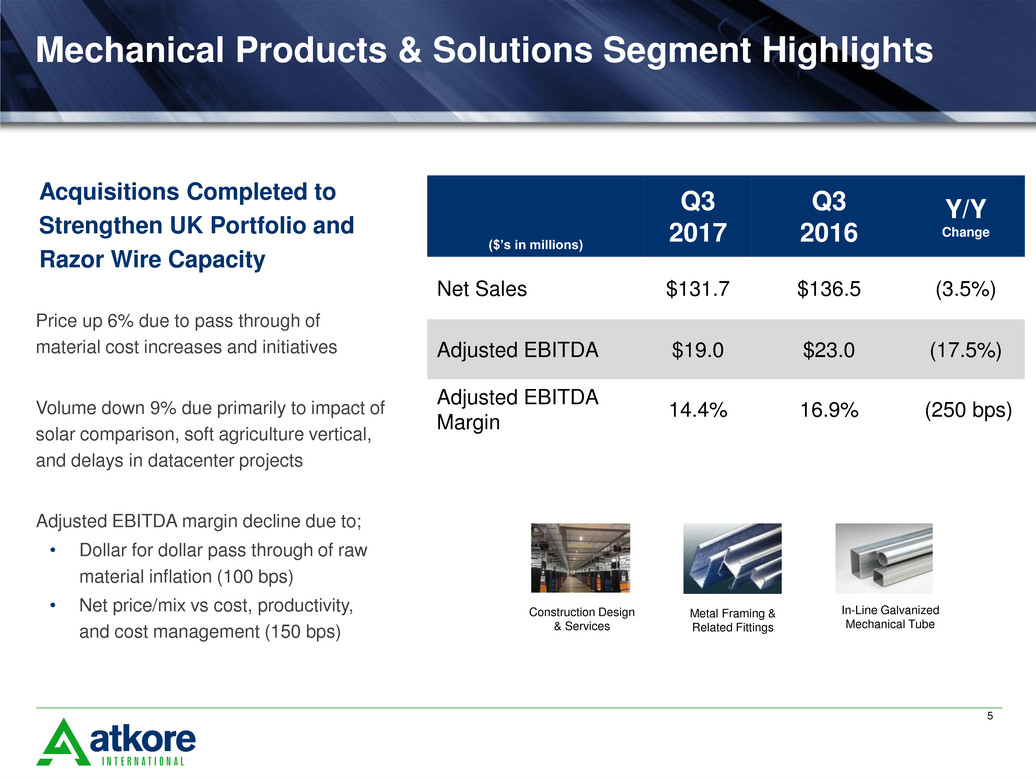
Price up 6% due to pass through of
material cost increases and initiatives
Volume down 9% due primarily to impact of
solar comparison, soft agriculture vertical,
and delays in datacenter projects
Adjusted EBITDA margin decline due to;
• Dollar for dollar pass through of raw
material inflation (100 bps)
• Net price/mix vs cost, productivity,
and cost management (150 bps)
($’s in millions)
Q3
2017
Q3
2016
Y/Y
Change
Net Sales $131.7 $136.5 (3.5%)
Adjusted EBITDA $19.0 $23.0 (17.5%)
Adjusted EBITDA
Margin
14.4% 16.9% (250 bps)
Metal Framing &
Related Fittings
In-Line Galvanized
Mechanical Tube
Construction Design
& Services
Acquisitions Completed to
Strengthen UK Portfolio and
Razor Wire Capacity

6
Key Balance Sheet and Cash Flow Metrics
($mm)
6/30/2017
Cash and cash equivalents $96.2
Total Debt $492.1
CapEx $15.3
Net cash from operating activities $65.8
TTM Adjusted EBITDA(1) $229.4
Leverage Ratio (1)
Total debt / TTM Adjusted EBITDA(1)
2.1x
Net debt / TTM Adjusted EBITDA(1) 1.7x
Metrics Leverage Ratio(1)
1. Leverage ratio is defined as net debt (total debt less cash and cash equivalents) divided by Adjusted EBITDA on a trailing twelve month (TTM)
basis or June 25 ,2016 to June 30, 2017. Total debt was $692.9mm, $652.2mm, and $630.3mm, as of September 26, 2014, September 25,
2015, and September 30, 2016, respectively. Cash and cash equivalents were $33.4mm, $80.6mm, and $200.3mm as of September 26, 2014,
September 25, 2015, and September 30, 2016, respectively. Leverage ratio for all periods above and TTM Adjusted EBITDA for the TTM ended
June 30, 2017 is reconciled in the appendix.
5.2x
3.5x
1.8x 1.7x
FY 2014 FY 2015 FY 2016 TTM 6/30/17
Strong Cash Flow and Leverage Ratio
Support M&A Strategy

7
2017 Financial Outlook Summary
Electrical Raceway
Segment
Consolidated Atkore
Mechanical Products &
Solutions Segment
Prior Outlook Updated Outlook
Volume (2) to 2% ~(4)%
Adjusted EBITDA* $182 - $190mm $177 - $182mm
Volume (4) to 0% ~(9)%
Adjusted EBITDA* $80 - $85mm $70 - $76mm
Adjusted EBITDA* $235 - $245mm $220 - $228mm
Adjusted EPS* $1.55 - $1.65 $1.37 - $1.45
Capital Expenditures $25 - $28mm ~$25mm
Interest Expense $27mm $27mm
Tax Rate 33% 33%
Diluted Shares**
67 67
* Reconciliation of the forward-looking full-year 2017 outlook for Adjusted EBITDA and Adjusted EPS is not being provided as the Company does not currently have
sufficient data to accurately estimate the variables and individual adjustments for such reconciliation.
** Represents weighted-average shares outstanding in millions used in calculation of Adjusted EPS guidance.
2017 Adjusted EBITDA is impacted year over year by 1 less working week vs. 2016 (~$5mm)
and high 2016 solar comparison (~$13mm)

8
Key Takeaways
• Current market not improving as fast as expected, macro drivers suggest low single
digit growth in 2018
• M&A funnel and activity is gaining momentum
• Focus on the Atkore Business System and self-help/productivity initiatives will continue
to favorably impact results
• The Atkore team continues to outperform market inputs; Our ability to generate
productivity savings, improve margins through innovation, and pass through material
cost increases is driving long-term growth and earnings expansion
Q3 Performance in line with our guidance

Appendix

10
Segment Information
A
B
C
D
E
F
G
H
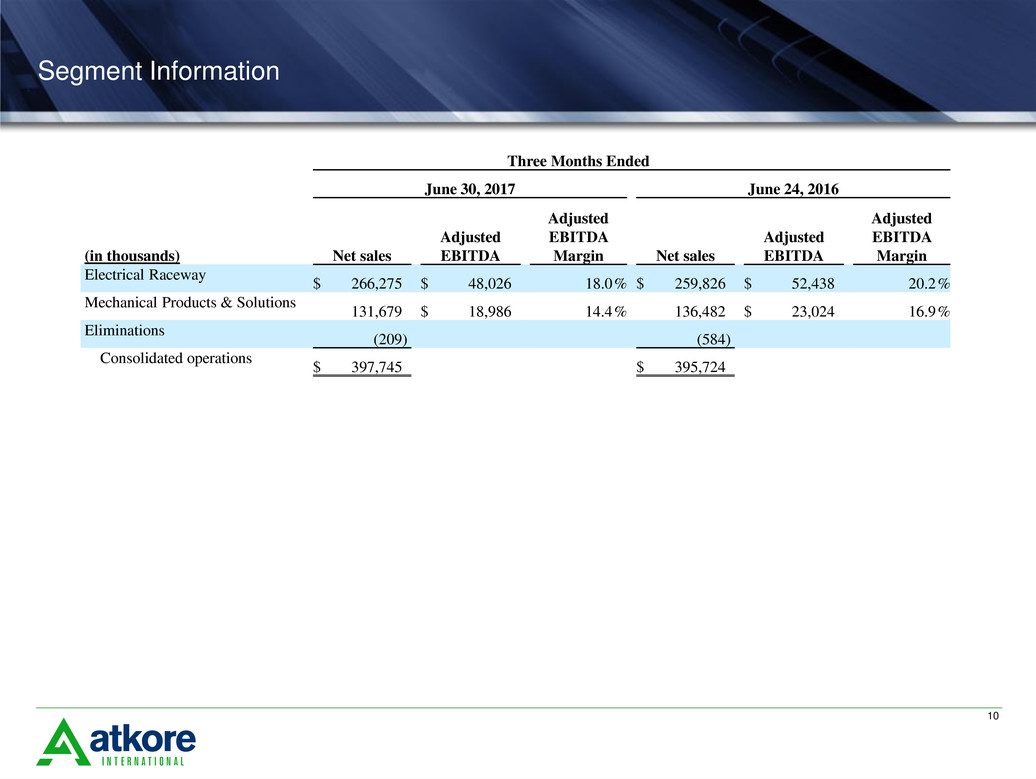
Three Months Ended
June 30, 2017 June 24, 2016
(in thousands) Net sales
Adjusted
EBITDA
Adjusted
EBITDA
Margin Net sales
Adjusted
EBITDA
Adjusted
EBITDA
Margin
Electrical Raceway
$ 266,275
$ 48,026
18.0 % $ 259,826
$ 52,438
20.2 %
Mechanical Products & Solutions
131,679
$ 18,986
14.4 % 136,482
$ 23,024
16.9 %
Eliminations
(209 ) (584 )
Consolidated operations
$ 397,745
$ 395,724

11
Adjusted earnings per share reconciliation
A
B
C
D
E
F
G
H
Consolidated Atkore International Group Inc.
Three Months Ended Nine months ended
(in thousands, except per share data) June 30, 2017 June 24, 2016(b) June 30, 2017 June 24, 2016 (b)
Net income $ 27,465 $ 20,645 $ 63,782 $ 43,224
Stock-based compensation 3,064 4,854 9,368 16,897
Consulting fee — 13,675 — 15,425
Loss (gain) on extinguishment of debt — — 9,805 (1,661 )
Gain on sale of joint venture — — (5,774 ) —
Impact of Fence and Sprinkler exit — — — 811
Legal matters — 1,300 7,501 1,300
Other (a) 177 (10,055 ) (10,306 ) (5,842 )
Pre-tax adjustments to net income 3,241 9,774 10,594 26,930
Tax effect (1,160 ) (3,284 ) (3,188 ) (9,426 )
Adjusted net income $ 29,546 $ 27,135 $ 71,188 $ 60,728
Weighted-Average Common Shares
Outstanding
Basic 63,817 62,492 63,239 62,491
Diluted 66,939 62,492 66,613 62,491
Net income per share
Basic $ 0.43 $ 0.33 $ 1.01 $ 0.69
Diluted $ 0.41 $ 0.33 $ 0.96 $ 0.69
Adjusted Net income per share
Basic $ 0.46 $ 0.43 $ 1.13 $ 0.97
Diluted $ 0.44 $ 0.43 $ 1.07 $ 0.97
(a) Represents other items, such as lower-of-cost-or-market inventory adjustments, realized or unrealized gain (loss) on foreign
currency transactions and release of certain indemnified uncertain tax positions.
(b) Prior year amounts have been revised for consistency to reflect the Company's election to treat all unusual legal matters and
gains/losses on extinguishment of debt as an add-back to both Adjusted EBITDA and Adjusted Net Income.

12
Net Income to Adjusted EBITDA reconciliation
A
B
C
D
E
F
G
H
Consolidated Atkore International Group Inc.
Three Months Ended Nine months ended
(in thousands) June 30, 2017 June 24, 2016 June 30, 2017 June 24, 2016
Net income $ 27,465 $ 20,645 $ 63,782 $ 43,224
Interest expense, net 5,811 10,169 20,872 30,617
Income tax expense 11,431 10,749 29,313 24,093
Depreciation and amortization 13,341 13,322 40,242 40,064
Loss (gain) on extinguishment of debt — — 9,805 (1,661 )
Restructuring & impairments (101 ) 326 700 2,395
Net periodic pension benefit cost — 110 — 330
Stock-based compensation 3,064 4,854 9,368 16,897
ABF product liability impact — 212 — 637
Consulting fee — 13,675 — 15,425
Legal matters — 1,300 7,501 1,300
Transaction costs 845 1,917 2,543 5,348
Gain on sale of joint venture — — (5,774 ) —
Other (a) 177 (10,055 ) (10,306 ) (5,842 )
Impact of Fence and Sprinkler exit — — — 811
Adjusted EBITDA $ 62,033 $ 67,224 $ 168,046 $ 173,638
(a) Represents other items, such as lower-of-cost-or-market inventory adjustments, realized or unrealized gain (loss) on foreign currency transactions
and release of certain indemnified uncertain tax positions.

13
Net debt / Adjusted EBITDA reconciliation
A
B
C
D
E
F
G
H
Consolidated Atkore International Group Inc.
($ in thousands) June 30, 2017
September 30,
2016
September 25,
2015
September 26,
2014
Short-term debt and current maturities of
long-term debt $ 4,215
$ 1,267
$ 2,864
$ 42,887
Long-term debt 487,921
629,046
649,344
649,980
Total debt 492,136
630,313
652,208
692,867
Less cash and cash equivalents 96,200
200,279
80,598
33,360
Net debt $ 395,936
$ 430,034
$ 571,610
$ 659,507
TTM Adjusted EBITDA $ 229,410
$ 235,002
$ 163,949
$ 126,597
Total debt/TTM Adjusted EBITDA 2.1
x 2.7
x 4.0
x 5.5
x
Net debt/TTM Adjusted EBITDA 1.7
x 1.8
x 3.5
x 5.2
x

14
Net Income to Adjusted EBITDA reconciliation
A
B
C
D
E
F
G
H
Consolidated Atkore International Group Inc.
TTM Three Months Ended
(in thousands) June 30, 2017 June 30, 2017 March 31, 2017
December 30,
2016
September 30,
2016
Net income $ 79,354
$ 27,465
$ 18,935
$ 17,382
$ 15,572
Interest expense, net 32,053
5,811
5,231
9,830
11,181
Income tax expense 33,205
11,431
12,375
5,507
3,892
Depreciation and amortization 55,195
13,341
13,273
13,628
14,953
Loss (gain) on extinguishment of debt 9,805
—
—
9,805
—
Restructuring & impairments 2,401
(101 ) 412
389
1,701
Net periodic pension benefit cost 110
—
—
—
110
Stock-based compensation 13,598
3,064
3,584
2,720
4,230
ABF product liability impact 212
—
—
—
212
Consulting fee —
—
—
—
—
Legal matters 7,583
—
7,501
—
82
Transaction costs 5,027
845
138
1,560
2,484
Gain on sale of joint venture (5,774 ) —
(5,774 ) —
—
Other (3,359 ) 177
447
(10,930 ) 6,947
Adjusted EBITDA $ 229,410
$ 62,033
$ 56,122
$ 49,891
$ 61,364
