Attached files
| file | filename |
|---|---|
| 8-K - FORM 8-K - PEABODY ENERGY CORP | d405550d8k.htm |
Exhibit 99.1

Investor Presentation
August 2017
Statement on Forward-Looking Information
Certain statements included in this presentation are forward-looking as defined in the Private Securities Litigation Reform Act of 1995. The Company uses words such as
“anticipate,” “believe,” “expect,” “may,” “forecast,” “project,” “should,” “estimate,” “plan,” “outlook,” “target,” “likely,”
“will,” “to be” or other similar words to identify forward-looking statements. These forward-looking statements are made as of the date the presentation was issued and are based on numerous assumptions that the Company believes
are reasonable, but these assumptions are open to a wide range of uncertainties and business risks that may cause actual results to differ materially from expectations. These factors are difficult to accurately predict and may be beyond the
Company’s control. Such factors include, but are not limited to those described in the Company’s Annual Report on Form 10-K for the year ended December 31, 2016 filed with the SEC on
March 22, 2017, in Exhibit 99.2 to the Company’s Current Report on Form 8-K filed with the SEC on April 11, 2017, and in the Company’s Annual Report on Form
10-K/A (Amendment No.1) for the year ended December 31, 2016 filed with the SEC on July 10, 2017, as well as other filings the Company may make from time to time with the SEC. Factors that could
affect the Company’s results or an investment in its securities include but are not limited to: competition in the energy market and supply and demand for the Company’s products, including the impact of alternative energy sources, such as
natural gas and renewables; global steel demand and its downstream impact on metallurgical coal prices, and lower demand for the Company’s products by electric power generators; customer procurement practices and contract duration; the impact
of weather and natural disasters on demand, production and transportation; reductions and/or deferrals of purchases by major customers and the Company’s ability to renew sales contracts; credit and performance risks associated with customers,
suppliers, contract miners, co-shippers, and trading, bank and other financial counterparties; geologic, equipment, permitting, site access, operational risks and new technologies related to mining;
transportation availability, performance and costs; availability, timing of delivery and costs of key supplies, capital equipment or commodities such as diesel fuel, steel, explosives and tires; impact of take-or-pay arrangements for rail and port commitments for the delivery of coal; successful implementation of business strategies, including, without limitation, the actions we are implementing to improve the
Company’s organization and respond to current conditions; negotiation of labor contracts, employee relations and workforce availability, including, without limitation, attracting and retaining key personnel; changes in post-retirement benefit
and pension obligations and their related funding requirements; replacement and development of coal reserves; uncertainties in estimating the Company’s coal reserves; effects of changes in interest rates and currency exchange rates (primarily
the Australian dollar); the Company’s ability to successfully consummate acquisitions or divestitures, and the resulting effects thereof; economic strength and political stability of countries in which we have operations or serve customers;
legislation, regulations and court decisions or other government actions, including, but not limited to, new environmental and mine safety requirements, changes in income tax regulations, sales-related royalties, or other regulatory taxes and
changes in derivative laws and regulations; the Company’s ability to obtain and renew permits necessary for the Company’s operations; the Company’s ability to appropriately secure the Company’s requirements for reclamation,
federal and state workers’ compensation, federal coal leases and other obligations related to the Company’s operations, including the Company’s ability to utilize self-bonding and/or successfully access the commercial surety bond
market; litigation or other dispute resolution, including, but not limited to, claims not yet asserted; terrorist attacks or security threats, including, but not limited to, cybersecurity breaches; impacts of pandemic illnesses; any lack of an
established market for certain of the Company’s securities, including the Company’s preferred stock, and potential dilution of the Company’s common stock; price volatility in the Company’s securities; short-sales in the
Company’s securities; any conflicts of interest between the Company’s significant shareholders and other holders of the Company’s capital stock; the Company’s ability to generate sufficient cash to service all of the
Company’s indebtedness; the Company’s debt instruments and capital structure placing certain limits on the Company’s ability to pay dividends and repurchase capital stock; the Company’s ability to comply with financial and other
restrictive covenants in various agreements, including the Company’s debt instruments; and other risks detailed in the Company’s reports filed with the SEC. The Company does not undertake to update its forward-looking statements except as
required by law.
Adjusted EBITDA is a non-GAAP measure defined as income (loss) from continuing operations before deducting
net interest expense, income taxes, asset retirement obligation expenses, depreciation, depletion and amortization and reorganization items, net. Adjusted EBITDA is also adjusted for the discrete items that management excluded in analyzing each of
the segment’s operating performance as displayed in the reconciliation. Adjusted EBITDA is used by management as one of the primary metrics to measure the Company’s operating performance. Management also believes non-GAAP performance measures are used by investors to measure the Company’s operating performance and lenders to measure the Company’s ability to incur and service debt. Adjusted EBITDA is not intended to
serve as an alternative to U.S. GAAP measures of performance and may not be comparable to similarly-titled measures presented by other companies.
2
Peabody: Substantial Business, Simple Thesis
Our Advantage…
We’re the only global pure-play coal investment, and we have
significant scale… high quality assets and people…. And diversity in geography and products
Our Approach…
We’re focused on generating cash, reducing debt, investing wisely and returning cash to shareholders
3
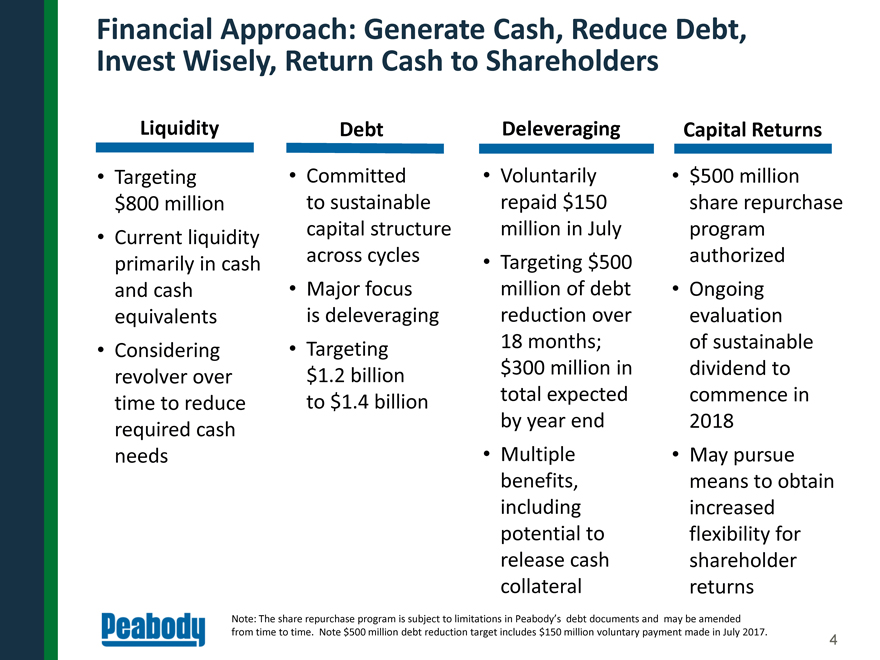
Financial Approach: Generate Cash, Reduce Debt, Invest Wisely, Return Cash to Shareholders
Liquidity • Targeting $800 million • Current liquidity primarily in cash and cash equivalents • Considering revolver over time to reduce required cash needs
Debt • Committed to sustainable capital structure across cycles • Major focus is deleveraging • Targeting
$1.2 billion to $1.4 billion
Deleveraging • Voluntarily repaid $150 million in July • Targeting $500 million of debt reduction over
18 months; $300 million in total expected by
year end • Multiple benefits, including potential to release cash collateral Capital Returns • $500 million share repurchase program authorized • Ongoing evaluation of sustainable dividend to commence in 2018
• May pursue means to obtain increased flexibility for shareholder returns Note: The share repurchase program is subject to limitations in Peabody’s debt documents and
may be amended from time to time. Note $500 million debt reduction target includes $150 million voluntary payment made in July 2017.
4
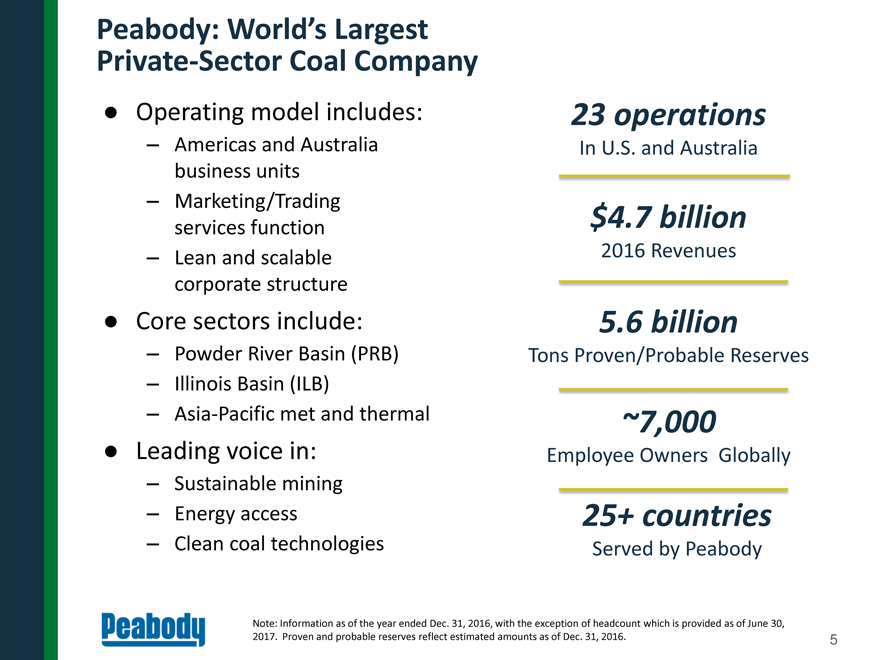
Peabody: World’s Largest Private-Sector Coal Company • Operating model includes: – Americas and
Australia business units – Marketing/Trading services function – Lean and scalable corporate structure • Core sectors include: – Powder River Basin (PRB)
– Illinois Basin (ILB) – Asia-Pacific met and thermal • Leading voice in: – Sustainable mining – Energy access – Clean coal technologies 23 operations
In U.S. and Australia $4.7 billion 2016 Revenues 5.6 billion Tons Proven/Probable Reserves ~7,000
Employee Owners Globally 25+ countries Served by
Peabody Note: Information as of the year ended Dec. 31, 2016, with the exception of headcount which is provided as of June 30, 2017. Proven and probable reserves reflect estimated amounts as of Dec. 31, 2016.
5
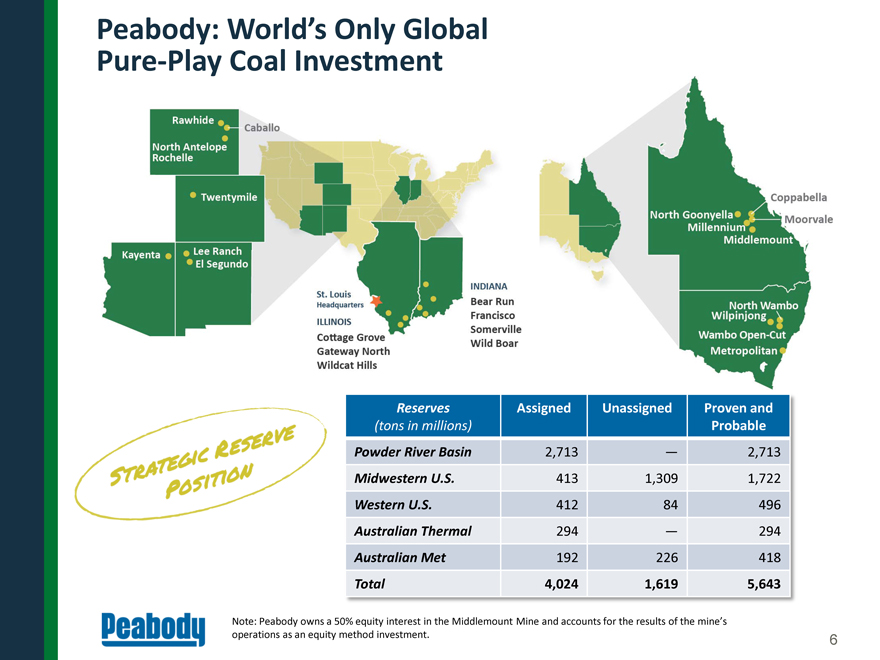
Peabody: World’s Only Global Pure-Play Coal Investment Rawhide Caballo North Amtelope Rochelle twentymile
kayenta Lee Ranch El Segundo St. Louis Headquaters ILLINOIS Cottage Grove Gateway North Wildcat Hills INDIANA Bear Run Francisco Somerville Wild Boar North goonyella Millennium Coppabella Moorvale Middlemount North Wambo wilpinjong Wambo Open-Cut Metropolitan Reserves Assigned Unassigned Proven and (tons in millions) Probable Powder River Basin 2,713 —2,713
Midwestern U.S. 413 1,3091,722 Western U.S. 412 84496 Australian Thermal 294 —294 Australian Met 192 226418 Total 4,024 1,619 5,643 STRATEGIC RESERVE POSITION
Note: Peabody owns a 50% equity interest in the Middlemount Mine and accounts for the results of the mine’s operations as an equity method investment.
6
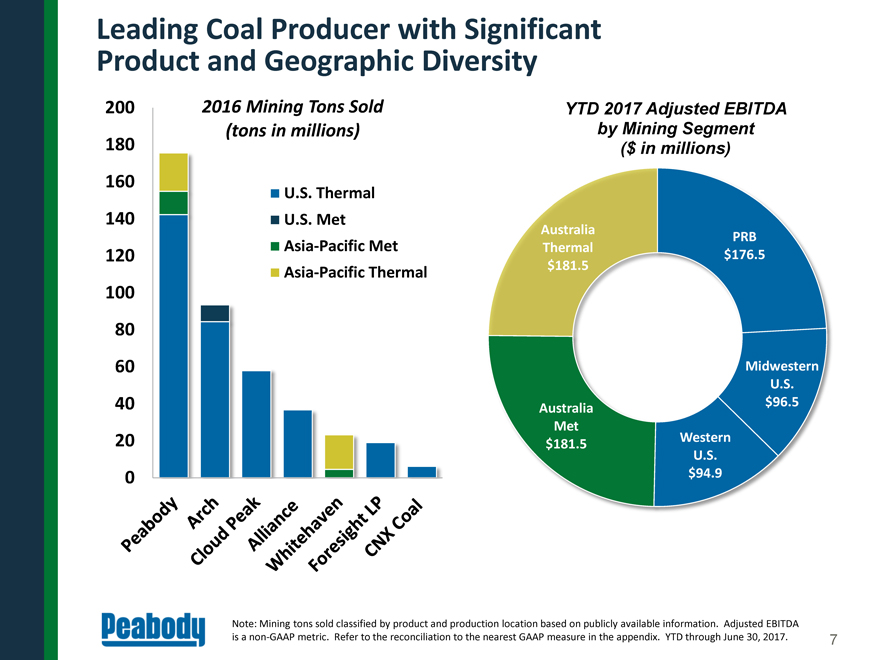
Leading Coal Producer with Significant Product and Geographic Diversity 200 180 160 140 120 100 80 60 40 20 0
2016 Mining Tons Sold (tons in millions) U.S. Thermal U.S. Met Asia-Pacific Met Asia-Pacific Thermal Peabody Arch Cloud Peak Alliance Whitehaven Foresight LP CNX Coal YTD 2017 Adjusted EBITDA by Mining Segment ($ in millions) Australia PRB Thermal
$176.5 $181.5 Midwestern U.S. Australia $96.5 Met $181.5 Western U.S. $94.9 Note: Mining tons sold classified by product and production location based on publicly available information. Adjusted EBITDA is a
non-GAAP metric. Refer to the reconciliation to the nearest GAAP measure in the appendix. YTD through June 30, 2017.
7
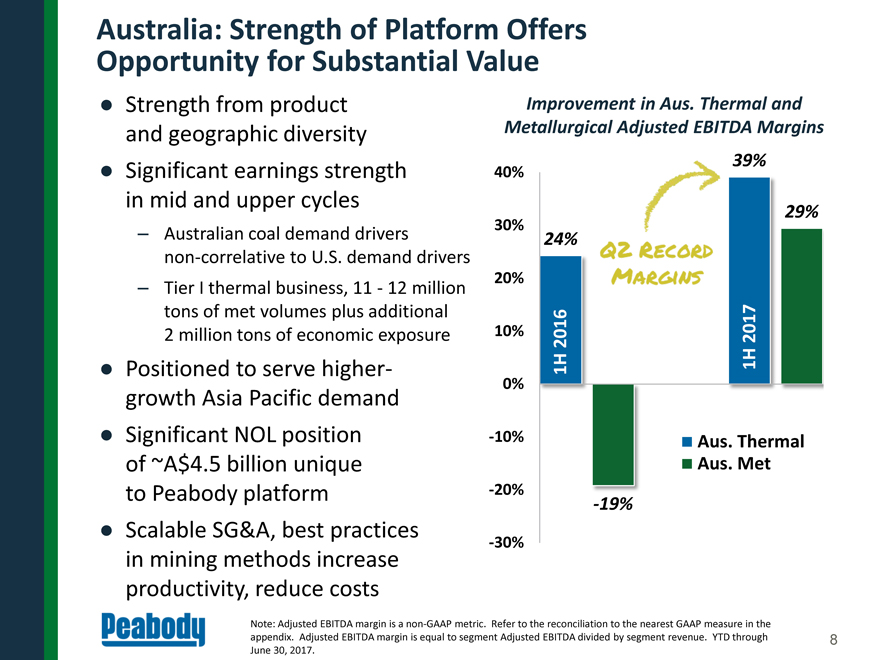
Australia: Strength of Platform Offers Opportunity for Substantial Value • Strength from product and
geographic diversity
• Significant earnings strength in mid and upper cycles – Australian coal demand drivers
non-correlative to U.S. demand drivers
– Tier I thermal business, 11 - 12 million tons of met volumes plus
additional 2 million tons of economic exposure • Positioned to serve higher- growth Asia Pacific demand • Significant NOL position of ~A$4.5 billion unique to Peabody platform • Scalable SG&A, best practices in mining
methods increase productivity, reduce costs Note: Adjusted EBITDA margin is a non-GAAP metric. Refer to the reconciliation to the nearest GAAP measure in the appendix. Adjusted EBITDA margin is equal to
segment Adjusted EBITDA divided by segment revenue. YTD through June 30, 2017. Improvement in Aus. Thermal and Metallurgical Adjusted EBITDA Margins 40% 30% 20% 10% 0% -10%
-20% -30% 1H 2016 24% -19% Aus. Thermal Aus. Met 1H 2017 39% 29%
QZ RECORD MARGINS
8
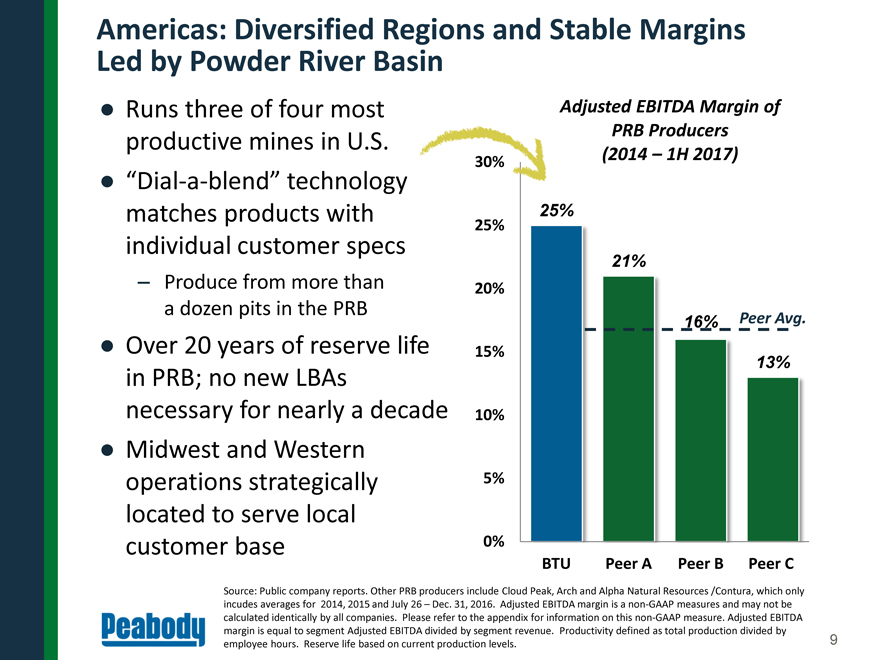
Americas: Diversified Regions and Stable Margins Led by Powder River Basin Runs three of four most productive
mines in U.S. “Dial-a-blend” technology matches products with individual customer specs – Produce from more than a dozen pits in the PRB
Over 20 years of reserve life in PRB; no new LBAs necessary for nearly a decade Midwest and Western operations strategically located to serve local customer base 30% 25% 20% 15%
10% 5% 0% 25% 21% 16% Peer Avg. 13% BTU Peer A Peer B Peer C Adjusted EBITDA Margin of PRB Producers (2014 – 1H 2017) Source: Public company reports. Other PRB producers include Cloud Peak, Arch and Alpha Natural Resources /Contura, which only
incudes averages for 2014, 2015 and July 26 – Dec. 31, 2016. Adjusted EBITDA margin is a non-GAAP measures and may not be calculated identically by all companies. Please refer to the appendix for
information on this non-GAAP measure. Adjusted EBITDA margin is equal to segment Adjusted EBITDA divided by segment revenue. Productivity defined as total production divided by employee hours. Reserve life
based on current production levels.
9
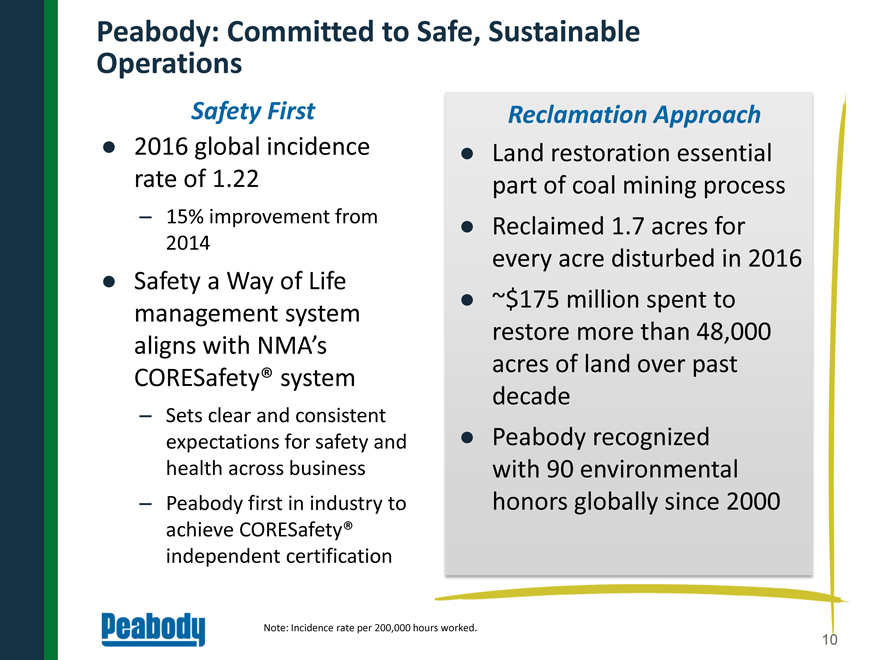
Peabody: Committed to Safe, Sustainable Operations Safety First 2016 global incidence rate of 1.22 – 15%
improvement from 2014
Safety a Way of Life management system aligns with NMA’s CORESafety® system – Sets clear and consistent expectations for safety
and health across business – Peabody first in industry to achieve CORESafety® independent certification Reclamation Approach Land restoration essential part of coal mining process Reclaimed 1.7 acres for every acre disturbed in 2016
~$175 million spent to restore more than 48,000 acres of land over past decade Peabody recognized with 90 environmental honors globally since 2000 Note:
Incidence rate per 200,000 hours worked.
10
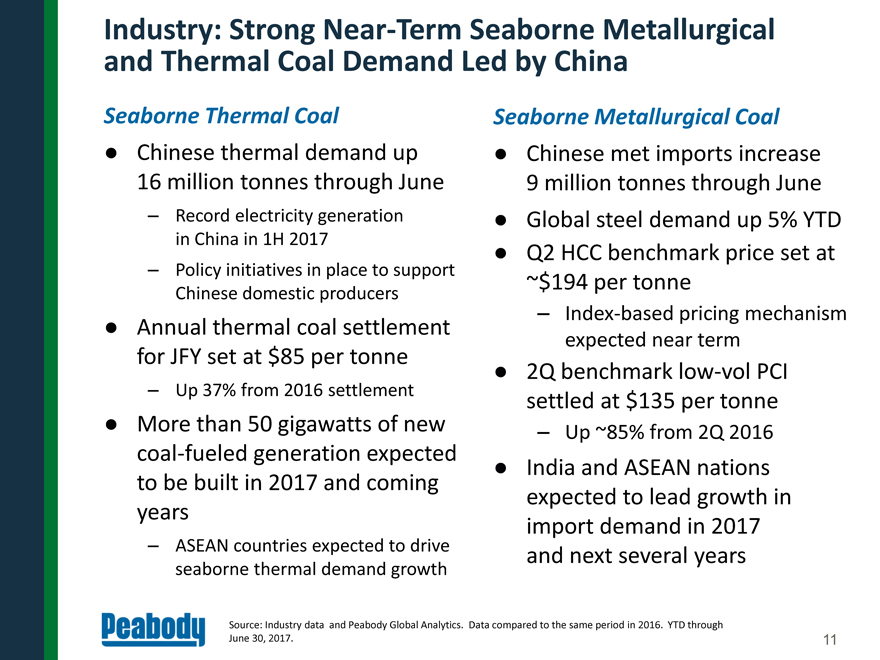
Industry: Strong Near-Term Seaborne Metallurgical and Thermal Coal Demand Led by China Seaborne Thermal Coal
• Chinese thermal demand up 16 million tonnes through June – Record electricity generation in China in 1H 2017 – Policy initiatives in place to support Chinese domestic producers • Annual thermal coal settlement for JFY set
at $85 per tonne – Up 37% from 2016 settlement
• More than 50 gigawatts of new coal-fueled generation expected to be built in 2017 and coming years
Seaborne Metallurgical Coal
• Chinese met imports increase 9 million tonnes through June • Global steel demand up 5% YTD • Q2 HCC benchmark
price set at
~$194 per tonne – Index-based pricing mechanism expected near term • 2Q benchmark low-vol PCI
settled at $135 per tonne
– Up ~85% from 2Q 2016 • India and ASEAN nations expected to lead growth in import demand in 2017 and next several years
ASEAN countries expected to drive seaborne thermal demand growth Source: Industry data and Peabody Global Analytics. Data compared to the same period in 2016. YTD
through June 30, 2017.
11
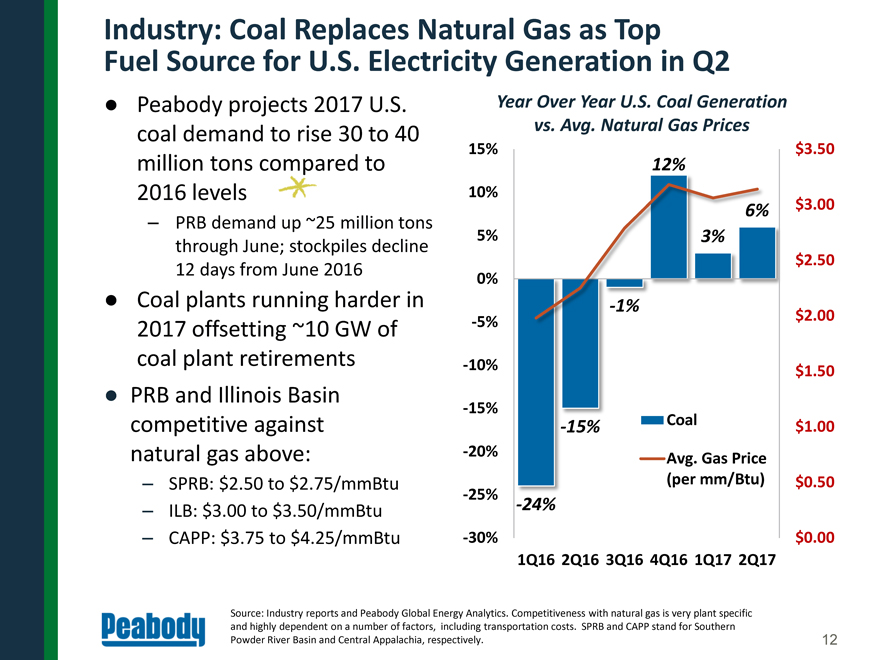
Industry: Coal Replaces Natural Gas as Top Fuel Source for U.S. Electricity Generation in Q2 Peabody projects
2017 U.S. coal demand to rise 30 to 40 million tons compared to 2016 levels – PRB demand up ~25 million tons through June; stockpiles decline 12 days from June 2016 Coal plants running harder in 2017 offsetting ~10 GW of coal plant
retirements PRB and Illinois Basin competitive against natural gas above: – SPRB: $2.50 to $2.75/mmBtu – ILB: $3.00 to $3.50/mmBtu – CAPP: $3.75 to $4.25/mmBtu
Year Over Year U.S. Coal Generation vs. Avg. Natural Gas Prices 15% 10% 5% 0% -5% -10% -15% -20% -25% -30% $3.50
$3.00 $2.50 $2.00 $1.50 $1.00 $0.50 $0.00 1Q16 2Q16 3Q16 4Q16 1Q17 2Q17 12% 6% 3% -1% -15% Coal Avg. Gas Price (per mm/Btu) -24% Source: Industry reports and Peabody Global Energy
Analytics. Competitiveness with natural gas is very plant specific and highly dependent on a number of factors, including transportation costs. SPRB and CAPP stand for Southern Powder River Basin and Central Appalachia, respectively.
12
Actions on Policy Front Favorable to Coal Mining and Use •
Pro-growth, tax and regulatory initiatives at macro level • Administration steps to review/reverse onerous regulations: – Repeal of “Stream Protection Rule” – Office of Natural
Resources Revenue proposes to rescind Coal Valuation Rule – EPA files notice of intent to review and rescind “Waters of the U.S.” act – Review of Clean Power Plan and favorable D.C. circuit ruling – Issuance of Energy
Independence executive order – DOI issues secretarial order ending coal leasing moratorium – DOE orders study on threats to reliable baseload power due to premature retirement of coal plants
• For Peabody, advancing high-efficiency low emissions (HELE) generation and carbon capture projects remains a priority in any political environment
13
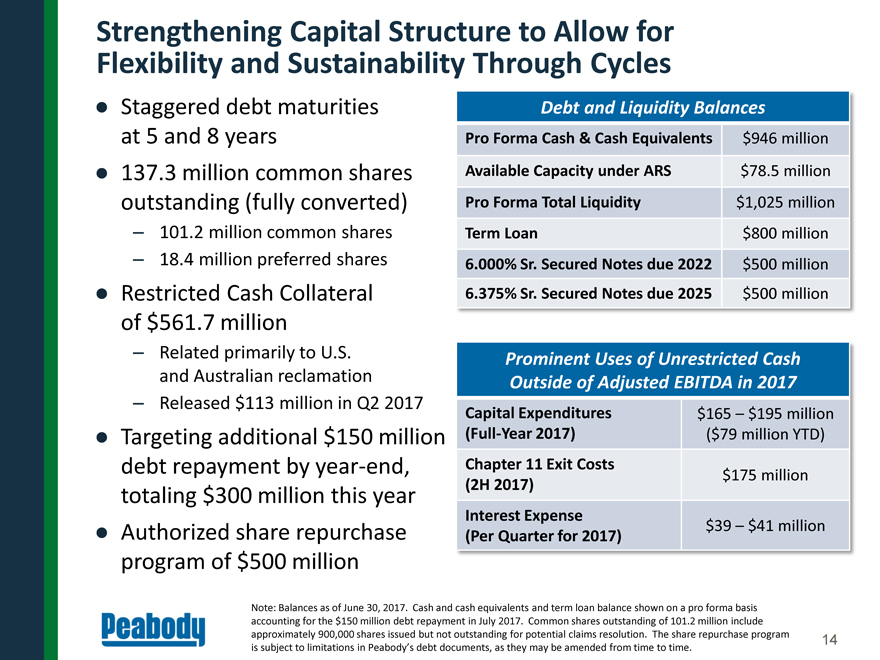
Strengthening Capital Structure to Allow for Flexibility and Sustainability Through Cycles Staggered debt
maturities at 5 and 8 years 137.3 million common shares outstanding (fully converted) – 101.2 million common shares – 18.4 million preferred shares Restricted Cash Collateral of $561.7 million – Related primarily
to U.S. and Australian reclamation – Released $113 million in Q2 2017
Targeting additional $150 million debt repayment by year-end, totaling $300 million this year Authorized share repurchase program of $500 million Debt and Liquidity Balances Pro Forma Cash & Cash Equivalents $946 million Available Capacity
under ARS $78.5 million Pro Forma Total Liquidity $1,025 million Term Loan $800million 6.000% Sr. Secured Notes due 2022 $500million
6.375% Sr. Secured
Notes due 2025 $500million Prominent Uses of Unrestricted Cash Outside of Adjusted EBITDA in 2017
Capital Expenditures $165 – $195 million (Full-Year
2017) ($79 million YTD) Chapter 11 Exit Costs (2H 2017) $175 million
Interest Expense (Per Quarter for 2017) $39 – $41 million Note: Balances
as of June 30, 2017. Cash and cash equivalents and term loan balance shown on a pro forma basis accounting for the $150 million debt repayment in July 2017. Common shares outstanding of 101.2 million include approximately 900,000
shares issued but not outstanding for potential claims resolution. The share repurchase program is subject to limitations in Peabody’s debt documents, as they may be amended from time to time.
14
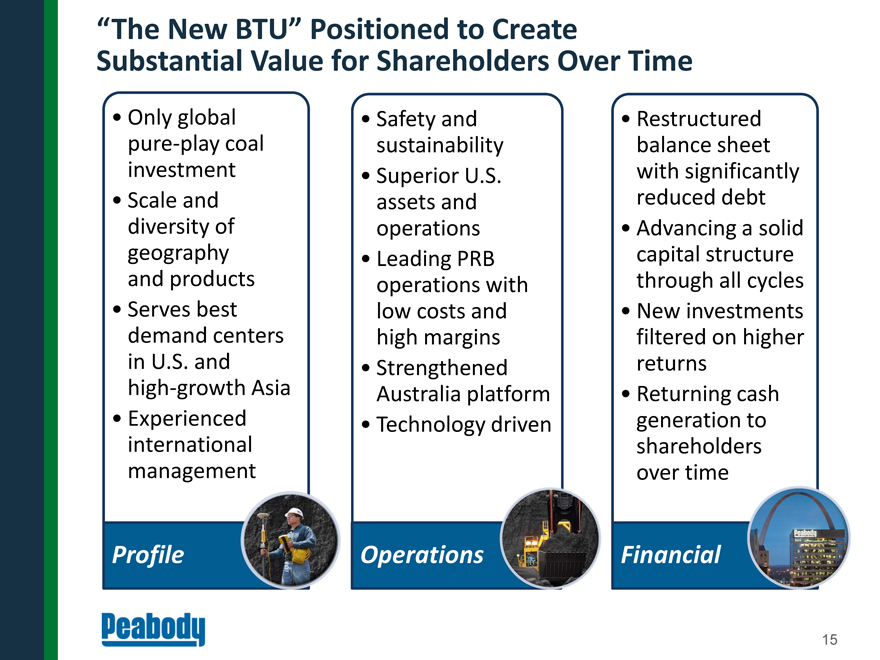
“The New BTU” Positioned to Create Substantial Value for Shareholders Over Time • Only global
pure-play coal investment
• Scale and diversity of geography and products • Serves best demand centers in U.S. and high-growth Asia • Experienced
international management Profile • Safety and sustainability • Superior U.S. assets and operations • Leading PRB operations with low costs and high margins • Strengthened Australia platform • Technology driven Operations
• Restructured balance sheet with significantly reduced debt • Advancing a solid capital structure through all cycles • New investments filtered on higher returns
• Returning cash generation to shareholders over time Financial
15
APPENDIX
16
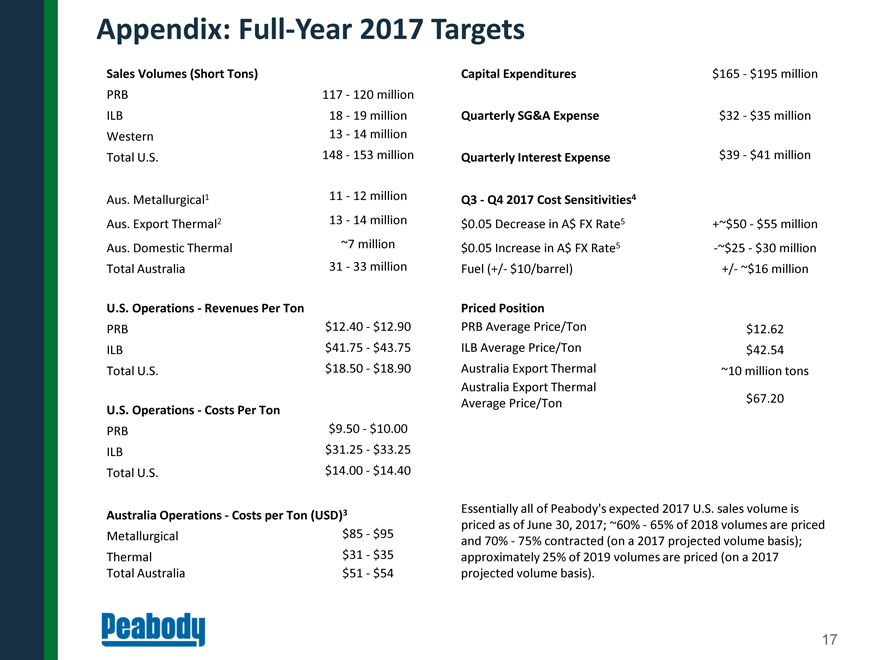
Appendix: Full-Year 2017 Targets Sales Volumes (Short Tons) PRB 117 - 120 million ILB 18 - 19 million
Western 13 - 14 million
Total U.S. 148 - 153 million Aus. Metallurgical1 11 - 12 million Aus. Export Thermal2 13 - 14 million Aus. Domestic
Thermal ~7 million Total Australia 31 - 33 million U.S. Operations - Revenues Per Ton PRB $12.40 - $12.90 ILB $41.75 - $43.75
Total U.S. $18.50 - $18.90
U.S. Operations - Costs Per Ton PRB $9.50 - $10.00 ILB $31.25 - $33.25 Total U.S. $14.00 - $14.40
Australia Operations - Costs per Ton (USD)3 Metallurgical $85 -
$95 Thermal $31 - $35 Total Australia $51 - $54 Capital Expenditures $165 - $195 million Quarterly SG&A Expense $32 - $35 million Quarterly Interest Expense $39 - $41 million
Q3 - Q4 2017 Cost Sensitivities4 $0.05 Decrease in A$ FX Rate5 +~$50 - $55 million? $0.05 Increase in A$ FX Rate5 -~$25 - $30 million? Fuel (+/- $10/barrel) +/- ~$16 million
Priced Position PRB Average Price/Ton $12.62 ILB Average Price/Ton $42.54
Australia Export Thermal ~10 million tons Australia Export Thermal Average Price/Ton
$67.20 Essentially all of Peabody’s expected 2017 U.S. sales volume is priced as of June 30, 2017; ~60% - 65% of 2018 volumes are priced and 70% - 75% contracted (on a 2017 projected volume basis); approximately 25% of 2019 volumes are
priced (on a 2017 projected volume basis).
17
Appendix: Full-Year 2017 Targets
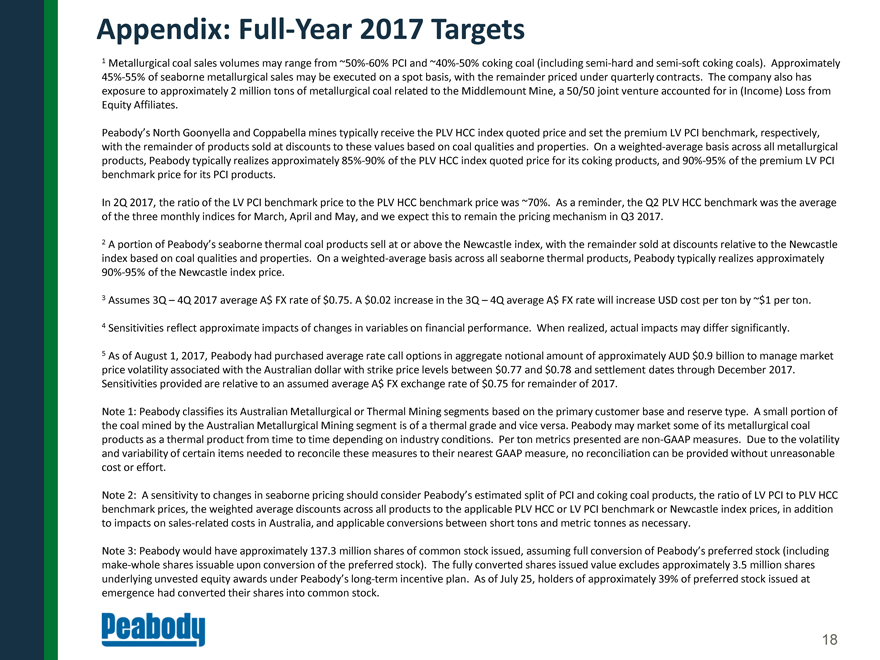
1 Metallurgical coal sales volumes may range from ~50%-60% PCI and ~40%-50% coking coal (including
semi-hard and semi-soft coking coals). Approximately 45%-55% of seaborne metallurgical sales may be executed on a spot basis, with the remainder priced under quarterly contracts. The company also has exposure
to approximately 2 million tons of metallurgical coal related to the Middlemount Mine, a 50/50 joint venture accounted for in (Income) Loss from Equity Affiliates.
Peabody’s North Goonyella and Coppabella mines typically receive the PLV HCC index quoted price and set the premium LV PCI benchmark, respectively, with the remainder of
products sold at discounts to these values based on coal qualities and properties. On a weighted-average basis across all metallurgical products, Peabody typically realizes approximately 85%-90% of the PLV HCC
index quoted price for its coking products, and 90%-95% of the premium LV PCI benchmark price for its PCI products.
In 2Q
2017, the ratio of the LV PCI benchmark price to the PLV HCC benchmark price was ~70%. As a reminder, the Q2 PLV HCC benchmark was the average of the three monthly indices for March, April and May, and we expect this to remain the pricing mechanism
in Q3 2017.
2 A portion of Peabody’s seaborne thermal coal products sell at or above the Newcastle index, with the remainder sold at discounts relative to the
Newcastle index based on coal qualities and properties. On a weighted-average basis across all seaborne thermal products, Peabody typically realizes approximately 90%-95% of the Newcastle index price.
3 Assumes 3Q – 4Q 2017 average A$ FX rate of $0.75. A $0.02 increase in the 3Q – 4Q average A$ FX rate will increase USD cost per ton by ~$1 per ton.
4 Sensitivities reflect approximate impacts of changes in variables on financial performance. When realized, actual impacts may differ significantly.
5 As of August 1, 2017, Peabody had purchased average rate call options in aggregate notional amount of approximately AUD $0.9 billion to manage market price volatility
associated with the Australian dollar with strike price levels between $0.77 and $0.78 and settlement dates through December 2017. Sensitivities provided are relative to an assumed average A$ FX exchange rate of $0.75 for remainder of 2017.
Note 1: Peabody classifies its Australian Metallurgical or Thermal Mining segments based on the primary customer base and reserve type. A small portion of the coal
mined by the Australian Metallurgical Mining segment is of a thermal grade and vice versa. Peabody may market some of its metallurgical coal products as a thermal product from time to time depending on industry conditions. Per ton metrics presented
are non-GAAP measures. Due to the volatility and variability of certain items needed to reconcile these measures to their nearest GAAP measure, no reconciliation can be provided without unreasonable cost or
effort.
Note 2: A sensitivity to changes in seaborne pricing should consider Peabody’s estimated split of PCI and coking coal products, the ratio of LV PCI to
PLV HCC benchmark prices, the weighted average discounts across all products to the applicable PLV HCC or LV PCI benchmark or Newcastle index prices, in addition to impacts on sales-related costs in Australia, and applicable conversions between
short tons and metric tonnes as necessary.
Note 3: Peabody would have approximately 137.3 million shares of common stock issued, assuming full conversion of
Peabody’s preferred stock (including make-whole shares issuable upon conversion of the preferred stock). The fully converted shares issued value excludes approximately 3.5 million shares underlying unvested equity awards under
Peabody’s long-term incentive plan. As of July 25, holders of approximately 39% of preferred stock issued at emergence had converted their shares into common stock.
18
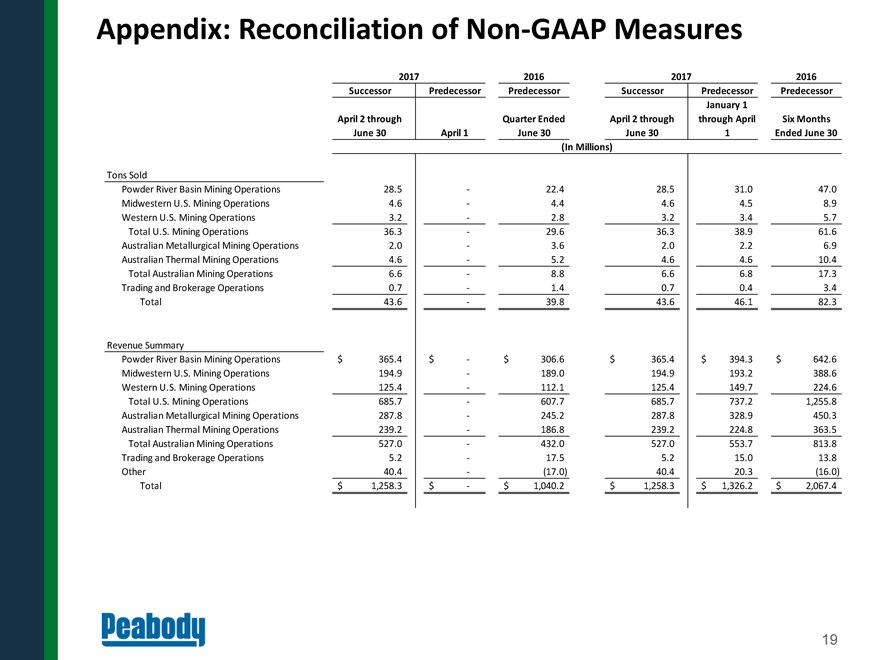
Appendix: Reconciliation of Non-GAAP Measures 2017 2016 2017 2016
Successor Predecessor Predecessor Successor Predecessor Predecessor January 1 April 2 through Quarter Ended April 2 through through April Six Months June 30 April 1 June 30 June 30 1 Ended June 30 (In Millions)
Tons Sold Powder River Basin Mining Operations 28.5-22.428.531.047.0 Midwestern U.S. Mining Operations 4.6-4.44.64.58.9 Western U.S. Mining Operations 3.2-2.83.23.45.7 Total U.S. Mining Operations 36.3-29.636.338.961.6
Australian Metallurgical Mining Operations 2.0-3.62.02.26.9 Australian Thermal Mining Operations 4.6-5.24.64.610.4 Total Australian Mining Operations 6.6-8.86.66.817.3 Trading and
Brokerage Operations 0.7-1.40.70.43.4 Total 43.6-39.843.646.182.3
Revenue Summary Powder River Basin Mining Operations $365.4 $-$306.6$365.4$394.3$642.6 Midwestern
U.S. Mining Operations 194.9-189.0194.9193.2388.6 Western U.S. Mining Operations 125.4-112.1125.4149.7224.6 Total U.S. Mining Operations 685.7-607.7685.7737.21,255.8 Australian Metallurgical Mining Operations 287.8-245.2287.8328.9450.3 Australian
Thermal Mining Operations 239.2-186.8239.2224.8363.5 Total Australian Mining Operations 527.0-432.0527.0553.7813.8 Trading and Brokerage Operations 5.2-17.55.215.013.8 Other 40.4-(17.0)40.420.3(16.0) Total $1,258.3 $-$
1,040.2$1,258.3$1,326.2$2,067.4
19
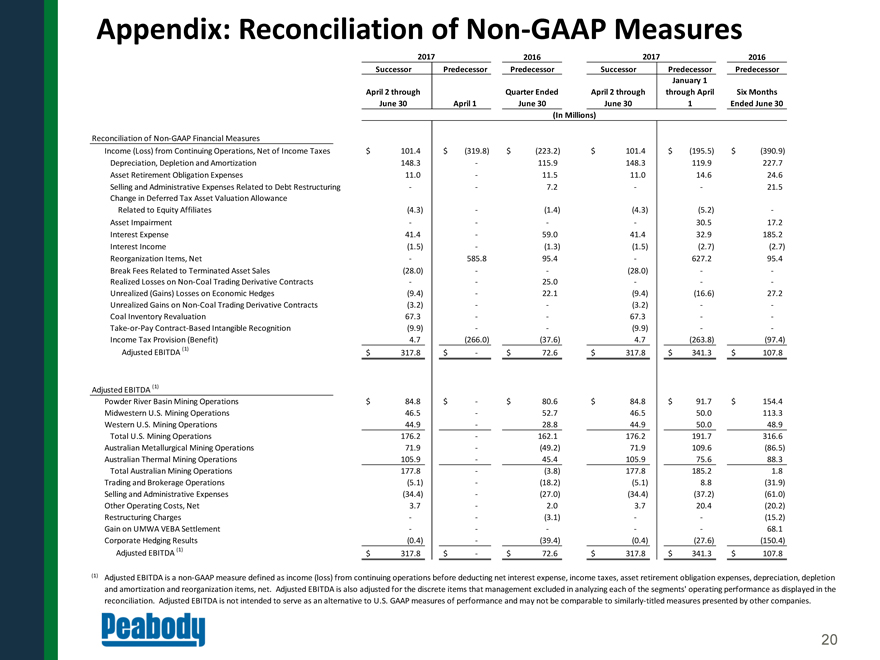
Appendix: Reconciliation of Non-GAAP Measures 2017 2016 2017 2016
Successor Predecessor Predecessor Successor Predecessor Predecessor January 1 April 2 through Quarter Ended April 2 through through April Six Months June 30 April 1 June 30 June 30 1 Ended June 30 (In Millions)
Reconciliation of Non-GAAP Financial Measures Income (Loss) from Continuing Operations, Net of Income Taxes $101.4 $ (319.8)$(223.2)$101.4$ (195.5)$(390.9) Depreciation, Depletion and Amortization
148.3-115.9148.3119.9227.7 Asset Retirement Obligation Expenses 11.0-11.511.014.624.6 Selling and Administrative Expenses Related to Debt Restructuring --7.2--21.5 Change in Deferred Tax Asset Valuation Allowance Related to Equity Affiliates
(4.3)-(1.4)(4.3)(5.2)-
Asset Impairment ----30.517.2 Interest Expense 41.4-59.041.432.9185.2 Interest Income (1.5)-(1.3)(1.5)(2.7)(2.7) Reorganization Items, Net
-585.895.4-627.295.4 Break Fees Related to Terminated Asset Sales (28.0)--(28.0)-- Realized Losses on Non-Coal Trading Derivative Contracts --25.0--- Unrealized (Gains) Losses on Economic Hedges
(9.4)-22.1(9.4)(16.6)27.2 Unrealized Gains on Non-Coal Trading Derivative Contracts (3.2)--(3.2)-- Coal Inventory Revaluation 67.3--67.3--
Take-or-Pay Contract-Based Intangible Recognition (9.9)--(9.9)-- Income Tax Provision (Benefit) 4.7(266.0)(37.6)4.7(263.8)(97.4) Adjusted EBITDA (1) $317.8
$-$72.6$317.8$ 341.3$107.8 Adjusted EBITDA (1) Powder River Basin Mining Operations $84.8 $-$80.6$84.8$91.7$154.4
Midwestern U.S. Mining Operations
46.5-52.746.550.0113.3 Western U.S. Mining Operations 44.9-28.844.950.048.9
Total U.S. Mining Operations 176.2-162.1176.2191.7316.6 Australian Metallurgical Mining
Operations 71.9-(49.2)71.9109.6(86.5)
Australian Thermal Mining Operations 105.9-45.4105.975.688.3 Total Australian Mining Operations 177.8-(3.8)177.8185.21.8
Trading and Brokerage Operations (5.1)-(18.2)(5.1)8.8(31.9) Selling and Administrative Expenses (34.4)-(27.0)(34.4)(37.2)(61.0)
Other Operating Costs, Net 3.7-2.03.720.4(20.2) Restructuring Charges --(3.1)--(15.2) Gain on UMWA VEBA Settlement -----68.1
Corporate Hedging Results (0.4)-(39.4)(0.4)(27.6)(150.4) Adjusted EBITDA (1) $317.8 $-$72.6$317.8$ 341.3$107.8
(1) Adjusted EBITDA is a non-GAAP measure defined as income (loss) from continuing operations before deducting net interest expense, income
taxes, asset retirement obligation expenses, depreciation, depletion and amortization and reorganization items, net. Adjusted EBITDA is also adjusted for the discrete items that management excluded in analyzing each of the segments’ operating
performance as displayed in the reconciliation. Adjusted EBITDA is not intended to serve as an alternative to U.S. GAAP measures of performance and may not be comparable to similarly-titled measures presented by other companies.
20
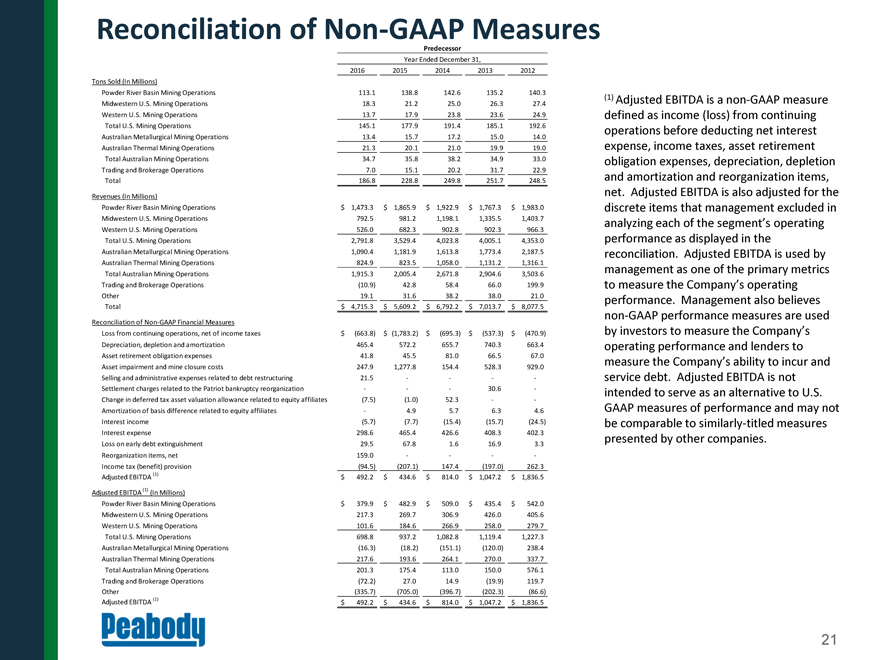
Reconciliation of Non-GAAP Measures Predecessor Year Ended
December 31, 2016 2015 201420132012 Tons Sold (In Millions)
Powder River Basin Mining Operations 113.1 138.8142.6135.2140.3 Midwestern U.S. Mining Operations
18.3 21.225.026.327.4
Western U.S. Mining Operations 13.7 17.923.823.624.9 Total U.S. Mining Operations 145.1 177.9191.4185.1192.6 Australian Metallurgical Mining
Operations 13.4 15.717.215.014.0 Australian Thermal Mining Operations 21.3 20.121.019.919.0 Total Australian Mining Operations 34.7 35.838.234.933.0 Trading and Brokerage Operations 7.0 15.120.231.722.9 Total 186.8 228.8249.8251.7248.5 Revenues (In
Millions) Powder River Basin Mining Operations $ 1,473.3 $ 1,865.9$1,922.9$ 1,767.3$ 1,983.0
Midwestern U.S. Mining Operations 792.5 981.21,198.11,335.51,403.7
Western U.S. Mining Operations 526.0 682.3902.8902.3966.3
Total U.S. Mining Operations 2,791.8 3,529.44,023.84,005.14,353.0 Australian Metallurgical Mining
Operations 1,090.4 1,181.91,613.81,773.42,187.5 Australian Thermal Mining Operations 824.9 823.51,058.01,131.21,316.1 Total Australian Mining Operations 1,915.3 2,005.42,671.82,904.63,503.6 Trading and Brokerage Operations (10.9) 42.858.466.0199.9
Other 19.1 31.638.238.021.0 Total $ 4,715.3 $ 5,609.2$6,792.2$ 7,013.7$ 8,077.5 Reconciliation of Non-GAAP Financial
Measures
Loss from continuing operations, net of income taxes $ (663.8) $ (1,783.2)$(695.3)$(537.3)$ (470.9) Depreciation, depletion and amortization 465.4
572.2655.7740.3663.4 Asset retirement obligation expenses 41.8 45.581.066.567.0 Asset impairment and mine closure costs 247.9 1,277.8154.4528.3929.0 Selling and administrative expenses related to debt restructuring 21.5 ----
Settlement charges related to the Patriot bankruptcy reorganization - --30.6- Change in deferred tax asset valuation allowance related to equity affiliates (7.5) (1.0)52.3--
Amortization of basis difference related to equity affiliates - 4.95.76.34.6 Interest income (5.7) (7.7)(15.4)(15.7)(24.5) Interest expense 298.6 465.4426.6408.3402.3 Loss on early debt extinguishment 29.5 67.81.616.93.3
Reorganization items, net 159.0 ---- Income tax (benefit) provision (94.5) (207.1)147.4(197.0)262.3 Adjusted EBITDA (1) $ 492.2 $ 434.6$814.0$ 1,047.2$ 1,836.5 Adjusted EBITDA (1)
(In Millions) Powder River Basin Mining Operations $ 379.9 $ 482.9$509.0$435.4$ 542.0 Midwestern U.S. Mining Operations 217.3 269.7306.9426.0405.6 Western U.S. Mining Operations 101.6 184.6266.9258.0279.7 Total U.S. Mining Operations 698.8
937.21,082.81,119.41,227.3 Australian Metallurgical Mining Operations (16.3) (18.2)(151.1)(120.0)238.4 Australian Thermal Mining Operations 217.6 193.6264.1270.0337.7 Total Australian Mining Operations 201.3 175.4113.0150.0576.1 Trading and
Brokerage Operations (72.2) 27.014.9(19.9)119.7 Other (335.7) (705.0)(396.7)(202.3)(86.6) Adjusted EBITDA (1) $ 492.2 $ 434.6$814.0$ 1,047.2$ 1,836.5 (1) Adjusted EBITDA is a non-GAAP measure defined as income
(loss) from continuing operations before deducting net interest expense, income taxes, asset retirement obligation expenses, depreciation, depletion and amortization and reorganization items, net. Adjusted EBITDA is also adjusted for the discrete
items that management excluded in analyzing each of the segment’s operating performance as displayed in the reconciliation. Adjusted EBITDA is used by management as one of the primary metrics to measure the Company’s operating performance.
Management also believes non-GAAP performance measures are used by investors to measure the Company’s operating performance and lenders to measure the Company’s ability to incur and service debt.
Adjusted EBITDA is not intended to serve as an alternative to U.S. GAAP measures of performance and may not be comparable to similarly-titled measures presented by other companies.
21