Attached files
| file | filename |
|---|---|
| EX-99.1 - EXHIBIT 99.1 EARNINGS RELEASE - Novelis Inc. | novelisq1fy18results.htm |
| 8-K - 8-K EARNINGS - Novelis Inc. | nvl-form8xkq1fy18.htm |

© 2017 Novelis
NOVELIS Q1 FISCAL 2018
EARNINGS CONFERENCE CALL
August 7, 2017
Steve Fisher
President and Chief Executive Officer
Devinder Ahuja
Senior Vice President and Chief Financial Officer
Exhibit 99.2

© 2017 Novelis
SAFE HARBOR STATEMENT
Forward-looking statements
Statements made in this presentation which describe Novelis' intentions, expectations, beliefs or predictions may be forward-
looking statements within the meaning of securities laws. Forward-looking statements include statements preceded by, followed
by, or including the words "believes," "expects," "anticipates," "plans," "estimates," "projects," "forecasts," or similar
expressions. Examples of forward-looking statements in this presentation including statements concerning our expectation that
trucks, SUVs and EVs will continue to grow faster than the overall market. Novelis cautions that, by their nature, forward-looking
statements involve risk and uncertainty and that Novelis' actual results could differ materially from those expressed or implied in
such statements. We do not intend, and we disclaim, any obligation to update any forward-looking statements, whether as a result
of new information, future events or otherwise. Factors that could cause actual results or outcomes to differ from the results
expressed or implied by forward-looking statements include, among other things: changes in the prices and availability of aluminum
(or premiums associated with such prices) or other materials and raw materials we use; the capacity and effectiveness of our
hedging activities; relationships with, and financial and operating conditions of, our customers, suppliers and other stakeholders;
fluctuations in the supply of, and prices for, energy in the areas in which we maintain production facilities; our ability to access
financing for future capital requirements; changes in the relative values of various currencies and the effectiveness of our currency
hedging activities; factors affecting our operations, such as litigation, environmental remediation and clean-up costs, labor relations
and negotiations, breakdown of equipment and other events; the impact of restructuring efforts in the future; economic, regulatory
and political factors within the countries in which we operate or sell our products, including changes in duties or tariffs; competition
from other aluminum rolled products producers as well as from substitute materials such as steel, glass, plastic and composite
materials; changes in general economic conditions including deterioration in the global economy, particularly sectors in which our
customers operate; cyclical demand and pricing within the principal markets for our products as well as seasonality in certain of our
customers’ industries; changes in government regulations, particularly those affecting taxes, environmental, health or safety
compliance; changes in interest rates that have the effect of increasing the amounts we pay under our credit facilities and other
financing agreements; the effect of taxes and changes in tax rates; and our level of indebtedness and our ability to generate cash.
The above list of factors is not exhaustive. Other important risk factors included under the caption "Risk Factors" in our Annual
Report on Form 10-K for the fiscal year ended March 31, 2017 are specifically incorporated by reference into this presentation.
2

© 2017 Novelis
FIRST QUARTER FY18 HIGHLIGHTS
Record Q1 shipments, continued auto growth and
operational efficiencies driving strong performance
Total shipments up 4%
Global auto shipments up 16%; global can shipments up 2%
Adjusted EBITDA/ton up 4% to $368
3
On track to achieve record Adjusted EBITDA in FY18
TTM Adjusted EBITDA ($M)
Adjusted EBITDA and Adjusted EBITDA/ton exclude metal price lag in all periods
750
800
850
900
950
1,000
1,050
1,100
1,150
Quarterly Adjusted EBITDA/ton ($)
200
225
250
275
300
325
350
375

© 2017 Novelis
GLOBAL CAN SHEET MARKET
4
Source: Novelis internal research
North America
2017 Demand: 1.8 MT
CAGR 2017-21: +0-1%
South America
2017 Demand: 0.4MT
CAGR 2017-21: +3%
MEAI
2017 Demand: 0.4MT
CAGR 2017-21: +5%
Europe
2017 Demand: 1.1 MT
CAGR 2017-21: +3-4%
China
2017 Demand: 0.7 MT
CAGR 2017-21: +5%
Demand for 5.4 million tonne global aluminum can sheet market remains unchanged,
expected to grow low single digits through 2021
Novelis Q1 EBITDA results reflect majority of new can pricing with secured longer term
volume at sustained market share
Committed to our Can sheet customers and market
Aluminum beverage can sheet demand
Asia excl. China
2017 Demand: 1.0 MT
CAGR 2017-21: +3%

© 2017 Novelis
GLOBAL AUTOMOTIVE SHEET MARKET
5
Novelis is the preferred choice for automotive aluminum sheet solutions
Ducker Worldwide and IHS project increased penetration of aluminum sheet, mainly
through hang-on parts, leading to higher demand
Aluminum penetration is higher in Trucks, SUVs, and EVs globally
China automotive FRP market is growing at the highest CAGR supported by
government policies and EV market development
Trucks, SUVs and EVs will continue to grow faster than the overall market
NORTH AMERICA
2017 Demand: 0.7 MT
CAGR 2017-21: +13-15%
EUROPE
2017 Demand: 0.5 MT
CAGR 2017-21: +10-12%
ASIA
2017 Demand: 0.1 MT
CAGR 2017-21: +35-40%
Automotive Aluminum Sheet Demand
Source: Novelis internal research, IHS Material Forecast, Ducker Worldwide

© 2017 Novelis
FINANCIAL HIGHLIGHTS

© 2017 Novelis
Q1 FISCAL 2018 FINANCIAL HIGHLIGHTS
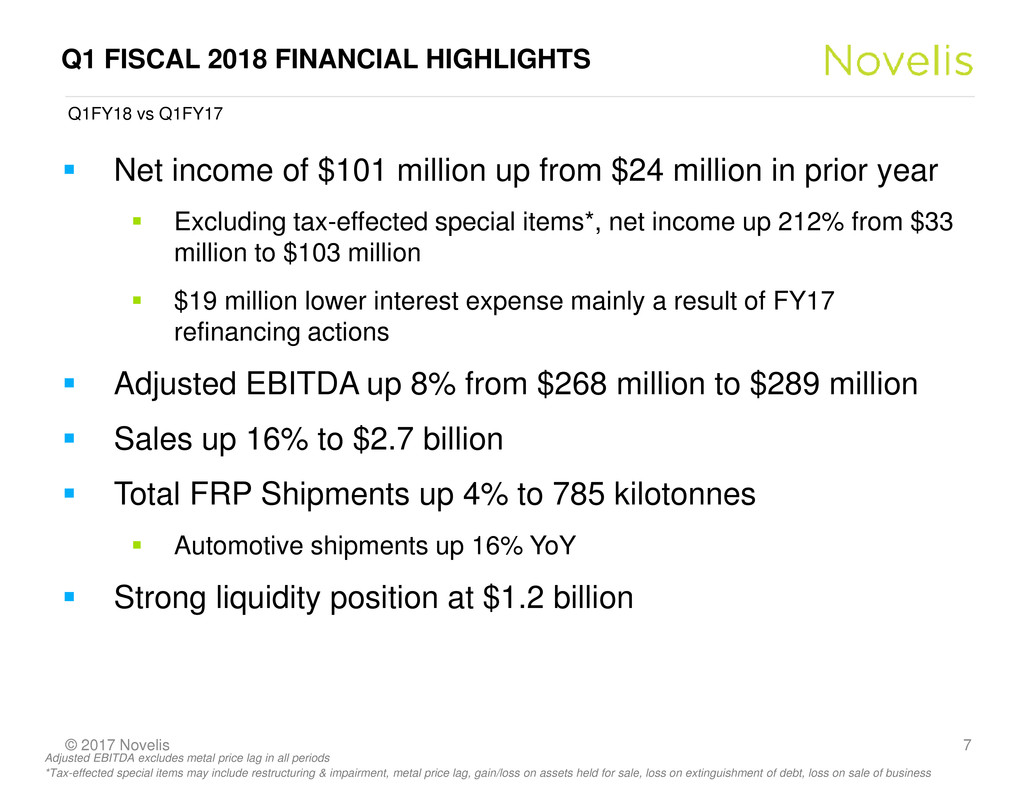
Net income of $101 million up from $24 million in prior year
Excluding tax-effected special items*, net income up 212% from $33
million to $103 million
$19 million lower interest expense mainly a result of FY17
refinancing actions
Adjusted EBITDA up 8% from $268 million to $289 million
Sales up 16% to $2.7 billion
Total FRP Shipments up 4% to 785 kilotonnes
Automotive shipments up 16% YoY
Strong liquidity position at $1.2 billion
7
Q1FY18 vs Q1FY17
*Tax-effected special items may include restructuring & impairment, metal price lag, gain/loss on assets held for sale, loss on extinguishment of debt, loss on sale of business
Adjusted EBITDA excludes metal price lag in all periods

© 2017 Novelis
Q1 ADJUSTED EBITDA BRIDGE
8
$ Millions
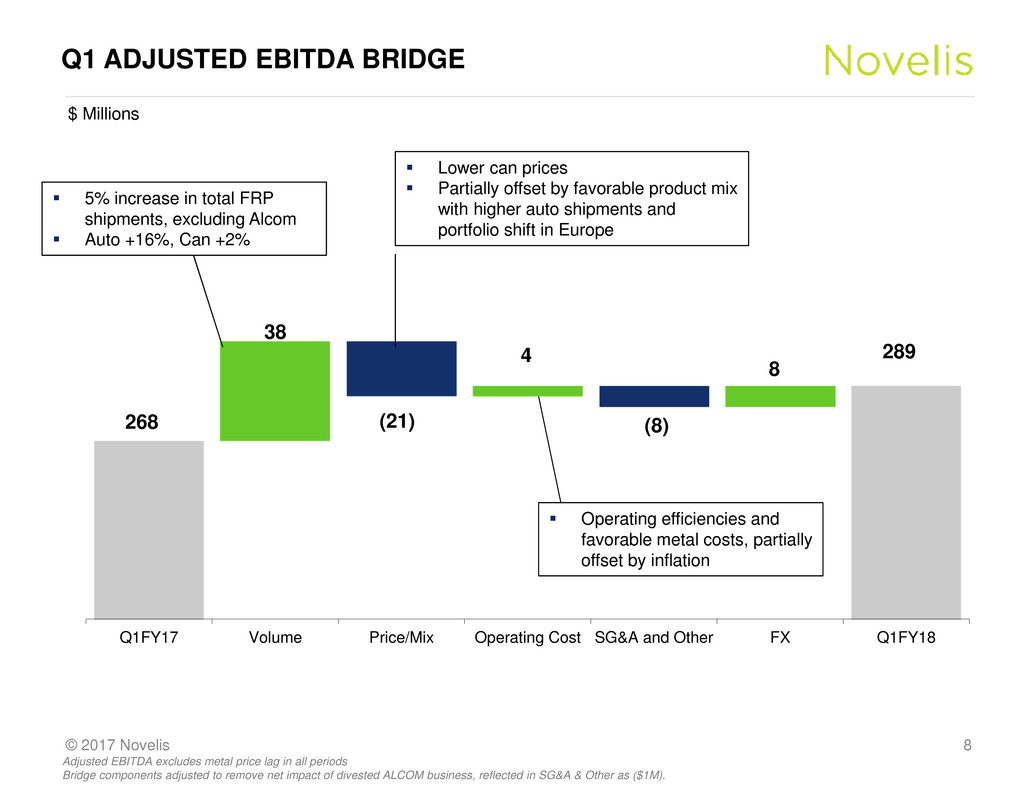
268
38
(21)
4
(8)
8
289
Q1FY17 Volume Price/Mix Operating Cost SG&A and Other FX Q1FY18
Adjusted EBITDA excludes metal price lag in all periods
Bridge components adjusted to remove net impact of divested ALCOM business, reflected in SG&A & Other as ($1M).
5% increase in total FRP
shipments, excluding Alcom
Auto +16%, Can +2%
Lower can prices
Partially offset by favorable product mix
with higher auto shipments and
portfolio shift in Europe
Operating efficiencies and
favorable metal costs, partially
offset by inflation

© 2017 Novelis
FREE CASH FLOW
9
Q1 FY18 Q1 FY17
Adjusted EBITDA 289 268
Capital expenditures (39) (44)
Interest paid (81) (133)
Taxes paid (27) (28)
Working capital & other (219) (209)
Free cash flow (77) (146)
Free cash flow improved year over year driven by higher
Adjusted EBITDA and refinancing driven interest savings
Q1 working capital outflow due to seasonally higher inventory,
rising aluminum prices, timing of customer payments
Expect record FY18 free cash flow
$ Millions
Adjusted EBITDA excludes metal price lag in all periods

© 2017 Novelis
SUMMARY & OUTLOOK
Demonstrating continued strong operating & financial
performance
Well poised for record Adjusted EBITDA and free cash flow for
the full year FY18
FY18 Adjusted EBITDA $1,100-$1,150 million
FY18 free cash flow $400-$450 million
Positive outlook for automotive aluminum sheet demand
Strong financial position allows us to evaluate potential growth
opportunities to meet customer needs
10

© 2017 Novelis
THANK YOU
QUESTIONS?
THANK YOU AND QUESTIONS

© 2017 Novelis
APPENDIX

© 2017 Novelis
INCOME STATEMENT RECONCILIATION TO ADJUSTED EBITDA
13
(in $ m) Q1 Q2 Q3 Q4 FY17 Q1FY18
Net income (loss) attributable to our common shareholder 24 (89) 63 47 45 101
- Noncontrolling interests - - 1 - 1 -
- Interest, net 80 79 65 59 283 62
- Income tax provision 36 27 47 41 151 43
- Depreciation and amortization 89 90 88 93 360 90
EBITDA 229 107 264 240 840 296
- Unrealized loss (gain) on derivatives 7 (4) (21) 13 (5) (16)
- Realized gain on derivative instruments not included in segment
income (1) - (1) (3) (5) (1)
- Proportional consolidation 8 8 4 8 28 8
- Loss on extinguishment of debt - 112 - 22 134 -
- Restructuring and impairment, net 2 1 1 6 10 1
- Loss on sale of business - 27 - - 27 -
- Loss (gain) on sale of fixed assets 4 2 (2) 2 6 1
- Gain on assets held for sale, net (1) (1) - - (2) -
- Metal price lag (A) 13 14 4 - 31 1
- Others costs (income), net 7 4 6 4 21 (1)
Adjusted EBITDA 268 270 255 292 1,085 289
(A) Effective in the first quarter of fiscal 2018, management removed the impact of metal price lag from Adjusted EBITDA (Segment Income) in order to
provide more transparency and visibility for our stakeholders on the underlying performance of the business. On certain sales contracts, we experience
timing differences on the pass through of changing aluminum prices from our suppliers to our customers. Additional timing differences occur in the flow of
metal costs through moving average inventory cost values and cost of goods sold. This timing difference is referred to as metal price lag. The company will
continue to report metal price lag as a separate line item in Reconciliation from Net Income (loss) attributable to our common shareholder to Adjusted
EBITDA. Segment information for all prior periods presented has been updated to reflect this change.

© 2017 Novelis
FREE CASH FLOW AND LIQUIDITY
14
(in $ m) Q1 Q2 Q3 Q4 FY17 Q1FY18
Cash (used in) provided by operating activities (107) 80 178 424 575 (45)
Cash used in investing activities (39) (48) (35) (90) (212) (31)
Less: outflows (proceeds) from sales of assets - 12 (12) (2) (2) (1)
Free cash flow (146) 44 131 332 361 (77)
Capital expenditures 44 46 48 86 224 39
(in $ m) Q1 Q2 Q3 Q4 FY17 Q1FY18
Cash and cash equivalents 457 473 505 594 594 565
Availability under committed credit facilities 633 573 534 701 701 671
Liquidity 1,090 1,046 1,039 1,295 1,295 1,236
