Attached files
| file | filename |
|---|---|
| EX-32.2 - EXHIBIT 32.2 - INVACARE CORP | q22017ivcex322.htm |
| EX-32.1 - EXHIBIT 32.1 - INVACARE CORP | q22017ivcex321.htm |
| EX-31.2 - EXHIBIT 31.2 - INVACARE CORP | q22017ivcex312.htm |
| EX-31.1 - EXHIBIT 31.1 - INVACARE CORP | q22017ivcex311.htm |
UNITED STATES
SECURITIES AND EXCHANGE COMMISSION
WASHINGTON, D.C. 20549
FORM 10-Q
[X] | QUARTERLY REPORT PURSUANT TO SECTION 13 OR 15(d) OF THE SECURITIES EXCHANGE ACT OF 1934 |
For the quarterly period ended June 30, 2017
OR
[ ] | TRANSITION REPORT PURSUANT TO SECTION 13 OR 15(d) OF THE SECURITIES EXCHANGE ACT OF 1934 |
For the transition period from to
Commission File Number 001-15103
INVACARE CORPORATION
(Exact name of registrant as specified in its charter)

Ohio | 95-2680965 |
(State or other jurisdiction of incorporation or organization) | (IRS Employer Identification No.) |
One Invacare Way, Elyria, Ohio | 44035 |
(Address of principal executive offices) | (Zip Code) |
(440) 329-6000
(Registrant's telephone number, including area code)
(Former name, former address and former fiscal year, if changed since last report)
Indicate by check mark whether the registrant: (1) has filed all reports required to be filed by Section 13 or 15 (d) of the Securities Exchange Act of 1934 (the “Exchange Act”) during the preceding 12 months (or for such shorter period that the registrant was required to file such reports), and (2) has been subject to such filing requirements for the past 90 days. Yes x No ¨
Indicate by check mark whether the registrant has submitted electronically and posted on its corporate Web site, if any, every Interactive Data File required to be submitted and posted pursuant to Rule 405 of Regulation S-T (§232.405 of this chapter) during the preceding 12 months (or for such shorter period that the registrant was required to submit and post such files). Yes x No ¨
Indicate by check mark whether the registrant is a large accelerated filer, an accelerated filer, a non-accelerated filer, or a smaller reporting company. See the definitions of “large accelerated filer,” “accelerated filer” and “small reporting company” in Rule 12b-2 of the Exchange Act. (Check One): Large accelerated filer ¨ Accelerated filer x Non-accelerated filer ¨ (Do not check if a smaller reporting company) Smaller reporting company ¨ Emerging growth company ¨
If an emerging growth company, indicate by check mark if the registrant has elected not to use the extended transition period for complying with any new or revised financial accounting standards provided pursuant to Section 13(a) of the Exchange Act. ¨
Indicate by check mark whether the registrant is a shell company (as defined in Rule 12b-2 of the Exchange Act). Yes ¨ No x
As of August 3, 2017, the registrant had 32,852,207 Common Shares and 18,357 Class B Common Shares outstanding.
Table of Contents
Item | Page | |
PART I: FINANCIAL INFORMATION | ||
2 | ||
1 | ||
3 | ||
4 | ||
PART II: OTHER INFORMATION | ||
1 | ||
1A | ||
2 | ||
6 | ||
About Invacare Corporation
Invacare Corporation (NYSE: IVC) is a leading manufacturer and distributor in its markets for medical equipment used in non-acute care settings. At its core, the company designs, manufactures and distributes medical devices that help people to move, breathe, rest and perform essential hygiene. The company provides medical device solutions for congenital (e.g., cerebral palsy, muscular dystrophy, spina bifida), acquired (e.g., stroke, spinal cord injury, traumatic brain injury, post-acute recovery, pressure ulcers) and degenerative (e.g., ALS, multiple sclerosis, chronic obstructive pulmonary disease (COPD), elderly, bariatric) ailments. The company's products are important parts of care for people with a wide range of challenges, from those who are active and heading to work or school each day and may need additional mobility or respiratory support, to those who are cared for in residential care settings, at home and in rehabilitation centers. The company sells its products principally to home medical equipment providers with retail and e-commerce channels, residential care operators, dealers and government health services in North America, Europe and Asia/Pacific. For more information about the company and its products, visit Invacare's website at www.invacare.com.
MD&A | Overview | |
Item 2. Management's Discussion and Analysis of Financial Condition and Results of Operations.
The discussion and analysis presented below is concerned with material changes in financial condition and results of operations between the periods specified in the condensed consolidated balance sheet at June 30, 2017 and December 31, 2016, and in the condensed consolidated statement of comprehensive income (loss) for the three and six months ended June 30, 2017 and June 30, 2016. All comparisons presented are with respect to the same period last year, unless otherwise stated. This discussion and analysis should be read in conjunction with the consolidated financial statements and accompanying notes that appear elsewhere in this quarterly report on Form 10-Q and the MD&A included in the company's annual report on Form 10-K for the year ended December 31, 2016.
OVERVIEW
Strategy
For its first 35 years, the company had a strategy to be a leading provider of durable medical equipment to providers in global markets by providing the broadest portfolio available. This strategy had not kept pace with certain reimbursement changes, competitive dynamics and company-specific challenges, especially in the United States market. Since 2015, the company has made a major shift in its strategy to align its resources to produce products and solutions that assist customers and end-users with their most clinically complex needs. By focusing the company’s efforts to provide the best possible assistance and outcomes to the people and caregivers who use its products, the company aims to improve its financial condition for sustainable profit and growth. To execute this transformation, the company is undertaking a substantial three-phase, multi-year transformation plan.
Transformation
The company has been executing a multi-year transformation to shift to its new strategy, especially in North America. This is expected to yield better financial results from the application of the company’s resources to products and solutions that provide greater healthcare value in clinically complex rehabilitation and post-acute care. The transformation is divided into the following three phases:
Phase One - Assess and Reorient
• | Increase commercial effectiveness; |
• | Shift and narrow the product portfolio; |
• | Align innovation resources to clinically complex solutions; |
• | Accelerate quality efforts with culture of quality excellence; and |
• | Develop and expand talent. |
Phase One, which is largely complete in North America, was strategic alignment and investment phase with significant shifts in the mix of the company's business. During Phase One, the company made investments in SG&A, including hiring and training over 50% new North America/HME clinical sales representatives, mainly in 2016. The company reduced net sales of less accretive
product, including reducing net sales of aids for daily living, divested its Garden City Medical, Inc. (GCM) subsidiary, and discontinued non-core product categories such as consumer power wheelchairs in North America/HME. During Phase One, the North America/HME business also demonstrated gross margin percentage improvement through a more clinical mix of products from the integration of clinical subsidiaries, as well as an enhanced new product pipeline.
Phase Two - Build and Align
• | Leverage commercial improvements; |
• | Optimize the business for cost and efficiency; |
• | Continue to improve quality systems; |
• | Launch new clinical product platforms; and |
• | Expand talent management and culture. |
The company is currently in Phase Two of the transformation, focused on North America. By the end this phase, the company expects growth in sales and gross profit dollars, as well as an improvement in operating income and free cash flow. This is expected to come from the commercial execution of phase one investments and new product launches. The company also is optimizing its infrastructure and improving efficiencies. During the second quarter of 2017, the company took announced actions expected to yield $6.7 million in annualized cost savings, which is in addition to the previously announced $9.2 million of restructuring actions taken since October 2016.
Phase Three - Grow
• | Lead in quality culture and operations excellence; and |
• | Grow above market. |
By the end of phase three, the company expects continued improvements in net sales, operating margin, operating income and free cash flow.
Through the first half of 2017, the company expected continued lower net sales offset by favorable sales mix shift and increased gross margin as a percentage of net sales. In the second quarter of 2017, consolidated net sales decreased compared to the
1
MD&A | Overview | |
same period prior year, and sequentially decreased slightly compared to the first quarter of 2017. Gross margin as a percentage of net sales improved as a result of lower warranty costs and the strategic mix shift toward clinically complex products.
In the second quarter of 2017, the company issued $120,000,000 aggregate principal amount of 4.50% Convertible Senior Notes due 2022 in a private offering, and entered into related convertible note hedge and warrant transactions. Proceeds of the offering may be used to fund portions of the transformation and strengthen the company’s working capital. For further information, see “Long-Term Debt” in the Notes to the Consolidated Financial Statements included elsewhere in this report.
The company expects to take advantage of opportunities for growth across its many product lines and businesses by providing clinical solutions to the growing demographic in need of the company’s products. The company also remains focused on building an enterprise-wide quality culture, which it believes will ultimately be a competitive advantage. The company intends to move forward with its transformation, while managing through external uncertainty, such as changes in payor reimbursement policies. The company has demonstrated some improvements in the key short-term metrics as a result of its strategic shift. However, in spite of this, there may be interim periods where the company’s investments do not fully yield expected financial improvements, particularly in light of various external factors.
STATUS OF THE CONSENT DECREE
On July 24, 2017, the company received notice from the United States Food and Drug Administration (FDA) that the company had satisfied the Agency’s requirements under the consent decree to resume full operations at its Corporate and Taylor Street manufacturing facility in Elyria, Ohio. As a result, the company then became able to produce and sell all products made in the Taylor Street facility without the previous restrictions under the consent decree, which has been in effect since December 21, 2012.
The company is now able to sell its wheelchairs designed and manufactured at the Taylor Street facility without having to obtain the verification of medical necessity (VMN) documentation previously required under the consent decree. To ensure the facilities are in continuous compliance with FDA regulations and the consent decree, the consent decree requires the company to undergo five years of audits by a third-party auditor selected by Invacare. The third-party auditor will inspect the Corporate and Taylor Street facilities every six months for the first year, and then once every 12 months for the four years thereafter. Other Invacare manufacturing facilities were unaffected by the consent decree and have remained fully operational.
For a complete description of the consent decree, see the “Contingencies” note to the financial statements contained in Item
1 of this Quarterly Report on Form 10-Q and “Forward-Looking Statements” contained below in this Item.
OUTLOOK
The company is focused on transforming its business, especially in North America. Through the second half of 2017, the company should start to stabilize sales sequentially in its North America businesses through new product and service offerings, and increased productivity from its new commercial salesforce. The launch of the new Invacare® TDX® SP2 power wheelchair with LiNX® technology and the ability to sell power and manual wheelchairs from the Taylor Street facility without the previous restrictions from the consent decree are unlikely to have a material impact on the business until at least 2018 due to the time it takes to earn that business combined with the industry's extended quote-to-order process. The quote-to-order process can delay the successful conversion of sales quotes to shipments between 60-90 days.
The company will continue its focus on reducing costs and improving efficiencies. The company's priorities remain: emphasizing a culture of quality excellence and achieving its long-term earnings potential. The company remains committed to its long-term earnings objective, which is largely based upon four parts:
•Net sales growth in North America/HME mobility and
seating segment;
•Net sales growth in the IPG post-acute care business;
•Cost reductions across the North America businesses; and
•Continued net sales growth and efficiency gains in
Europe.
Because of the scope and magnitude of changes being undertaken and the realized and potential changes affecting the business, the company expects some variation in the timing and relative magnitude of these results.
2
MD&A | Results of Operations | |
RESULTS OF OPERATIONS
On September 30, 2016, the company completed the sale of its subsidiary, Garden City Medical Inc. ("GCM"), to Compass Health Brands. GCM, doing business as PMI and Pinnacle Medsource, sourced and distributed primarily single-use products under the brand ProBasics™ by PMI. GCM was part of the North America/Home Medical Equipment (NA/HME) segment. This divestiture further refined the company’s focus on other lines of business where the company’s resources can best generate returns in areas of complex rehabilitation and post-acute care. CGM was not deemed a discontinued operation for financial reporting purposes, and therefore is included in the results below unless otherwise noted. For more information, see the condensed consolidated financial statements included in this Quarterly Report on Form 10-Q.
References herein to "year-to-date" refer to the first six months of the fiscal year, ended June 30.
3
MD&A | Net Sales | |
NET SALES
($ in thousands USD) | Q2 17 | Q2 16 | Reported % Change | Foreign Exchange % Impact | Constant Currency % Change | |||||
Europe | 128,485 | 135,735 | (5.3 | ) | (5.5 | ) | 0.2 | |||
NA/HME | 77,689 | 110,700 | (29.8 | ) | (0.3 | ) | (29.5 | ) | ||
IPG | 15,320 | 16,115 | (4.9 | ) | (0.1 | ) | (4.8 | ) | ||
Asia/Pacific | 12,023 | 12,487 | (3.7 | ) | 0.6 | (4.3 | ) | |||
Consolidated | 233,517 | 275,037 | (15.1 | ) | (2.8 | ) | (12.3 | ) | ||
NA/HME less divested GCM | 77,689 | 101,636 | (23.6 | ) | (0.4 | ) | (23.2 | ) | ||
Consolidated less divested GCM | 233,517 | 265,973 | (12.2 | ) | (2.9 | ) | (9.3 | ) | ||
($ in thousands USD) | YTD Q2 17 | YTD Q2 16 | Reported % Change | Foreign Exchange % Impact | Constant Currency % Change | |||||
Europe | 247,993 | 257,766 | (3.8 | ) | (5.4 | ) | 1.6 | |||
NA/HME | 161,951 | 218,372 | (25.8 | ) | — | (25.8 | ) | |||
IPG | 31,693 | 34,359 | (7.8 | ) | (0.1 | ) | (7.7 | ) | ||
Asia/Pacific | 23,603 | 22,092 | 6.8 | 2.3 | 4.5 | |||||
Consolidated | 465,240 | 532,589 | (12.6 | ) | (2.5 | ) | (10.1 | ) | ||
NA/HME less divested GCM | 161,951 | 200,149 | (19.1 | ) | (0.1 | ) | (19.0 | ) | ||
Consolidated less divested GCM | 465,240 | 514,366 | (9.6 | ) | (2.7 | ) | (6.9 | ) | ||
For the quarter, constant currency net sales increased in the European segment but was more than offset by declines in the NA/HME, IPG and Asia/Pacific segments.
Year-to-date constant currency net sales increased in the European and Asia/Pacific segments but was more than offset by declines in the NA/HME and IPG segments.
Excluding the divestiture of the GCM business, consolidated constant currency net sales declined 9.3% and 6.9% for the quarter and year-to-date, respectively, compared to the same periods last year, with net sales declines in lifestyle and respiratory products partially offset by increases in mobility and seating products.
The company realized a favorable impact from sales mix year-to-date attributable to mobility and seating products, which comprise most of the company's clinically complex product
portfolio. Sales mix increased to 38% from 33% for constant currency net sales by product for the second quarter of 2017 as compared to same period last year.
The table above provides net sales change as reported and as adjusted to exclude the impact of foreign exchange translation (constant currency net sales) as well as net sales further adjusted to exclude the impact of the sale of GCM, which was sold in September 2016 and not deemed a discontinued operation from an external reporting perspective. “Constant currency net sales" is a non-GAAP financial measure, which is defined as net sales excluding the impact of foreign currency translation. The current year's functional currency net sales are translated using the prior year's foreign exchange rates. These amounts are then compared to the prior year's sales to calculate the constant currency net sales change. Management believes that this financial measure provides meaningful information for evaluating the core operating performance of the company.
4
MD&A | Net Sales | |
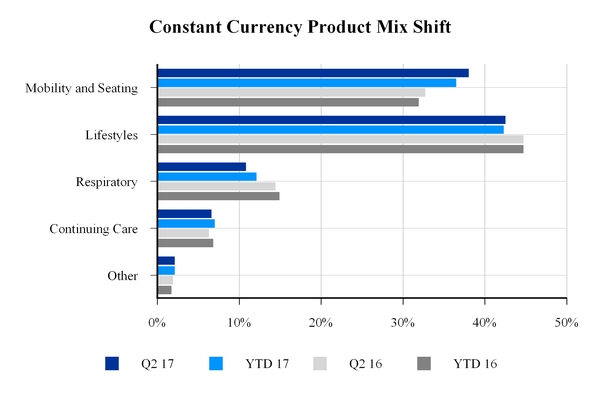
This favorable net sales mix shift is the result of the company's continued transformation and, in particular, the implementation of Phase One of the transformation, where the company focused on shifting and narrowing the product portfolio and alignment of resources to focus on clinically complex solutions.
Constant currency net sales performance drivers by segment:
Europe - The improvement in constant currency net sales for the quarter and year-to-date was driven by mobility and seating products partially offset by declines in lifestyle and respiratory products.
North America/Home Medical Equipment (NA/HME) - Excluding the divestiture of the GCM business, constant currency net sales declined 23.2% for the quarter compared to the same period last year. The decrease in constant currency net sales was driven by decreases in all categories, though mostly in lifestyle and respiratory products. Mobility and seating sales were a lesser part of the net sales decline. Newer mobility and seating products grew during the quarter, including the Alber® Twion® power assist device, Invacare® MyON® HC manual wheelchair and the Rovi® power wheelchair from Motion Concepts.
Institutional Products Group (IPG) - The decrease in constant currency net sales for the quarter was driven by most product categories except beds and interior design projects. The
decrease in constant currency net sales year-to-date was driven by all product categories. As previously disclosed, the company is transforming its go-to-market strategy in the post-acute care (PAC) channel. With the support of IPG's Outcomes by Design™ service offering for customers that launched in the second quarter, the new post-acute commercial team continued to build its new customer base. The company expects this new sales approach within the capital selling environment to take time to yield growth.
Asia/Pacific - The decrease in constant currency net sales for the quarter was driven by the Australia distribution business partially offset by improvements in the New Zealand distribution business and at the company's subsidiary that produces microprocessor controllers. The year-to-date improvement in constant currency net sales was driven by the New Zealand distribution businesses and the company's subsidiary that produces microprocessor controllers partially offset by declines in the Australia distribution business.
5
GROSS PROFIT
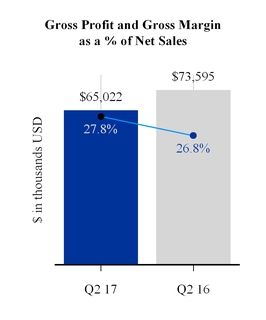
Gross profit as a percentage of net sales increased by 1.0 percentage point in the quarter as compared to the same period last year. This increase was driven by reduced warranty expense and favorable sales mix, partially offset by unfavorable manufacturing costs including the impact of foreign currency. Gross margin as a percentage of net sales increased for the Europe and Asia/Pacific segments and declined for the NA/HME and IPG segments. Gross profit dollars declined in all segments but principally in the NA/HME segment.
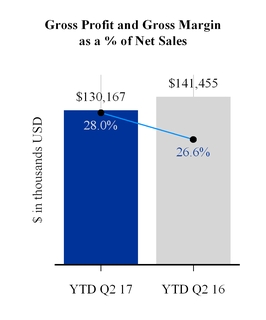
Gross profit as a percentage of net sales increased by 1.4 percentage points year-to-date as compared to the same period last year. This increase was driven by favorable sales mix and reduced warranty expense partially offset by unfavorable manufacturing variances including the impact of foreign currency and increased research and development expense. Gross margin as a percentage of net sales increased for all the segments. Gross profit dollars declined in all segments except Asia/Pacific but principally in the NA/HME segment.
Gross profit drivers by segment:
Europe - For the quarter, gross margin as a percentage of net sales increased 1.4 percentage points, while gross profit dollars decreased $27,000, compared to the same period last year. The slight decrease in gross profit dollars was driven by unfavorable foreign currency partially offset by reduced warranty costs and favorable net sales mix.
Year-do-date, gross margin as a percentage of net sales increased 1.0 percentage point, while gross profit dollars decreased $223,000, compared to the same period last year. The decrease in gross profit dollars was driven by unfavorable foreign currency and increased research and development expense partially offset by reduced warranty costs and favorable net sales mix.
NA/HME - For the quarter, gross margin as a percentage of net sales decreased by 0.1 percentage points, while gross profit dollars decreased $7,968,000, compared to the same period last year. Excluding the impact of the divested GCM business, gross margin as a percentage of net sales decreased by 0.4 of a percentage point, while gross profit dollars decreased by $6,077,000. The decrease in gross profit dollars was primarily due to net sales volume declines and unfavorable manufacturing costs partially offset by favorable net sales mix and reduced freight and warranty costs.
Year-to-date, gross margin as a percentage of net sales increased by 1.2 percentage points, while gross profit dollars decreased $11,047,000, compared to the same period last year. Excluding the impact of the divested GCM business, gross margin as a percentage of net sales increased by 0.9 of a percentage point, while gross profit dollars decreased by $7,106,000. The decrease in gross profit dollars was primarily due to net sales volume declines and unfavorable manufacturing variances partially offset by reduced freight and warranty costs and favorable net sales mix.
6
IPG - For the quarter, gross margin as a percentage of net sales decreased 0.2 of a percentage point, and gross profit dollars decreased $194,000, compared to the same period last year. The slight decrease in gross profit dollars was driven by volume declines. Year-to-date, gross margin as a percentage of net sales increased 1.3 percentage points while gross profit dollars decreased $96,000, compared to the same period last year. The slight decrease in gross profit dollars was driven by volume declines partially offset by reduced warranty expense.
Asia/Pacific - For the quarter, gross margin as a percentage of net sales increased by 0.7 of a percentage point, while gross profit dollars decreased $210,000, compared to the same period last year. The decrease in gross profit dollars was primarily due to volume declines partially offset by a favorable net sales mix. Year-to-date, gross margin as a percentage of net sales increased by 0.7 of a percentage point, and gross profit dollars increased $21,000, compared to the same period last year. The slight increase in gross profit dollars was primarily attributable to favorable net sales mix and foreign currency.
7
MD&A | SG&A | |
SELLING, GENERAL AND ADMINISTRATIVE EXPENSES
($ in thousands USD) | Q2 17 | Q2 16 | Reported Change | Foreign Exchange Impact | Constant Currency Change | |||||
SG&A Expenses - $ | 75,721 | 78,722 | (3,001 | ) | (1,566 | ) | (1,435 | ) | ||
SG&A Expenses - % change | (3.8 | ) | (2.0 | ) | (1.8 | ) | ||||
% to net sales | 32.4 | 28.6 | ||||||||
Consolidated less divested GCM - $ | 75,721 | 77,581 | (1,860 | ) | (1,566 | ) | (294 | ) | ||
Consolidated less divested GCM - % change | (2.4 | ) | (2.0 | ) | (0.4 | ) | ||||
% to net sales | 32.4 | 29.2 | ||||||||
($ in thousands USD) | YTD Q2 17 | YTD Q2 16 | Reported Change | Foreign Exchange Impact | Constant Currency Change | |||||
SG&A Expenses - $ | 148,234 | 151,556 | (3,322 | ) | (2,540 | ) | (782 | ) | ||
SG&A Expenses - % change | (2.2 | ) | (1.7 | ) | (0.5 | ) | ||||
% to net sales | 31.9 | 28.5 | ||||||||
Consolidated less divested GCM - $ | 148,234 | 149,147 | (913 | ) | (2,540 | ) | 1,627 | |||
Consolidated less divested GCM - % change | (0.6 | ) | (1.7 | ) | 1.1 | |||||
% to net sales | 31.9 | 29.0 | ||||||||
For the quarter, the decrease in SG&A expense, excluding the sale of GCM and the impact of foreign exchange, was primarily driven by reduced product liability and employment costs partially offset by increased foreign currency transactions.
Year-to-date, the increase in SG&A expense, excluding the sale of GCM and the impact of foreign exchange, was primarily driven by increased foreign currency transactions partially offset by reduced employment and product liability costs.
SG&A expense drivers by segment:
Europe - For the quarter, SG&A expenses decreased by 0.5%, or $154,000, compared to the same period last year with foreign currency translation decreasing SG&A expenses by approximately $1,441,000, or 4.7%. Constant currency SG&A expenses increased by $1,287,000, or 4.2%. Year-to-date, SG&A expenses increased by 0.9%, or $512,000, compared to the same period last year with foreign currency translation decreasing SG&A expenses by approximately $2,652,000, or 4.4%. Constant currency SG&A expenses increased by $3,164,000, or 5.3%. The increase in expense for the quarter and year-to-date is primarily attributable to increased employment costs and foreign currency transactions.
NA/HME - For the quarter, SG&A expenses decreased 6.4%, or $2,224,000, compared to the same period last year with foreign currency translation having an immaterial impact. Constant currency SG&A expenses decreased $2,077,000, or 6.0%. Excluding the impact of the divested GCM business and
foreign currency translation impact, constant currency SG&A expense decreased by $936,000 or 2.8% driven primarily by decreased employment and product liability costs. The reduction in employment costs included a reduction in bonus expense. Year-to-date, SG&A expenses decreased 3.4%, or $2,286,000, compared to the same period last year with foreign currency translation having an immaterial impact. Constant currency SG&A expenses decreased $2,191,000, or 3.3%. Excluding the impact of the divested GCM business, constant currency SG&A expense increased by $218,000 or 0.3% driven primarily by unfavorable foreign currency transactions, partially offset by decreased employment and product liability costs.
IPG - For the quarter, SG&A expenses for IPG decreased by 4.7%, or $133,000, compared to the same period last year with foreign currency translation having an immaterial impact. Constant currency SG&A expenses decreased by $128,000 or 4.5%. Year-to-date, SG&A expenses for IPG decreased by 8.5% or $510,000, compared to the same period last year with foreign currency translation having an immaterial impact. Constant currency SG&A expenses decreased by $512,000 or 8.5%. The decline in expense for the quarter and year-to-date was primarily related to employment costs.
8
MD&A | SG&A | |
Asia/Pacific - For the quarter, SG&A expenses decreased 10.4%, or $429,000, compared to the same period last year with foreign currency translation increasing SG&A expenses by $27,000, or 0.7 percentage points. Constant currency SG&A expenses decreased by $456,000, or 11.1%. Year-to-date, SG&A expenses decreased 6.0%, or $470,000, compared to the same period last year with foreign currency translation increasing SG&A expenses by $205,000, or 2.6%. Constant currency SG&A expenses decreased $675,000, or 8.6%. The decline in expense for the quarter and year-to-date was primarily related to employment costs and foreign currency transactions.
Other - For the quarter, SG&A expenses decreased by 1.0%, or $61,000, compared to the same period last year primarily driven by declines in legal expense and employment costs, primarily related to reduced bonus expense, partially offset by increased equity compensation expense. Year-to-date, SG&A expenses decreased by 5.0%, or $568,000, compared to the same period last year primarily driven by decline in legal expense, partially offset by increased equity compensation expense.
9
MD&A | Operating Income (Loss) | |
OPERATING INCOME (LOSS)
($ in thousands USD) | Q2 17 | Q2 16 | $ Change | % Change | YTD Q2 17 | YTD Q2 16 | $ Change | % Change | |||||||||
Europe | 7,077 | 6,949 | 128 | 1.8 | 12,177 | 12,912 | (735 | ) | (5.7 | ) | |||||||
NA/HME | (12,395 | ) | (6,649 | ) | (5,746 | ) | (86.4 | ) | (21,821 | ) | (13,058 | ) | (8,763 | ) | (67.1 | ) | |
IPG | 1,472 | 1,532 | (60 | ) | (3.9 | ) | 3,370 | 2,956 | 414 | 14.0 | |||||||
Asia/Pacific | (118 | ) | (337 | ) | 219 | 65.0 | (548 | ) | (1,040 | ) | 492 | 47.3 | |||||
All Other | (6,735 | ) | (6,622 | ) | (113 | ) | (1.7 | ) | (11,245 | ) | (11,871 | ) | 626 | 5.3 | |||
Charges related to restructuring activities | (4,987 | ) | (689 | ) | (4,298 | ) | (623.8 | ) | (8,270 | ) | (791 | ) | (7,479 | ) | (945.5 | ) | |
Consolidated Operating Loss | (15,686 | ) | (5,816 | ) | (9,870 | ) | (169.7 | ) | (26,337 | ) | (10,892 | ) | (15,445 | ) | (141.8 | ) | |
For the quarter and year-to-date, the increase in consolidated operating loss was significantly impacted by an increase in restructuring charges and increased segment operating losses primarily related to volume declines and unfavorable foreign currency partially offset by reduced warranty expense, freight and employment costs.
Operating income (loss) by segment:
Europe - For the quarter, operating income increased compared to the same period last year primarily related to reduced warranty expense partially offset by unfavorable foreign exchange and increased employment costs. Year-to-date, operating income decreased compared to the same period last year primarily related to unfavorable foreign currency, increased R&D expense, increased employment costs partially offset by increased constant currency net sales and reduced warranty expense.
NA/HME - For the quarter, operating loss increased compared to the same period last year primarily related to net sales declines and unfavorable manufacturing costs partially offset by favorable sales mix and reduced employment, warranty and freight expense. In addition, the second quarter of 2016 included approximately $750,000 in operating income for GCM. Year-to-date, operating loss increased compared to the same period last year primarily related to net sales declines partially offset by favorable sales mix and reduced employment, warranty and freight expense. In addition, the first six months of 2016 included $1,532,000 in operating income for GCM.
IPG - For the quarter, operating income decreased as compared to the same period last year primarily related to net sales declines partially offset by reduced SG&A expense, primarily due to lower employment costs. Year-to-date, operating income increased as compared to the same period last year primarily related to reduced SG&A, warranty and freight expense partially offset by net sales declines.
Asia/Pacific - For the quarter, operating loss decreased as compared to the same period last year primarily related to reduced employment costs, favorable foreign currency and favorable sales mix partially offset by net sales declines. Year-to-date, operating loss decreased as compared to the same period last year primarily related to increased net sales, favorable sales mix and reduced SG&A partially offset by increased research and development costs.
All Other - For the quarter, operating loss increase was primarily impacted by increased intercompany profit in inventory elimination as result of higher inventory levels. Year-to-date, operating loss was impacted by reduced SG&A expense.
Charge Related to Restructuring Activities
Restructuring charges recorded in 2017 were primarily related to previously disclosed facility closures and reduction in force actions in each of the segments.
Restructuring charges totaled $8,270,000 in the first six months of 2017 related to severance and contract terminations in the NA/HME segment ($6,170,000) and severance in the Europe ($1,204,000) and Asia/Pacific ($896,000) segments. Charges in the NA/HME segment include the impact of the June 2017 closure of the company’s Suzhou, China, manufacturing facility, which is expected to generate approximately $4,000,000 in annualized pre-tax savings for the segment.
In the first six months of 2016, the company incurred restructuring charges of $791,000 related principally to severance costs incurred in the NA/HME segment ($723,000) and the Asia/Pacific segment ($68,000). Most of the outstanding restructuring accruals at June 30, 2017 are expected to be paid out in the next twelve months.
10
MD&A | Other Items | |
OTHER ITEMS
Net Gain (Loss) on Convertible Debt Derivatives
($ in thousands USD) | Change in Fair Value - Gain (Loss) | |||||||
Q2 17 | Q2 16 | YTD Q2 17 | YTD Q2 16 | |||||
Convertible Note Hedge Assets | 11,591 | (6,079 | ) | 5,761 | (4,757 | ) | ||
Convertible Debt Conversion Liabilities | (12,642 | ) | 6,565 | (5,911 | ) | 5,847 | ||
Net gain (loss) on convertible debt derivatives | (1,051 | ) | 486 | (150 | ) | 1,090 | ||
The company recognized net losses of $1,051,000 and $150,000 for the three and six months ended June 30, 2017, respectively, compared to net gains of $486,000 and $1,090,000 for the three and six months ended June 30, 2016, respectively, related to the fair value of convertible debt derivatives. See "Long-Term Debt" in the notes to the Consolidated Financial Statements included elsewhere in this report for more detail.
Interest
($ in thousands USD) | Q2 17 | Q2 16 | $ Change | % Change | ||||
Interest Expense | 4,645 | 4,374 | 271 | 6.2 | ||||
Interest Income | (49 | ) | (74 | ) | 25 | (33.8 | ) | |
($ in thousands USD) | YTD Q2 17 | YTD Q2 16 | $ Change | % Change | |||
Interest Expense | 9,163 | 6,747 | 2,416 | 35.8 | |||
Interest Income | (137 | ) | (128 | ) | (9 | ) | 7.0 |
The increase in interest expense for the quarter and year to date as compared to the same periods last year was primarily due to the issuance of convertible notes in the first quarter of 2016 and second quarter of 2017.
Income Taxes
The company had an effective tax rate of 10.2% and 13.4% on losses before income tax for the three and six months ended June 30, 2017, respectively, and an effective tax rate of 20.2% and 23.0% for the three and six months ended June 30, 2016, respectively, compared to an expected benefit at the U.S. statutory rate of 35% on the pre-tax losses for each period. The company's effective tax rate for the three and six months ended June 30, 2017 and June 30, 2016 was unfavorable as compared to the U.S. federal statutory rate expected benefit, principally due to the negative impact of the company's inability to record tax benefits related to the significant losses in countries which had tax valuation allowances. The effective tax rate was reduced by certain taxes outside the United States, excluding countries with tax valuation allowances, that were at an effective rate lower than the U.S. statutory rate. During 2016, installment payments were made in the first quarter related to a previously disclosed liability for uncertain tax positions, and subsequent to the end of the first quarter, the company accelerated and paid the balance of the installment obligation to reduce interest costs.
Installment payments were made in the first half of 2016 related to a previously disclosed liability for uncertain tax positions and current taxes payable, and during the second quarter of 2016, the company accelerated and paid the balance of the installment obligation to reduce interest costs.
11
MD&A | Liquidity and Capital Resources | |
LIQUIDITY AND CAPITAL RESOURCES
The company continues to maintain an adequate liquidity position through its cash balances and unused bank lines of credit (see Long-Term Debt in the Notes to Condensed Consolidated Financial Statements included in this report).
Key balances on the company's balance sheet and related metrics:
($ in thousands USD) | June 30, 2017 | December 31, 2016 | $ Change | % Change | |||
Cash and cash equivalents | 160,082 | 124,234 | 35,848 | 28.9 | |||
Working capital (1) | 263,434 | 188,211 | 75,223 | 40.0 | |||
Total debt (2) | 302,555 | 196,501 | 106,054 | 54.0 | |||
Long-term debt (2) | 300,396 | 181,240 | 119,156 | 65.7 | |||
Total shareholders' equity | 425,621 | 422,387 | 3,234 | 0.8 | |||
Credit agreement borrowing availability (3) | 44,588 | 44,260 | 328 | 0.7 | |||
(1) | Current assets less current liabilities. |
(2) | Long-term debt and Total debt exclude debt issuance costs recognized as a deduction from the carrying amount of that debt liability and debt discounts classified as debt or equity. |
(3) | The change in borrowing capacity is due to changes in the calculated borrowing base. |
The company's total debt outstanding, inclusive of the debt discount related to the convertible senior subordinated debentures due 2027 included in equity in accordance with FSB APB 14-1 as well as the debt discount and fees associated with the company's Convertible Senior Notes due 2021, increased by $106,054,000 to $302,555,000 at June 30, 2017 from $196,501,000 as of December 31, 2016. The debt increase during first six months of 2017 was principally a result of the company's second quarter 2017 issuance of $120,000,000 principal amount of 4.50% Convertible Senior Notes due 2022 (the "2022 Notes") partially offset by the $13,350,000 repurchase of all of the outstanding principal amount of 4.125% Convertible Senior Subordinated Debentures due 2027 (the "2027 Debentures") as the holders exercised their February 1, 2017 right to require the company to repurchase their 2027 Debentures. See "Long-Term Debt" in the Notes to Condensed Consolidated Financial Statements for more details regarding the company's convertible notes.
The company's cash balances were utilized for normal operations and debt repayment during the six-month period ended June 30, 2017. Debt repayments, acquisitions, divestitures, the timing of vendor payments, the timing of customer rebate payments, the granting of extended payment terms to significant national accounts and other activity can have a significant impact on the company's cash flow and borrowings outstanding such that the debt reported at the end of a given period may be materially different than debt levels during a given period. While the company maintains cash balances in various jurisdictions around the world, there are no material restrictions regarding the use of such cash for dividends within the company, loans or other purposes, except in China where the cash balance, as of June 30, 2017, was $3,155,000.
Based on the company's current expectations, the company believes that its cash balances and available borrowing capacity under its credit facilities should be sufficient to meet working capital needs, capital requirements, and commitments for at least the next twelve months. Notwithstanding the company's expectations, if the company's operating results decline as the result of pressures on the business due to, for example, currency fluctuations or regulatory issues or the company's failure to execute its business plans or if the company's transformation takes longer than expected, the company may require additional financing, or may be unable to comply with its obligations under the credit facilities, and its lenders could demand repayment of any amounts outstanding under the company's credit facilities.
The company also has an agreement with De Lage Landen, Inc. (“DLL”), a third-party financing company, to provide lease financing to the company's U.S. customers. Either party could terminate this agreement with 180 days' notice or 90 days' notice by DLL upon the occurrence of certain events. Should this agreement be terminated, the company's borrowing needs under its credit facilities could increase.
While there is general concern about the potential for rising interest rates, the company expects that it will be able to absorb modest rate increases in the months ahead without any material impact on its liquidity or capital resources. As of June 30, 2017, the weighted average floating interest rate on revolving credit borrowings, excluding capital leases, was 4.95% compared to 4.85% as of December 31, 2016.
See "Long-Term Debt" in the Notes to the Consolidated Financial Statements for more details regarding the company's credit facilities.
12
MD&A | Liquidity and Capital Resources | |
CAPITAL EXPENDITURES
The company estimates that capital investments for 2017 could approximate between $10,000,000 and $15,000,000, compared to actual capital expenditures of $10,151,000 in 2016. The estimated increase reflects the company's anticipated investments to transform the company. The terms of the company's credit facilities limit the company's annual capital expenditures to $35,000,000. As of June 30, 2017, the company has material capital expenditure commitments outstanding, consisting primarily of computer systems contracts. See Item 7. Contractual Obligations of the company's Annual Report on Form 10-K for the year ended December 31, 2016.
DIVIDEND POLICY
On May 18, 2017, the company's Board of Directors declared a quarterly cash dividend of $0.0125 per Common Share and $0.011364 per Class B Common Share to shareholders of record as of July 3, 2017, which was paid on July 14, 2017. At the current rate, the cash dividend will amount to $0.05 per Common Share and $0.045 per Class B Common Share on an annual basis, subject to Board of Directors approval of future dividend payments.
13
MD&A | Cash Flows | |
CASH FLOWS
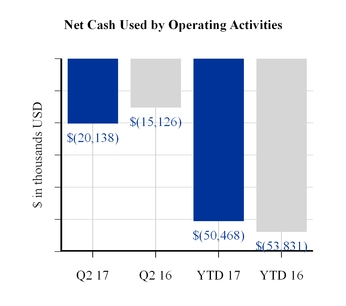
The cash used by operating activities in the first six months of 2017 was driven by net loss and increases in inventory and accounts receivable and reductions in accrued expenses and accounts payable. The decrease in cash used by operating activities in the first six months of 2017 compared to the same period last year was principally due to improvements in some working capital components, which were principally offset by a significantly higher net loss.
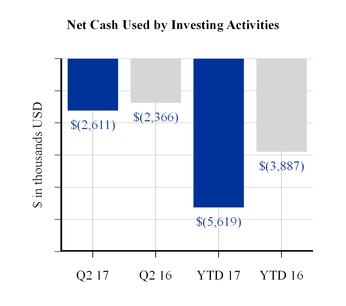
The increase in cash flows used by investing activities for the first six months of 2017 as compared to the same period last year was primarily related to an increase in capital expenditures.
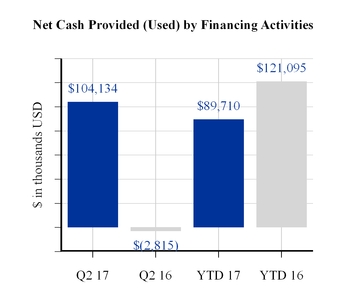
Cash flows provided by financing activities in the first six months of 2017 reflect net proceeds received due to the issuance of the company's Convertible Senior Notes due 2022, including the net proceeds used for the related convertible note hedge transactions and payment of financing costs. These proceeds were partially offset by the repayment of $13,350,000 in aggregate principal amount of the 2027 Debentures. Cash flows provided by financing activities in the first six months of 2016 reflect net proceeds received due to the issuance of the company's Convertible Senior Notes due 2021, including the net proceeds used for the related convertible note hedge transactions, repurchase of common shares and payment of financing costs.
14
MD&A | Cash Flows | |
Free cash flow is a non-GAAP financial measure and is reconciled to the corresponding GAAP measure as follows:
($ in thousands USD) | Three Months Ended | Six Months Ended | |||||||||||||
2017 | 2016 | 2017 | 2016 | ||||||||||||
Net cash used by operating activities | (20,138 | ) | (15,126 | ) | (50,468 | ) | (53,831 | ) | |||||||
Plus: Sales or property and equipment | 180 | 16 | 190 | 20 | |||||||||||
Less: Purchases of property and equipment | (2,470 | ) | (2,339 | ) | (5,504 | ) | (3,803 | ) | |||||||
Free Cash Flow | $ | (22,428 | ) | $ | (17,449 | ) | $ | (55,782 | ) | $ | (57,614 | ) | |||
Free cash flow for the first six months 2017 and 2016 was negatively impacted by the same items that affected cash flows used by operating activities. Free cash flow is a non-GAAP financial measure that is comprised of net cash used by operating activities less purchases of property and equipment plus proceeds from sales of property and equipment. Management believes that this financial measure provides meaningful information for evaluating the overall financial performance of the company and its ability to repay debt or make future investments (including acquisitions, etc.).
The company's approximate cash conversion days at June 30, 2017, December 31, 2016 and June 30, 2016 are as follows:
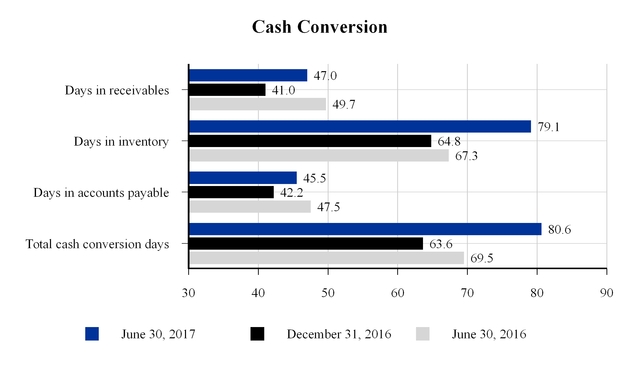
Days in receivables are equal to current quarter net current receivables divided by trailing four quarters of net sales multiplied by 365 days. Days in inventory and accounts payable are equal to current quarter net inventory and accounts payable, respectively, divided by trailing four quarters of cost of sales multiplied by 365 days. Total cash conversion days are equal to days in receivables plus days in inventory less days in accounts payable. The days in inventory increase from December 31, 2016 was due to lower than expected net sales and inventory build related to plant closures.
15
MD&A | Accounting Estimates and Pronouncements | |
ACCOUNTING ESTIMATES AND PRONOUNCEMENTS
CRITICAL ACCOUNTING ESTIMATES
The Consolidated Financial Statements included in the report include accounts of the company and all majority-owned subsidiaries. The preparation of financial statements in conformity with accounting principles generally accepted in the United States requires management to make estimates and assumptions in certain circumstances that affect amounts reported in the accompanying Consolidated Financial Statements and related footnotes. In preparing the financial statements, management has made its best estimates and judgments of certain amounts included in the financial statements, giving due consideration to materiality. However, application of these accounting policies involves the exercise of judgment and use of assumptions as to future uncertainties and, thus, actual results could differ from these estimates. Please refer to the Critical Accounting Estimates section within MD&A of company's Annual Report on Form 10-K for the period ending December 31, 2016.
RECENTLY ISSUED ACCOUNTING PRONOUNCEMENTS
For the company’s disclosure regarding recently issued accounting pronouncements, see Accounting Policies - Recent Accounting Pronouncements in the Notes to the Consolidated Financial Statements contained in this Quarterly Report on Form 10-Q.
16
MD&A | Forward-Looking Statements | |
FORWARD-LOOKING STATEMENTS
This Form 10-Q contains forward-looking statements within the meaning of the “Safe Harbor” provisions of the Private Securities Litigation Reform Act of 1995. Terms such as “will,” “should,” “could,” “plan,” “intend,” “expect,” “continue,” “believe” and “anticipate,” as well as similar comments, denote forward-looking statements that are subject to inherent uncertainties that are difficult to predict. Actual results and events may differ significantly from those expressed or anticipated as a result of risks and uncertainties, which include, but are not limited to, the following: adverse effects of the company’s consent decree of injunction with the U.S. Food and Drug Administration (FDA), including but not limited to, compliance costs, inability to bid on or win certain contracts, inability to rebuild negatively impacted customer relationships, unabsorbed capacity utilization, including fixed costs and overhead; any circumstances or developments that might adversely impact the third-party expert auditor’s required audits of the company’s quality systems at the facilities impacted by the consent decree, including any possible failure to comply with the consent decree or FDA regulations; regulatory proceedings or the company's failure to comply with regulatory requirements or receive regulatory clearance or approval for the company's products or operations in the United States or abroad; adverse effects of regulatory or governmental inspections of company facilities at any time and governmental enforcement actions; circumstances or developments that may make the company unable to implement or realize the anticipated benefits, or that may increase the costs, of its current business initiatives; possible adverse effects on the company's liquidity that may result from delays in the implementation or realization of benefits of its current business initiatives; product liability or warranty claims; product recalls, including more extensive warranty or recall experience than expected; possible adverse effects of being leveraged, including interest rate or event of default risks; exchange rate fluctuations, particularly in light of the relative importance of the company's foreign operations to its overall financial performance and including the existing and potential impacts from the Brexit referendum; potential impacts of the United States administration’s policies, and any legislation or regulations that may result from those policies, and of new United States tax laws, rules, regulations or policies, such as possible border-adjusted taxes on imported goods; legal actions, including adverse judgments or settlements of litigation or claims in excess of available insurance limits; adverse changes in government and other third-party payor reimbursement levels and practices both in the U.S. and in other countries (such as, for example, more extensive pre-payment reviews and post-payment audits by payors, or the continuing impact of the Medicare National Competitive U.S. Bidding program); ineffective cost reduction and restructuring efforts or inability to realize anticipated cost savings or achieve desired efficiencies from such efforts; delays, disruptions or excessive costs incurred in facility closures or consolidations; tax rate fluctuations; additional tax expense or additional tax exposures, which could affect the company's future profitability and cash flow;
inability to design, manufacture, distribute and achieve market acceptance of new products with greater functionality or new product platforms that deliver the anticipated benefits; consolidation of health care providers; lower cost imports; uncollectible accounts receivable; difficulties in implementing/upgrading Enterprise Resource Planning systems; risk of cybersecurity attack, data breach or data loss and/or delays in or inability to recover or restore data and IT systems; risks inherent in managing and operating businesses in many different foreign jurisdictions; decreased availability or increased costs of materials which could increase the company's costs of producing or acquiring the company's products, including possible increases in commodity costs or freight costs; heightened vulnerability to a hostile takeover attempt or other shareholder activism; provisions of Ohio law or in the company's debt agreements, charter documents or other agreements that may prevent or delay a change in control, as well as the risks described from time to time in the company's reports as filed with the Securities and Exchange Commission. Except to the extent required by law, the company does not undertake and specifically declines any obligation to review or update any forward-looking statements or to publicly announce the results of any revisions to any of such statements to reflect future events or developments or otherwise.
17
Financial Statements | ||
Part I. FINANCIAL INFORMATION
Item 1. Financial Statements.
INVACARE CORPORATION AND SUBSIDIARIES
Condensed Consolidated Statement of Comprehensive Income (Loss) (unaudited)
(In thousands, except per share data) | Three Months Ended June 30, | Six Months Ended June 30, | |||||||||||||
2017 | 2016 | 2017 | 2016 | ||||||||||||
Net sales | $ | 233,517 | $ | 275,037 | $ | 465,240 | $ | 532,589 | |||||||
Cost of products sold | 168,495 | 201,442 | 335,073 | 391,134 | |||||||||||
Gross Profit | 65,022 | 73,595 | 130,167 | 141,455 | |||||||||||
Selling, general and administrative expenses | 75,721 | 78,722 | 148,234 | 151,556 | |||||||||||
Charges related to restructuring activities | 4,987 | 689 | 8,270 | 791 | |||||||||||
Operating Loss | (15,686 | ) | (5,816 | ) | (26,337 | ) | (10,892 | ) | |||||||
Net loss (gain) on convertible debt derivatives | 1,051 | (486 | ) | 150 | (1,090 | ) | |||||||||
Interest expense | 4,645 | 4,374 | 9,163 | 6,747 | |||||||||||
Interest income | (49 | ) | (74 | ) | (137 | ) | (128 | ) | |||||||
Loss Before Income Taxes | (21,333 | ) | (9,630 | ) | (35,513 | ) | (16,421 | ) | |||||||
Income tax provision | 2,175 | 1,950 | 4,775 | 3,775 | |||||||||||
Net Loss | $ | (23,508 | ) | $ | (11,580 | ) | $ | (40,288 | ) | $ | (20,196 | ) | |||
Dividends Declared per Common Share | $ | 0.0125 | $ | 0.0125 | $ | 0.0250 | $ | 0.0250 | |||||||
Net Loss per Share—Basic | $ | (0.72 | ) | $ | (0.36 | ) | $ | (1.23 | ) | $ | (0.63 | ) | |||
Weighted Average Shares Outstanding—Basic | 32,833 | 32,176 | 32,654 | 32,274 | |||||||||||
Net Loss per Share—Assuming Dilution | $ | (0.72 | ) | $ | (0.36 | ) | $ | (1.23 | ) | $ | (0.63 | ) | |||
Weighted Average Shares Outstanding—Assuming Dilution | 33,193 | 32,530 | 32,947 | 32,572 | |||||||||||
Net Loss | $ | (23,508 | ) | $ | (11,580 | ) | $ | (40,288 | ) | $ | (20,196 | ) | |||
Other comprehensive income (loss): | |||||||||||||||
Foreign currency translation adjustments | 26,311 | 10,307 | 27,260 | 21,076 | |||||||||||
Defined Benefit Plans: | |||||||||||||||
Amortization of prior service costs and unrecognized gains | (426 | ) | (6 | ) | (721 | ) | (196 | ) | |||||||
Deferred tax adjustment resulting from defined benefit plan activity | 15 | (11 | ) | 12 | (27 | ) | |||||||||
Valuation reserve associated with defined benefit plan activity | (15 | ) | 11 | (12 | ) | 27 | |||||||||
Current period unrealized loss on cash flow hedges | (1,907 | ) | (2,559 | ) | (1,276 | ) | (1,394 | ) | |||||||
Deferred tax loss related to unrealized loss on cash flow hedges | 271 | 292 | 105 | 89 | |||||||||||
Other Comprehensive Income | 24,249 | 8,034 | 25,368 | 19,575 | |||||||||||
Comprehensive Income (Loss) | $ | 741 | $ | (3,546 | ) | $ | (14,920 | ) | $ | (621 | ) | ||||
See notes to condensed consolidated financial statements.
18
Financial Statements | ||
INVACARE CORPORATION AND SUBSIDIARIES
Condensed Consolidated Balance Sheets (unaudited)
June 30, 2017 | December 31, 2016 | ||||||
(In thousands) | |||||||
Assets | |||||||
Current Assets | |||||||
Cash and cash equivalents | $ | 160,082 | $ | 124,234 | |||
Trade receivables, net | 124,632 | 116,307 | |||||
Installment receivables, net | 1,573 | 1,368 | |||||
Inventories, net | 153,418 | 135,644 | |||||
Other current assets | 31,310 | 31,519 | |||||
Total Current Assets | 471,015 | 409,072 | |||||
Other Assets | 60,279 | 29,687 | |||||
Intangibles | 29,771 | 29,023 | |||||
Property and Equipment, net | 76,607 | 75,359 | |||||
Goodwill | 380,560 | 360,602 | |||||
Total Assets | $ | 1,018,232 | $ | 903,743 | |||
Liabilities and Shareholders’ Equity | |||||||
Current Liabilities | |||||||
Accounts payable | $ | 88,227 | $ | 88,236 | |||
Accrued expenses | 110,509 | 110,095 | |||||
Current taxes payable | 6,686 | 7,269 | |||||
Short-term debt and current maturities of long-term obligations | 2,159 | 15,261 | |||||
Total Current Liabilities | 207,581 | 220,861 | |||||
Long-Term Debt | 235,742 | 146,088 | |||||
Other Long-Term Obligations | 149,288 | 114,407 | |||||
Shareholders’ Equity | |||||||
Preferred Shares (Authorized 300 shares; none outstanding) | — | — | |||||
Common Shares (Authorized 100,000 shares; 36,546 and 35,318 issued and outstanding in 2017 and 2016, respectively)—no par | 9,270 | 8,974 | |||||
Class B Common Shares (Authorized 12,000 shares; 18 and 729 shares issued and outstanding in 2017 and 2016, respectively)—no par | 5 | 183 | |||||
Additional paid-in-capital | 286,201 | 266,151 | |||||
Retained earnings | 225,063 | 266,144 | |||||
Accumulated other comprehensive income (loss) | 6,033 | (19,335 | ) | ||||
Treasury shares (3,698 and 3,616 shares in 2017 and 2016, respectively) | (100,951 | ) | (99,730 | ) | |||
Total Shareholders’ Equity | 425,621 | 422,387 | |||||
Total Liabilities and Shareholders’ Equity | $ | 1,018,232 | $ | 903,743 | |||
See notes to condensed consolidated financial statements.
19
Financial Statements | ||
INVACARE CORPORATION AND SUBSIDIARIES
Condensed Consolidated Statement of Cash Flows (unaudited)
For the Six Months Ended June 30, | |||||||
2017 | 2016 | ||||||
Operating Activities | (In thousands) | ||||||
Net loss | $ | (40,288 | ) | $ | (20,196 | ) | |
Adjustments to reconcile net loss to net cash provided by operating activities: | |||||||
Depreciation and amortization | 7,312 | 7,269 | |||||
Provision for losses on trade and installment receivables | 500 | 167 | |||||
Benefit for deferred income taxes | (759 | ) | (165 | ) | |||
Provision for other deferred liabilities | 400 | 232 | |||||
Provision for stock-based compensation | 4,646 | 4,025 | |||||
Loss (gain) on disposals of property and equipment | (91 | ) | 48 | ||||
Amortization of convertible debt discount | 3,451 | 2,221 | |||||
Amortization of debt fees | 985 | 909 | |||||
Loss (gain) on convertible debt derivatives | 150 | (1,090 | ) | ||||
Changes in operating assets and liabilities: | |||||||
Trade receivables | (5,396 | ) | (11,473 | ) | |||
Installment sales contracts, net | (186 | ) | (1,011 | ) | |||
Inventories | (13,095 | ) | (11,788 | ) | |||
Other current assets | 1,262 | (1,244 | ) | ||||
Accounts payable | (2,376 | ) | (3,426 | ) | |||
Accrued expenses | (5,851 | ) | (14,132 | ) | |||
Other long-term liabilities | (1,132 | ) | (4,177 | ) | |||
Net Cash Used by Operating Activities | (50,468 | ) | (53,831 | ) | |||
Investing Activities | |||||||
Purchases of property and equipment | (5,504 | ) | (3,803 | ) | |||
Proceeds from sale of property and equipment | 190 | 20 | |||||
Change in other long-term assets | (218 | ) | (115 | ) | |||
Other | (87 | ) | 11 | ||||
Net Cash Used by Investing Activities | (5,619 | ) | (3,887 | ) | |||
Financing Activities | |||||||
Proceeds from revolving lines of credit and long-term borrowings | 95,220 | 121,976 | |||||
Payments on revolving lines of credit and long-term borrowings | (14,881 | ) | (1,655 | ) | |||
Proceeds from exercise of stock options | 1,429 | 17 | |||||
Payment of financing costs | (4,144 | ) | (5,531 | ) | |||
Payment of dividends | (793 | ) | (790 | ) | |||
Issuance of warrants | 14,100 | 12,376 | |||||
Purchase of treasury stock | (1,221 | ) | (5,298 | ) | |||
Net Cash Provided by Financing Activities | 89,710 | 121,095 | |||||
Effect of exchange rate changes on cash | 2,225 | 1,873 | |||||
Increase in cash and cash equivalents | 35,848 | 65,250 | |||||
Cash and cash equivalents at beginning of year | 124,234 | 60,055 | |||||
Cash and cash equivalents at end of period | $ | 160,082 | $ | 125,305 | |||
See notes to condensed consolidated financial statements.
20
Notes to Financial Statements | Accounting Policies | |
Accounting Policies
Principles of Consolidation:
The consolidated financial statements include the accounts of the company and its wholly owned subsidiaries and include all adjustments, which were of a normal recurring nature, necessary to present fairly the financial position of the company as of June 30, 2017 and the results of its operations and changes in its cash flow for the six months ended June 30, 2017 and 2016, respectively. Certain foreign subsidiaries, represented by the European segment, are consolidated using a May 31 quarter end to meet filing deadlines. No material subsequent events have occurred related to the European segment, which would require disclosure or adjustment to the company's financial statements. All significant intercompany transactions are eliminated. The results of operations for the three and six months ended June 30, 2017 are not necessarily indicative of the results to be expected for the full year.
Use of Estimates:
The consolidated financial statements are prepared in conformity with accounting principles generally accepted in the United States, which require management to make estimates and assumptions that affect the amounts reported in the financial statements and accompanying notes. Actual results may differ from these estimates.
Recent Accounting Pronouncements (Already Adopted):
In March 2016, the FASB issued ASU 2016-09, "Compensation – Stock Compensation: Topic 718: Improvements to Employee Share-Based Payment Accounting." ASU 2016-09 is intended to simplify several aspects of the accounting for share-based payment transactions, including the income tax consequences, classification of awards as either equity or liabilities, and classification on the statement of cash flows. The company adopted ASU 2016-09, effective January 1, 2017, which did not have a material impact on the company's financial statements.
In July 2015, the FASB issued ASU 2015-11, “Inventory (Topic 330): Simplifying the Measurement of Inventory,” to simplify the subsequent measurement of inventory. With effectiveness of this update, entities are required to subsequently measure inventory at the lower of cost or net realizable value rather than at the lower of cost or market. The company adopted ASU 2015-11, effective January 1, 2017, which did not have a material impact on the company's financial statements.
Recent Accounting Pronouncements (Not Yet Adopted):
In May 2014, the FASB issued ASU 2014-09, "Revenue from Contracts with Customers." ASU 2014-09 requires a company to recognize revenue when promised goods or services are transferred to customers in an amount that reflects the consideration to which the company expects to be entitled in exchange for those goods and services. The guidance requires five steps to be applied: 1) identify the contract(s) with customers, 2) identify the performance obligations in the contract, 3) determine the transaction price, 4) allocate the transaction price to the performance obligation in the contract and 5) recognize revenue when (or as) the entity satisfies a performance obligation. The guidance also requires both quantitative and qualitative disclosures, which are more comprehensive than existing revenue standards. The disclosures are intended to enable financial statement users to understand the nature, timing and uncertainty of revenue and the related cash flow. An entity can apply the new revenue standard retrospectively to each prior reporting period presented or retrospective with the cumulative effect of initially applying the standard recognized at the date of initial application in retained earnings. The new accounting guidance is effective for annual periods beginning after December 15, 2017, due to an approved one-year deferral, and early adoption is permitted. During 2016, the company completed a preliminary assessment of its contracts and is currently continuing its review of contracts and related accounting. Based on this review, the company does not expect this standard will have a material impact on the company's results of operations or cash flows in the periods after adoption. Pursuant to ASU 2014-09, revenues are recognized as control transfers to the customers, which is consistent with the current revenue recognition model and the current accounting for most of the company's contracts. The company expects to adopt the provisions of ASU 2014-09 on a modified retrospective basis through a cumulative effect adjustment to equity. The company will continue to evaluate the impact of ASU 2014-09, as well as any subsequent updates and clarifications, the possible impact of the standard on any new contracts entered into by the company through the date of adoption.
In February 2016, the FASB issued ASU 2016-02, "Leases." ASU 2016-02 requires lessees to put most leases on their balance sheet while recognizing expense in a manner similar to existing accounting. The new accounting guidance is effective for fiscal periods beginning after December 15, 2018 and early adoption is permitted. The company is currently reviewing the impact of the adoption of ASU 2016-02 on the company's financial statements.
21
Notes to Financial Statements | Accounting Policies | |
In June 2016, the FASB issued ASU 2016-13, "Measurement of Credit Losses on Financial Statements." ASU 2016-13 requires a new credit loss standard for most financial assets and certain other instruments. For example, entities will be required to use an "expected loss" model that will generally require earlier recognition of allowances for losses for trade receivables. The standard also requires additional disclosures, including disclosures regarding how an entity tracks credit quality. The amendments in the pronouncement are effective for fiscal years beginning after December 15, 2019, including interim periods within those fiscal years. Entities may early adopt the amendments as of fiscal years beginning after December 15, 2018, including interim periods within those fiscal years. The company is currently reviewing the impact of the adoption of ASU 2016-09 on the company's financial statements.
In January 2017, the FASB issued ASU 2017-04, "Intangibles - Goodwill and Other (Topic 350): Simplifying the Test for Goodwill Impairment". The guidance in ASU 2017-04 eliminates the requirement to determine the fair value of individual assets and liabilities of a reporting unit to measure goodwill impairment. Under the amendments in the new ASU, goodwill impairment testing will be performed by comparing the fair value of the reporting unit with its carrying amount and recognizing an impairment charge for the amount by which the carrying amount exceeds the reporting unit’s fair value. The new standard is effective for annual and interim goodwill impairment tests in fiscal years beginning after December 15, 2019, and should be applied on a prospective basis. Early adoption is permitted for annual or interim goodwill impairment testing performed after January 1, 2017. The company is currently reviewing the impact of the adoption of ASU 2017-04 but does not expect the adoption to impact the company's financial statements.
Reclassifications:
In 2016, the company redefined the measure by which it evaluates segment profit or loss to be segment operating profit (loss). The previous performance measure was earnings before income taxes. All prior periods presented were changed to reflect the new measure. During the first quarter of 2017, a subsidiary, formerly included in the Europe segment, transferred to the NA/HME segment as it is managed by the NA/HME segment manager effective January 1, 2017. The results for 2016 have been changed accordingly and for the three and six months ended June 30, 2016, the change increased revenues from external customers by $1,137,000 and $2,438,000, respectively, and operating loss by $43,000 and $150,000, respectively, for NA/HME with an offsetting impact for Europe.
The company has historically classified the amortization of debt issuance costs as a component of Selling, General and Administrative (SG&A) Expenses. During the second quarter of 2016, the company determined that it is more appropriate to classify this amortization as a component of Interest Expense. Therefore, interest expense for the three and six months ended June 30, 2016 was increased by $530,000 and $909,000, respectively, with a corresponding decrease to SG&A expenses. There was no change to Loss Before Income Taxes for any period presented.
22
Notes to Financial Statements | Divested Businesses | |
Divested Businesses
Operations Held for Sale
On September 30, 2016, the company completed the sale of its subsidiary, Garden City Medical Inc, a Delaware corporation and wholly-owned subsidiary (“GCM”), dba PMI and Pinnacle Medsource, to Compass Health Brands Corp., a Delaware corporation (the “Purchaser”), pursuant to a Share Purchase Agreement. GCM sourced and distributed primarily lifestyle products under the brand ProBasics™ by PMI. GCM was part of the NA/HME segment of the company. The price paid to the company for GCM was $13,829,000 in cash, and net proceeds from the transaction were $12,729,000, net of expenses. The company recorded a pre-tax gain of $7,386,000 in the third quarter of 2016, which represented the excess of the net sales price over the book value of the assets and liabilities of GCM. The sale of GCM was dilutive to the company's results. The company utilized the net proceeds to fund operations. The company determined that the sale of GCM did not meet the criteria for classification as a discontinued operation in accordance with ASU 2014-08 but the "held for sale" criteria of ASC 360-10-45-9 were met and thus GCM was treated as held for sale.
With the sale of GCM, the company entered into an agreement with the Purchaser for the Purchaser to buy, at cost, all ProBasics™ inventory capitalized on the balance sheets of certain Invacare subsidiaries which was not sold as part of the GCM sale on September 30, 2016. The value of the inventory sold was approximately $2,400,000 which was transferred to the Purchaser in the fourth quarter of 2016. Under the agreement, depending on certain conditions, the Purchaser may have until September 30, 2017 to pay for the inventory.
Prior to 2017, the company had recorded expenses related to the sale of all operations held for sale, including GCM, totaling $2,892,000, of which $1,643,000 has been paid out as of June 30, 2017.
Discontinued Operations
From 2012 through 2014, the company sold three businesses which were classified as discontinued operations. Prior to 2017, the company had recorded cumulative expenses related to the sale of discontinued operations totaling $8,801,000, of which $8,405,000 have been paid as of June 30, 2017.
23
Notes to Financial Statements | Current Assets | |
Current Assets
Receivables
Accounts receivable are reduced by an allowance for amounts that may become uncollectible in the future. Substantially all the company’s receivables are due from health care, medical equipment providers and long term care facilities located throughout the United States, Australia, Canada, New Zealand, China and Europe. A significant portion of products sold to providers, both foreign and domestic, are ultimately funded through government reimbursement programs such as Medicare and Medicaid in the U.S. Therefore, changes in these programs can have an adverse impact on dealer liquidity and profitability.
The estimated allowance for uncollectible amounts ($7,181,000 at June 30, 2017 and $6,916,000 at December 31, 2016) is based primarily on management’s evaluation of the financial condition of specific customers. In addition, due to the company's financing arrangement with De Lage Landen, Inc. ("DLL"), a third-party financing company with which the company has worked since 2000, management monitors the collection status of these contracts in accordance with the company’s limited recourse obligations and provides amounts necessary for estimated losses in the allowance for doubtful accounts and establishes reserves for specific customers as needed. The company writes off uncollectible trade accounts receivable after such receivables are moved to collection status and legal remedies are exhausted. See Concentration of Credit Risk in the Notes to the Consolidated Financial Statements for a description of the financing arrangement. Long-term installment receivables are included in “Other Assets” on the consolidated balance sheet.
The company’s U.S. customers electing to finance their purchases can do so using DLL. In addition, the company often provides financing directly for its Canadian customers for which DLL is not an option, as DLL typically provides financing to Canadian customers only on a limited basis. The installment receivables recorded on the books of the company represent a single portfolio segment of finance receivables to the independent provider channel and long-term care customers. The portfolio segment is comprised of two classes of receivables distinguished by geography and credit quality. The U.S. installment receivables are the first class and represent installment receivables re-purchased from DLL because the customers were in default. Default with DLL is defined as a customer being delinquent by three payments. The Canadian installment receivables represent the second class of installment receivables which were originally financed by the company because third party financing was not available to the HME providers. The Canadian installment receivables are typically
financed for twelve months and historically have had a very low risk of default.
The estimated allowance for uncollectible amounts and evaluation for impairment for both classes of installment receivables is based on the company’s quarterly review of the financial condition of each individual customer with the allowance for doubtful accounts adjusted accordingly. Installments are individually and not collectively reviewed for impairment. The company assesses the bad debt reserve levels based upon the status of the customer’s adherence to legally negotiated payment schedule and the company’s ability to enforce judgments, liens, etc.
For purposes of granting or extending credit, the company utilizes a scoring model to generate a composite score that considers each customer’s consumer credit score and/or D&B credit rating, payment history, security collateral and time in business. Additional analysis is performed for most customers desiring credit greater than $250,000, which generally includes a detailed review of the customer’s financial statements as well as consideration of other factors such as exposure to changing reimbursement laws.
Interest income is recognized on installment receivables based on the terms of the installment agreements. Installment accounts are monitored and if a customer defaults on payments and is moved to collection, interest income is no longer recognized. Subsequent payments received once an account is put on non-accrual status are generally first applied to the principal balance and then to the interest. Accruing of interest on collection accounts would only be restarted if the account became current again.
All installment accounts are accounted for using the same methodology regardless of the duration of the installment agreements. When an account is placed in collection status, the company goes through a legal process for pursuing collection of outstanding amounts, the length of which typically approximates eighteen months. Any write-offs are made after the legal process has been completed. The company has not made any changes to either its accounting policies or methodology to estimate allowances for doubtful accounts in the last twelve months.
24
Notes to Financial Statements | Current Assets | |
Installment receivables consist of the following (in thousands):
June 30, 2017 | December 31, 2016 | ||||||||||||||||||||||
Current | Long- Term | Total | Current | Long- Term | Total | ||||||||||||||||||
Installment receivables | $ | 2,115 | $ | 2,772 | $ | 4,887 | $ | 2,027 | $ | 2,685 | $ | 4,712 | |||||||||||
Less: Unearned interest | (33 | ) | — | (33 | ) | (40 | ) | — | (40 | ) | |||||||||||||
2,082 | 2,772 | 4,854 | 1,987 | 2,685 | 4,672 | ||||||||||||||||||
Allowance for doubtful accounts | (509 | ) | (1,959 | ) | (2,468 | ) | (619 | ) | (2,219 | ) | (2,838 | ) | |||||||||||
Installment receivables, net | $ | 1,573 | $ | 813 | $ | 2,386 | $ | 1,368 | $ | 466 | $ | 1,834 | |||||||||||
Installment receivables purchased from DLL during the six months ended June 30, 2017 increased the gross installment receivables balance by $696,000. No sales of installment receivables were made by the company during the quarter.
The movement in the installment receivables allowance for doubtful accounts was as follows (in thousands):
Six Months Ended June 30, 2017 | Year Ended December 31, 2016 | ||||||
Balance as of beginning of period | $ | 2,838 | $ | 2,792 | |||
Current period provision (benefit) | (341 | ) | 1,220 | ||||
Direct write-offs charged against the allowance | (29 | ) | (1,174 | ) | |||
Balance as of end of period | $ | 2,468 | $ | 2,838 | |||
Installment receivables by class as of June 30, 2017 consist of the following (in thousands):
Total Installment Receivables | Unpaid Principal Balance | Related Allowance for Doubtful Accounts | Interest Income Recognized | ||||||||||||
U.S. | |||||||||||||||
Impaired installment receivables with a related allowance recorded | $ | 4,103 | $ | 4,103 | $ | 2,358 | $ | — | |||||||
Canada | |||||||||||||||
Non-Impaired installment receivables with no related allowance recorded | 674 | 641 | — | 39 | |||||||||||
Impaired installment receivables with a related allowance recorded | 110 | 110 | 110 | — | |||||||||||
Total Canadian installment receivables | 784 | 751 | 110 | 39 | |||||||||||
Total | |||||||||||||||
Non-Impaired installment receivables with no related allowance recorded | 674 | 641 | — | 39 | |||||||||||
Impaired installment receivables with a related allowance recorded | 4,213 | 4,213 | 2,468 | — | |||||||||||
Total installment receivables | $ | 4,887 | $ | 4,854 | $ | 2,468 | $ | 39 | |||||||
25
Notes to Financial Statements | Current Assets | |
Installment receivables by class as of December 31, 2016 consist of the following (in thousands):
Total Installment Receivables | Unpaid Principal Balance | Related Allowance for Doubtful Accounts | Interest Income Recognized | ||||||||||||
U.S. | |||||||||||||||
Impaired installment receivables with a related allowance recorded | $ | 3,762 | $ | 3,762 | $ | 2,706 | $ | — | |||||||
Canada | |||||||||||||||
Non-Impaired installment receivables with no related allowance recorded | 818 | 778 | — | 65 | |||||||||||
Impaired installment receivables with a related allowance recorded | 132 | 132 | 132 | — | |||||||||||
Total Canadian installment receivables | 950 | 910 | 132 | 65 | |||||||||||
Total | |||||||||||||||
Non-Impaired installment receivables with no related allowance recorded | 818 | 778 | — | 65 | |||||||||||
Impaired installment receivables with a related allowance recorded | 3,894 | 3,894 | 2,838 | — | |||||||||||
Total installment receivables | $ | 4,712 | $ | 4,672 | $ | 2,838 | $ | 65 | |||||||
Installment receivables with a related allowance recorded as noted in the table above represent those installment receivables on a non-accrual basis in accordance with ASU 2010-20. As of June 30, 2017, the company had no U.S. installment receivables past due of 90 days or more for which the company is still accruing interest. Individually, all U.S. installment receivables are assigned a specific allowance for doubtful accounts based on management’s review when the
company does not expect to receive both the contractual principal and interest payments as specified in the loan agreement. In Canada, the company had an immaterial amount of Canadian installment receivables which were past due of 90 days or more as of June 30, 2017 and December 31, 2016 for which the company is still accruing interest.
The aging of the company’s installment receivables was as follows (in thousands):
June 30, 2017 | December 31, 2016 | ||||||||||||||||||||||
Total | U.S. | Canada | Total | U.S. | Canada | ||||||||||||||||||
Current | $ | 670 | $ | — | $ | 670 | $ | 832 | $ | — | $ | 832 | |||||||||||
0-30 Days Past Due | 7 | — | 7 | 18 | — | 18 | |||||||||||||||||
31-60 Days Past Due | 7 | — | 7 | 12 | — | 12 | |||||||||||||||||
61-90 Days Past Due | 7 | — | 7 | 2 | — | 2 | |||||||||||||||||
90+ Days Past Due | 4,196 | 4,103 | 93 | 3,848 | 3,762 | 86 | |||||||||||||||||
$ | 4,887 | $ | 4,103 | $ | 784 | $ | 4,712 | $ | 3,762 | $ | 950 | ||||||||||||
26
Notes to Financial Statements | Current Assets | |
Inventories
Inventories consist of the following (in thousands):
June 30, 2017 | December 31, 2016 | ||||||
Finished goods | $ | 77,236 | $ | 68,701 | |||
Raw materials | 65,722 | 56,270 | |||||
Work in process | 10,460 | 10,673 | |||||
Inventories, net | $ | 153,418 | $ | 135,644 | |||
Other Current Assets
Other current assets consist of the following (in thousands):
June 30, 2017 | December 31, 2016 | ||||||
Value added tax receivables | $ | 15,457 | $ | 14,336 | |||
Service contracts | 2,091 | 2,902 | |||||
Derivatives (foreign currency forward exchange contracts) | 1,113 | 2,754 | |||||
Prepaid insurance | 1,490 | 2,761 | |||||
Prepaid inventory | 664 | 790 | |||||
Recoverable income taxes | 451 | 503 | |||||
Prepaid debt fees | 377 | 489 | |||||
Prepaid and other current assets | 9,667 | 6,984 | |||||
Other Current Assets | $ | 31,310 | $ | 31,519 | |||
27
Notes to Financial Statements | Long-Term Assets | |
Long-Term Assets
Other long-term assets consist of the following (in thousands):
June 30, 2017 | December 31, 2016 | ||||||
Convertible 2021 note hedge asset | $ | 27,430 | $ | 25,471 | |||
Convertible 2022 note hedge asset | 28,582 | — | |||||
Cash surrender value of life insurance policies | 1,871 | 1,824 | |||||
Deferred financing fees | 958 | 793 | |||||
Installment receivables | 813 | 466 | |||||
Deferred taxes | 416 | 837 | |||||
Investments | 103 | 108 | |||||
Other | 106 | 188 | |||||
Other Long-Term Assets | $ | 60,279 | $ | 29,687 | |||
During the quarter ended March 31, 2016, the company issued $150,000,000 principal amount of Convertible Senior Notes due 2021. During the quarter ended June 30, 2017, the company issued $120,000,000 principal amount of Convertible Senior Notes due 2022. As part of the 2016 and 2017 transactions, the company entered into the related 2021 and 2022 convertible
note hedge derivatives which are included in Other Long-Term Assets, the value of which will be adjusted quarterly to reflect fair value. See "Long-Term Debt" in the notes to the Consolidated Financial Statements included elsewhere in this report for more detail.
Property and Equipment
Property and equipment consist of the following (in thousands):
June 30, 2017 | December 31, 2016 | ||||||
Machinery and equipment | $ | 297,298 | $ | 301,367 | |||
Land, buildings and improvements | 76,260 | 73,709 | |||||
Leasehold improvements | 12,391 | 12,054 | |||||
Furniture and fixtures | 10,074 | 10,100 | |||||
Property and Equipment, gross | 396,023 | 397,230 | |||||
Less allowance for depreciation | (319,416 | ) | (321,871 | ) | |||
Property and Equipment, net | $ | 76,607 | $ | 75,359 | |||
Goodwill
The change in goodwill from December 31, 2016 to June 30, 2017 was due to foreign currency translation.
28
Notes to Financial Statements | Long-Term Assets | |
Intangibles
The company's intangibles consist of the following (in thousands):
June 30, 2017 | December 31, 2016 | ||||||||||||||
Historical Cost | Accumulated Amortization | Historical Cost | Accumulated Amortization | ||||||||||||
Customer lists | $ | 51,844 | $ | 48,747 | $ | 49,362 | $ | 45,797 | |||||||
Trademarks | 25,339 | — | 24,091 | — | |||||||||||
Developed technology | 7,594 | 6,287 | 7,287 | 5,969 | |||||||||||
Patents | 5,546 | 5,536 | 5,512 | 5,487 | |||||||||||
License agreements | 1,174 | 1,174 | 1,126 | 1,126 | |||||||||||
Other | 1,162 | 1,144 | 1,162 | 1,138 | |||||||||||
Intangibles | $ | 92,659 | $ | 62,888 | $ | 88,540 | $ | 59,517 | |||||||
All the company’s intangible assets have been assigned definite lives and continue to be amortized over their useful lives, except for trademarks shown above, which have indefinite lives. The changes in intangible balances reflected on the balance sheet from December 31, 2016 to June 30, 2017 were the result of foreign currency translation and amortization.
The company evaluates the carrying value of definite-lived assets whenever events or circumstances indicate possible impairment. Definite-lived assets are determined to be impaired if the future un-discounted cash flows expected to be generated by the asset are less than the carrying value. Actual impairment amounts for definite-lived assets are then calculated using a discounted cash flow calculation. The company reviews indefinite-lived assets for impairment annually in the fourth quarter of each year and whenever events or circumstances indicate possible impairment. Any impairment amounts for indefinite-lived assets are calculated as the difference between the future discounted cash flows expected to be generated by the asset less than the carrying value for the asset.
Amortization expense related to intangibles was $755,000 in the first six months of 2017 and is estimated to be $1,504,000 in 2017, $1,494,000 in 2018, $1,310,000 in 2019, $178,000 in 2020, $178,000 in 2021 and $178,000 in 2022. Amortized intangibles are being amortized on a straight-line basis over remaining lives of 1 to 10 years with most of the intangibles being amortized over an average remaining life of approximately 4 years.
29
Notes to Financial Statements | Current Liabilities | |
Current Liabilities
Accrued Expenses
Accrued expenses consist of accruals for the following (in thousands):
June 30, 2017 | December 31, 2016 | ||||||
Salaries and wages | $ | 29,662 | $ | 32,959 | |||
Warranty cost | 22,947 | 23,302 | |||||
Taxes other than income taxes, primarily value added taxes | 20,655 | 19,194 | |||||
Professional | 5,416 | 4,728 | |||||
Severance | 5,156 | 2,049 | |||||
Freight | 4,506 | 5,211 | |||||
Interest | 3,759 | 3,747 | |||||
Product liability, current portion | 3,459 | 3,996 | |||||
Deferred revenue | 1,539 | 1,446 | |||||
Derivative liabilities (foreign currency forward exchange contracts) | 1,496 | 1,783 | |||||
Rent | 683 | 672 | |||||
Insurance | 670 | 742 | |||||
Rebates | 484 | 356 | |||||
Supplemental Executive Retirement Program liability | 391 | 391 | |||||
Other items, principally trade accruals | 9,686 | 9,519 | |||||
Accrued Expenses | $ | 110,509 | $ | 110,095 | |||
Accrued rebates relate to several volume incentive programs the company offers its customers. The company accounts for these rebates as a reduction of revenue when the products are sold in accordance with the guidance in ASC 605-50, Customer Payments and Incentives.
Generally, the company's products are covered by warranties against defects in material and workmanship for various periods depending on the product from the date of sales to the customer. Certain components carry a lifetime warranty. A provision for estimated warranty cost is recorded at the time of sale based upon actual experience. The company continuously assesses the adequacy of its product warranty accrual and records adjustments as needed. Historical analysis is primarily used to determine the company's warranty reserves. Claims history is reviewed and provisions are adjusted as needed. However, the company does consider other events, such product field actions and recalls, which could warrant additional warranty reserve provision.
The following is a reconciliation of the changes in accrued warranty costs for the reporting period (in thousands):
Balance as of January 1, 2017 | $ | 23,302 | |
Warranties provided during the period | 4,927 | ||
Settlements made during the period | (5,571 | ) | |
Changes in liability for pre-existing warranties during the period, including expirations | 289 | ||
Balance as of June 30, 2017 | $ | 22,947 | |
30
Notes to Financial Statements | Long-Term Liabilities | |
Long-Term Liabilities
Long-Term Debt
Debt consists of the following (in thousands):
June 30, 2017 | December 31, 2016 | ||||||
Convertible senior notes at 5.00%, due in February 2021 | $ | 118,666 | $ | 115,159 | |||
Convertible senior notes at 4.50%, due in June 2022 | 86,680 | — | |||||
Convertible senior subordinated debentures at 4.125%, due in February 2027 | — | 13,039 | |||||
Other notes and lease obligations | 32,555 | 33,151 | |||||
237,901 | 161,349 | ||||||
Less current maturities of long-term debt | (2,159 | ) | (15,261 | ) | |||
Long-Term Debt | $ | 235,742 | $ | 146,088 | |||
The company had outstanding letters of credit of $2,891,000 and $2,853,000 as of June 30, 2017 and December 31, 2016, respectively. There were no borrowings denominated in foreign currencies, excluding a portion of the company's capital leases, as of June 30, 2017 and December 31, 2016. As of June 30, 2017, the weighted average floating interest rate on all borrowings, excluding capital leases, was 4.95% compared to 4.85% as of December 31, 2016.
On September 30, 2015, the company entered into an Amended and Restated Revolving Credit and Security Agreement, which was subsequently amended (the “Credit Agreement”) and which matures on January 16, 2021. The Credit Agreement was entered into by and among the company, certain of the company’s direct and indirect U.S. and Canadian subsidiaries and certain of the company’s European subsidiaries (together with the company, the “Borrowers”), certain other of the company’s direct and indirect U.S., Canadian and European subsidiaries (the “Guarantors”), and PNC Bank, National Association (“PNC”), JPMorgan Chase Bank, N.A., J.P. Morgan Europe Limited, KeyBank National Association, and Citizens Bank, National Association (the “Lenders”). PNC is the administrative agent (the “Administrative Agent”) and J.P. Morgan Europe Limited is the European agent (the “European Agent”) under the Credit Agreement.
U.S. and Canadian Borrowers Credit Facility
For the company's U.S. and Canadian Borrowers, the Credit Agreement provides for an asset-based-lending senior secured revolving credit facility which is secured by substantially all the company’s U.S. and Canadian assets, other than real estate. The Credit Agreement provides the company and the other Borrowers with a credit facility in an aggregate principal amount of $100,000,000, subject to availability based on a borrowing base formula, under a senior secured revolving credit, letter of credit
and swing line loan facility (the “U.S. and Canadian Credit Facility”). Up to $25,000,000 of the U.S. and Canadian Credit Facility will be available for issuance of letters of credit. The aggregate principal amount of the U.S. and Canadian Credit Facility may be increased by up to $25,000,000 to the extent requested by the company and agreed to by any Lender or new financial institution approved by the Administrative Agent.
The aggregate borrowing availability under the U.S. and Canadian Credit Facility is determined based on a borrowing base formula. The aggregate usage under the U.S. and Canadian Credit Facility may not exceed an amount equal to the sum of (a) 85% of eligible U.S. accounts receivable plus (b) the lesser of (i) 70% of eligible U.S. inventory and eligible foreign in-transit inventory and (ii) 85% of the net orderly liquidation value of eligible U.S. inventory and eligible foreign in-transit inventory (not to exceed $4,000,000), plus (c) the lesser of (i) 85% of the net orderly liquidation value of U.S. eligible machinery and equipment and (ii) $1,608,200 as of June 30, 2017 (subject to reduction as provided in the Credit Agreement), plus (d) 85% of eligible Canadian accounts receivable, plus (e) the lesser of (i) 70% of eligible Canadian inventory and (ii) 85% of the net orderly liquidation value of eligible Canadian inventory, less (f) swing loans outstanding under the U.S. and Canadian Credit Facility, less (g) letters of credit issued and undrawn under the U.S. and Canadian Credit Facility, less (h) a $5,000,000 minimum availability reserve, less (i) other reserves required by the Administrative Agent, and in each case subject to the definitions and limitations in the Credit Agreement. As of June 30, 2017, the company was in compliance with all covenant requirements and had borrowing capacity on the U.S. and Canadian Credit Facility under the Credit Agreement of $28,791,000, considering the minimum availability reserve, then-outstanding letters of credit, other reserves and the $11,250,000 dominion trigger amount described below.
31
Notes to Financial Statements | Long-Term Liabilities | |
Borrowings under the U.S. and Canadian Credit Facility are secured by substantially all of the company’s U.S. and Canadian assets, other than real estate.
Interest will accrue on outstanding indebtedness under the Credit Agreement at the LIBOR rate, plus a margin ranging from 2.25% to 2.75%, or at the alternate base rate, plus a margin ranging from 1.25% to 1.75%, as selected by the company. Borrowings under the U.S. and Canadian Credit Facility are subject to commitment fees of 0.25% or 0.375% per year, depending on utilization.
The Credit Agreement contains customary representations, warranties and covenants. Exceptions to the operating covenants in the Credit Agreement provide the company with flexibility to, among other things, enter into or undertake certain sale and leaseback transactions, dispositions of assets, additional credit facilities, sales of receivables, additional indebtedness and intercompany indebtedness, all subject to limitations set forth in the Credit Agreement, as amended. The Credit Agreement also contains a covenant requiring the company to maintain minimum availability under the U.S. and Canadian Credit Facility of not less than the greater of (i) 11.25% of the maximum amount that may be drawn under the U.S. and Canadian Credit Facility for five (5) consecutive business days, or (ii) $5,000,000 on any business day. The company also is subject to dominion triggers under the U.S. and Canadian Credit Facility requiring the company to maintain borrowing capacity of not less than $11,250,000 on any business day or $12,500,000 for five consecutive days in order to avoid triggering full control by an agent for the lenders of the company's cash receipts for application to the company’s obligations under the agreement.
The Credit Agreement contains customary default provisions, with certain grace periods and exceptions, which provide that events of default that include, among other things, failure to pay amounts due, breach of covenants, representations or warranties, bankruptcy, the occurrence of a material adverse effect, exclusion from any medical reimbursement program, and an interruption of any material manufacturing facilities for more than 10 consecutive days. The initial borrowings under the U.S. and Canadian Credit Facility were used to repay and terminate the company’s previous credit agreement, which was scheduled to mature in October 2015.
European Credit Facility
The Credit Agreement also provides for a revolving credit, letter of credit and swing line loan facility which gives the company and the European Borrowers the ability to borrow up to an aggregate principal amount of $30,000,000, with a $5,000,000 sublimit for letters of credit and a $2,000,000 sublimit for swing line loans (the “European Credit Facility”). Up to $15,000,000 of the European Credit Facility will be available to each of Invacare Limited (the “UK Borrower”) and
Invacare Poirier SAS (the “French Borrower” and, together with the UK Borrower, the “European Borrowers”). The European Credit Facility matures in January 2021, together with the U.S. and Canadian Credit Facility.
The aggregate borrowing availability for each European Borrower under the European Credit Facility is determined based on a borrowing base formula. The aggregate borrowings of each of the European Borrowers under the European Credit Facility may not exceed an amount equal to (a) 85% of the European Borrower’s eligible accounts receivable, less (b) the European Borrower’s borrowings and swing line loans outstanding under the European Credit Facility, less (c) the European Borrower’s letters of credit issued and undrawn under the European Credit Facility, less (d) a $3,000,000 minimum availability reserve, less (e) other reserves required by the European Agent, and in each case subject to the definitions and limitations in the Credit Agreement. As of June 30, 2017, the aggregate borrowing availability to the European Borrowers under the European Credit Facility was approximately $15,797,000, considering the $3,000,000 minimum availability reserve and the $3,375,000 dominion trigger amount described below.
The aggregate principal amount of the European Credit Facility may be increased by up to $10,000,000 to the extent requested by the company and agreed to by any Lender or Lenders that wish to increase their lending participation or, if not agreed to by any Lender, a new financial institution that agrees to join the European Credit Facility and that is approved by the Administrative Agent and the European Agent.
Interest will accrue on outstanding indebtedness under the European Credit Facility at the LIBOR rate, plus a margin ranging from 2.50% to 3.00%, or for swing line loans, at the overnight LIBOR rate, plus a margin ranging from 2.50% to 3.00%, as selected by the company. The margin that will be adjusted quarterly based on utilization. Borrowings under the European Credit Facility are subject to commitment fees of 0.25% or 0.375% per year, depending on utilization.
The European Credit Facility is secured by substantially all the personal property assets of the UK Borrower and its in-country subsidiaries, and all the receivables of the French Borrower and its in-country subsidiaries. The UK and French facilities (which comprise the European Credit Facility) are cross collateralized, and the US personal property assets previously pledged under the U.S. and Canadian Credit Facility also serve as collateral for the European Credit Facility.
The European Credit Facility is subject to customary representations, warranties and covenants generally consistent with those applicable to the U.S. and Canadian Credit Facility. Exceptions to the operating covenants in the Credit Agreement provide the company with flexibility to, among other things, enter into or undertake certain sale/leaseback transactions,
32
Notes to Financial Statements | Long-Term Liabilities | |
dispositions of assets, additional credit facilities, sales of receivables, additional indebtedness and intercompany indebtedness, all subject to limitations set forth in the Credit Agreement. The Credit Agreement also contains a covenant requiring the European Borrowers to maintain undrawn availability under the European Credit Facility of not less than the greater of (i) 11.25% of the maximum amount that may be drawn under the European Credit Facility for five (5) consecutive business days, or (ii) $3,000,000 on any business day. The European Borrowers also are subject to cash dominion triggers under the European Credit Facility requiring the European Borrower to maintain borrowing capacity of not less than $3,375,000 on any business day or 12.50% of the maximum amount that may be drawn under the European Credit Facility for five (5) consecutive business days in order to avoid triggering full control by an agent for the Lenders of the European Borrower’s cash receipts for application to its obligations under the European Credit Facility.
The European Credit Facility is subject to customary default provisions, with certain grace periods and exceptions, consistent with those applicable to the U.S. and Canadian Credit Facility, which provide that events of default include, among other things, failure to pay amounts due, breach of covenants, representations or warranties, cross-default, bankruptcy, the occurrence of a material adverse effect, exclusion from any medical reimbursement program, and an interruption in the operations of any material manufacturing facility for more than 10 consecutive days.
The proceeds of the European Credit Facility will be used to finance the working capital and other business needs of the company.
Convertible senior subordinated debentures due 2027
In 2007, the company issued $135,000,000 principal amount of 4.125% Convertible Senior Subordinated Debentures due 2027 (the "debentures"), of which $0 principal amount remains outstanding as of June 30, 2017.
The holders of the debentures exercised their right to require the company to repurchase all the debentures on February 1, 2017 at a price equal to 100% of the principal amount. The company satisfied the accreted value of the debentures using cash on February 2, 2017, and no debentures remained outstanding following that date.
The liability components of the debentures consisted of the following (in thousands):
December 31, 2016 | |||
Principal amount of liability component | $ | 13,350 | |
Unamortized discount | (311 | ) | |
Net carrying amount of liability component | $ | 13,039 | |
The unamortized discount as of December 31, 2016 was fully amortized in the first quarter 2017 due to the repurchase of all the debentures on February 1, 2017.
Convertible senior notes due 2021
In the first quarter of 2016, the company issued $150,000,000 aggregate principal amount of 5.00% Convertible Senior Notes due 2021 (the “2021 notes”) in a private offering to qualified institutional buyers pursuant to Rule 144A under the Securities Act. The 2021 notes bear interest at a rate of 5.00% per year payable semi-annually in arrears on February 15 and August 15 of each year, beginning August 15, 2016. The 2021 notes will mature on February 15, 2021, unless repurchased or converted in accordance with their terms prior to such date. Prior to August 15, 2020, the 2021 notes will be convertible only upon satisfaction of certain conditions and during certain periods, and thereafter, at any time until the close of business on the second scheduled trading day immediately preceding the maturity date. Unless and until the company obtains shareholder approval under applicable New York Stock Exchange rules, the 2021 notes will be convertible, subject to certain conditions, into cash. If the company obtains such shareholder approval, the 2021 notes may be settled in cash, the company’s common shares or a combination of cash and the company’s common shares, at the company’s election.
Holders of the 2021 notes will have the right to require the company to repurchase all or some of their 2021 notes at 100% of their principal, plus any accrued and unpaid interest, upon the occurrence of certain fundamental changes. The initial conversion rate is 60.0492 common shares per $1,000 principal amount of 2021 notes (equivalent to an initial conversion price of approximately $16.65 per common share). The company evaluated the terms of the conversion features under the applicable accounting literature, including Derivatives and Hedging, ASC 815, and determined that the features did require separate accounting as a derivative. This derivative was capitalized on the balance sheet as a long-term liability and will be adjusted to reflect fair value each quarter. The fair value of the convertible debt conversion liability at issuance was $34,480,000. The fair value of the convertible debt conversion liability at June 30, 2017 was $32,227,000 compared to $30,708,000 as of December 31, 2016. The company recognized losses of $8,250,000 and $1,519,000 for the three and six months ended June 30, 2017, respectively, compared to gains of
33
Notes to Financial Statements | Long-Term Liabilities | |
$6,565,000 and $5,847,000 for the three and six months ended June 30, 2016, respectively, related to the convertible debt conversion liability.
In connection with the offering of the 2021 notes, the company entered into privately negotiated convertible note hedge transactions with two financial institutions (the “option counterparties”). These transactions cover, subject to customary anti-dilution adjustments, the number of the company’s common shares that will initially underlie the 2021 notes, and are expected generally to reduce the potential equity dilution, and/or offset any cash payments in excess of the principal amount due, as the case may be, upon conversion of the 2021 notes. The company evaluated the note hedges under the applicable accounting literature, including Derivatives and Hedging, ASC 815, and determined that the note hedges should be accounted for as derivatives. These derivatives were capitalized on the balance sheet as long-term assets and will be adjusted to reflect fair value each quarter. The fair value of the convertible note hedge assets at issuance was $27,975,000. The fair value of the convertible note hedge assets at June 30, 2017 was $27,430,000 compared to $25,471,000 as of December 31, 2016. The company recognized gains of $7,789,000 and $1,959,000 for the three and six months ended June 30, 2017 compared to losses of $6,079,000 and $4,757,000 for the three and six months ended June 30, 2016, respectively, related to the convertible note hedge asset.
The company entered into separate, privately negotiated warrant transactions with the option counterparties at a higher strike price relating to the same number of the company’s common shares, subject to customary anti-dilution adjustments, pursuant to which the company sold warrants to the option counterparties. The warrants could have a dilutive effect on the company’s outstanding common shares and the company’s earnings per share to the extent that the price of the company’s common shares exceeds the strike price of those warrants. The initial strike price of the warrants is $22.4175 per share and is subject to certain adjustments under the terms of the warrant transactions. The company evaluated the warrants under the applicable accounting literature, including Derivatives and Hedging, ASC 815, and determined that the warrants meet the definition of a derivative, are indexed to the company's own stock and should be classified in shareholder's equity. The amount paid for the warrants and capitalized in shareholder's equity was $12,376,000.
The net proceeds from the offering of the 2021 notes were approximately $144,034,000, after deducting fees and offering expenses of $5,966,000. These debt issuance costs were capitalized and are being amortized as interest expense through February 2021. As of June 30, 2017, all $5,966,000 of these costs were paid. In accordance with ASU 2015-03, Simplifying the Presentation of Debt Issuance Costs, these debt issuance costs are presented on the balance sheet as a direct deduction from the
carrying amount of the related debt liability. Approximately $5,000,000 of the net proceeds from the offering were used to repurchase the company’s common shares from purchasers of 2021 notes in the offering in privately negotiated transactions. A portion of the net proceeds from the offering were used to pay the cost of the convertible note hedge transactions (after such cost is partially offset by the proceeds to the company from the warrant transactions), which net cost was $15,600,000.
The liability components of the 2021 notes consist of the following (in thousands):
June 30, 2017 | December 31, 2016 | ||||||
Principal amount of liability component | $ | 150,000 | $150,000 | ||||
Unamortized discount | (26,991 | ) | (29,919 | ) | |||
Debt fees | (4,343 | ) | (4,922 | ) | |||
Net carrying amount of liability component | $ | 118,666 | $ | 115,159 | |||
The unamortized discount of $26,991,000 is to be amortized through February 2021. The effective interest rate on the liability component was 11.1%. Non-cash interest expense of $1,490,000 and $2,928,000 was recognized for the three and six months ended June 30, 2017, respectively, compared to $1,338,000 and $1,788,000 for the three and six months ended June 30, 2016, respectively, in comparison to actual interest expense accrued of $1,875,000 and $3,750,000 for the three and six months ended June 30, 2017, respectively, compared to $1,875,000 and $2,628,000 for the three and six months ended June 30, 2016, respectively, based on the stated coupon rate of 5.0%. The 2021 notes were not convertible as of June 30, 2017 nor was the applicable conversion threshold met.
Convertible senior notes due 2022
In the second quarter of 2017, the company issued $120,000,000 aggregate principal amount of 4.50% Convertible Senior Notes due 2022 (the “2022 notes”) in a private offering to qualified institutional buyers pursuant to Rule 144A under the Securities Act. The 2022 notes bear interest at a rate of 4.50% per year payable semi-annually in arrears on June 1 and December 1 of each year, beginning December 1, 2017. The 2022 notes will mature on June 1, 2022, unless repurchased or converted in accordance with their terms prior to such date. Prior to December 1, 2021, the 2022 notes will be convertible only upon satisfaction of certain conditions and during certain periods, and thereafter, at any time until the close of business on the second scheduled trading day immediately preceding the maturity date. Unless and until the company obtains shareholder approval of the issuance of the company's common shares upon conversion of the 2022 notes and the 2021 notes under applicable New York Stock Exchange rules, the 2022 notes will be convertible, subject to certain conditions, into cash. If the
34
Notes to Financial Statements | Long-Term Liabilities | |
company obtains such shareholder approval, the 2022 notes may be settled in cash, the company’s common shares or a combination of cash and the company’s common shares, at the company’s election.
Holders of the 2022 notes will have the right to require the company to repurchase all or some of their 2022 notes at 100% of their principal, plus any accrued and unpaid interest, upon the occurrence of certain fundamental changes. The initial conversion rate is 61.6095 common shares per $1,000 principal amount of 2022 notes (equivalent to an initial conversion price of approximately $16.23 per common share). The company evaluated the terms of the conversion features under the applicable accounting literature, including Derivatives and Hedging, ASC 815, and determined that the features did require separate accounting as a derivative. This derivative was capitalized on the balance sheet as a long-term liability and will be adjusted to reflect fair value each quarter. The fair value of the convertible debt conversion liability at issuance was $28,859,000. The fair value of the convertible debt conversion liability at June 30, 2017 was $33,251,000. The company recognized a loss of $4,392,000 for both the three and six months ended June 30, 2017 related to the convertible debt conversion liability.
In connection with the offering of the 2022 notes, the company entered into privately negotiated convertible note hedge transactions with one financial institution (the “option counterparty”). These transactions cover, subject to customary anti-dilution adjustments, the number of the company’s common shares that will initially underlie the 2022 notes, and are expected generally to reduce the potential equity dilution, and/or offset any cash payments in excess of the principal amount due, as the case may be, upon conversion of the 2022 notes. The company evaluated the note hedges under the applicable accounting literature, including Derivatives and Hedging, ASC 815, and determined that the note hedges should be accounted for as derivatives. These derivatives were capitalized on the balance sheet as long-term assets and will be adjusted to reflect fair value each quarter. The fair value of the convertible note hedge assets at issuance was $24,780,000. The fair value of the convertible note hedge assets at June 30, 2017 was $28,582,000. The company recognized a gain of $3,802,000 for both the three and six months ended June 30, 2017 related to the convertible note hedge asset.
The company entered into separate, privately negotiated warrant transactions with the option counterparty at a higher strike price relating to the same number of the company’s common shares, subject to customary anti-dilution adjustments, pursuant to which the company sold warrants to the option counterparties. The warrants could have a dilutive effect on the company’s outstanding common shares and the company’s earnings per share to the extent that the price of the company’s common shares exceeds the strike price of those warrants. The
initial strike price of the warrants is $21.4375 per share and is subject to certain adjustments under the terms of the warrant transactions. The company evaluated the warrants under the applicable accounting literature, including Derivatives and Hedging, ASC 815, and determined that the warrants meet the definition of a derivative, are indexed to the company's own stock and should be classified in shareholder's equity. The amount paid for the warrants and capitalized in shareholder's equity was $14,100,000.
The net proceeds from the offering of the 2022 notes were approximately $114,962,000, after deducting fees and offering expenses of $5,038,000. These debt issuance costs were capitalized and are being amortized as interest expense through June 2022. As of June 30, 2017, $4,144,000 of these costs were paid. In accordance with ASU 2015-03, Simplifying the Presentation of Debt Issuance Costs, these debt issuance costs are presented on the balance sheet as a direct deduction from the carrying amount of the related debt liability. A portion of the net proceeds from the offering were used to pay the cost of the convertible note hedge transactions (after such cost is partially offset by the proceeds to the company from the warrant transactions), which net cost was $10,680,000.
The liability components of the 2022 notes consist of the following (in thousands):
June 30, 2017 | |||
Principal amount of liability component | $ | 120,000 | |
Unamortized discount | (28,647 | ) | |
Debt fees | (4,673 | ) | |
Net carrying amount of liability component | $ | 86,680 | |
The unamortized discount of $28,647,000 is to be amortized through June 2022. The effective interest rate on the liability component was 10.9%. Non-cash interest expense of $212,000 was recognized for both the three and six months ended June 30, 2017 in comparison to actual interest expense accrued of $255,000 for the same periods respectively, based on the stated coupon rate of 4.5%. The 2022 notes were not convertible as of June 30, 2017 nor was the applicable conversion threshold met.
35
Notes to Financial Statements | Long-Term Liabilities | |
Other Long-Term Obligations
Other long-term obligations consist of the following (in thousands):
June 30, 2017 | December 31, 2016 | ||||||
Deferred income taxes | $ | 31,795 | $ | 31,079 | |||
Convertible 2021 debt conversion liability | 32,227 | 30,708 | |||||
Convertible 2022 debt conversion liability | 33,251 | — | |||||
Product liability | 15,009 | 16,615 | |||||
Pension | 13,969 | 13,258 | |||||
Deferred gain on sale leaseback | 6,562 | 6,703 | |||||
Supplemental Executive Retirement Plan liability | 5,541 | 5,612 | |||||
Deferred compensation | 3,858 | 3,593 | |||||
Uncertain tax obligation including interest | 2,905 | 3,150 | |||||
Other | 4,171 | 3,689 | |||||
Other Long-Term Obligations | $ | 149,288 | $ | 114,407 | |||
During the quarter ended March 31, 2016, the company issued $150,000,000 principal amount of 5.00% Convertible Senior Notes due 2021. During the quarter ended June 30, 2017, the company issued $120,000,000 principal amount of Convertible Senior Notes due 2022. Due to the 2016 and 2017 issuances, long-term liabilities representing the convertible debt conversion liabilities were recorded which are adjusted to reflect fair values quarterly. The amounts included in the above table represent the fair values of the conversion liabilities as of June 30, 2017 and December 31, 2016. See "Long-Term Debt" in the notes to the Consolidated Financial Statements included elsewhere in this report for more detail.
On April 23, 2015, the company entered into a real estate sale leaseback transaction which resulted in the company recording an initial deferred gain of $7,414,000, the majority of which is included in Other Long-Term Obligations and will be recognized over the 20-year life of the leases. The gain realized was $68,000 and $136,000 for the three and six months ended June 30, 2017, respectively, compared to $65,000 and $131,000 for the three and six months ended June 30, 2016, respectively.
36
Notes to Financial Statements | Equity Compensation | |
Equity Compensation
The company’s Common Shares have a $.25 stated value. The Common Shares and the Class B Common Shares generally have identical rights, terms and conditions and vote together as a single class on most issues, except that the Class B Common Shares have ten votes per share, carry a 10% lower cash dividend rate and, in general, can only be transferred to family members or for estate planning purposes. Holders of Class B Common Shares are entitled to convert their shares into Common Shares at any time on a share-for-share basis.
On May 31, 2017, the company received notice that holders of 703,912 Class B Common Shares had elected to convert all of their Class B Common Shares into Common Shares. After the conversion, 18,357 Class B Common Shares remained outstanding. The conversion substantially diminished the significance of the Company’s dual class voting structure, as after completion, the holders of the Common Shares represented approximately 99.5% of the Company’s total outstanding voting power.
Equity Compensation Plan
On May 16, 2013, the shareholders of the company approved the Invacare Corporation 2013 Equity Compensation Plan (the “2013 Plan”), which was adopted on March 27, 2013 by the company's Board of Directors (the “Board”). The Board adopted the 2013 Plan to replace the company's prior equity plan, the Invacare Corporation Amended and Restated 2003 Performance Plan (the “2003 Plan”), which expired on May 21, 2013. Due to its expiration, no new awards may be granted under the 2003 Plan; however, awards granted prior to its expiration will remain outstanding until they are exercised, vest, terminate or expire in accordance with their terms.
The 2013 Plan uses a fungible share-counting method, under which each common share underlying an award of stock options or stock appreciation rights ("SAR") will count against the number of total shares available under the 2013 Plan as one share; and each Common Share underlying any award other than a stock option or a SAR will count against the number of total shares available under the 2013 Plan as two shares. Shares underlying awards made under the 2003 Plan that are canceled or forfeited may be added back to the 2013 Plan for use in future awards. Any Common Shares that are added back to the 2013 Plan as the result of the cancellation or forfeiture of an award granted under the 2013 Plan will be added back in the same manner such shares were originally counted against the total number of shares available under the 2013 Plan. Each common share that is added back to the 2013 Plan due to a cancellation or forfeiture of an award granted under the 2003 Plan will be added back as one Common Share. At June 30, 2017, an aggregate of 2,373,030 Common Shares underlie awards outstanding under the 2003
Plan, which shares may become available under the 2013 Plan to the extent such awards are forfeited or expire unexercised.
The Compensation and Management Development Committee of the Board (the “Compensation Committee”), in its discretion, may grant an award under the 2013 Plan to any director or employee of the company or an affiliate. As of June 30, 2017, 1,372,287 common shares were available for future issuance under the 2013 Plan in connection with the following types of awards with respect to shares of the company's common shares: incentive stock options, nonqualified stock options, SARs, restricted stock, restricted stock units, unrestricted stock and performance shares. The Compensation Committee also may grant performance units that are payable in cash. The Compensation Committee has the authority to determine which participants will receive awards, the amount of the awards and the other terms and conditions of the awards.
The 2013 Plan provides that shares granted come from the company's authorized but unissued common shares or treasury shares. In addition, the company's stock-based compensation plans allow employee participants to exchange shares for minimum withholding taxes, which results in the company acquiring treasury shares.
The amounts of equity-based compensation expense recognized as part of selling, general and administrative expenses were as follows (in thousands):
For the Six Months Ended June 30, | |||||||
2017 | 2016 | ||||||
Restricted stock / units | $ | 3,262 | $ | 3,081 | |||
Performance shares / units | 905 | 466 | |||||
Non-qualified and performance stock options | 479 | 478 | |||||
Total stock-based compensation expense | $ | 4,646 | $ | 4,025 | |||
As of June 30, 2017, unrecognized compensation expense related to equity-based compensation arrangements granted under the company's 2013 Plan and previous plans, which is related to non-vested options and shares, was as follows (in thousands):
June 30, 2017 | |||
Restricted stock and restricted stock units | $ | 9,896 | |
Performance shares and performance share units | 8,229 | ||
Non-qualified and performance stock options | 3,725 | ||
Total unrecognized stock-based compensation expense | $ | 21,850 | |
37
Notes to Financial Statements | Equity Compensation | |
Total unrecognized compensation cost will be adjusted for future changes in actual and estimated forfeitures and for updated vesting assumptions for the performance share awards (see "Stock Options" and "Performance Shares and Performance Share Units" below). No tax benefit for share-based compensation was realized for the three and six months ended June 30, 2017 and 2016 due to a valuation allowance against deferred tax assets.
Stock Options
Generally, non-qualified stock option awards have a term of ten years and were granted with an exercise price per share
equal to the fair market value of one of the company’s Common Shares on the date of grant. Stock option awards granted in 2017 were performance-based awards which will only become exercisable if the performance goals established by the Compensation Committee are achieved over a 3-year period ending in 2019 and subject to the Compensation Committee's exercise of negative discretion to reduce the number of options vested based on the progress towards the company's transformation. The company expects the compensation expense to be recognized over a weighted-average period of approximately two years.
The following table summarizes information about stock option activity for the six months ended June 30, 2017:
June 30, 2017 | Weighted Average Exercise Price | ||||||
Options outstanding at January 1, 2017 | 2,542,732 | $ | 21.19 | ||||
Granted | 756,420 | 12.15 | |||||
Exercised | (103,775 | ) | 13.77 | ||||
Canceled | (56,950 | ) | 20.37 | ||||
Options outstanding at June 30, 2017 | 3,138,427 | $ | 19.27 | ||||
Options exercise price range at June 30, 2017 | $ | 12.15 | to | $ | 33.36 | ||
Options exercisable at June 30, 2017 | 2,379,987 | ||||||
Shares available for grant at June 30, 2017* | 1,372,287 | ||||||
________
* | Shares available for grant as of June 30, 2017 reduced by net restricted stock and restricted stock unit award and performance share and performance share unit award activity of 2,523,796 shares and 2,124,222 shares, respectively. |
The following table summarizes information about stock options outstanding at June 30, 2017:
Options Outstanding | Options Exercisable | ||||||||||||||
Exercise Prices | Number Outstanding at June 30, 2017 | Weighted Average Remaining Contractual Life (Years) | Weighted Average Exercise Price | Number Exercisable at June 30, 2017 | Weighted Average Exercise Price | ||||||||||
$ 12.15 – $20.00 | 1,318,466 | 7.2 | $ | 13.02 | 580,876 | $ | 14.19 | ||||||||
$ 20.01 – $25.00 | 1,079,227 | 1.9 | 22.56 | 1,062,827 | 22.55 | ||||||||||
$ 25.01 – $30.00 | 736,238 | 1.7 | 25.55 | 731,788 | 25.55 | ||||||||||
$ 30.01 – $33.36 | 4,496 | 3.4 | 33.36 | 4,496 | 33.36 | ||||||||||
Total | 3,138,427 | 4.6 | $ | 19.27 | 2,379,987 | $ | 21.54 | ||||||||
Pursuant to the plans, the Compensation Committee has established that grants may not be exercised within one year from the date granted and options must be exercised within ten years from the date granted. All stock options issued in 2017 were performance-based and may vest after the conclusion of the performance period ending December 31, 2019 based on achievement of performance goals established by the Compensation Committee and subject to the Compensation Committee's exercise of negative discretion to reduce the number of options vested based on the progress towards the company's
transformation. All other outstanding stock options were issued in 2014 and prior and were not performance-based.
For the stock options issued in 2014 and prior, 25% of such options vested one year following the issuance and provided a four-year vesting period whereby options vest in 25% installments in each year. Options granted with graded vesting were accounted for as single options.
38
Notes to Financial Statements | Equity Compensation | |
The fair value of options granted is estimated on the date of grant using a Black-Scholes option-pricing model. The calculated fair value of the 2017 performance option awards was $5.38 based on the following assumptions:
2017 | |||
Expected dividend yield | 0.4 | % | |
Expected stock price volatility | 39.1 | % | |
Risk-free interest rate | 2.31 | % | |
Expected life in years | 7.8 | ||
Forfeiture percentage | 5.0 | % | |
Expected dividend yield was based on historical dividends. Expected stock price volatility percentage was calculated at the date of grant based on historical stock prices for a period commensurate with the expected life of the option. The assumed expected life and forfeiture percentages were based on the company's historical analysis of option history.
Restricted Stock and Restricted Stock Units
The following table summarizes information about restricted shares and restricted share units (primarily for non-U.S. recipients):
June 30, 2017 | Weighted Average Fair Value | |||||
Stock / Units unvested at January 1, 2017 | 878,356 | $ | 15.87 | |||
Granted | 480,742 | 12.09 | ||||
Vested | (364,367 | ) | 16.66 | |||
Canceled | (99,011 | ) | 14.22 | |||
Stock / Units unvested at June 30, 2017 | 895,720 | $ | 13.70 | |||
The restricted stock awards generally vest ratably over the three years after the award date, except for those awards granted in 2014, which vest after a three-year period. Unearned restricted stock compensation, determined as the market value of the shares at the date of grant, is being amortized on a straight-line basis over the vesting period.
Performance Shares and Performance Share Units
The following table summarizes information about performance shares and performance share units (for non-U.S. recipients):
June 30, 2017 | Weighted Average Fair Value | |||||
Shares / Units unvested at January 1, 2017 | 309,468 | $ | 14.58 | |||
Granted | 336,694 | 12.02 | ||||
Vested | — | — | ||||
Canceled | (3,711 | ) | 12.82 | |||
Shares / Units unvested at June 30, 2017 | 642,451 | $ | 13.25 | |||
During the six months ended June 30, 2017, performance shares and performance share units (for non-U.S. recipients) were granted as performance awards with a three-year performance period with payouts based on achievement of certain performance goals. The awards are classified as equity awards as they will be settled in common shares upon vesting. The number of shares earned will be determined at the end of the performance period based on achievement of performance criteria for January 1, 2017 through December 31, 2019 established by the Compensation Committee at the time of grant. Recipients will be entitled to receive a number of common shares equal to the number of performance shares that vest based upon the levels of achievement which may range between 0% and 150% of the target number of shares with the target being 100% of the initial grant.
The fair value of the performance awards is based on the stock price on the date of grant discounted for the estimated value of dividends foregone as the awards are not eligible for dividends except to the extent vested. The company assesses the probability that the performance targets will be met with expense recognized whenever it is probable that at least the minimum performance criteria will be achieved. Depending upon the company's assessment of the probability of achievement of the goals, the company may not recognize any expense associated with performance awards in a given period, may reverse prior expense recorded or record additional expense to make up for expense not recorded in a prior period. Performance award compensation expense is generally expected to be recognized over three years. No performance award expense has been recognized for the 2015 awards as it is not considered probable that the performance goals for those awards will be met. Expense is being recognized for the 2016 and 2017 awards.
39
Notes to Financial Statements | Accumulated Other Comprehensive Income | |
Accumulated Other Comprehensive Income (Loss) by Component
Changes in accumulated other comprehensive income ("OCI") for the three and six months ended June 30, 2017 and June 30, 2016, respectively, were as follows (in thousands):
Foreign Currency | Long-Term Notes | Defined Benefit Plans | Derivatives | Total | ||||||||||||||||
March 31, 2017 | $ | (28,352 | ) | $ | 20,474 | $ | (11,543 | ) | $ | 1,205 | $ | (18,216 | ) | |||||||
OCI before reclassifications | 37,163 | (10,852 | ) | (480 | ) | (1,335 | ) | 24,496 | ||||||||||||
Amount reclassified from accumulated OCI | — | — | 54 | (301 | ) | (247 | ) | |||||||||||||
Net current-period OCI | 37,163 | (10,852 | ) | (426 | ) | (1,636 | ) | 24,249 | ||||||||||||
June 30, 2017 | $ | 8,811 | $ | 9,622 | $ | (11,969 | ) | $ | (431 | ) | $ | 6,033 | ||||||||
December 31, 2016 | $ | (26,199 | ) | $ | 17,372 | $ | (11,248 | ) | $ | 740 | $ | (19,335 | ) | |||||||
OCI before reclassifications | 35,010 | (7,750 | ) | (985 | ) | (571 | ) | 25,704 | ||||||||||||
Amount reclassified from accumulated OCI | — | — | 264 | (600 | ) | (336 | ) | |||||||||||||
Net current-period OCI | 35,010 | (7,750 | ) | (721 | ) | (1,171 | ) | 25,368 | ||||||||||||
June 30, 2017 | $ | 8,811 | $ | 9,622 | $ | (11,969 | ) | $ | (431 | ) | $ | 6,033 | ||||||||
March 31, 2016 | $ | 6,474 | $ | 2,662 | $ | (9,947 | ) | $ | 2,965 | $ | 2,154 | |||||||||
OCI before reclassifications | 9,982 | 325 | (77 | ) | (2,059 | ) | 8,171 | |||||||||||||
Amount reclassified from accumulated OCI | — | — | 71 | (208 | ) | (137 | ) | |||||||||||||
Net current-period OCI | 9,982 | 325 | (6 | ) | (2,267 | ) | 8,034 | |||||||||||||
June 30, 2016 | $ | 16,456 | $ | 2,987 | $ | (9,953 | ) | $ | 698 | $ | 10,188 | |||||||||
December 31, 2015 | $ | (5,744 | ) | $ | 4,111 | $ | (9,757 | ) | $ | 2,003 | $ | (9,387 | ) | |||||||
OCI before reclassifications | 22,200 | (1,124 | ) | (272 | ) | (931 | ) | 19,873 | ||||||||||||
Amount reclassified from accumulated OCI | — | — | 76 | (374 | ) | (298 | ) | |||||||||||||
Net current-period OCI | 22,200 | (1,124 | ) | (196 | ) | (1,305 | ) | 19,575 | ||||||||||||
June 30, 2016 | $ | 16,456 | $ | 2,987 | $ | (9,953 | ) | $ | 698 | $ | 10,188 | |||||||||
40
Notes to Financial Statements | Accumulated Other Comprehensive Income | |
Reclassifications out of accumulated OCI for the three and six months ended June 30, 2017 and June 30, 2016 were as follows (in thousands):
Amount reclassified from OCI | Affected line item in the Statement of Comprehensive (Income) Loss | |||||||||||||||||
For the Three Months Ended June 30, | For the Six Months Ended June 30, | |||||||||||||||||
2017 | 2016 | 2017 | 2016 | |||||||||||||||
Defined Benefit Plans | ||||||||||||||||||
Service and interest costs | $ | 54 | $ | 71 | $ | 264 | $ | 76 | Selling, General and Administrative | |||||||||
Tax | — | — | — | — | Income Taxes | |||||||||||||
Total after tax | $ | 54 | $ | 71 | $ | 264 | $ | 76 | ||||||||||
Derivatives | ||||||||||||||||||
Foreign currency forward contracts hedging sales | $ | 166 | $ | (982 | ) | $ | 234 | $ | (1,409 | ) | Net Sales | |||||||
Foreign currency forward contracts hedging purchases | (481 | ) | 719 | (872 | ) | 957 | Cost of Products Sold | |||||||||||
Total before tax | (315 | ) | (263 | ) | (638 | ) | (452 | ) | ||||||||||
Tax | 14 | 55 | 38 | 78 | Income Taxes | |||||||||||||
Total after tax | $ | (301 | ) | $ | (208 | ) | $ | (600 | ) | $ | (374 | ) | ||||||
41
Notes to Financial Statements | Charges Related to Restructuring Activities | |
Charges Related to Restructuring Activities
The company's restructuring charges were originally necessitated primarily by continued declines in Medicare and Medicaid reimbursement by the U.S. government, as well as similar healthcare reimbursement pressures abroad, which negatively affect the company's customers (e.g. home health care providers) and continued pricing pressures faced by the company due to the outsourcing by competitors to lower cost locations. Restructuring decisions were also the result of reduced profitability in the NA/HME and Asia/Pacific segments. In addition, as a result of the company's transformation strategy, additional restructuring actions were incurred in 2016 and continued in 2017. The company expects any near-term cost savings from restructuring will be offset by other costs because of pressures on the business.
For the six months ended June 30, 2017, charges totaled $8,270,000 which were related to severance in NA/HME ($5,522,000), Europe ($1,204,000) and Asia/Pacific ($896,000) as well as building lease termination costs in the NA/HME segment ($648,000). The NA/HME charges include the impact of the company's closure of its Suzhou, China, manufacturing facility, which is expected to generate approximately $4,000,000 in annualized pre-tax savings for the NA/HME segment. Payments for the six months ended June 30, 2017 were $4,800,000 and the cash payments were funded with company's cash on hand. Most of the 2017 charges are expected to be paid out within twelve months.
For the six months ended June 30, 2016, charges totaled $791,000 which were related to severance in NA/HME ($332,000) and Asia/Pacific ($68,000) as well as building lease termination costs in the NA/HME segment ($391,000). Payments for the six months ended June 30, 2016 were $1,614,000 and the cash payments were funded with company's cash on hand. Most of the 2016 charges have been paid out.
There have been no material changes in accrued balances related to the charges, either as a result of revisions to the plans or changes in estimates. In addition, the savings anticipated as a result of the company's restructuring plans have been or are expected to be achieved, primarily resulting in reduced salary and benefit costs principally impacting Selling, General and Administrative expenses, and to a lesser extent, Costs of Products Sold. However, in general, these savings have been more than offset by the general business decline, higher regulatory and compliance costs related to quality system improvements, and more recently, higher interest expense. To date, the company's liquidity has not been materially impacted. Please refer to Charges Related to Restructuring Activities of company's Annual Report on Form 10-K for the period ending December 31, 2016 for disclosure of restructuring activity prior to 2017.
42
Notes to Financial Statements | Charges Related to Restructuring Activities | |
A progression by reporting segment of the accruals recorded as a result of the restructuring for 2017 is as follows (in thousands):
Severance | Contract Terminations | Total | |||||||||
December 31, 2016 Balance | |||||||||||
NA/HME | $ | 783 | $ | 120 | $ | 903 | |||||
Other | 1,266 | — | 1,266 | ||||||||
Total | 2,049 | 120 | 2,169 | ||||||||
Charges | |||||||||||
NA/HME | 2,095 | 147 | 2,242 | ||||||||
Europe | 690 | — | 690 | ||||||||
Asia/Pacific | 351 | — | 351 | ||||||||
Total | 3,136 | 147 | 3,283 | ||||||||
Payments | |||||||||||
NA/HME | (1,488 | ) | (96 | ) | (1,584 | ) | |||||
Europe | (190 | ) | — | (190 | ) | ||||||
Asia/Pacific | (228 | ) | — | (228 | ) | ||||||
Other | (249 | ) | — | (249 | ) | ||||||
Total | (2,155 | ) | (96 | ) | (2,251 | ) | |||||
March 31, 2017 Balance | |||||||||||
NA/HME | 1,390 | 171 | 1,561 | ||||||||
Europe | 500 | — | 500 | ||||||||
Asia/Pacific | 123 | — | 123 | ||||||||
Other | 1,017 | — | 1,017 | ||||||||
Total | 3,030 | 171 | 3,201 | ||||||||
Charges | |||||||||||
NA/HME | 3,427 | 501 | 3,928 | ||||||||
Europe | 514 | — | 514 | ||||||||
Asia/Pacific | 545 | — | 545 | ||||||||
Total | 4,486 | 501 | 4,987 | ||||||||
Payments | |||||||||||
NA/HME | (1,362 | ) | (189 | ) | (1,551 | ) | |||||
Europe | (340 | ) | — | (340 | ) | ||||||
Asia/Pacific | (658 | ) | — | (658 | ) | ||||||
Total | (2,360 | ) | (189 | ) | (2,549 | ) | |||||
June 30, 2017 Balance | |||||||||||
NA/HME | 3,455 | 483 | 3,938 | ||||||||
Europe | 674 | — | 674 | ||||||||
Asia/Pacific | 10 | — | 10 | ||||||||
Other | 1,017 | — | 1,017 | ||||||||
Total | $ | 5,156 | $ | 483 | $ | 5,639 | |||||
43
Notes to Financial Statements | Income Taxes | |
Income Taxes
The company had an effective tax rate of 10.2% and 13.4% on losses before income tax for the three and six months ended June 30, 2017, respectively, and an effective tax rate of 20.2% and 23.0% for the three and six months ended June 30, 2016, respectively, compared to an expected benefit at the U.S. statutory rate of 35% on the pre-tax losses for each period. The company's effective tax rate for the three and six months ended June 30, 2017 and June 30, 2016 was unfavorable as compared to the U.S. federal statutory rate expected benefit, principally due to the negative impact of the company's inability to record tax benefits related to the significant losses in countries which had tax valuation allowances. The effective tax rate was reduced by certain taxes outside the United States, excluding countries with tax valuation allowances, that were at an effective rate lower than the U.S. statutory rate. During 2016, installment payments were made in the first quarter related to a previously disclosed liability for uncertain tax positions, and subsequent to the end of the first quarter, the company accelerated and paid the balance of the installment obligation, in order to reduce interest costs.
44
Notes to Financial Statements | Net Loss Per Common Share | |
Net Loss Per Common Share
The following table sets forth the computation of basic and diluted net loss per common share for the periods indicated.
(In thousands except per share data) | For the Three Months Ended June 30, | For the Six Months Ended June 30, | |||||||||||||
2017 | 2016 | 2017 | 2016 | ||||||||||||
Basic | |||||||||||||||
Average common shares outstanding | 32,833 | 32,176 | 32,654 | 32,274 | |||||||||||
Net loss | $ | (23,508 | ) | $ | (11,580 | ) | $ | (40,288 | ) | $ | (20,196 | ) | |||
Net loss per common share | $ | (0.72 | ) | $ | (0.36 | ) | $ | (1.23 | ) | $ | (0.63 | ) | |||
Diluted | |||||||||||||||
Average common shares outstanding | 32,833 | 32,176 | 32,654 | 32,274 | |||||||||||
Stock options and awards | 360 | 354 | 293 | 298 | |||||||||||
Average common shares assuming dilution | 33,193 | 32,530 | 32,947 | 32,572 | |||||||||||
Net loss | $ | (23,508 | ) | $ | (11,580 | ) | $ | (40,288 | ) | $ | (20,196 | ) | |||
Net loss per common share * | $ | (0.72 | ) | $ | (0.36 | ) | $ | (1.23 | ) | $ | (0.63 | ) | |||
________
* Net loss per common share assuming dilution calculated utilizing weighted average shares outstanding-basic for the periods in which there was a net loss.
At June 30, 2017, 1,353,144 and 1,629,336 shares associated with stock options were excluded from the average common shares assuming dilution for the three and six months ended June 30, 2017 as they were anti-dilutive. At June 30, 2017, the majority of the anti-dilutive shares were granted at an exercise price of $25.79, which was higher than the average fair market value prices of $13.14 and $12.57 for the three and six months ended June 30, 2017.
At June 30, 2016, 2,810,386 and 2,787,067 shares associated with stock options were excluded from the average common shares assuming dilution for the three and six months ended June 30, 2016 as they were anti-dilutive. At June 30, 2016, the majority of the anti-dilutive shares were granted at an exercise price of $25.24, which was higher than the average fair market value prices of $11.79 and $12.96 for the three and six months ended June 30, 2016.
For both the three months ended June 30, 2017 and June 30, 2016, respectively, no shares were included in the common shares assuming dilution related to the company's issued warrants as the average market price of the company stock for these periods did not exceed the strike price of the warrants.
45
Notes to Financial Statements | Concentration of Credit Risk | |
Concentration of Credit Risk
The company manufactures and distributes durable medical equipment to the home health care, retail and extended care markets. The company performs credit evaluations of its customers’ financial condition. The company utilizes De Lage Landen, Inc. (“DLL”), a third-party financing company, to provide lease financing to Invacare's U.S. customers. The DLL agreement provides for direct leasing between DLL and the Invacare customer. The company retains a recourse obligation of $3,664,000 at June 30, 2017 to DLL for events of default under the contracts, which total $24,608,000 at June 30, 2017. Guarantees, ASC 460, requires the company to record a guarantee liability as it relates to the limited recourse obligation. The company's recourse is re-evaluated by DLL biannually, and DLL considers activity between the biannual dates and excludes any receivables purchased by the company from DLL. The company monitors the collections status of these contracts and has provided amounts for estimated losses in its allowances for doubtful accounts in accordance with Receivables, ASC 310-10-05-4. Credit losses are provided for in the financial statements.
Substantially all the company’s receivables are due from health care, medical equipment providers and long term care facilities located throughout the United States, Australia, Canada, New Zealand and Europe. A significant portion of products sold to dealers, both foreign and domestic, is ultimately funded through government reimbursement programs such as Medicare and Medicaid. The company has also seen a significant shift in reimbursement to customers from managed care entities. Therefore, changes in these programs can have an adverse impact on dealer liquidity and profitability. In addition, reimbursement guidelines in the home health care industry have a substantial impact on the nature and type of equipment an end user can obtain as well as the timing of reimbursement and, thus, affect the product mix, pricing and payment patterns of the company’s customers.
46
Notes to Financial Statements | Derivatives | |
Derivatives
ASC 815 requires companies to recognize all derivative instruments in the consolidated balance sheet as either assets or liabilities at fair value. The accounting for changes in fair value of a derivative is dependent upon whether or not the derivative has been designated and qualifies for hedge accounting treatment and the type of hedging relationship. For derivatives designated and qualifying as hedging instruments, the company must designate the hedging instrument, based upon the exposure being hedged, as a fair value hedge, cash flow hedge, or a hedge of a net investment in a foreign operation.
Cash Flow Hedging Strategy
The company uses derivative instruments in an attempt to manage its exposure to transactional foreign currency exchange risk and interest rate risk. Foreign forward exchange contracts are used to manage the price risk associated with forecasted sales denominated in foreign currencies and the price risk associated with forecasted purchases of inventory over the next twelve months.
The company recognizes its derivative instruments as assets or liabilities in the consolidated balance sheet measured at fair value. A majority of the company’s derivative instruments are designated and qualify as cash flow hedges. Accordingly, the effective portion of the gain or loss on the derivative instrument is reported as a component of other comprehensive income and reclassified into earnings in the same period or periods during which the hedged transaction affects earnings. The remaining gain or loss on the derivative instrument in excess of the cumulative change in the fair value of the hedged item, if any, is recognized in current earnings during the period of change.
To protect against increases/decreases in forecasted foreign currency cash flows resulting from inventory purchases/sales over the next year, the company utilizes foreign currency forward contracts to hedge portions of its forecasted purchases/sales denominated in foreign currencies. The gains and losses are included in cost of products sold and selling, general and administrative expenses on the consolidated statement of comprehensive income (loss). If it is later determined that a hedged forecasted transaction is unlikely to occur, any prospective gains or losses on the forward contracts would be recognized in earnings. The company does not expect any material amount of hedge ineffectiveness related to forward contract cash flow hedges during the next twelve months.
The company has historically not recognized any material amount of ineffectiveness related to forward contract cash flow hedges because the company generally limits its hedges to between 50% and 90% of total forecasted transactions for a given entity’s exposure to currency rate changes and the transactions hedged are recurring in nature. Furthermore, most of the hedged transactions are related to intercompany sales and purchases for which settlement occurs on a specific day each month. Forward contracts with a total notional amount in USD of $43,692,000 and $81,035,000 matured for the three and six months ended June 30, 2017 compared to $58,898,000 and $112,226,000 matured for the three and six months ended June 30, 2016, respectively.
47
Notes to Financial Statements | Derivatives | |
Outstanding foreign currency forward exchange contracts qualifying and designated for hedge accounting treatment were as follows (in thousands USD):
June 30, 2017 | December 31, 2016 | ||||||||||||||
Notional Amount | Unrealized Net Gain (Loss) | Notional Amount | Unrealized Net Gain (Loss) | ||||||||||||
USD / AUD | $ | 2,871 | $ | (34 | ) | $ | 5,841 | $ | 316 | ||||||
USD / CAD | 1,002 | 26 | 2,604 | (18 | ) | ||||||||||
USD / CNY | 1,940 | (12 | ) | 11,252 | (301 | ) | |||||||||
USD / CHF | 180 | 1 | 370 | 15 | |||||||||||
USD / EUR | 38,793 | (933 | ) | 60,387 | 1,826 | ||||||||||
USD / GBP | 2,114 | (91 | ) | 3,253 | (75 | ) | |||||||||
USD / NZD | 6,140 | 179 | 9,650 | (64 | ) | ||||||||||
USD / SEK | 1,889 | (36 | ) | 4,923 | 146 | ||||||||||
USD / MXP | 3,047 | 260 | 6,148 | (417 | ) | ||||||||||
EUR / AUD | 271 | 4 | 506 | 6 | |||||||||||
EUR / GBP | 15,986 | (14 | ) | 14,511 | (686 | ) | |||||||||
EUR / NOK | 1,558 | 50 | 2,503 | (25 | ) | ||||||||||
EUR / NZD | 1,914 | (16 | ) | 3,777 | 16 | ||||||||||
GBP / AUD | 269 | 13 | 503 | 34 | |||||||||||
GBP / CHF | 264 | (2 | ) | 215 | (10 | ) | |||||||||
GBP / SEK | 1,726 | (5 | ) | 1,389 | (42 | ) | |||||||||
CHF / DKK | 327 | 3 | 595 | (2 | ) | ||||||||||
DKK / SEK | 2,318 | 25 | 31,978 | 49 | |||||||||||
NOK / CHF | 716 | 13 | 1,335 | (13 | ) | ||||||||||
NOK / SEK | 1,418 | 69 | 2,618 | 21 | |||||||||||
$ | 84,743 | $ | (500 | ) | $ | 164,358 | $ | 776 | |||||||
Derivatives Not Qualifying or Designated for Hedge Accounting Treatment
The company utilizes foreign currency forward contracts that are not designated as hedges in accordance with ASC 815. These contracts are entered into to eliminate the risk associated with the settlement of short-term intercompany trading receivables and payables between Invacare Corporation and its foreign subsidiaries. The currency forward contracts are entered into at the same time as the intercompany receivables or payables are created so that upon settlement, the gain/loss on the settlement is offset by the gain/loss on the foreign currency forward contract. No material net gain or loss was realized by the company in 2017 or 2016 related to these contracts and the associated short-term intercompany trading receivables and payables.
48
Notes to Financial Statements | Derivatives | |
Foreign currency forward exchange contracts not qualifying or designated for hedge accounting treatment, as well as ineffective hedges, entered into in 2017 and 2016, respectively, and outstanding were as follows (in thousands USD):
June 30, 2017 | December 31, 2016 | ||||||||||||||
Notional Amount | Gain (Loss) | Notional Amount | Gain (Loss) | ||||||||||||
AUD / USD | $ | 10,100 | $ | (206 | ) | $ | 5,800 | $ | 204 | ||||||
CNY / USD | 8,822 | 334 | 5,556 | (24 | ) | ||||||||||
AUD / NZD | 5,000 | (11 | ) | 3,264 | 15 | ||||||||||
$ | 23,922 | $ | 117 | $ | 14,620 | $ | 195 | ||||||||
The fair values of the company’s derivative instruments were as follows (in thousands):
June 30, 2017 | December 31, 2016 | ||||||||||||||
Assets | Liabilities | Assets | Liabilities | ||||||||||||
Derivatives designated as hedging instruments under ASC 815 | |||||||||||||||
Foreign currency forward exchange contracts | $ | 770 | $ | 1,270 | $ | 2,535 | $ | 1,759 | |||||||
Derivatives not designated as hedging instruments under ASC 815 | |||||||||||||||
Foreign currency forward exchange contracts | 343 | 226 | 219 | 24 | |||||||||||
Total derivatives | $ | 1,113 | $ | 1,496 | $ | 2,754 | $ | 1,783 | |||||||
The fair values of the company’s foreign currency forward exchange contract assets and liabilities are included in Other Current Assets and Accrued Expenses, respectively in the Consolidated Balance Sheets. The effect of derivative instruments on Accumulated Other Comprehensive Income (OCI) and the Statement of Comprehensive Income (Loss) and was as follows (in thousands):
Derivatives in ASC 815 cash flow hedge relationships | Amount of Gain (Loss) Recognized in Accumulated OCI on Derivatives (Effective Portion) | Amount of Gain (Loss) Reclassified from Accumulated OCI into Income (Effective Portion) | Amount of Gain (Loss) Recognized in Income on Derivatives (Ineffective Portion and Amount Excluded from Effectiveness Testing) | ||||||||
Three months ended June 30, 2017 | |||||||||||
Foreign currency forward exchange contracts | $ | (1,335 | ) | $ | 301 | $ | 7 | ||||
Six months ended June 30, 2017 | |||||||||||
Foreign currency forward exchange contracts | $ | (571 | ) | $ | 600 | $ | 7 | ||||
Three months ended June 30 2016 | |||||||||||
Foreign currency forward exchange contracts | $ | (2,059 | ) | $ | 208 | $ | 42 | ||||
Six months ended June 30, 2016 | |||||||||||
Foreign currency forward exchange contracts | $ | (931 | ) | $ | 374 | $ | 42 | ||||
Derivatives not designated as hedging instruments under ASC 815 | Amount of Gain (Loss) Recognized in Income on Derivatives | ||||||||||
Three months ended June 30, 2017 | |||||||||||
Foreign currency forward exchange contracts | $ | 52 | |||||||||
Six months ended June 30, 2017 | |||||||||||
Foreign currency forward exchange contracts | $ | 117 | |||||||||
Three months ended June 30, 2016 | |||||||||||
Foreign currency forward exchange contracts | $ | (94 | ) | ||||||||
Six months ended June 30, 2016 | |||||||||||
Foreign currency forward exchange contracts | $ | (377 | ) | ||||||||
49
Notes to Financial Statements | Derivatives | |
The gains or losses recognized as the result of the settlement of cash flow hedge foreign currency forward contracts are recognized in net sales for hedges of inventory sales and in cost of product sold for hedges of inventory purchases. For the three and six months ended June 30, 2017, net sales were decreased by $166,000 and $234,000 while cost of product sold was decreased by $481,000 and $872,000 for net pre-tax realized gains of $315,000 and $638,000, respectively. For the three and six months ended June 30, 2016, net sales were increased by $982,000 and $1,409,000 while cost of product sold was increased by $719,000 and $957,000 for net realized pre-tax gains of $263,000 and $452,000, respectively.
Gains of $52,000 and $117,000 were recognized in selling, general and administrative (SG&A) expenses for the three and six months ended June 30, 2017, respectively, compared to losses of $94,000 and $377,000 for the three and six months ended June 30, 2016, respectively, related to forward contracts not designated as hedging instruments that were entered into to offset gains/losses that were also recorded in SG&A expenses on intercompany trade receivables or payables. The gains/losses on the non-designated hedging instruments were substantially offset by gains/losses on intercompany trade payables.
The company's derivative agreements provide the counterparties with a right of set off in the event of a default that would enable the counterparty to offset any net payment due by the counterparty to the company under the applicable agreement by any amount due by the company to the counterparty under any other agreement. For example, the terms of the agreement would permit a counterparty to a derivative contract that is also a lender under the company's Credit Agreement to reduce any derivative settlement amounts owed to the company under the derivative contract by any amounts owed to the counterparty by the company under the Credit Agreement. In addition, the agreements contain cross-default provisions that could trigger a default by the company under the agreement in the event of a
default by the company under another agreement with the same counterparty. The company does not present any derivatives on a net basis in its financial statements, other than the conversion and bond hedge derivatives which are presented net on the Condensed Consolidated Statement of Comprehensive Income (Loss), and all derivative balances presented are subject to provisions that are similar to master netting agreements.
During the first quarter of 2016, the company entered into privately negotiated convertible 2021 note hedges and 2021 warrants in connection with its sale of $150,000,000 in aggregate principal amount of the company’s 5.00% Convertible Senior Notes due 2021. The 2021 warrants, which increased paid in capital by $12,376,000, are clearly and closely related to the convertible 2021 notes and thus classified as equity. The 2021 note hedge asset and 2021 convertible debt conversion liability were recorded, based on initial fair values, as an asset of $27,975,000 and a liability of $34,480,000, respectively, and these fair values are updated quarterly with the offset to the income statement.
During the second quarter of 2017, the company entered into privately negotiated convertible 2022 note hedges and warrants in connection with its sale of $120,000,000 in aggregate principal amount of the company’s 4.50% Convertible Senior Notes due 2022. The 2022 warrants, which increased paid in capital by $14,100,000, are clearly and closely related to the convertible 2022 notes and thus classified as equity. The 2022 note hedge assets and 2022 convertible debt conversion liability were recorded, based on initial fair values, as an asset of $24,780,000 and a liability of $28,859,000, respectively, and these fair values are updated quarterly with the offset to the income statement. See "Long-Term Debt" in the notes to the Consolidated Financial Statements included elsewhere in this report for more detail.
The fair values of the outstanding convertible note derivatives as of June 30, 2017 and their effect on the Statement of Comprehensive Income (Loss) were as follows (in thousands):
Gain (Loss) | Gain (Loss) | ||||||||||||||||||
Fair Value | Three Months Ended | Six Months Ended | |||||||||||||||||
June 30, 2017 | June 30, 2017 | June 30, 2016 | June 30, 2017 | June 30, 2016 | |||||||||||||||
Convertible 2021 debt conversion long-term liability | $ | (32,227 | ) | $ | (8,250 | ) | $ | 6,565 | $ | (1,519 | ) | $ | 5,847 | ||||||
Convertible 2022 debt conversion long-term liability | (33,251 | ) | (4,392 | ) | — | (4,392 | ) | — | |||||||||||
Convertible 2021 note hedge long-term asset | 27,430 | 7,789 | (6,079 | ) | 1,959 | (4,757 | ) | ||||||||||||
Convertible 2022 note hedge long-term asset | 28,582 | 3,802 | — | 3,802 | — | ||||||||||||||
Net gain (loss) on convertible debt derivatives | $ | (9,466 | ) | $ | (1,051 | ) | $ | 486 | $ | (150 | ) | $ | 1,090 | ||||||
The 2021 and 2022 convertible debt conversion liability amounts and the 2021 and 2022 note hedge asset amounts are included in Other Long-Term Obligations and Other Long-Term
Assets, respectively, in the company's Consolidated Balance Sheets.
50
Notes to Financial Statements | Fair Values | |
Fair Values
Pursuant to ASC 820, the inputs used to derive the fair value of assets and liabilities are analyzed and assigned a level I, II or III priority, with level I being the highest and level III being the lowest in the hierarchy. Level I inputs are quoted prices in active markets for identical assets or liabilities. Level II inputs are quoted prices for similar assets or liabilities in active markets:
quoted prices for identical or similar instruments in markets that are not active; and model-derived valuations in which all significant inputs are observable in active markets. Level III inputs are based on valuations derived from valuation techniques in which one or more significant inputs are unobservable.
The following table provides a summary of the company’s assets and liabilities that are measured on a recurring basis (in thousands):
Basis for Fair Value Measurements at Reporting Date | |||||||
Quoted Prices in Active Markets for Identical Assets / (Liabilities) | Significant Other Observable Inputs | Significant Other Unobservable Inputs | |||||
Level I | Level II | Level III | |||||
June 30, 2017 | |||||||
Forward exchange contracts—net | — | $ | (383 | ) | — | ||
Convertible 2021 debt conversion liability | — | (32,227 | ) | — | |||
Convertible 2021 note hedge asset | — | 27,430 | — | ||||
Convertible 2022 debt conversion liability | — | (33,251 | ) | — | |||
Convertible 2022 note hedge asset | — | 28,582 | — | ||||
December 31, 2016 | |||||||
Forward exchange contracts—net | — | $ | 971 | — | |||
Convertible 2021 debt conversion liability | — | (30,708 | ) | — | |||
Convertible 2021 note hedge asset | — | 25,471 | — | ||||
The carrying values and fair values of the company’s financial instruments are as follows (in thousands):
June 30, 2017 | December 31, 2016 | ||||||||||||||
Carrying Value | Fair Value | Carrying Value | Fair Value | ||||||||||||
Cash and cash equivalents | $ | 160,082 | $ | 160,082 | $ | 124,234 | $ | 124,234 | |||||||
Other investments | 103 | 103 | 108 | 108 | |||||||||||
Installment receivables, net of reserves | 2,386 | 2,386 | 1,834 | 1,834 | |||||||||||
Long-term debt (including current maturities of long-term debt) * | (237,901 | ) | (250,960 | ) | (161,349 | ) | (164,900 | ) | |||||||
Convertible 2021 debt conversion liability in Other Long-Term Obligations | (32,227 | ) | (32,227 | ) | (30,708 | ) | (30,708 | ) | |||||||
Convertible 2021 note hedge in Other Long-Term Assets | 27,430 | 27,430 | 25,471 | 25,471 | |||||||||||
Convertible 2022 debt conversion liability in Other Long-Term Obligations | (33,251 | ) | (33,251 | ) | — | — | |||||||||
Convertible 2022 note hedge in Other Long-Term Assets | 28,582 | 28,582 | — | — | |||||||||||
Forward contracts in Other Current Assets | 1,113 | 1,113 | 2,754 | 2,754 | |||||||||||
Forward contracts in Accrued Expenses | (1,496 | ) | (1,496 | ) | (1,783 | ) | (1,783 | ) | |||||||
________
* The company's long-term debt is shown net of discount and fees associated with the Convertible Senior Notes due 2021 and 2022 on the company's condensed consolidated balance sheet. Accordingly, the fair values of the Convertible Senior Notes due 2021 and 2022 are included in the long-term debt presented in this table is also shown net of the discount and fees.
51
Notes to Financial Statements | Fair Values | |
The company, in estimating its fair value disclosures for financial instruments, used the following methods and assumptions:
Cash, cash equivalents: The carrying value reported in the balance sheet for cash, cash equivalents equals its fair value.
Other investments: The company has made other investments in a limited partnership, which is accounted for using the cost method, adjusted for any estimated declines in value. These investments were acquired in private placements and there is no quoted market price or stated rate of return. The company does not have the ability to easily sell the investment. The company completes an evaluation of the residual value related to such investments in the fourth quarter each year.
Installment receivables: The carrying value reported in the balance sheet for installment receivables approximates its fair value. The interest rates associated with these receivables have not varied significantly since inception. Management believes that after consideration of the credit risk, the net book value of the installment receivables approximates market value.
Long-term debt: Fair value for the company’s convertible debt is based on quoted market-based estimates as of the end of the period, while the revolving credit facility fair value is based upon an estimate of the market for similar borrowing arrangements. The fair values are deemed to be categorized as Level 2 in the fair value hierarchy.
Convertible debt derivatives: The fair values for the convertible debt conversion liability and note hedge derivatives are based on valuation models in which all the significant inputs are observable in active markets.
Forward contracts: The company operates internationally, and as a result, is exposed to foreign currency fluctuations. Specifically, the exposure includes intercompany loans and third party sales or payments. In an attempt to reduce this exposure, foreign currency forward contracts are utilized and accounted for as hedging instruments. The forward contracts are used to hedge the following currencies: AUD, CAD, CHF, CNY, DKK, EUR, GBP, MXP, NOK, NZD, SEK and USD. The company does not use derivative financial instruments for speculative purposes. Fair values for the company’s foreign exchange forward contracts are based on quoted market prices for contracts with similar maturities. The company’s forward contracts are included in Other Current Assets or Accrued Expenses in the Consolidated Balance Sheets.
52
Notes to Financial Statements | Business Segments | |
Business Segments
The company operates in four primary business segments: North America/Home Medical Equipment (NA/HME), Institutional Products Group (IPG), Europe and Asia/Pacific. The NA/HME segment sells each of three primary product lines, which includes: lifestyle, mobility and seating and respiratory therapy products. IPG sells long-term care medical equipment, health care furnishings and accessory products. Europe and Asia/Pacific sell product lines similar to NA/HME and IPG. The accounting policies of each segment are the same as those described in the summary of significant accounting policies for the company’s consolidated financial statements. Intersegment sales and transfers are based on the costs to manufacture plus a reasonable profit element.
As of the third quarter of 2016, the company redefined the measure by which it evaluates segment profit or loss. Segment performance is measured and resources are allocated based on a number of factors, with the primary profit or loss measure being segment operating profit (loss). Segment operating profit (loss) represents net sales less cost of products sold less selling general and administrative expenses. Segment operating profit (loss) excludes unallocated corporate general and administrative expenses not allocated to the segments and intersegment sales and profit eliminations, which are included in All Other. In addition, segment operating profit (loss) further excludes charges related to restructuring activities, asset write-downs and gain or loss on sales of businesses (as applicable). The previous performance measure was earnings before income taxes. With the issuance of convertible debt during 2016, this performance measure has not been utilized by the Chief Operating Decision Maker (CODM) as the interest expense incurred by the company is related to the company’s financing decision to issue convertible debt as compared to the operating decisions resulting from allocation of resources and segment operating income performance. In addition, in 2016, the company included an operating income line on the consolidated statement of comprehensive income (loss) to emphasize the CODM’s emphasis on operating income (loss).
As noted, this performance measure, segment operating income (loss), is used by the CODM for purposes of making decisions about allocating resources to a segment and assessing its performance. In addition, this metric is reviewed by the company’s Board of Directors regarding segment performance and is a key metric in the performance management assessment of the company's employees.
53
Notes to Financial Statements | Business Segments | |
The information by segment is as follows (in thousands):
For the Three Months Ended June 30, | For the Six Months Ended June 30, | ||||||||||||||
2017 | 2016 | 2017 | 2016 | ||||||||||||
Revenues from external customers | |||||||||||||||
Europe (1) | $ | 128,485 | $ | 135,735 | $ | 247,993 | $ | 257,766 | |||||||
NA/HME (1) | 77,689 | 110,700 | 161,951 | 218,372 | |||||||||||
IPG | 15,320 | 16,115 | 31,693 | 34,359 | |||||||||||
Asia/Pacific | 12,023 | 12,487 | 23,603 | 22,092 | |||||||||||
Consolidated | $ | 233,517 | $ | 275,037 | $ | 465,240 | $ | 532,589 | |||||||
Intersegment revenues | |||||||||||||||
Europe | $ | 3,738 | $ | 4,460 | $ | 7,413 | $ | 7,052 | |||||||
NA/HME | 21,050 | 25,294 | 43,145 | 52,909 | |||||||||||
IPG | 975 | 787 | 1,743 | 1,203 | |||||||||||
Asia/Pacific | 3,896 | 4,918 | 7,756 | 10,139 | |||||||||||
Consolidated | $ | 29,659 | $ | 35,459 | $ | 60,057 | $ | 71,303 | |||||||
Restructuring charges before income taxes | |||||||||||||||
Europe | $ | 514 | $ | — | $ | 1,204 | $ | — | |||||||
NA/HME | 3,928 | 662 | 6,170 | 723 | |||||||||||
Asia/Pacific | 545 | 27 | 896 | 68 | |||||||||||
Consolidated | $ | 4,987 | $ | 689 | $ | 8,270 | $ | 791 | |||||||
Operating profit (loss) | |||||||||||||||
Europe (1) | $ | 7,077 | $ | 6,949 | $ | 12,177 | $ | 12,912 | |||||||
NA/HME (1) | (12,395 | ) | (6,649 | ) | (21,821 | ) | (13,058 | ) | |||||||
IPG | 1,472 | 1,532 | 3,370 | 2,956 | |||||||||||
Asia/Pacific | (118 | ) | (337 | ) | (548 | ) | (1,040 | ) | |||||||
All Other (2) | (6,735 | ) | (6,622 | ) | (11,245 | ) | (11,871 | ) | |||||||
Charge expense related to restructuring activities | (4,987 | ) | (689 | ) | (8,270 | ) | (791 | ) | |||||||
Consolidated operating loss | (15,686 | ) | (5,816 | ) | (26,337 | ) | (10,892 | ) | |||||||
Net gain (loss) on convertible derivatives | (1,051 | ) | 486 | (150 | ) | 1,090 | |||||||||
Net Interest expense | (4,596 | ) | (4,300 | ) | (9,026 | ) | (6,619 | ) | |||||||
Loss before income taxes | $ | (21,333 | ) | $ | (9,630 | ) | $ | (35,513 | ) | $ | (16,421 | ) | |||
________
(1) | During the first quarter of 2017, a subsidiary, formerly included in the Europe segment, transferred to the NA/HME segment as it is managed by the NA/HME segment manager effective January 1, 2017. The results for 2016 have been changed accordingly and for the three and six months ended June 30, 2016, the change increased revenues from external customers by $1,137,000 and $2,438,000, respectively, and operating loss by $43,000 and $150,000, respectively, for NA/HME with an offsetting impact for Europe. |
(2) | Consists of un-allocated corporate SG&A costs and intercompany profits, which do not meet the quantitative criteria for determining reportable segments, and gain or loss on convertible debt derivatives. |
54
Notes to Financial Statements | Contingencies | |
Contingencies
General
In the ordinary course of its business, the company is a defendant in a number of lawsuits, primarily product liability actions in which various plaintiffs seek damages for injuries allegedly caused by defective products. All of the product liability lawsuits that the company faces in the United States have been referred to the company's captive insurance company and/or excess insurance carriers while all non-U.S. lawsuits have been referred to the company's commercial insurance carriers. All such lawsuits are generally contested vigorously. The coverage territory of the company's insurance is worldwide with the exception of those countries with respect to which, at the time the product is sold for use or at the time a claim is made, the U.S. government has suspended or prohibited diplomatic or trade relations. The amount recorded for identified contingent liabilities is based on estimates. Amounts recorded are reviewed periodically and adjusted to reflect additional technical and legal information that becomes available. Actual costs to be incurred in future periods may vary from the estimates, given the inherent uncertainties in evaluating certain exposures.
As a medical device manufacturer, the company is subject to extensive government regulation, including numerous laws directed at preventing fraud and abuse and laws regulating reimbursement under various government programs. The marketing, invoicing, documenting, developing, testing, manufacturing, labeling, promoting, distributing and other practices of health care suppliers and medical device manufacturers are all subject to government scrutiny. Most of the company's facilities are subject to inspection at any time by the FDA or similar medical device regulatory agencies in other jurisdictions. Violations of law or regulations can result in administrative, civil and criminal penalties and sanctions, which could have a material adverse effect on the company's business.
Medical Device Regulatory Matters
The FDA in the United States and comparable medical device regulatory authorities in other jurisdictions regulate virtually all aspects of the marketing, invoicing, documenting, development, testing, manufacturing, labeling, promotion, distribution and other practices regarding medical devices. The company and its products are subject to the laws and regulations of the FDA and other regulatory bodies in the various jurisdictions where the company's products are manufactured or sold. The company's failure to comply with the regulatory requirements of the FDA and other applicable medical device regulatory requirements can subject the company to administrative or judicially imposed sanctions or enforcement actions. These sanctions include injunctions, consent decrees, warning letters, civil penalties, criminal penalties, product
seizure or detention, product recalls and total or partial suspension of production.
In December 2012, the company reached agreement with the FDA on the terms of a consent decree of injunction with respect to the company's Corporate facility and its Taylor Street manufacturing facility in Elyria, Ohio. A complaint and consent decree were filed in the U.S. District Court for the Northern District of Ohio, and on December 21, 2012, the Court approved the consent decree and it became effective. The consent decree initially limited the company's (i) manufacture and distribution of power and manual wheelchairs, wheelchair components and wheelchair sub-assemblies at or from its Taylor Street manufacturing facility, (ii) design activities related to wheelchairs and power beds that take place at the impacted Elyria, Ohio facilities and (iii) replacement, service and repair of products already in use from the Taylor Street manufacturing facility. Under the terms of the consent decree, in order to resume full operations at the impacted facilities, the company had to successfully complete independent, third-party expert certification audits at the impacted Elyria facilities, comprised of three distinct certification reports separately submitted to, and subject to acceptance by, the FDA. On May 13, 2013, the FDA accepted the company's first certification report as a result of which the Taylor Street facility was able to resume supplying parts and components for the further manufacturing of medical devices at other company facilities. On July 15, 2013, the FDA accepted the company's second certification report, as a result of which, the company was able to resume design activities at the impacted facilities related to power wheelchairs and power beds. In February, 2016, the independent expert auditor issued its certification report for the third phase of the consent decree indicating substantial compliance with the FDA's Quality System Regulation ("QSR") and the report was submitted to the FDA.
In December 2015, the FDA issued Form 483 observations following an inspection at the Corporate and Taylor Street facilities in Elyria, Ohio (the “December 2015 Form 483”).
In June 2016, the company received a letter from the FDA in follow up to the December 2015 Form 483 and the company’s subsequent responses. To satisfy FDA’s design control requirements, the FDA letter outlined additional steps to be taken by the company, including the requirement for the company to complete the remediation of certain design history files (DHFs) referenced in the December 2015 Form 483 and in the consent decree. Before the company could design any new Taylor Street wheelchair devices, the specified DHFs were required to be completed, then recertified by the company’s third-party expert, whose updated certification report had to be accepted by the FDA.
55
Notes to Financial Statements | Contingencies | |
In April 2017, FDA reinstated the second certification relating to design controls and accepted the third-party expert's certification report. The company then submitted its next required report ("the 5H report") to FDA which detailed the company's actions to improve its quality systems and overall compliance status together with its written responses to any observations in the third-party expert's certification report and prior FDA inspectional observations. FDA initiated reinspection of the company's Corporate and Taylor Street facilities on May 30, 2017. In June 2017, following its inspection of the Corporate and Taylor Street facilities in Elyria, Ohio, the FDA issued a Form 483 with a one item list of inspectional observations and the company timely filed its response to this observation.
On July 24, 2017, FDA notified the company that it is in substantial compliance with the QSR and that the company is permitted to resume full operations at the Corporate and Taylor Street facilities.
Following resumption of full operations on July 25, 2017, the company must undergo five years of audits by a third-party expert auditor selected by the company to determine whether the facilities are in continuous compliance with FDA's QSR and the consent decree. The third-party expert will audit the Corporate and Taylor Street facilities’ activities every six months during the first year following the resumption of full operations and then every 12 months for the next four years thereafter. The FDA has the authority to inspect any FDA registered facility at any time.
As described above, because the previous limitations on production were not permanent in nature, and partial production was allowed, the company does not anticipate any major repair, replacement or scrapping of its fixed assets at the Taylor Street manufacturing facility. Based on the company's expectations at the time of filing of this Quarterly Report on Form 10-Q with respect to the utilization of raw material and with respect to expected future cash flows from production at the Taylor Street manufacturing facility, the company concluded that there was no impairment in the value of the fixed assets related to the Taylor Street manufacturing facility at June 30, 2017.
The majority of the production from the Taylor Street facility is "made to order" custom wheelchairs for customers and, as a result, there was not a significant amount of finished goods inventory on hand at June 30, 2017, and the inventory is expected to be fully utilized. Accordingly, the company concluded that there was not an impairment of the work in process and finished goods at the Taylor Street facility at June 30, 2017. Further, based on its analysis of the raw material inventory at the Taylor Street facility and the company's receipt of FDA's notification that the company can resume full operations at the affected facilities, the company concluded that the value of the inventory was not excessive nor impaired at June 30, 2017.
Although the NA/HME segment has been the segment primarily impacted by the previous limitations in the FDA consent decree, the Asia/Pacific segment also has been negatively affected as a result of the consent decree due to the lower sales volume of microprocessor controllers. During 2012, before the effective date of the consent decree, the company started to experience decreases in net sales in the NA/HME and Asia/Pacific segments. The company believes that those decreases, which continued beyond 2012, were driven in large part by the consent decree which led to delays in new product introductions and to uncertainty regarding the timing of exiting the consent decree, which limited the company's ability to renegotiate and bid on certain customer contracts and otherwise led to a decline in customer orders. The negative effect of the consent decree on customer orders and net sales in these segments has been considerable, and the company expects to continue to experience low levels of net sales in the NA/HME and Asia/Pacific segments at least until it has begun to rebuild net sales following the July 24, 2017 written notification from the FDA that the company may resume full operations at the Corporate and Taylor Street facilities. Even though the company is permitted to resume full operations at the affected facilities, it is uncertain as to whether, or how quickly, the company will be able to rebuild net sales to more typical historical levels, irrespective of market conditions. Accordingly, when compared to the company's 2010 results, the previous limitations in the consent decree had, and likely may continue to have, a material adverse effect on the company's business, financial condition and results of operations. Separately, net sales in the NA/HME segment have likely been impacted by uncertainty on the part of the company's customers as they coped with prepayment reviews and post-payment audits by the Centers for Medicare and Medicaid Services ("CMS") and the impact of the National Competitive Bidding ("NCB") process. In addition, net sales in the NA/HME segment have and may continue to decline as a result of the company's strategic focus away from lower margin, less differentiated products as the company becomes more focused on its clinically complex products.
For additional information regarding the consent decree, please see the following sections of company's Annual Report on Form 10-K for the year ended December 31, 2016: Item 1. Business - Government Regulation and Item 1A. Risk Factors; Item 3. Legal Proceedings; and Item 7. Management's Discussion and Analysis of Financial Condition and Results of Operations - Outlook and - Liquidity and Capital Resources.
The company's warranty reserves are subject to adjustment in future periods based on historical analysis of warranty claims and as new developments occur that may change the company's estimates related to specific product recalls. See Current Liabilities in the Notes to the Consolidated Financial Statements for the total provision amounts and a reconciliation of the changes in the warranty accrual.
56
Notes to Financial Statements | Contingencies | |
In December 2010, the company received a warning letter from the FDA related to quality system processes and procedures at the company's Sanford, Florida facility. In January 2014, the FDA conducted inspections at the company’s manufacturing facility in Suzhou, China and at the company’s electronic components subsidiary in Christchurch, New Zealand, covering quality systems and current Good Manufacturing Practice regulations. In August 2014, the FDA inspected Alber GmbH in Albstadt, Germany. The FDA issued its inspectional observations on Forms 483 to the company after these inspections, and the company submitted its responses to the agency in a timely manner. In October 2014, the FDA conducted an inspection at the Sanford facility and, at the conclusion, issued its Form 483 observations. In December 2015, the FDA issued Form 483 observations following a 2015 inspection at the Corporate and Taylor Street facilities in Elyria, Ohio. In July 2016, the FDA inspected Motion Concepts L.P. in Concord, Ontario, Canada and issued its inspectional observations on Form 483. In May 2017, the FDA inspected Alber GmbH in Albstadt, Germany and, at the conclusion, issued its inspectional observations on Form 483. The company has timely filed its responses to these Forms 483 with the FDA and continues to work on addressing the FDA's observations. The results of regulatory claims, proceedings, investigations, or litigation are difficult to predict. An unfavorable resolution or outcome of the FDA warning letter or other FDA enforcement related to the Sanford or other company facilities could materially and adversely affect the company's business, financial condition, and results of operations.
Any of the above contingencies could have an adverse impact on the company's financial condition or results of operations.
57
Notes to Financial Statements | Market Risk and Controls | |
Item 3. Quantitative and Qualitative Disclosures About Market Risk.
During the quarter ended June 30, 2017, there were no material changes to market risk information provided in the company's Annual Report on Form 10-K for the year ended December 31, 2016. Please refer to Item 7A - Quantitative and Qualitative Disclosures About Market Risk of company's Annual Report on Form 10-K for the period ending December 31, 2016.
Item 4. Controls and Procedures.
(a) Evaluation of Disclosure Controls and Procedures
As of June 30, 2017, an evaluation was performed, under the supervision and with the participation of the company’s management, including the Chief Executive Officer and Chief Financial Officer, of the effectiveness of the design and operation of the company’s disclosure controls and procedures (as defined in Exchange Act Rules 13a-15(e) and 15d-15(e)). Based on that evaluation, the company’s management, including the Chief Executive Officer and Chief Financial Officer, concluded that the company’s disclosure controls and procedures were effective as of June 30, 2017, in ensuring that information required to be disclosed by the company in the reports it files and submits under the Exchange Act is (1) recorded, processed, summarized and reported, within the time periods specified in the Commission’s rules and forms and (2) accumulated and communicated to the company’s management, including the Chief Executive Officer and the Chief Financial Officer, as appropriate to allow for timely decisions regarding required disclosure.
(b) Changes in Internal Control Over Financial Reporting
There have been no changes in the company’s internal control over financial reporting that occurred during the company’s last fiscal quarter that have materially affected, or are reasonably likely to materially affect, the company’s internal control over financial reporting.
58
Part II | Other Information | |
Part II. OTHER INFORMATION
Item 1. Legal Proceedings.
In the ordinary course of its business, the company is a defendant in a number of lawsuits, primarily product liability actions in which various plaintiffs seek damages for injuries allegedly caused by defective products. All of the product liability lawsuits that the company faces in the United States have been referred to the company's captive insurance company and/or excess insurance carriers while all non-U.S. lawsuits have been referred to the company's commercial insurance carriers. All such lawsuits are generally contested vigorously. The coverage territory of the company's insurance is worldwide with the exception of those countries with respect to which, at the time the product is sold for use or at the time a claim is made, the U.S. government has suspended or prohibited diplomatic or trade relations. Management does not believe that the outcome of any of these actions will have a material adverse effect upon the company's business or financial condition.
In December 2012, the company reached agreement with the FDA on the terms of a consent decree of injunction with respect to the company's Corporate facility and its Taylor Street wheelchair manufacturing facility in Elyria, Ohio. A complaint and consent decree were filed in the U.S. District Court for the Northern District of Ohio, and on December 21, 2012, the Court approved the consent decree and it became effective. On July 24, 2017, the company received notice from FDA that the company has successfully satisfied FDA’s requirements under the consent decree, that the company is in substantial compliance with the QSR and that the company is permitted to resume full operations at its Corporate and Taylor Street manufacturing facility in Elyria, Ohio. The company is now able to produce and sell all products made in the Taylor Street facility without the previous restrictions which had been in effect since December 21, 2012, under the consent decree.
For a description of the status and certain material terms of the consent decree, see the “Contingencies” note to the financial statements contained in Item 1 of this Quarterly Report on Form 10-Q.
Under the consent decree, the FDA has the authority to inspect the Corporate and Taylor Street facilities at any time. The FDA also has the authority to order the company to take a wide variety of actions if the FDA finds that the company is not in compliance with the consent decree or FDA regulations, including requiring the company to cease all operations relating to Taylor Street products. The FDA also can order the company to undertake a partial cessation of operations or a recall, issue a safety alert, public health advisory, or press release, or to take any other corrective action the FDA deems necessary with respect to Taylor Street products.
The FDA also has authority under the consent decree to assess liquidated damages of $15,000 per violation per day for any violations of the consent decree, FDA regulations or the federal Food, Drug, and Cosmetic Act. The FDA also may assess liquidated damages for shipments of adulterated or misbranded devices, except as permitted by the consent decree, in the amount of twice the sale price of any such adulterated or misbranded device. The liquidated damages are capped at $7,000,000 for each calendar year. The liquidated damages are in addition to any other remedies otherwise available to the FDA, including civil money penalties.
For additional information regarding the consent decree, please see the "Contingencies" note to the financial statements contained in Item I of this Quarterly Report on Form 10-Q, the risk factors referred to in Item 1A of this Quarterly Report on Form 10-Q, and the following sections of the company's Annual Report on Form 10-K for the period ending December 31, 2016: Item 1. Business - Government Regulation; Item 1A. Risk Factors; and Item 7. Management's Discussion and Analysis of Financial Condition and Results of Operations - Outlook and - Liquidity and Capital Resources.
Item 1A. Risk Factors
In addition to the other information set forth in this report, you should carefully consider the risk factors disclosed in Item 1A of the company’s Annual Report on Form 10-K for the fiscal period ended December 31, 2016, as updated and superseded by the risk factors disclosed in Item 8.01 of the company's Current Report on Form 8-K filed on June 7, 2017 and Exhibit 99.2 attached thereto.
59
Part II | Other Information | |
Item 2. Unregistered Sales of Equity Securities and Use of Proceeds
The following table presents information with respect to repurchases of common shares made by the company during the three months ended June 30, 2017.
Period | Total Number of Shares Purchased (1) | Avg. Price Paid Per Share $ | Total Number of Shares Purchased as Part of Publicly Announced Plans or Programs | Maximum Number of Shares That May Yet Be Purchased Under the Plans or Programs (2) | |||||||
4/1/2017 | - | 4/30/2017 | — | $ | — | — | 2,453,978 | ||||
5/1/2017 | - | 5/31/2017 | 81,941 | 14.90 | — | 2,453,978 | |||||
6/1/2017 | - | 6/30/2017 | — | — | — | 2,453,978 | |||||
Total | 81,941 | $ | 14.90 | — | 2,453,978 | ||||||
________
(1) | All 81,941 shares repurchased between April 1, 2017 and June 30, 2017 were surrendered to the company by employees for minimum tax withholding purposes in conjunction with the vesting of restricted shares awarded to the employees or exercise of non-qualified options under the company's equity compensation plans. |
(2) | In 2001, the Board of Directors authorized the company to purchase up to 2,000,000 Common Shares, excluding any shares acquired from employees or directors as a result of the exercise of options or vesting of restricted shares pursuant to the company’s performance plans. The Board of Directors reaffirmed its authorization of this repurchase program on November 5, 2010, and on August 17, 2011 authorized an additional 2,046,500 shares for repurchase under the plan. To date, the company has purchased 1,592,522 shares under this program, with authorization remaining to purchase 2,453,978 shares. The company purchased no shares pursuant to this Board authorized program during the quarter ended June 30, 2017. |
Under the terms of the company's Credit Agreement, repurchases of shares by the company generally are not permitted except in certain limited circumstances in connection with the vesting or exercise of employee equity compensation awards.
60
Part II | Other Information | |
Item 6. Exhibits
Exhibit No. | |
Chief Executive Officer Rule 13a-14(a)/15d-14(a) Certification (filed herewith). | |
Chief Financial Officer Rule 13a-14(a)/15d-14(a) Certification (filed herewith). | |
Certification of the Chief Executive Officer pursuant to 18 U.S.C. Section 1350, as adopted pursuant to Section 906 of the Sarbanes-Oxley Act of 2002 (furnished herewith). | |
Certification of the Chief Financial Officer pursuant to 18 U.S.C. Section 1350, as adopted pursuant to Section 906 of the Sarbanes-Oxley Act of 2002 (furnished herewith). | |
101.INS* | XBRL instance document |
101.SCH* | XBRL taxonomy extension schema |
101.CAL* | XBRL taxonomy extension calculation linkbase |
101.DEF* | XBRL taxonomy extension definition linkbase |
101.LAB* | XBRL taxonomy extension label linkbase |
101.PRE* | XBRL taxonomy extension presentation linkbase |
* Pursuant to Rule 406T of Regulation S-T, the Interactive Data Files on Exhibit 101 hereto are deemed not filed or part of a registration statement or prospectus for purposes of Sections 11 or 12 of the Securities Act of 1933, as amended, are deemed not filed for purposes of Section 18 of the Securities and Exchange Act of 1934, as amended, and otherwise are not subject to liability under those sections.
61
Signatures | ||
SIGNATURES
Pursuant to the requirements of the Securities Exchange Act of 1934, as amended, the registrant has duly caused this report to be signed on its behalf by the undersigned thereunto duly authorized.
INVACARE CORPORATION | ||||
Date: | August 7, 2017 | By: | /s/ Robert K. Gudbranson | |
Name: Robert K. Gudbranson | ||||
Title: Chief Financial Officer | ||||
(As Principal Financial and Accounting Officer and on behalf of the registrant) | ||||
62