Attached files
| file | filename |
|---|---|
| EX-99.1 - PRESS RELEASE OF GRANITE POINT MORTGAGE TRUST INC., DATED AUGUST 7, 2017. - Granite Point Mortgage Trust Inc. | gpmtq217financialresults.htm |
| 8-K - 8-K Q2-2017 EARNINGS RELEASE - Granite Point Mortgage Trust Inc. | a8-kgranitepointq2x2017ear.htm |

2Q 2017 Investor Presentation

Safe Harbor Statement
This presentation contains, in addition to historical information, certain forward-looking statements that are based on our current assumptions,
expectations and projections about future performance and events. In particular, statements regarding future economic performance, finances, and
expectations and objectives of management constitute forward-looking statements. Forward-looking statements are not historical in nature and can
be identified by words such as "believes," "expects," "may," "will," "should," "seeks," "approximately," "intends," "plans," "estimates," "anticipates,"
“targets,” “goals,” “future,” “likely” and other expressions that are predictions of or indicate future events and trends and that do not relate to
historical matters.
Although the forward-looking statements contained in this presentation are based upon information available at the time the statements are made
and reflect the best judgment of our senior management, forward-looking statements inherently involve known and unknown risks, uncertainties and
other factors, which may cause the actual results, performance or achievements to differ materially from anticipated future results. Important factors
that could cause actual results to differ materially from expectations include, among others: (i) the state of the U.S. economy generally or in specific
geographic regions; (ii) the state of the commercial real estate market and the availability and cost of our target assets; (iii) defaults by borrowers in
paying debt service on outstanding items and borrowers’ abilities to manage and stabilize properties; (iv) actions and initiatives of the U.S.
Government and changes to U.S. Government policies; (v) our ability to obtain financing arrangement on favorable terms if at all; (vi) general volatility
of the securities markets in which we invest; (vii) changes in interest rates and the market value of our investments; (viii) rates of default or decreased
recovery rates on our target investments; (ix) the degree to which our hedging strategies may or may not protect us from interest rate volatility; (x)
changes in governmental regulations, tax law and rates, and similar matters; and (xi) our ability to qualify as a REIT for U.S. federal income tax
purposes. These forward-looking statements apply only as of the date of this press release. We are under no duty to update any of these forward-
looking statements after the date of this presentation to conform these statements to actual results or revised expectations. You should, therefore,
not rely on these forward-looking statements as predictions of future events.
For historical information relating to TH Commercial Holdings LLC, you should consider the information contained in Two Harbors Investment Corp.’s
filings with the U.S. Securities and Exchange Commission (“SEC”), including its Annual Report on Form 10-K for the fiscal year ended December 31,
2016 and Quarterly Report on Form 10-Q for the period ended March 31, 2017, particularly in the sections entitled "Management’s Discussion and
Analysis of Financial Condition and Results of Operations” and “Risk Factors," as well as Two Harbors’ subsequent filings with the SEC. Other unknown
or unpredictable factors also could have material adverse effects on our future results, performance or achievements.
This presentation also contains estimates and other statistical data made by independent parties and by us relating to market size and growth and
other data about our industry. This data involves a number of assumptions and limitations, and you are cautioned not to give undue weight to such
estimates. In addition, projections, assumptions and estimates of our future performance and the future performance of the markets in which we
operate are necessarily subject to a high degree of uncertainty and risk.
2

Second Quarter 2017 Highlights(1)
3
SUMMARY
• Completed initial public offering (“IPO”) on June 28, 2017, raising net proceeds of $181.9 million, resulting in an equity
base of $832.4 million.
• Acquired a portfolio of commercial real estate debt investments with an aggregate carrying value of approximately $1.8
billion from Two Harbors Investment Corp. (NYSE: TWO) in exchange for approximately 33.1 million shares of Granite Point
common stock, concurrent with the closing of the IPO.
• Reported book value of $19.25 per common share at June 30, 2017.
• Originated 6 senior floating rate commercial real estate loans representing aggregate loan amounts, including future
fundings, of approximately $272.1 million during the quarter ended June 30, 2017.
• Funded $238.7 million of principal balance of loans during the quarter ended June 30, 2017.
ACTIVIT Y POST QUARTER-END
• Generated a pipeline of senior floating rate commercial real estate loans representing aggregate loan amounts, including
any future fundings, of approximately $320 million, which have either closed or are in the closing process, subject to
fallout, as of July 31, 2017.
• Increased the maximum borrowing capacity under the Wells Fargo credit facility by approximately $97 million, for a total
maximum borrowing capacity of approximately $473 million.
(1) Except as otherwise indicated in this presentation, reported data is as of or for the period ended June 30, 2017.

Granite Point Mortgage Trust Inc. Overview
4
C YC LE -T EST ED S E N IO R
I N V E STM E NT T E A M
AT T RAC T I VE A N D S U STA I NAB LE
M A R KE T O P P O RTUNI T Y
H I G H C R E D IT Q UA L IT Y
I N V E STM E NT P O RT FO L IO
D I F F ER E NT IATE D D I R E C T
O R I G INAT I O N P L ATFO R M
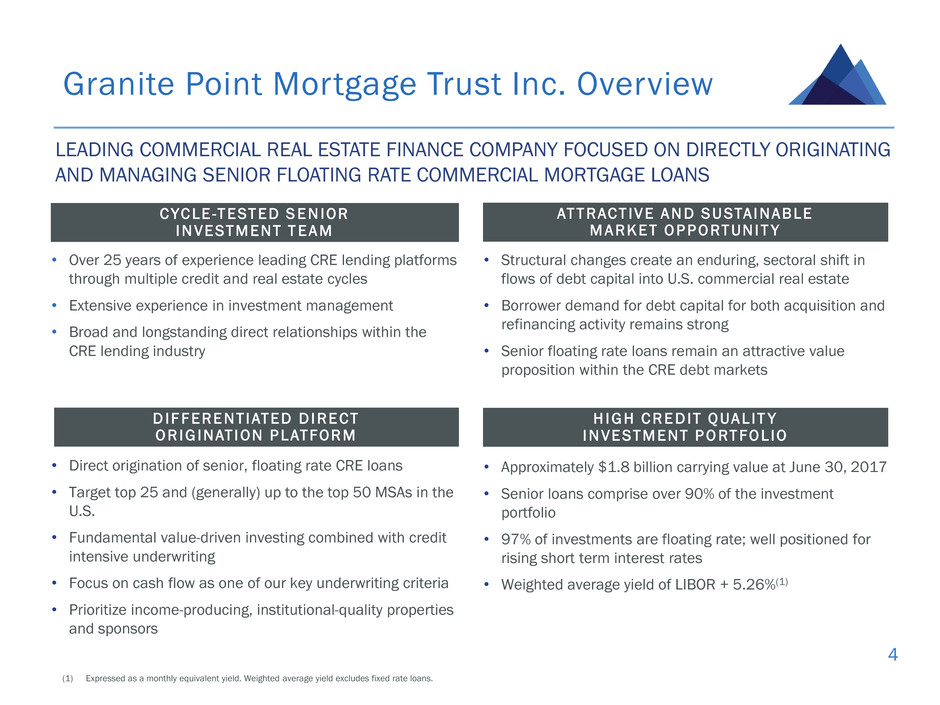
LEADING COMMERCIAL REAL ESTATE FINANCE COMPANY FOCUSED ON DIRECTLY ORIGINATING
AND MANAGING SENIOR FLOATING RATE COMMERCIAL MORTGAGE LOANS
• Over 25 years of experience leading CRE lending platforms
through multiple credit and real estate cycles
• Extensive experience in investment management
• Broad and longstanding direct relationships within the
CRE lending industry
• Structural changes create an enduring, sectoral shift in
flows of debt capital into U.S. commercial real estate
• Borrower demand for debt capital for both acquisition and
refinancing activity remains strong
• Senior floating rate loans remain an attractive value
proposition within the CRE debt markets
• Approximately $1.8 billion carrying value at June 30, 2017
• Senior loans comprise over 90% of the investment
portfolio
• 97% of investments are floating rate; well positioned for
rising short term interest rates
• Weighted average yield of LIBOR + 5.26%(1)
• Direct origination of senior, floating rate CRE loans
• Target top 25 and (generally) up to the top 50 MSAs in the
U.S.
• Fundamental value-driven investing combined with credit
intensive underwriting
• Focus on cash flow as one of our key underwriting criteria
• Prioritize income-producing, institutional-quality properties
and sponsors
(1) Expressed as a monthly equivalent yield. Weighted average yield excludes fixed rate loans.

Market Environment
5 (1) Source: Trepp LLC and Federal Reserve Bank, dated as of 12/31/2016.
(2) Source: Real Capital Analytics. Data from 12/31/2001 to 12/31/2016.
(3) Source: Real Capital Analytics. Data from 1/1/1983 through 12/31/2016.
(4) Source: Census Bureau and BEA. Data from 1/1/1993 to 12/31/2016.
DEMAND FOR COMMERCIAL REAL ESTATE LOANS REMAINS H IGH…
$-
$100
$200
$300
$400
$500
$600
$
in
b
ill
io
ns
Sale transaction volume rebounded strongly post the
global economic crisis(2)
U.S. Foreign
…AND MARKET FUNDAMENTALS REMAIN STRONG.
5.0%
7.0%
9.0%
11.0%
13.0%
15.0%
-10.0%
-5.0%
0.0%
5.0%
10.0%
15.0%
1Q
92
1Q
94
1Q
96
1Q
98
1Q
00
1Q
02
1Q
04
1Q
06
1Q
08
1Q
10
1Q
12
1Q
14
1Q
16
V
ac
an
cy
(%
)
N
O
I G
ro
w
th
(%
)
Occupancies and rents continue to improve across most
markets and property types(3)
NOI Growth Vacancy
0.80%
0.95%
1.10%
1.25%
1.40%
1.55%
1.70%
1.85%
2.00%
2.15%
2.30%
19
93
19
94
19
95
19
96
19
97
19
98
19
99
20
00
20
01
20
02
20
03
20
04
20
05
20
06
20
07
20
08
20
09
20
10
20
11
20
12
20
13
20
14
20
15
20
16
Historically low level of new construction over past
several years has constrained supply of properties(4)
Pct. GDP Average (1993-2009) Average (2010-2016)
$-
$50
$100
$150
$200
$250
$300
$350
$400
$450
2017 2018 2019 2020 2021
$
in
b
ill
io
ns
Over $1.5 trillion of loans maturing
over the next 5 years(1)
Banks CMBS Life Cos Other

Investment Strategy and Target Assets
6
INVESTMENT STRATEGY TARGET INVESTMENTS
• Focus on generating stable and attractive cash flows
while preserving capital base
– Primarily directly originated investments funding property
acquisition, refinancing, recapitalization, restructuring and
repositioning purposes with high credit-quality owners
– Asset-by-asset portfolio construction focused on property and local
market fundamentals and relative value across property types and
markets, as well as within the capital structure
• Actively participate in primary and secondary markets(1)
Primary target investments
• Senior floating rate commercial real estate loans
• Transitional loans on a variety of property types located in
primary and secondary markets in the U.S.
• Generally sized between $25 million and $150 million
• Stabilized loan-to-values (“LTVs”) generally ranging from
55% to 70%
• Loan yields generally ranging from LIBOR + 4.00% to
5.50%
Secondary target investments
• Subordinated interests (or B-notes), mezzanine loans,
debt-like preferred equity and real estate-related
securities
37%
63%
Primary Markets Secondary Markets
(1) Primary markets are defined as the top 5 MSAs. Secondary markets are defined as MSAs 6 and above.
(2) Stabilized LTV considers the "as stabilized" value (as determined in conformance with USPAP) of the underlying property or properties, as set forth in the original appraisal. "As stabilized" value may be
based on certain assumptions, such as future construction completion, projected re-tenanting, payment of tenant improvement or leasing commissions allowances or free or abated rent periods, or
increased tenant occupancies.

Floating
96.9%
Fixed
3.1%
Investment Portfolio Overview
7
PROPERTY TYPE GEOGRAPHY
COUPON STRUCTURE INVESTMENT TYPE
Note: Portfolio data as of June 30, 2017.
(1) Expressed as a monthly equivalent yield. Weighted average yield excludes fixed rate loans.
(2) Stabilized LTV considers the "as stabilized" value (as determined in conformance with USPAP) of the underlying property or properties, as set forth in the original appraisal. "As stabilized" value may be based on certain
assumptions, such as future construction completion, projected re-tenanting, payment of tenant improvement or leasing commissions allowances or free or abated rent periods, or increased tenant occupancies.
(3) Weighted average of original maturity of each investment in the portfolio.
(4) Includes mixed-use properties.
KEY PORTFOLIO STATISTICS
Number of
Investments
47
Average Size ~$39m
Weighted
Avg. Yield
L + 5.26%(1)
Weighted Avg.
Stabilized LTV
63.9%(2)
Weighted Avg.
Original Maturity
3.7 years(3)
Office
53.1%
Multifamily
14.8%
Retail(4)
13.7%
Hotel
10.4%
Industrial
8.0%
First Mortgage
91.1%
Mezzanine
5.0%
B-Notes
0.8%
Northeast
36.9%
West
21.7%
Southwest
18.9%
Southeast
17.8%
Midwest
4.7%
CMBS
3.1%

Financing Facilities Update
8
$ in millions Amount Outstanding Unused Capacity Total Capacity(1)
J.P. Morgan $211.7 $288.3 $500.0
Morgan Stanley(2) $229.9 $270.1 $500.0
Goldman Sachs $15.8 $234.2 $250.0
Citi - $250.0 $250.0
Wells Fargo(3)(4) $90.0 $286.5 $376.5
Note: Data as of June 30, 2017.
(1) Excludes short-term bridge financing facility with UBS.
(2) Includes an option to be exercised at the company’s discretion to increase the maximum facility amount to $600 million, subject to certain customary conditions contained in the agreement.
(3) The facility finances a fixed pool of assets.
(4) Post quarter-end, increased the maximum borrowing capacity under the Wells Fargo credit facility by approximately $97 million, for a total maximum borrowing capacity of approximately $473 million.

Appendix
9

Consolidated Balance Sheets
10
(4)
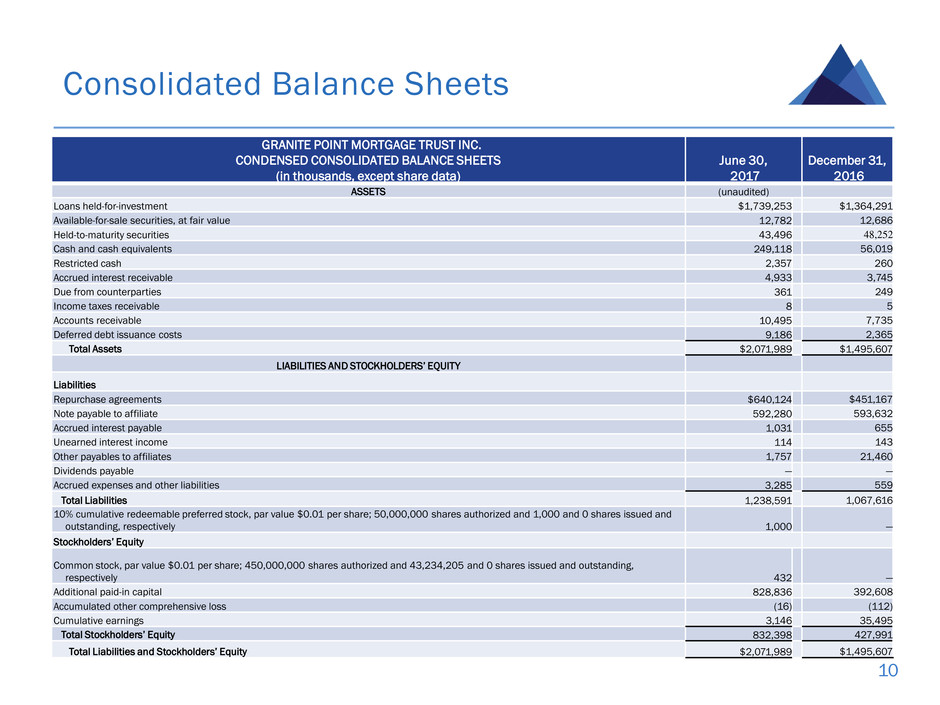
GRANITE POINT MORTGAGE TRUST INC.
CONDENSED CONSOLIDATED BALANCE SHEETS
(in thousands, except share data)
June 30,
2017
December 31,
2016
ASSETS (unaudited)
Loans held-for-investment $1,739,253 $1,364,291
Available-for-sale securities, at fair value 12,782 12,686
Held-to-maturity securities 43,496 48,252
Cash and cash equivalents 249,118 56,019
Restricted cash 2,357 260
Accrued interest receivable 4,933 3,745
Due from counterparties 361 249
Income taxes receivable 8 5
Accounts receivable 10,495 7,735
Deferred debt issuance costs 9,186 2,365
Total Assets $2,071,989 $1,495,607
LIABILITIES AND STOCKHOLDERS’ EQUITY
Liabilities
Repurchase agreements $640,124 $451,167
Note payable to affiliate 592,280 593,632
Accrued interest payable 1,031 655
Unearned interest income 114 143
Other payables to affiliates 1,757 21,460
Dividends payable — —
Accrued expenses and other liabilities 3,285 559
Total Liabilities 1,238,591 1,067,616
10% cumulative redeemable preferred stock, par value $0.01 per share; 50,000,000 shares authorized and 1,000 and 0 shares issued and
outstanding, respectively 1,000
—
Stockholders’ Equity
Common stock, par value $0.01 per share; 450,000,000 shares authorized and 43,234,205 and 0 shares issued and outstanding,
respectively 432
—
Additional paid-in capital 828,836 392,608
Accumulated other comprehensive loss (16) (112)
Cumulative earnings 3,146 35,495
Total Stockholders’ Equity 832,398 427,991
Total Liabilities and Stockholders’ Equity $2,071,989 $1,495,607

Consolidated Statements of Comprehensive Income
11
(4)
GRANITE POINT MORTGAGE TRUST INC.
CONDENSED CONSOLIDATED STATEMENTS OF COMPREHENSIVE INCOME
(in thousands, except share data)
Three Months Ended
June 30,
Six Months Ended
June 30,
2017 2016 2017 2016
Interest income: (unaudited) (unaudited)
Loans held-for-investment $24,290 $12,238 $47,558 $22,129
Available-for-sale securities 256 248 502 516
Held-to-maturity securities 920 1,062 1,852 2,243
Cash and cash equivalents 4 2 6 3
Total interest income 26,100 13,550 49,918 24,891
Interest expense 7,773 2,576 13,879 4,028
Net interest income 18,327 10,974 36,039 20,863
Other income:
Ancillary fee income — 21 — 26
Total other income — 21 — 26
Expenses:
Management fees 1,925 1,640 3,587 3,409
Servicing expenses 307 122 629 227
General and administrative expenses 1,900 1,396 4,173 3,483
Total expenses 4,132 3,158 8,389 7,119
Income before income taxes 14,195 7,837 27,650 13,770
Benefit from income taxes (2) (1) (1) (7)
Net income $14,197 $7,838 $27,651 $13,777
Basic and diluted earnings per weighted average common share (1) $— $— $— $—
Dividends declared per common share $— $— $— $—
Basic and diluted weighted average number of shares of common stock outstanding 43,234,205 — 43,234,205 —
Comprehensive income:
Net income $14,197 $7,838 $27,651 $13,777
Other comprehensive income (loss), net of tax:
Unrealized gain (loss) on available-for-sale securities 16 63 96 (192)
Other comprehensive income (loss) 16 63 96 (192)
Comprehensive income $14,213 $7,901 $27,747 $13,585
(1) The Company has calculated earnings per share only for the period common stock was outstanding, referred to as the post-formation period. The Company has defined the post-formation period to be the
period from the date the Company commenced operations as a publicly traded company on June 28, 2017 through June 30, 2017, or three days of activity. Earnings per share is calculated by dividing the
net income for the post-formation period by the weighted average number of shares outstanding during the post-formation period.

