Attached files
| file | filename |
|---|---|
| EX-10.1 - EXHIBIT 10.1 - Delek US Holdings, Inc. | dk10qex101wellsamend.htm |
| EX-32.2 - EXHIBIT 32.2 - Delek US Holdings, Inc. | dk-ex322xcfocertificationx.htm |
| EX-32.1 - EXHIBIT 32.1 - Delek US Holdings, Inc. | dk-ex321xceocertificationx.htm |
| EX-31.2 - EXHIBIT 31.2 - Delek US Holdings, Inc. | dk-ex312xcfocertificationx.htm |
| EX-31.1 - EXHIBIT 31.1 - Delek US Holdings, Inc. | dk-ex311xceocertificationx.htm |
| EX-10.2 - EXHIBIT 10.2 - Delek US Holdings, Inc. | dk-10qxex102firstamendment.htm |
UNITED STATES
SECURITIES AND EXCHANGE COMMISSION
Washington, D.C. 20549
Form 10-Q
(Mark One)
þ | QUARTERLY REPORT PURSUANT TO SECTION 13 OR 15(d) OF THE SECURITIES EXCHANGE ACT OF 1934 | |||
For the quarterly period ended June 30, 2017 | ||||
or
o | TRANSITION REPORT PURSUANT TO SECTION 13 OR 15(d) OF THE SECURITIES EXCHANGE ACT OF 1934 | |
For the transition period from to | ||
Commission file number 001-38142
DELEK US HOLDINGS, INC.
(Exact name of registrant as specified in its charter)
Delaware | 35-2581557 | |
(State or other jurisdiction of | (I.R.S. Employer | |
incorporation or organization) | Identification No.) | |
7102 Commerce Way | ||
Brentwood, Tennessee | 37027 | |
(Address of principal executive offices) | (Zip Code) | |
(615) 771-6701
(Registrant’s telephone number, including area code)
Not Applicable
(Former name, former address and former fiscal year, if changed since last report)
Indicate by check mark whether the registrant (1) has filed all reports required to be filed by Section 13 or 15(d) of the Securities Exchange Act of 1934 during the preceding 12 months (or for such shorter period that the registrant was required to file such reports), and (2) has been subject to such filing requirements for the past 90 days. Yes þ No o
Indicate by check mark whether the registrant has submitted electronically and posted on its corporate Web site, if any, every Interactive Data File required to be submitted and posted pursuant to Rule 405 of Regulation S-T during the preceding 12 months (or for such shorter period that the registrant was required to submit and post such files). Yes þ No o
Indicate by check mark whether the registrant is a large accelerated filer, an accelerated filer, a non-accelerated filer, a smaller reporting company or an emerging growth company. See the definitions of "large accelerated filer," "accelerated filer," "smaller reporting company" and "emerging growth company" in Rule 12b-2 of the Exchange Act.
Large accelerated filer þ | Accelerated filer o | Non-accelerated filer o | Smaller reporting company o | Emerging growth company o | ||||
(Do not check if a smaller reporting company) | ||||||||
Indicate by check mark whether the registrant is a shell company (as defined in Rule 12b-2 of the Exchange Act). Yes o No þ
If an emerging growth company, indicate by check mark if the registrant has elected not to use the extended transition period for complying with any new or revised financial accounting standards provided pursuant to Section 13(a) of the Exchange Act. o
At August 3, 2017, there were 81,408,472 shares of common stock, $0.01 par value, outstanding (excluding securities held by, or for the account of, the Company or its subsidiaries).
TABLE OF CONTENTS
Exhibit 3.1 | |
Exhibit 3.2 | |
Exhibit 3.3 | |
Exhibit 10.1 | |
Exhibit 10.2 | |
Exhibit 10.3 | |
Exhibit 31.1 | |
Exhibit 31.2 | |
Exhibit 32.1 | |
Exhibit 32.2 | |
EX-101 INSTANCE DOCUMENT | |
EX-101 SCHEMA DOCUMENT | |
EX-101 CALCULATION LINKBASE DOCUMENT | |
EX-101 LABELS LINKBASE DOCUMENT | |
EX-101 PRESENTATION LINKBASE DOCUMENT | |
2
Part I.
FINANCIAL INFORMATION
Item 1. | Financial Statements |
Delek US Holdings, Inc.
Condensed Consolidated Balance Sheets (Unaudited)
(In millions, except share and per share data)
June 30, 2017 | December 31, 2016 | |||||||
ASSETS | ||||||||
Current assets: | ||||||||
Cash and cash equivalents | $ | 572.3 | $ | 689.2 | ||||
Accounts receivable | 284.0 | 265.9 | ||||||
Accounts receivable from related party | 4.0 | 0.1 | ||||||
Inventories, net of inventory valuation reserves | 377.4 | 392.4 | ||||||
Other current assets | 74.0 | 49.3 | ||||||
Total current assets | 1,311.7 | 1,396.9 | ||||||
Property, plant and equipment: | ||||||||
Property, plant and equipment | 1,619.1 | 1,587.6 | ||||||
Less: accumulated depreciation | (540.5 | ) | (484.3 | ) | ||||
Property, plant and equipment, net | 1,078.6 | 1,103.3 | ||||||
Goodwill | 12.2 | 12.2 | ||||||
Other intangibles, net | 27.0 | 26.7 | ||||||
Equity method investments | 357.3 | 360.0 | ||||||
Other non-current assets | 89.7 | 80.7 | ||||||
Total assets | $ | 2,876.5 | $ | 2,979.8 | ||||
LIABILITIES AND STOCKHOLDERS’ EQUITY | ||||||||
Current liabilities: | ||||||||
Accounts payable | $ | 470.4 | $ | 494.6 | ||||
Accounts payable to related party | 3.8 | 1.8 | ||||||
Current portion of long-term debt | 91.4 | 84.4 | ||||||
Obligation under Supply and Offtake Agreement | 145.4 | 124.6 | ||||||
Accrued expenses and other current liabilities | 164.8 | 229.8 | ||||||
Total current liabilities | 875.8 | 935.2 | ||||||
Non-current liabilities: | ||||||||
Long-term debt, net of current portion | 731.1 | 748.5 | ||||||
Environmental liabilities, net of current portion | 5.8 | 6.2 | ||||||
Asset retirement obligations | 5.4 | 5.2 | ||||||
Deferred tax liabilities | 74.8 | 76.2 | ||||||
Other non-current liabilities | 32.2 | 26.0 | ||||||
Total non-current liabilities | 849.3 | 862.1 | ||||||
Stockholders’ equity: | ||||||||
Preferred stock, $0.01 par value, 10,000,000 shares authorized, no shares issued and outstanding | — | — | ||||||
Common stock, $0.01 par value, 110,000,000 shares authorized, 67,350,767 shares and 67,150,352 shares issued at June 30, 2017 and December 31, 2016, respectively | 0.7 | 0.7 | ||||||
Additional paid-in capital | 655.9 | 650.5 | ||||||
Accumulated other comprehensive loss | (1.3 | ) | (20.8 | ) | ||||
Treasury stock, 5,195,791 shares, at cost, as of both June 30, 2017 and December 31, 2016 | (160.8 | ) | (160.8 | ) | ||||
Retained earnings | 476.6 | 522.3 | ||||||
Non-controlling interest in subsidiaries | 180.3 | 190.6 | ||||||
Total stockholders’ equity | 1,151.4 | 1,182.5 | ||||||
Total liabilities and stockholders’ equity | $ | 2,876.5 | $ | 2,979.8 | ||||
See accompanying notes to condensed consolidated financial statements
3
Delek US Holdings, Inc.
Condensed Consolidated Statements of Income (Unaudited)
(In millions, except share and per share data)
Three Months Ended | Six Months Ended | |||||||||||||||
June 30, | June 30, | |||||||||||||||
2017 | 2016 | 2017 | 2016 | |||||||||||||
Net sales | $ | 1,230.7 | $ | 1,147.3 | $ | 2,412.8 | $ | 2,033.4 | ||||||||
Operating costs and expenses: | ||||||||||||||||
Cost of goods sold | 1,157.8 | 1,025.3 | 2,193.5 | 1,841.1 | ||||||||||||
Operating expenses | 62.1 | 57.8 | 123.3 | 126.8 | ||||||||||||
Insurance proceeds — business interruption | — | — | — | (42.4 | ) | |||||||||||
General and administrative expenses | 27.5 | 23.6 | 54.0 | 52.6 | ||||||||||||
Depreciation and amortization | 29.5 | 29.3 | 58.5 | 57.6 | ||||||||||||
Other operating expense, net | 0.3 | — | 0.3 | — | ||||||||||||
Total operating costs and expenses | 1,277.2 | 1,136.0 | 2,429.6 | 2,035.7 | ||||||||||||
Operating (loss) income | (46.5 | ) | 11.3 | (16.8 | ) | (2.3 | ) | |||||||||
Interest expense | 14.9 | 13.6 | 28.4 | 26.8 | ||||||||||||
Interest income | (0.8 | ) | (0.4 | ) | (1.8 | ) | (0.7 | ) | ||||||||
(Income) loss from equity method investments | (1.5 | ) | 10.6 | (4.6 | ) | 28.6 | ||||||||||
Other expense (income), net | 0.1 | (0.1 | ) | 0.1 | 0.5 | |||||||||||
Total non-operating expenses, net | 12.7 | 23.7 | 22.1 | 55.2 | ||||||||||||
Loss from continuing operations before income tax benefit | (59.2 | ) | (12.4 | ) | (38.9 | ) | (57.5 | ) | ||||||||
Income tax benefit | (27.0 | ) | (9.9 | ) | (22.0 | ) | (33.5 | ) | ||||||||
Loss from continuing operations | (32.2 | ) | (2.5 | ) | (16.9 | ) | (24.0 | ) | ||||||||
Discontinued operations: | ||||||||||||||||
Income (loss) from discontinued operations | — | 2.8 | — | (1.1 | ) | |||||||||||
Income tax expense (benefit) | — | 0.9 | — | (0.6 | ) | |||||||||||
Income (loss) from discontinued operations, net of tax | — | 1.9 | — | (0.5 | ) | |||||||||||
Net loss | (32.2 | ) | (0.6 | ) | (16.9 | ) | (24.5 | ) | ||||||||
Net income attributed to non-controlling interest | 5.7 | 6.4 | 9.8 | 11.7 | ||||||||||||
Net loss attributable to Delek | $ | (37.9 | ) | $ | (7.0 | ) | $ | (26.7 | ) | $ | (36.2 | ) | ||||
Basic loss per share: | ||||||||||||||||
Loss from continuing operations | $ | (0.61 | ) | $ | (0.14 | ) | $ | (0.43 | ) | $ | (0.58 | ) | ||||
Income (loss) from discontinued operations | — | 0.03 | — | (0.01 | ) | |||||||||||
Total basic loss per share | $ | (0.61 | ) | $ | (0.11 | ) | $ | (0.43 | ) | $ | (0.59 | ) | ||||
Diluted loss per share: | ||||||||||||||||
Loss from continuing operations | $ | (0.61 | ) | $ | (0.14 | ) | $ | (0.43 | ) | $ | (0.58 | ) | ||||
Income (loss) from discontinued operations | — | 0.03 | — | (0.01 | ) | |||||||||||
Total diluted loss per share | $ | (0.61 | ) | $ | (0.11 | ) | $ | (0.43 | ) | $ | (0.59 | ) | ||||
Weighted average common shares outstanding: | ||||||||||||||||
Basic | 62,054,485 | 61,827,201 | 62,016,489 | 61,979,604 | ||||||||||||
Diluted | 62,054,485 | 61,827,201 | 62,016,489 | 61,979,604 | ||||||||||||
Dividends declared per common share outstanding | $ | 0.15 | $ | 0.15 | $ | 0.30 | $ | 0.30 | ||||||||
See accompanying notes to condensed consolidated financial statements
4
Delek US Holdings, Inc.
Condensed Consolidated Statements of Comprehensive Income (Unaudited)
(In millions)
Three Months Ended June 30, | Six Months Ended June 30, | |||||||||||||||
2017 | 2016 | 2017 | 2016 | |||||||||||||
Net loss attributable to Delek | $ | (37.9 | ) | $ | (7.0 | ) | $ | (26.7 | ) | $ | (36.2 | ) | ||||
Other comprehensive (loss) income: | ||||||||||||||||
Commodity contracts designated as cash flow hedges: | ||||||||||||||||
Unrealized (losses) gains, net of ineffectiveness gains of $0.1 million and $0.4 million for the three and six months ended June 30, 2017, respectively, and $1.5 million and $0.5 million for the three and six months ended June 30, 2016, respectively | (3.7 | ) | 14.8 | (9.8 | ) | 7.9 | ||||||||||
Realized losses reclassified to cost of goods sold | 31.7 | 7.1 | 39.5 | 14.4 | ||||||||||||
Increase related to cash flow hedges, net | 28.0 | 21.9 | 29.7 | 22.3 | ||||||||||||
Income tax expense | (9.8 | ) | (7.7 | ) | (10.4 | ) | (7.8 | ) | ||||||||
Net comprehensive income on commodity contracts designated as cash flow hedges | 18.2 | 14.2 | 19.3 | 14.5 | ||||||||||||
Foreign currency translation gain | 0.1 | 0.1 | 0.1 | 0.2 | ||||||||||||
Other comprehensive income (loss) from equity method investments, net of tax expense of a nominal amount for the six months ended June 30, 2017, and net of tax benefit of $0.1 million for the six months ended June 30, 2016 | — | — | 0.1 | (0.2 | ) | |||||||||||
Total other comprehensive income | 18.3 | 14.3 | 19.5 | 14.5 | ||||||||||||
Comprehensive (loss) income attributable to Delek | $ | (19.6 | ) | $ | 7.3 | $ | (7.2 | ) | $ | (21.7 | ) | |||||
See accompanying notes to condensed consolidated financial statements
5
Delek US Holdings, Inc.
Condensed Consolidated Statements of Cash Flows (Unaudited)
(In millions)
Six Months Ended June 30, | ||||||||
2017 | 2016 | |||||||
Cash flows from operating activities: | ||||||||
Net loss | $ | (16.9 | ) | $ | (24.5 | ) | ||
Adjustments to reconcile net loss to net cash (used in) provided by operating activities: | ||||||||
Depreciation and amortization | 58.5 | 57.6 | ||||||
Amortization of deferred financing costs and debt discount | 2.0 | 2.2 | ||||||
Accretion of asset retirement obligations | 0.2 | 0.2 | ||||||
Amortization of unfavorable contract liability | (2.9 | ) | — | |||||
Deferred income taxes | (12.4 | ) | (19.3 | ) | ||||
(Income) loss from equity method investments | (4.6 | ) | 28.6 | |||||
Dividends from equity method investments | 10.8 | 10.1 | ||||||
Loss on disposal of assets | 0.3 | — | ||||||
Equity-based compensation expense | 7.9 | 8.2 | ||||||
Income tax benefit of equity-based compensation | — | 0.3 | ||||||
Loss from discontinued operations | — | 0.5 | ||||||
Changes in assets and liabilities, net of acquisitions: | ||||||||
Accounts receivable | (22.0 | ) | (13.1 | ) | ||||
Inventories and other current assets | (4.9 | ) | (47.6 | ) | ||||
Fair value of derivatives | 10.5 | 27.9 | ||||||
Accounts payable and other current liabilities | (72.4 | ) | 98.1 | |||||
Obligation under Supply and Offtake Agreement | 20.8 | 18.0 | ||||||
Non-current assets and liabilities, net | (11.2 | ) | (3.9 | ) | ||||
Cash (used in) provided by operating activities - continuing operations | (36.3 | ) | 143.3 | |||||
Cash provided by operating activities - discontinued operations | — | 13.3 | ||||||
Net cash (used in) provided by operating activities | (36.3 | ) | 156.6 | |||||
Cash flows from investing activities: | ||||||||
Business combinations | (4.8 | ) | — | |||||
Equity method investment contributions | (2.9 | ) | (33.1 | ) | ||||
Purchases of property, plant and equipment | (35.0 | ) | (18.7 | ) | ||||
Purchase of intangible assets | — | (0.7 | ) | |||||
Proceeds from sales of assets | — | 0.2 | ||||||
Cash used in investing activities - continuing operations | (42.7 | ) | (52.3 | ) | ||||
Cash used in investing activities - discontinued operations | — | (7.1 | ) | |||||
Net cash used in investing activities | (42.7 | ) | (59.4 | ) | ||||
Cash flows from financing activities: | ||||||||
Proceeds from long-term revolvers | 434.5 | 160.8 | ||||||
Payments on long-term revolvers | (627.6 | ) | (149.9 | ) | ||||
Proceeds from term debt | 248.1 | — | ||||||
Payments on term debt | (60.4 | ) | (35.3 | ) | ||||
Proceeds from product financing agreements | 21.0 | 50.4 | ||||||
Repayments of product financing agreements | (6.0 | ) | — | |||||
Taxes paid due to the net settlement of equity-based compensation | (2.2 | ) | (0.5 | ) | ||||
Income tax benefit of equity-based compensation | — | (0.3 | ) | |||||
Repurchase of common stock | — | (6.0 | ) | |||||
Repurchase of non-controlling interest | (7.3 | ) | — | |||||
Distribution to non-controlling interest | (13.2 | ) | (11.6 | ) | ||||
Dividends paid | (19.0 | ) | (18.9 | ) | ||||
Deferred financing costs paid | (5.8 | ) | (0.4 | ) | ||||
Cash used in financing activities - continuing operations | (37.9 | ) | (11.7 | ) | ||||
Cash used in financing activities - discontinued operations | — | (10.6 | ) | |||||
Net cash used in financing activities | (37.9 | ) | (22.3 | ) | ||||
Net (decrease) increase in cash and cash equivalents | (116.9 | ) | 74.9 | |||||
Cash and cash equivalents at the beginning of the period | 689.2 | 302.2 | ||||||
Cash and cash equivalents at the end of the period | 572.3 | 377.1 | ||||||
Less cash and cash equivalents of discontinued operations at the end of the period | — | 13.1 | ||||||
Cash and cash equivalents of continuing operations at the end of the period | $ | 572.3 | $ | 364.0 | ||||
Delek US Holdings, Inc.
Condensed Consolidated Statements of Cash Flows (Unaudited)(Continued)
(In millions)
Six Months Ended June 30, | ||||||||
2017 | 2016 | |||||||
Supplemental disclosures of cash flow information: | ||||||||
Cash paid during the period for: | ||||||||
Interest, net of capitalized interest of $0.1 for both the 2017 and 2016 periods | $ | 28.3 | $ | 29.0 | ||||
Income taxes | $ | 59.3 | $ | 1.6 | ||||
Non-cash investing activities: | ||||||||
Decrease in accrued capital expenditures | $ | (4.8 | ) | $ | (8.7 | ) | ||
See accompanying notes to condensed consolidated financial statements
6
Delek US Holdings, Inc.
Notes to Condensed Consolidated Financial Statements (Unaudited)
1. Organization and Basis of Presentation
As of June 30, 2017, Delek US Holdings, Inc. is the sole shareholder or owner of membership interests of Delek Refining, Inc. ("Refining"), Delek Finance, Inc., Delek Marketing & Supply, LLC, Lion Oil Company ("Lion Oil"), Delek Renewables, LLC, Delek Rail Logistics, Inc., Delek Logistics Services Company, Delek Helena, LLC, and Delek Land Holdings, LLC. In January 2017, we announced that Delek US Holdings, Inc. (and various related entities) had entered into an Agreement and Plan of Merger with Alon USA Energy, Inc. (NYSE: ALJ) ("Alon USA"), as subsequently amended on February 27 and April 21, 2017 (as so amended, the "Merger Agreement"). The related Delek/Alon Merger (as defined in Note 17) was effective July 1, 2017 (the “Effective Time”), resulting in a new post-combination consolidated registrant renamed as Delek US Holdings, Inc. (“New Delek”), with Alon USA and the previous Delek US Holdings, Inc. (“Old Delek”) surviving as wholly-owned subsidiaries. New Delek is the successor issuer to Old Delek and Alon pursuant to Rule 12g-3(c) under the Securities Exchange Act of 1934, as amended (the "Exchange Act"). In addition, as a result of the Delek/Alon Merger, the shares of common stock of Old Delek and Alon were delisted from the New York Stock Exchange in July 2017, and their respective reporting obligations under the Exchange Act were terminated. For further discussion, see Note 17.
Unless otherwise noted or the context requires otherwise, the disclosures and financial information included in this report for the periods ended June 30, 2017 and 2016, and as of June 30, 2017 and December 31, 2016, reflect that of Old Delek, and the terms "we," "our," "us," "Delek" and the "Company" are used in this report to refer to Old Delek and its consolidated subsidiaries as of June 30, 2017. New Delek's Common Stock is listed on the New York Stock Exchange under the symbol "DK."
In August 2016, we entered into a definitive equity purchase agreement (the "Purchase Agreement") with Compañía de Petróleos de Chile COPEC S.A. and its subsidiary, Copec Inc., a Delaware corporation (collectively, "COPEC"). Under the terms of the Purchase Agreement, Delek agreed to sell, and COPEC agreed to purchase, 100% of the equity interests in Delek's wholly-owned subsidiaries MAPCO Express, Inc., MAPCO Fleet, Inc., Delek Transportation, LLC, NTI Investments, LLC and GDK Bearpaw, LLC (collectively, the “Retail Entities”) for cash consideration of $535 million, subject to customary adjustments (the “Retail Transaction”). The Retail Transaction closed in November 2016.
As a result of the Purchase Agreement, we met the requirements under the provisions of Accounting Standards Codification ("ASC") 205-20, Presentation of Financial Statements - Discontinued Operations ("ASC 205-20") and ASC 360, Property, Plant and Equipment ("ASC 360"), to report the results of the Retail Entities as discontinued operations and to classify the Retail Entities as a group of assets held for sale. See Note 4 for further information regarding the Retail Entities.
Having classified the Retail Entities as assets held for sale, the condensed consolidated statements of income for the three and six months ended June 30, 2016 have been reclassified to reflect the results of the Retail Entities as income from discontinued operations, net of taxes.
Our condensed consolidated financial statements include the accounts of Delek and its consolidated subsidiaries. Certain information and footnote disclosures normally included in annual financial statements prepared in accordance with U.S. Generally Accepted Accounting Principles ("GAAP") have been condensed or omitted, although management believes that the disclosures herein are adequate to make the financial information presented not misleading. Our unaudited condensed consolidated financial statements have been prepared in conformity with GAAP applied on a consistent basis with those of the annual audited financial statements included in our Annual Report on Form 10-K filed with the Securities and Exchange Commission ("SEC") on February 28, 2017 (the "Annual Report on Form 10-K") and in accordance with the rules and regulations of the SEC. These unaudited condensed consolidated financial statements should be read in conjunction with the audited consolidated financial statements and the notes thereto for the year ended December 31, 2016 included in our Annual Report on Form 10-K.
Our condensed consolidated financial statements include Delek Logistics Partners, LP ("Delek Logistics"), a variable interest entity. As the general partner of Delek Logistics, we have the sole ability to direct the activities of Delek Logistics that most significantly impact its economic performance. We are also considered to be the primary beneficiary for accounting purposes and are Delek Logistics' primary customer. As Delek Logistics does not derive an amount of gross margin material to us from third parties, there is limited risk to Delek associated with Delek Logistics' operations. However, in the event that Delek Logistics incurs a loss, our operating results will reflect Delek Logistics' loss, net of intercompany eliminations, to the extent of our ownership interest in Delek Logistics.
In the opinion of management, all adjustments necessary for a fair presentation of the financial condition and the results of operations for the interim periods have been included. All significant intercompany transactions and account balances have been eliminated in consolidation. All adjustments are of a normal, recurring nature. Operating results for the interim period should not be viewed as representative of results that may be expected for any future interim period or for the full year.
Certain prior period amounts have been reclassified in order to conform to the current year presentation.
7
The preparation of financial statements in conformity with GAAP requires management to make estimates and assumptions that affect the reported amounts of assets and liabilities and disclosure of contingent assets and liabilities at the date of the financial statements and the reported amounts of revenues and expenses during the reporting period. Actual results could differ from those estimates.
New Accounting Pronouncements
In May 2017, the Financial Accounting Standards Board (the "FASB") issued guidance that clarifies when changes to the terms or conditions of a share-based payment award must be accounted for as modifications. The modification accounting guidance applies if the value, vesting conditions or classification of the award changes. This guidance is effective for fiscal years beginning after December 15, 2017, and interim periods within those fiscal years, and can be early adopted for any interim or annual financial statements that have not yet been issued. We expect to adopt this guidance on or before the effective date and are currently evaluating the impact that adopting this new guidance will have on our business, financial condition and results of operations.
In January 2017, the FASB issued guidance concerning the goodwill impairment test that eliminates Step 2, which required a comparison of the implied fair value of goodwill of the reporting unit with the carrying amount of that goodwill for that reporting unit. It also eliminates the requirements for any reporting unit with a zero or negative carrying amount to perform a qualitative assessment and, if it fails that qualitative assessment, to perform Step 2 of the goodwill impairment test. An entity still has the option to perform the qualitative assessment for a reporting unit to determine if the quantitative impairment test is necessary. This guidance is effective for annual or any interim goodwill impairment tests in fiscal years beginning after December 15, 2019. Early adoption is permitted for interim or annual goodwill impairment tests performed on testing dates after January 1, 2017. We expect to adopt this guidance on or before the effective date and we do not anticipate that the adoption will have a material impact on our business, financial condition or results of operations.
In January 2017, the FASB issued guidance clarifying the definition of a business in order to assist entities with evaluating when a set of transferred assets and activities is considered a business. In general, we expect that the revised definition will result in fewer acquisitions being accounted for as business combinations than under the current guidance. This guidance is effective for fiscal years beginning after December 15, 2017, and interim periods within those fiscal years. Early adoption is permitted under certain circumstances. We expect to adopt this guidance on or before the effective date and are currently evaluating the impact that adopting this new guidance will have on our business, financial condition and results of operations.
In March 2016, the FASB issued guidance that simplifies several aspects of the accounting for share-based payment award transactions, including the accounting for excess tax benefits and deficiencies, classification of awards as either equity or liabilities and classification of excess tax benefits on the statement of cash flows. This guidance is effective for fiscal years beginning after December 15, 2016, and interim periods within those fiscal years and can be early adopted for any interim or annual financial statements that have not yet been issued. We prospectively adopted this guidance on the effective date and the adoption did not have a material impact on our business, financial condition or results of operations.
In January 2016, the FASB issued guidance that affects the accounting for equity investments, financial liabilities accounted for under the fair value option and the presentation and disclosure requirements for financial instruments. Under the new guidance, all equity investments in unconsolidated entities (other than those accounted for using the equity method of accounting) will generally be measured at fair value through earnings. There will no longer be an available-for-sale classification for equity securities with readily determinable fair values. For financial liabilities when the fair value option has been elected, changes in fair value due to instrument-specific credit risk will be recognized separately in other comprehensive income. It will require public business entities to use the exit price notion when measuring the fair value of financial instruments for disclosure purposes and separate presentation of financial assets and financial liabilities by measurement category and form of financial asset, and will eliminate the requirement for public business entities to disclose the method and significant assumptions used to estimate the fair value that is required to be disclosed for financial instruments measured at amortized cost.The new guidance is effective for annual reporting periods beginning after December 15, 2017, including interim reporting periods within that reporting period. We expect to adopt this guidance on or before the effective date and currently do not expect this new guidance to have a material impact on our business, financial condition or results of operations.
In July 2015, the FASB issued guidance requiring entities to measure FIFO or average cost inventory at the lower of cost and net realizable value. Net realizable value is the estimated selling prices in the ordinary course of business, less reasonably predictable costs of completion, disposal, and transportation. This guidance does not change the measurement of inventory measured using LIFO or the retail inventory method. This guidance is effective for fiscal years beginning after December 15, 2016, and interim periods within those fiscal years. We adopted this guidance on the effective date and the adoption did not have a material impact on our business, financial condition or results of operations.
In May 2014, the FASB issued guidance regarding “Revenue from Contracts with Customers,” to clarify the principles for recognizing revenue. The core principle of the new guidance is that an entity should recognize revenue to depict the transfer of promised goods or services to customers in an amount that reflects the consideration to which the entity expects to be entitled in exchange for those goods or services. The guidance also requires improved interim and annual disclosures that enable the users of financial statements to better understand the nature,
8
amount, timing, and uncertainty of revenues and cash flows arising from contracts with customers. The new guidance is effective for annual reporting periods beginning after December 15, 2017, including interim reporting periods within that reporting period, and can be adopted retrospectively. Early adoption is permitted only as of annual reporting periods beginning after December 15, 2016, including interim reporting periods within that reporting period. We expect to adopt this guidance on January 1, 2018.
As part of our efforts to prepare for adoption, beginning in 2016 we formed a project implementation team as well as a project timeline to evaluate this new standard for the subsidiaries of Delek prior to the acquisition of Alon USA. We also reviewed and gained an understanding of the new revenue recognition accounting guidance, performed scoping to identify and evaluate revenue streams under the new standard, and continue to review industry specific implementation guidance. In connection with the Delek/Alon Merger which was effective July 1, 2017, we will be performing a similar analysis of the revenue streams/contracts of Alon USA and its subsidiaries in connection with our integration efforts.
We are continuing to evaluate the impact of the standard on our business processes, accounting systems, controls and financial statement disclosures, including the integration of Alon USA, and expect to implement any changes to accommodate the new accounting and disclosure requirements prior to adoption on January 1, 2018. We preliminarily expect to use the modified retrospective adoption method to apply this standard, under which the cumulative effect of initially applying the new guidance will be recognized as an adjustment to the opening balance of retained earnings in the first quarter of 2018.
2. Delek Logistics
Delek Logistics is a publicly traded limited partnership that was formed by Delek to own, operate, acquire and construct crude oil and refined products logistics and marketing assets. A substantial majority of Delek Logistics' assets are integral to Delek’s refining and marketing operations. As of June 30, 2017, we owned a 61.5% limited partner interest in Delek Logistics, consisting of 15,294,046 common units, and a 94.6% interest in Logistics GP, which owns the entire 2.0% general partner interest, consisting of 497,172 general partner units, in Delek Logistics and all of the incentive distribution rights.
We have agreements with Delek Logistics that, among other things, establish fees for certain administrative and operational services provided by us and our subsidiaries to Delek Logistics, provide certain indemnification obligations and establish terms for fee-based commercial logistics and marketing services provided by Delek Logistics and its subsidiaries to us.
Delek Logistics is a variable interest entity as defined under GAAP and is consolidated into our condensed consolidated financial statements. With the exception of intercompany balances which are eliminated in consolidation, the Delek Logistics condensed consolidated balance sheets as of June 30, 2017 and December 31, 2016, as presented below, are included in the consolidated balance sheets of Delek (unaudited, in millions).
June 30, 2017 | December 31, 2016 | |||||||
ASSETS | ||||||||
Cash and cash equivalents | $ | 4.9 | $ | 0.1 | ||||
Accounts receivable | 18.3 | 19.2 | ||||||
Accounts receivable from related parties | 4.2 | 2.8 | ||||||
Inventory | 6.5 | 8.9 | ||||||
Other current assets | 1.4 | 1.1 | ||||||
Property, plant and equipment, net | 245.6 | 251.0 | ||||||
Equity method investments | 104.6 | 101.1 | ||||||
Goodwill | 12.2 | 12.2 | ||||||
Intangible assets, net | 13.9 | 14.4 | ||||||
Other non-current assets | 3.9 | 4.7 | ||||||
Total assets | $ | 415.5 | $ | 415.5 | ||||
LIABILITIES AND DEFICIT | ||||||||
Accounts payable | $ | 10.2 | $ | 10.9 | ||||
Accrued expenses and other current liabilities | 11.1 | 9.8 | ||||||
Revolving credit facility | 396.9 | 392.6 | ||||||
Asset retirement obligations | 3.9 | 3.8 | ||||||
Other non-current liabilities | 14.5 | 11.7 | ||||||
Deficit | (21.1 | ) | (13.3 | ) | ||||
Total liabilities and deficit | $ | 415.5 | $ | 415.5 | ||||
9
3. Equity Method Investments
On May 14, 2015, Delek acquired from Alon Israel Oil Company, Ltd. ("Alon Israel") approximately 33.7 million shares of common stock (the "ALJ Shares") of Alon USA pursuant to the terms of a stock purchase agreement with Alon Israel dated April 14, 2015 (the "Alon Acquisition"). The ALJ Shares represented an equity interest in Alon USA of approximately 48% at the time of acquisition. We acquired the ALJ Shares with a combination of cash, Delek stock and seller-financed debt.
As of June 30, 2017, our investment balance in Alon USA was $252.6 million representing a 47% ownership interest, and the excess of our initial investment over our net equity in the underlying net assets of Alon USA was approximately $11.1 million. This excess is included in equity method investments in our consolidated balance sheet and a portion has been attributed to property, plant and equipment and finite-lived intangible assets. These portions of the excess are being amortized as a reduction to earnings from equity method investments on a straight-line basis over the lives of the related assets. The earnings or losses from this equity method investment reflected in our consolidated statements of income include our share of net earnings or losses directly attributable to this equity method investment, and amortization of the excess of our investment balance over the underlying net assets of Alon USA. As of June 30, 2017, the market value of our ALJ Shares was $448.8 million, based on quoted market prices. There were no indicators of impairment of our investment in Alon USA as of June 30, 2017.
Below is summarized financial information of the financial condition and results of operations of Alon USA (in millions):
Balance Sheet Information | June 30, 2017 | December 31, 2016 | ||||||
Current assets | $ | 535.1 | $ | 471.3 | ||||
Non-current assets | 1,589.8 | 1,624.0 | ||||||
Current liabilities | 483.0 | 445.5 | ||||||
Non-current liabilities | 1,069.9 | 1,067.4 | ||||||
Non-controlling interests | 61.2 | 61.3 | ||||||
Three Months Ended | Six Months Ended | |||||||||||||||
Income Statement Information | June 30, 2017 | June 30, 2016 | June 30, 2017 | June 30, 2016 | ||||||||||||
Revenue | $ | 1,119.1 | $ | 1,008.4 | $ | 2,269.7 | $ | 1,858.4 | ||||||||
Gross profit | 173.5 | 137.0 | 351.2 | 251.8 | ||||||||||||
Pre-tax income (loss) | 7.1 | (29.2 | ) | 20.0 | (86.5 | ) | ||||||||||
Net income (loss) | 4.8 | (20.6 | ) | 15.0 | (56.7 | ) | ||||||||||
Net income (loss) attributable to Alon USA | 2.2 | (20.4 | ) | 9.5 | (55.9 | ) | ||||||||||
Effective July 1, 2017, Alon USA became a wholly owned subsidiary of New Delek in connection with the Delek/Alon Merger. See Note 17 for further discussion.
In March 2015, Delek Logistics entered into two joint ventures that have constructed logistics assets, which will serve third parties and subsidiaries of Delek. Delek Logistics' investment in these joint ventures is being financed through a combination of cash from operations and borrowings under the DKL Revolver (as defined in Note 7). As of June 30, 2017, Delek Logistics' investment balance in these joint ventures was $104.7 million and was accounted for using the equity method. One of the joint venture projects was completed and began operations in September 2016. The other was completed and began operations in January 2017.
4. Discontinued Operations and Assets Held for Sale
In August 2016, Delek entered into a Purchase Agreement to sell the Retail Entities to COPEC. As a result of the Purchase Agreement, we met the requirements of ASC 205-20 and ASC 360 to report the results of the Retail Entities as discontinued operations and to classify the Retail Entities as a group of assets held for sale. The fair value assessment of the Retail Entities as of August 27, 2016 did not result in an impairment. We ceased depreciation of these assets as of August 27, 2016. The Retail Transaction closed in November 2016 and we received cash consideration of $378.9 million, net of debt repayments and transaction costs, and retained approximately $62.8 million of net liabilities from the Retail Entities. The Retail Transaction resulted in a gain on sale of the Retail Entities, before income tax, of $134.1 million.
Under the terms of the Purchase Agreement, Lion Oil and MAPCO Express entered into a supply agreement at the closing of the Retail Transaction pursuant to which Lion Oil will supply fuel to retail locations owned by MAPCO Express for a period of 18 months following the closing of the Retail Transaction (the "Fuel Supply Agreement"). We recorded net revenues of $104.5 million and $208.7 million and net cash
10
inflows of $137.1 million and $236.1 million for the three and six months ended June 30, 2017, respectively, associated with the Fuel Supply Agreement.
Once the Retail Entities were identified as assets held for sale, the operations associated with these properties qualified for reporting as discontinued operations. Accordingly, the operating results, net of tax, from discontinued operations are presented separately in Delek’s condensed consolidated statements of income and the notes to the condensed consolidated financial statements have been adjusted to exclude the discontinued operations. Components of amounts reflected in income from discontinued operations are as follows (in millions):
Three Months Ended | Six Months Ended | |||||||
June 30, 2016 | June 30, 2016 | |||||||
Revenue | 279.1 | 498.9 | ||||||
Cost of goods sold | (228.6 | ) | (403.9 | ) | ||||
Operating expenses | (32.5 | ) | (65.4 | ) | ||||
General and administrative expenses | (5.7 | ) | (11.3 | ) | ||||
Depreciation and amortization | (8.0 | ) | (15.8 | ) | ||||
Other operating income, net | 0.3 | — | ||||||
Interest expense | (1.8 | ) | (3.6 | ) | ||||
Income (loss) from discontinued operations before taxes | 2.8 | (1.1 | ) | |||||
Income tax expense (benefit) | 0.9 | (0.6 | ) | |||||
Income (loss) from discontinued operations, net of tax | $ | 1.9 | $ | (0.5 | ) | |||
5. Inventory
Refinery inventory consists of crude oil, work-in-process, refined products and blendstocks. Cost of inventory for the Tyler refinery is determined under the last-in, first- out ("LIFO") valuation method and costs in excess of market value are charged to cost of goods sold. Cost of inventory for the El Dorado refinery is determined on a first-in, first-out ("FIFO") basis and costs in excess of net realizable value are charged to cost of goods sold.
Logistics inventory consists of refined products which are stated at the lower of FIFO cost or net realizable value.
Carrying value of inventories consisted of the following (in millions):
June 30, 2017 | December 31, 2016 | |||||||
Refinery raw materials and supplies | $ | 165.4 | $ | 145.6 | ||||
Refinery work in process | 35.9 | 37.6 | ||||||
Refinery finished goods | 169.6 | 200.3 | ||||||
Logistics refined products | 6.5 | 8.9 | ||||||
Total inventories | $ | 377.4 | $ | 392.4 | ||||
Due to a lower crude oil and refined product pricing environment experienced since the end of 2014, market prices have declined to a level below the average cost of our inventories. At June 30, 2017, we recorded a pre-tax inventory valuation reserve of $29.4 million, $29.0 million of which related to LIFO inventory, which is subject to reversal in subsequent periods, not to exceed LIFO cost, should market prices recover. At December 31, 2016, we recorded a pre-tax inventory valuation reserve of $16.0 million, all of which related to LIFO inventory, which reversed in the first quarter of 2017, as the inventories associated with the valuation adjustment at the end of 2016 were sold or used. We recognized net inventory valuation (losses) gains of $(10.8) million and $(13.5) million for the three and six months ended June 30, 2017, respectively, and $13.0 million and $16.9 million for the three and six months ended June 30, 2016, respectively. These (losses) gains were recorded as a component of cost of goods sold in the consolidated statements of income.
At June 30, 2017 and December 31, 2016, the excess of replacement cost (FIFO) over the carrying value (LIFO) of the Tyler refinery inventories was $0.6 million and $3.5 million, respectively.
11
Permanent Liquidations
We incurred a permanent reduction in a LIFO layer resulting in liquidation gain (loss) in our refinery inventory of $(0.2) million during the three and six months ended June 30, 2017, and $0.9 million and $(2.4) million during the three and six months ended June 30, 2016 , respectively. These liquidation gains (losses) were recognized as a component of cost of goods sold.
6. Crude Oil Supply and Inventory Purchase Agreement
Delek has a Master Supply and Offtake Agreement (the "Supply and Offtake Agreement") with J. Aron & Company ("J. Aron"). Throughout the term of the Supply and Offtake Agreement, which was amended on February 27, 2017 to change, among other things, certain terms related to pricing and an extension of the maturity date to April 30, 2020, Lion Oil and J. Aron will identify mutually acceptable contracts for the purchase of crude oil from third parties and J. Aron will supply up to 100,000 barrels per day ("bpd") of crude oil to the El Dorado refinery. Crude oil supplied to the El Dorado refinery by J. Aron will be purchased daily at an estimated average monthly market price by Lion Oil. J. Aron will also purchase all refined products from the El Dorado refinery at an estimated daily market price, as they are produced. These daily purchases and sales are trued-up on a monthly basis in order to reflect actual average monthly prices. We have recorded a (payable) receivable related to this monthly settlement of $(8.5) million and $6.9 million as of June 30, 2017 and December 31, 2016, respectively. Also pursuant to the Supply and Offtake Agreement and other related agreements, Lion Oil will endeavor to arrange potential sales by either Lion Oil or J. Aron to third parties of the products produced at the El Dorado refinery or purchased from third parties. In instances where Lion Oil is the seller to such third parties, J. Aron will first transfer title to the applicable products to Lion Oil.
This arrangement is accounted for as a product financing arrangement. Delek incurred fees payable to J. Aron of $2.5 million and $4.9 million during the three and six months ended June 30, 2017, respectively, and $2.6 million and $5.0 million during the three and six months ended June 30, 2016, respectively. These amounts are included as a component of interest expense in the condensed consolidated statements of income. Upon any termination of the Supply and Offtake Agreement, including in connection with a force majeure event, the parties are required to negotiate with third parties for the assignment to us of certain contracts, commitments and arrangements, including procurement contracts, commitments for the sale of product, and pipeline, terminalling, storage and shipping arrangements.
Upon the expiration of the Supply and Offtake Agreement on April 30, 2020, or upon any earlier termination, Delek will be required to repurchase the consigned crude oil and refined products from J. Aron at then prevailing market prices. At June 30, 2017, Delek had 3.0 million barrels of inventory consigned from J. Aron, and we have recorded liabilities associated with this consigned inventory of $145.4 million in the condensed consolidated balance sheet.
7. Long-Term Obligations and Notes Payable
Outstanding borrowings under Delek’s existing debt instruments are as follows (in millions):
June 30, 2017 | December 31, 2016 | |||||||
DKL Revolver | $ | 154.5 | $ | 392.6 | ||||
DKL Notes (1) | 242.4 | — | ||||||
Wells Term Loan(2) | 52.1 | 63.6 | ||||||
Wells Revolving Loan | 45.0 | — | ||||||
Reliant Bank Revolver | 17.0 | 17.0 | ||||||
Promissory Notes | 95.0 | 130.0 | ||||||
Lion Term Loan Facility(3) | 216.5 | 229.7 | ||||||
822.5 | 832.9 | |||||||
Less: Current portion of long-term debt and notes payable | 91.4 | 84.4 | ||||||
$ | 731.1 | $ | 748.5 | |||||
(1) | The DKL Notes are net of deferred financing costs of $5.7 million and debt discount of $1.9 million at June 30, 2017. |
(2) | The Wells Term Loan is net of deferred financing costs of a nominal amount and $0.1 million, respectively, and debt discount of $0.4 million and $0.5 million, respectively, at June 30, 2017 and December 31, 2016. |
(3) | The Lion Term Loan Facility is net of deferred financing costs of $2.6 million and $3.0 million, respectively, and debt discounts of $0.9 million and $1.1 million, respectively, at June 30, 2017 and December 31, 2016. |
12
DKL Revolver
Delek Logistics has a $700.0 million senior secured revolving credit agreement with Fifth Third Bank, as administrative agent, and a syndicate of lenders (the "DKL Revolver"). Delek Logistics and all of its existing subsidiaries are borrowers under the DKL Revolver, except Delek Logistics Finance Corp., a Delaware corporation and a wholly owned subsidiary of Delek Logistics ("Finance Corp."), which is only a guarantor of the DKL Revolver. The DKL Revolver contains a dual currency borrowing tranche that permits draw downs in U.S. or Canadian dollars and an accordion feature whereby Delek Logistics can increase the size of the credit facility to an aggregate of $800.0 million, subject to receiving increased or new commitments from lenders and the satisfaction of certain other conditions precedent.
The obligations under the DKL Revolver are secured by a first priority lien on substantially all of Delek Logistics' tangible and intangible assets. Additionally, a subsidiary of Delek provides a limited guaranty of Delek Logistics' obligations under the DKL Revolver. The guaranty is (i) limited to an amount equal to the principal amount, plus unpaid and accrued interest, of a promissory note made by Delek in favor of the subsidiary guarantor (the "Holdings Note") and (ii) secured by the subsidiary guarantor's pledge of the Holdings Note to the DKL Revolver lenders. As of June 30, 2017, the principal amount of the Holdings Note was $102.0 million.
The DKL Revolver will mature on December 30, 2019. Borrowings under the DKL Revolver bear interest at either a U.S. base rate, Canadian prime rate, LIBOR, or a Canadian Dealer Offered Rate, in each case plus applicable margins, at the election of the borrowers and as a function of draw down currency. The applicable margin, in each case, varies based upon Delek Logistics' leverage ratio, which is defined as the ratio of total funded debt to EBITDA for the most recently ended four fiscal quarters. At June 30, 2017, the weighted average borrowing rate was approximately 4.1%. Additionally, the DKL Revolver requires Delek Logistics to pay a leverage ratio dependent quarterly fee on the average unused revolving commitment. As of June 30, 2017, this fee was 0.50% per year. As of June 30, 2017, Delek Logistics had $154.5 million of outstanding borrowings under the credit facility, as well as letters of credit issued of $7.0 million. Unused credit commitments under the DKL Revolver, as of June 30, 2017, were $538.5 million.
DKL Notes
On May 23, 2017, Delek Logistics and Finance Corp. (collectively, the “Issuers”), issued $250.0 million in aggregate principal amount of 6.750% senior notes due 2025 (the “DKL Notes”) at a discount. The DKL Notes are general unsecured senior obligations of the Issuers. The DKL Notes are unconditionally guaranteed jointly and severally on a senior unsecured basis by Delek Logistic's existing subsidiaries (other than Finance Corp., the "Guarantors") and will be unconditionally guaranteed on the same basis by certain of Delek Logistic’s future subsidiaries. The DKL Notes rank equal in right of payment with all existing and future senior indebtedness of the Issuers, and senior in right of payment to any future subordinated indebtedness of the Issuers. Interest on the DKL Notes is payable semi-annually in arrears on each May 15 and November 15, commencing November 15, 2017.
At any time prior to May 15, 2020, the Issuers may redeem up to 35% of the aggregate principal amount of the DKL Notes with the net cash proceeds of one or more equity offerings by Delek Logistics at a redemption price of 106.750% of the redeemed principal amount, plus accrued and unpaid interest, if any, subject to certain conditions and limitations. Prior to May 15, 2020, the Issuers may redeem all or part of the DKL Notes at a redemption price of the principal amount plus accrued and unpaid interest, if any, plus a "make whole" premium, subject to certain conditions and limitations. In addition, beginning on May 15, 2020, the Issuers may, subject to certain conditions and limitations, redeem all or part of the DKL Notes, at a redemption price of 105.063% for the twelve-month period beginning on May 15, 2020, 103.375% for the twelve-month period beginning on May 15, 2021, 101.688% for the twelve-month period beginning on May 15, 2022, and 100.00% beginning on May 15, 2023 and thereafter, plus accrued and unpaid interest, if any. There are also certain redemption provisions in the event of a change of control, accompanied or followed by a ratings downgrade within a certain period of time, subject to certain conditions and limitations.
In connection with the issuance of the 2025 Notes, the Issuers and the Guarantors entered into a registration rights agreement, whereby the Issuers and the Guarantors are required to exchange the 2025 Notes for new notes with terms substantially identical in all material respects with the 2025 Notes (except the new notes will not contain terms with respect to transfer restrictions). The Issuers and the Guarantors will use their commercially reasonable efforts to cause the exchange offer to be consummated not later than 365 days after May 23, 2017.
As of June 30, 2017, we had $250.0 million in outstanding principal amount under the 2025 Notes. Outstanding borrowings under the 2025 Notes are presented on the balance sheet net of deferred financing costs and debt discount of $5.7 million and $1.9 million, respectively, as of June 30, 2017.
Wells ABL
Our subsidiary, Delek Refining, Ltd., has an asset-based loan credit facility with Wells Fargo Bank, National Association, as administrative agent, and a syndicate of lenders, which was amended and restated on September 29, 2016 (the "Wells ABL") and was most recently amended on May 17, 2017 to incorporate technical modifications related to the Delek/Alon Merger. The Wells ABL consists of (i) a $450.0 million revolving loan (the "Wells Revolving Loan"), which includes a $45.0 million swing line loan sub-limit and a $200.0 million letter of credit sub-limit, (ii) a $70.0 million term loan (the "Wells Term Loan"), and (iii) an accordion feature that permits an increase in the size of the revolving credit facility
13
to an aggregate of $725.0 million, subject to additional lender commitments and the satisfaction of certain other conditions precedent. The Wells Revolving Loan matures on September 29, 2021 and the Wells Term Loan matures on September 29, 2019. The Wells Term Loan is subject to repayment in level principal installments of approximately $5.8 million per quarter, with the final installment due on September 29, 2019. As of June 30, 2017, under the Wells ABL, we had letters of credit issued totaling approximately $101.1 million, $45.0 million in borrowings outstanding under the Wells Revolving Loan and $52.5 million outstanding under the Wells Term Loan. The obligations under the Wells ABL are secured by (i) substantially all the assets of Refining and its subsidiaries, with certain limitations, (ii) guaranties provided by the general partner of Delek Refining, Ltd., as well as by the parent of Delek Refining, Ltd., Delek Refining, Inc. (iii) a limited guarantee provided jointly and severally by Old and New Delek in an amount up to $15.0 million in the aggregate and (iv) a limited guarantee provided by Lion Oil in an amount equal to the sum of the face amount of all letters of credit issued on behalf of Lion Oil under the Wells ABL and any loans made by Refining or its subsidiaries to Lion Oil. Under the facility, revolving loans and letters of credit are provided subject to availability requirements which are determined pursuant to a borrowing base calculation as defined in the credit agreement. The borrowing base as calculated is primarily supported by cash, certain accounts receivable and certain inventory. Borrowings under the Wells Revolving Loan and Wells Term Loan bear interest based on separate predetermined pricing grids that allow us to choose between base rate loans or LIBOR loans. At June 30, 2017, the weighted average borrowing rate was approximately 5.0% under the Wells Term Loan and 4.8% under the Wells Revolving Loan. Additionally, the Wells ABL requires us to pay a quarterly unused credit commitment fee. As of June 30, 2017, this fee was approximately 0.38% per year. Unused borrowing base availability, as calculated and reported under the terms of the Wells ABL credit facility, as of June 30, 2017, was approximately $145.5 million.
Reliant Bank Revolver
We have a revolving credit agreement with Reliant Bank, which was amended on May 26, 2016 (the "Reliant Bank Revolver") and was most recently amended on May 23, 2017 to incorporate technical modifications related to the Delek/Alon Merger. The Reliant Bank Revolver provides for unsecured loans of up to $17.0 million. As of June 30, 2017, we had $17.0 million outstanding under this facility. The Reliant Bank Revolver matures on June 28, 2018, and bears interest at a fixed rate of 5.25% per annum. The Reliant Bank Revolver requires us to pay a quarterly fee of 0.50% per year on the average available revolving commitment. As of June 30, 2017, we had no unused credit commitments under the Reliant Bank Revolver.
Promissory Notes
On April 29, 2011, Delek entered into a $50.0 million promissory note (the "Ergon Note") with Ergon, Inc. ("Ergon") in connection with the closing of our acquisition of Lion Oil. The Ergon Note required Delek to make annual amortization payments of $10.0 million each, commencing April 29, 2013. The Ergon Note matured on April 29, 2017 and was paid in full. Interest under the Ergon Note was computed at a fixed rate equal to 4.0% per annum.
On May 14, 2015, in connection with the closing of the Company’s acquisition of the ALJ Shares, the Company issued the Alon Israel Note in the amount of $145.0 million, which was payable to Alon Israel. The Alon Israel Note bears interest at a fixed rate of 5.5% per annum and requires five annual principal amortization payments of $25.0 million beginning in January 2016 followed by a final principal amortization payment of $20.0 million at maturity on January 4, 2021. In October 2015, we prepaid the first annual principal amortization payment in the amount of $25.0 million, along with all interest due on the prepaid amount. On December 22, 2015, Alon Israel assigned the remaining $120.0 million of principal and all accrued interest due under the Alon Israel Note to assignees under four new notes in substantially the same form and on the same terms as the Alon Israel Note (collectively, the "Alon Successor Notes"). The $120.0 million in total principal of the four Alon Successor Notes collectively require the same principal amortization payments and schedule as under the Alon Israel Note, with payments due under each Alon Successor Note commensurate to such note's pro rata share of $120.0 million in assigned principal. As of June 30, 2017, a total principal amount of $95.0 million was outstanding under the Alon Successor Notes.
Lion Term Loan
Our subsidiary, Lion Oil, has a term loan credit facility with Fifth Third Bank, as administrative agent, and a syndicate of lenders, which was amended and restated on May 14, 2015 in connection with the Company’s closing of the Alon Acquisition to, among other things, increase the total loan size from $99.0 million to $275.0 million (the "Lion Term Loan"), and was most recently amended on April 13, 2017 to incorporate technical modifications related to the Delek/Alon Merger . The Lion Term Loan requires Lion Oil to make quarterly principal amortization payments of approximately $6.9 million each, commencing on September 30, 2015, with a final balloon payment due at maturity on May 14, 2020. The Lion Term Loan is secured by, among other things, (i) substantially all the assets of Lion Oil and its subsidiaries (excluding inventory and accounts receivable), (ii) all shares in Lion Oil, (iii) any subordinated and common units of Delek Logistics held by Lion Oil, and (iv) the ALJ Shares. Additionally, the Lion Term Loan is guaranteed by Old and New Delek and the subsidiaries of Lion Oil. Interest on the unpaid balance of the Lion Term Loan is computed at a rate per annum equal to LIBOR or a base rate, at our election, plus the applicable margins, subject in each case to an all-in interest rate floor of 5.50% per annum. As of June 30, 2017, approximately $220.0 million was outstanding under the Lion Term Loan and the weighted average borrowing rate was 5.80%.
Restrictive Covenants
14
Under the terms of our Wells ABL, DKL Revolver, Reliant Bank Revolver and Lion Term Loan, we are required to comply with certain usual and customary financial and non-financial covenants. Further, although we were not required to comply with separate fixed charge coverage ratio financial covenants under the Wells ABL and the Lion Term Loan during the three and six months ended June 30, 2017, we may be required to comply with these covenants at times when certain trigger thresholds are met, as defined in each of the Wells ABL and Lion Term Loan agreements. We believe we were in compliance with all covenant requirements under each of our credit facilities as of June 30, 2017.
Certain of our debt facilities contain limitations on the incurrence of additional indebtedness, making of investments, creation of liens, dispositions of property, making of restricted payments and transactions with affiliates. Specifically, these covenants may limit the payment, in the form of cash or other assets, of dividends or other distributions, or the repurchase of shares with respect to the equity of our subsidiaries. Additionally, certain of our debt facilities limit our ability to make investments, including extensions of loans or advances to, or acquisitions of equity interests in, or guarantees of obligations of, any other entities.
8. Other Assets and Liabilities
The detail of other current assets is as follows (in millions):
Other Current Assets | June 30, 2017 | December 31, 2016 | |||||
Prepaid expenses | $ | 9.5 | $ | 14.0 | |||
Short-term derivative assets (see Note 15) | 11.1 | 6.8 | |||||
Income and other tax receivables | 39.8 | 19.2 | |||||
RINs Obligation surplus (see Note 14) | 8.7 | 4.9 | |||||
Other | 4.9 | 4.4 | |||||
Total | $ | 74.0 | $ | 49.3 | |||
The detail of other non-current assets is as follows (in millions):
Other Non-Current Assets | June 30, 2017 | December 31, 2016 | |||||
Prepaid tax asset | $ | 57.8 | $ | 59.5 | |||
Deferred financing costs | 6.9 | 8.2 | |||||
Long-term income tax receivables | 2.1 | 7.5 | |||||
Supply and Offtake receivable | 20.2 | — | |||||
Other | 2.7 | 5.5 | |||||
Total | $ | 89.7 | $ | 80.7 | |||
The detail of accrued expenses and other current liabilities is as follows (in millions):
Accrued Expenses and Other Current Liabilities | June 30, 2017 | December 31, 2016 | |||||
Income and other taxes payable | $ | 58.2 | $ | 115.7 | |||
Short-term derivative liabilities (see Note 15) | 1.2 | 26.1 | |||||
Interest payable | 7.7 | 9.6 | |||||
Employee costs | 7.0 | 7.3 | |||||
Environmental liabilities (see Note 16) | 1.0 | 1.0 | |||||
Product financing agreements | — | 6.0 | |||||
RINs Obligation deficit (see Note 14) | — | 25.6 | |||||
Other | 89.7 | 38.5 | |||||
Total | $ | 164.8 | $ | 229.8 | |||
15
The detail of other non-current liabilities is as follows (in millions):
Other Non-Current Liabilities | June 30, 2017 | December 31, 2016 | |||||
Long-term derivative liabilities (see Note 15) | $ | 27.1 | $ | 17.3 | |||
Other | 5.1 | 8.7 | |||||
Total | $ | 32.2 | $ | 26.0 | |||
9. Stockholders' Equity
Changes to equity during the six months ended June 30, 2017 are presented below (in millions, except per share amounts):
Delek Stockholders' Equity | Non-Controlling Interest in Subsidiaries | Total Stockholders' Equity | ||||||||||
Balance at December 31, 2016 | $ | 991.9 | $ | 190.6 | $ | 1,182.5 | ||||||
Net income (loss) | (26.7 | ) | 9.8 | (16.9 | ) | |||||||
Net unrealized gain on cash flow hedges, net of income tax expense of $10.4 million and ineffectiveness gain of $0.4 million | 19.3 | — | 19.3 | |||||||||
Foreign currency translation gain | 0.1 | — | 0.1 | |||||||||
Other comprehensive income from equity method investments, net of income tax expense of a nominal amount | 0.1 | — | 0.1 | |||||||||
Common stock dividends ($0.30 per share) | (19.0 | ) | — | (19.0 | ) | |||||||
Distribution to non-controlling interest | — | (13.2 | ) | (13.2 | ) | |||||||
Repurchase of non-controlling interest | — | (7.3 | ) | (7.3 | ) | |||||||
Equity-based compensation expense | 7.5 | 0.4 | 7.9 | |||||||||
Taxes due to the net settlement of equity-based compensation | (2.2 | ) | — | (2.2 | ) | |||||||
Other | 0.1 | — | 0.1 | |||||||||
Balance at June 30, 2017 | $ | 971.1 | $ | 180.3 | $ | 1,151.4 | ||||||
Dividends
During the six months ended June 30, 2017, our Board of Directors declared the following dividends:
Date Declared | Dividend Amount Per Share | Record Date | Payment Date | |||
February 27, 2017 | $0.15 | March 15, 2017 | March 29, 2017 | |||
May 8, 2017 | $0.15 | May 23, 2017 | June 2, 2017 | |||
Stock Repurchase Program
In December 2016, our Board of Directors authorized a share repurchase program for up to $150.0 million of Delek common stock. Any share repurchases under the repurchase program may be implemented through open market transactions or in privately negotiated transactions, in accordance with applicable securities laws. The timing, price, and size of repurchases will be made at the discretion of management and will depend on prevailing market prices, general economic and market conditions and other considerations. The repurchase program does not obligate us to acquire any particular amount of stock and does not expire. There were no shares repurchased during the three and six months ended June 30, 2017.
10. Income Taxes
16
Under ASC 740, Income Taxes (“ASC 740”), companies are required to apply an estimated annual tax rate to interim period results on a year-to-date basis; however, the estimated annual tax rate should not be applied to interim financial results if a reliable estimate cannot be made. In this situation, the interim tax rate should be based on actual year-to-date results. Based on our current projections, which have fluctuated as a result of changes in crude oil prices and the related crack spreads, we believe that using actual year-to-date results to compute our effective tax rate will produce a more reliable estimate of our tax expense or benefit. As such, we recorded a tax provision for the three and six months ended June 30, 2017 and 2016 based on actual year-to-date results, in accordance with ASC 740.
Our effective tax rate was 45.6% and 56.6% for the three and six months ended June 30, 2017, respectively, compared to 79.8% and 58.3% for the three and six months ended June 30, 2016, respectively. The decrease in our effective tax rate in the three and six months ended June 30, 2017 was primarily due to the expiration of provisions for certain tax credits and incentives that expired as of December 31, 2016 and have not been extended by Congress.
11. Equity-Based Compensation
Delek US Holdings, Inc. 2006 and 2016 Long-Term Incentive Plans
Compensation expense for Delek equity-based awards amounted to $3.7 million ($2.4 million, net of taxes) and $7.0 million ($4.5 million, net of taxes) for the three and six months ended June 30, 2017, respectively, and $3.7 million ($2.4 million, net of taxes) and $7.4 million ($4.8 million, net of taxes) for the three and six months ended June 30, 2016, respectively. These amounts, excluding amounts related to discontinued operations of $0.3 million and $0.7 million for the three and six months ended June 30, 2016, are included in general and administrative expenses in the accompanying condensed consolidated statements of income.
As of June 30, 2017, there was $26.3 million of total unrecognized compensation cost related to non-vested share-based compensation arrangements, which is expected to be recognized over a weighted-average period of 1.7 years.
We issued 126,342 and 200,453 shares of common stock as a result of exercised stock options, stock appreciation rights, and vested restricted stock units during the three and six months ended June 30, 2017, respectively, and 32,166 and 72,632 shares during the three and six months ended June 30, 2016, respectively. These amounts do not include shares withheld to satisfy employee tax obligations related to the exercises and vestings. Such withheld shares totaled 89,895 and 151,740 shares during the three and six months ended June 30, 2017, respectively, and 15,396 and 27,579 shares during the three and six months ended June 30, 2016, respectively.
Delek Logistics GP, LLC 2012 Long-Term Incentive Plan
Compensation expense for Delek Logistics GP equity-based awards was $0.5 million ($0.3 million, net of taxes) and $0.9 million ($0.6 million, net of taxes) for the three and six months ended June 30, 2017, respectively, and $0.4 million ($0.3 million, net of taxes) and $0.8 million ($0.5 million, net of taxes) for the three and six months ended June 30, 2016, respectively. These amounts are included in general and administrative expenses in the accompanying condensed consolidated statements of income.
As of June 30, 2017, there was $1.1 million of total unrecognized compensation cost related to non-vested share-based compensation arrangements, which is expected to be recognized over a weighted-average period of 1.4 years.
12. Earnings (Loss) Per Share
Basic and diluted earnings per share are computed by dividing net income (loss) by the weighted average common shares outstanding. The common shares used to compute Delek’s basic and diluted earnings (loss) per share are as follows:
Three Months Ended | Six Months Ended | |||||||||||
June 30, | June 30, | |||||||||||
2017 | 2016 | 2017 | 2016 | |||||||||
Weighted average common shares outstanding | 62,054,485 | 61,827,201 | 62,016,489 | 61,979,604 | ||||||||
Dilutive effect of equity instruments | — | — | — | — | ||||||||
Weighted average common shares outstanding, assuming dilution | 62,054,485 | 61,827,201 | 62,016,489 | 61,979,604 | ||||||||
Outstanding common share equivalents totaling 3,195,829 and 3,205,364 were excluded from the diluted earnings per share calculation for the three and six months ended June 30, 2017, respectively, and 3,114,732 and 2,958,334 for the three and six months ended June 30, 2016, respectively, as these common share equivalents did not have a dilutive effect under the treasury stock method. These amounts include outstanding common share equivalents totaling 699,700 and 697,235 that were excluded from the diluted earnings per share calculation due to the net loss for the three and six months ended June 30, 2017, respectively, and 196,540 and 226,860 for the three and six months ended June 30, 2016, respectively.
17
13. Segment Data
Prior to August 2016, we aggregated our operating units into three reportable segments: refining, logistics and retail. However, in August 2016, Delek entered into a Purchase Agreement to sell the Retail Entities, which consist of all of the retail segment and a portion of the corporate, other and eliminations segment, to COPEC. As a result of the Purchase Agreement, we met the requirements of ASC 205-20 and ASC 360 to report the results of the Retail Entities as discontinued operations and to classify the Retail Entities as a group of assets held for sale. The operating results for the Retail Entities, in all periods presented, have been reclassified to discontinued operations and are no longer reported as retail segment.
Our corporate activities, results of certain immaterial operating segments, our equity method investment in Alon USA and intercompany eliminations are reported in the corporate, other and eliminations segment. Decisions concerning the allocation of resources and assessment of operating performance are made based on this segmentation. Management measures the operating performance of each of the reportable segments based on the segment contribution margin.
Segment contribution margin is defined as net sales less cost of sales and operating expenses, excluding depreciation and amortization. Operations which are not specifically included in the reportable segments are included in the corporate and other category, which primarily consists of operating expenses, depreciation and amortization expense and interest income and expense associated with our corporate headquarters.
The refining segment processes crude oil and other purchased feedstocks for the manufacture of transportation motor fuels, including various grades of gasoline, diesel fuel, aviation fuel, asphalt and other petroleum-based products that are distributed through owned and third-party product terminals. The refining segment has a combined nameplate capacity of 155,000 bpd, including the 75,000 bpd Tyler refinery and the 80,000 bpd El Dorado refinery. The refining segment also owns and operates two biodiesel facilities involved in the production of biodiesel fuels and related activities.
Our refining segment has a services agreement with our logistics segment, which, among other things, requires the refining segment to pay service fees based on the number of gallons sold at the Tyler refinery and a sharing of a portion of the margin achieved in return for providing marketing, sales and customer services. This intercompany transaction fee was $5.3 million and $9.6 million during the three and six months ended June 30, 2017, respectively, and $4.2 million and $8.1 million during the three and six months ended June 30, 2016, respectively. Additionally, the refining segment pays crude transportation, terminalling and storage fees to the logistics segment for the utilization of pipeline, terminal and storage assets. These fees were $33.1 million and $64.3 million during the three and six months ended June 30, 2017, respectively, and $30.7 million and $61.7 million during the three and six months ended June 30, 2016, respectively. The logistics segment also sold $1.2 million and $2.3 million of Renewable Identification Numbers ("RINs") to the refining segment during the three and six months ended June 30, 2017, respectively, and $1.4 million and $2.9 million during the three and six months ended June 30, 2016, respectively. The refining segment recorded sales and fee revenues from the logistics segment of $8.2 million and $17.2 million during the three and six months ended June 30, 2017, and recorded sales and fee revenues from the logistics segment and the Retail Entities, the operations of which are included in discontinued operations, in the amount of $97.1 million and $188.5 million during the three and six months ended June 30, 2016. All inter-segment transactions have been eliminated in consolidation.
Our logistics segment owns and operates crude oil and refined products logistics and marketing assets. The logistics segment generates revenue and contribution margin by charging fees for gathering, transporting and storing crude oil and for marketing, distributing, transporting and storing intermediate and refined products.
18
The following is a summary of business segment operating performance as measured by contribution margin for the period indicated (in millions):
Three Months Ended June 30, 2017 | ||||||||||||||||
(In millions) | Refining | Logistics | Corporate, Other and Eliminations | Consolidated | ||||||||||||
Net sales (excluding intercompany fees and sales) | $ | 1,144.8 | $ | 87.1 | $ | (1.2 | ) | $ | 1,230.7 | |||||||
Intercompany fees and sales | 8.2 | 39.6 | (47.8 | ) | — | |||||||||||
Operating costs and expenses: | ||||||||||||||||
Cost of goods sold | 1,115.4 | 85.0 | (42.6 | ) | 1,157.8 | |||||||||||
Operating expenses | 51.6 | 10.0 | 0.5 | 62.1 | ||||||||||||
Segment contribution margin | $ | (14.0 | ) | $ | 31.7 | $ | (6.9 | ) | 10.8 | |||||||
General and administrative expenses | 27.5 | |||||||||||||||
Depreciation and amortization | 29.5 | |||||||||||||||
Other operating expense, net | 0.3 | |||||||||||||||
Operating loss | $ | (46.5 | ) | |||||||||||||
Total assets | $ | 1,949.6 | $ | 415.5 | $ | 511.4 | $ | 2,876.5 | ||||||||
Capital spending (excluding business combinations) | $ | 11.2 | $ | 2.1 | $ | 1.7 | $ | 15.0 | ||||||||
Six Months Ended June 30, 2017 | ||||||||||||||||
Refining | Logistics | Corporate, Other and Eliminations | Consolidated | |||||||||||||
Net sales (excluding intercompany fees and sales) | $ | 2,235.3 | $ | 180.0 | $ | (2.5 | ) | $ | 2,412.8 | |||||||
Intercompany fees and sales | 17.2 | 76.2 | (93.4 | ) | — | |||||||||||
Operating costs and expenses: | ||||||||||||||||
Cost of goods sold | 2,099.7 | 177.6 | (83.8 | ) | 2,193.5 | |||||||||||
Operating expenses | 102.4 | 20.3 | 0.6 | 123.3 | ||||||||||||
Insurance proceeds — business interruption | — | — | — | — | ||||||||||||
Segment contribution margin | $ | 50.4 | $ | 58.3 | $ | (12.7 | ) | 96.0 | ||||||||
General and administrative expenses | 54.0 | |||||||||||||||
Depreciation and amortization | 58.5 | |||||||||||||||
Other operating expense, net | $ | 0.3 | ||||||||||||||
Operating loss | $ | (16.8 | ) | |||||||||||||
Capital spending (excluding business combinations) | $ | 22.0 | $ | 4.9 | $ | 3.3 | $ | 30.2 | ||||||||
19
Three Months Ended June 30, 2016 | ||||||||||||||||
Refining | Logistics | Corporate, Other and Eliminations(4) | Consolidated | |||||||||||||
Net sales (excluding intercompany fees and sales) | $ | 980.6 | $ | 75.5 | $ | — | $ | 1,056.1 | ||||||||
Intercompany fees and sales(1) | 97.1 | 36.3 | (42.2 | ) | 91.2 | |||||||||||
Operating costs and expenses: | ||||||||||||||||
Cost of goods sold | 988.1 | 73.1 | (35.9 | ) | 1,025.3 | |||||||||||
Operating expenses | 49.6 | 8.7 | (0.5 | ) | 57.8 | |||||||||||
Segment contribution margin | $ | 40.0 | $ | 30.0 | $ | (5.8 | ) | 64.2 | ||||||||
General and administrative expenses | 23.6 | |||||||||||||||
Depreciation and amortization | 29.3 | |||||||||||||||
Operating income | $ | 11.3 | ||||||||||||||
Total assets(2) | $ | 2,002.2 | $ | 381.8 | $ | 964.0 | $ | 3,348.0 | ||||||||
Capital spending (excluding business combinations)(3) | $ | 3.6 | $ | 0.8 | $ | 2.7 | $ | 7.1 | ||||||||
Six Months Ended June 30, 2016 | ||||||||||||||||
Refining | Logistics | Corporate, Other and Eliminations(4) | Consolidated | |||||||||||||
Net sales (excluding intercompany fees and sales) | $ | 1,716.5 | $ | 143.2 | $ | 0.5 | $ | 1,860.2 | ||||||||
Intercompany fees and sales(1) | 188.5 | 72.7 | (88.0 | ) | 173.2 | |||||||||||
Operating costs and expenses: | ||||||||||||||||
Cost of goods sold | 1,776.0 | 139.9 | (74.8 | ) | 1,841.1 | |||||||||||
Operating expenses | 107.9 | 19.2 | (0.3 | ) | 126.8 | |||||||||||
Insurance proceeds - business interruption | (42.4 | ) | — | — | (42.4 | ) | ||||||||||
Segment contribution margin | $ | 63.5 | $ | 56.8 | $ | (12.4 | ) | 107.9 | ||||||||
General and administrative expenses | 52.6 | |||||||||||||||
Depreciation and amortization | 57.6 | |||||||||||||||
Operating loss | $ | (2.3 | ) | |||||||||||||
Capital spending (excluding business combinations)(3) | $ | 6.9 | $ | 1.9 | $ | 4.8 | $ | 13.6 | ||||||||
(1) | Intercompany fees and sales for the refining segment include revenues from the Retail Entities of $91.2 million and $173.2 million during the three and six months ended June 30, 2016, the operations of which are reported in discontinued operations. |
(2) | Assets held for sale of $468.3 million are included in the corporate, other and eliminations segment as of June 30, 2016. |
(3) | Capital spending excludes capital spending associated with the Retail Entities of $2.6 million and $6.0 million during the three and six months ended June 30, 2016. |
(4) | The corporate, other and eliminations segment operating results for the three and six months ended June 30, 2016 have been restated to reflect the reclassification of the Retail Entities to discontinued operations. |
20
Property, plant and equipment and accumulated depreciation as of June 30, 2017 and depreciation expense by reporting segment for the three and six months ended June 30, 2017 are as follows (in millions):
Refining | Logistics | Corporate, Other and Eliminations | Consolidated | |||||||||||||
Property, plant and equipment | $ | 1,223.0 | $ | 347.3 | $ | 48.8 | $ | 1,619.1 | ||||||||
Less: Accumulated depreciation | (412.1 | ) | (101.7 | ) | (26.7 | ) | (540.5 | ) | ||||||||
Property, plant and equipment, net | $ | 810.9 | $ | 245.6 | $ | 22.1 | $ | 1,078.6 | ||||||||
Depreciation expense for the three months ended June 30, 2017 | $ | 21.8 | $ | 5.5 | $ | 2.0 | $ | 29.3 | ||||||||
Depreciation expense for the six months ended June 30, 2017 | $ | 43.6 | $ | 10.4 | $ | 3.9 | $ | 57.9 | ||||||||
In accordance with ASC 360, Delek evaluates the realizability of property, plant and equipment as events occur that might indicate potential impairment. There were no indicators of impairment of our property, plant and equipment as of June 30, 2017.
14. Fair Value Measurements
The fair values of financial instruments are estimated based upon current market conditions and quoted market prices for the same or similar instruments. Management estimates that the carrying value approximates fair value for all of Delek’s assets and liabilities that fall under the scope of ASC 825, Financial Instruments ("ASC 825").
Delek applies the provisions of ASC 820, Fair Value Measurements ("ASC 820"), which defines fair value, establishes a framework for its measurement and expands disclosures about fair value measurements. ASC 820 applies to our commodity derivatives that are measured at fair value on a recurring basis. The standard also requires that we assess the impact of nonperformance risk on our derivatives. Nonperformance risk is not considered material to our financial statements at this time.
ASC 820 requires disclosures that categorize assets and liabilities measured at fair value into one of three different levels depending on the observability of the inputs employed in the measurement. Level 1 inputs are quoted prices in active markets for identical assets or liabilities. Level 2 inputs are observable inputs other than quoted prices included within Level 1 for the asset or liability, either directly or indirectly through market-corroborated inputs. Level 3 inputs are unobservable inputs for the asset or liability reflecting our assumptions about pricing by market participants.
Over the counter ("OTC") commodity swaps, physical commodity purchase and sale contracts and interest rate swaps and caps are generally valued using industry-standard models that consider various assumptions, including quoted forward prices, spot prices, interest rates, time value, volatility factors and contractual prices for the underlying instruments, as well as other relevant economic measures. The degree to which these inputs are observable in the forward markets determines the classification as Level 2 or 3. Our contracts are valued based on exchange pricing and/or price index developers such as Platts or Argus and are, therefore, classified as Level 2.
The U.S. Environmental Protection Agency ("EPA") requires certain refiners to blend biofuels into the fuel products they produce pursuant to the EPA’s Renewable Fuel Standard - 2. Alternatively, credits called RINs, which may be generated and/or purchased, can be used to satisfy this obligation instead of physically blending biofuels ("RINs Obligation"). Our RINs Obligation surplus or deficit is based on the amount of RINs we must purchase, net of amounts internally generated and purchased and the price of those RINs as of the balance sheet date. The RINs Obligation surplus or deficit is categorized as Level 2 and is measured at fair value based on quoted prices from an independent pricing service.
On March 1, 2017, the El Dorado refinery received approval from the EPA for a small refinery exemption from the requirements of the renewable fuel standard for the 2016 calendar year. This waiver resulted in a reduction of our RINs Obligation and related cost of goods sold of approximately $47.5 million for the six months ended June 30, 2017.
From time to time, Delek enters into future commitments to purchase or sell RINs at fixed prices and quantities, which are used to manage the costs associated with our RINs Obligation. These future RIN commitment contracts meet the definition of derivative instruments under ASC 815, Derivatives and Hedging ("ASC 815"). They are categorized as Level 2, and are measured at fair value based on quoted prices from an independent pricing service. Changes in the fair value of these future RIN commitment contracts are recorded in cost of goods sold on the consolidated statements of income.
We have elected to account for our J. Aron step-out liability at fair value in accordance with ASC 825, as it pertains to the fair value option. This standard permits the election to carry financial instruments and certain other items similar to financial instruments at fair value on the balance sheet, with all changes in fair value reported in earnings. By electing the fair value option, we can achieve an accounting result similar
21
to a fair value hedge without having to follow the complex hedge accounting rules. Our J. Aron step-out liability is categorized as Level 2, and is measured at fair value using market prices for the consigned crude oil and refined products we are required to repurchase from J. Aron at the end of the term of the Supply and Offtake Agreement. The J. Aron step-out liability is presented in the Obligation under Supply and Offtake Agreement line item of the our condensed consolidated balance sheet as of June 30, 2017. The December 31, 2016 balance in Obligation under Supply and Offtake Agreement includes the J. Aron step-out liability, net off a $20.2 million holdback deposit, which is not eligible for the fair value option. Such deposit was classified as current and presented as an offset to the current liability because the contract had not been renewed as of that date. Gains (losses) related to the change in fair value were recorded as a component of cost of goods sold in the consolidated statements of income.
The fair value hierarchy for our financial assets and liabilities accounted for at fair value on a recurring basis at June 30, 2017 and December 31, 2016, was as follows (in millions):
As of June 30, 2017 | ||||||||||||||||
Level 1 | Level 2 | Level 3 | Total | |||||||||||||
Assets | ||||||||||||||||
OTC commodity swaps | $ | — | $ | 59.3 | $ | — | $ | 59.3 | ||||||||
RINs Obligation surplus | — | 8.7 | — | 8.7 | ||||||||||||
Total assets | — | 68.0 | — | 68.0 | ||||||||||||
Liabilities | ||||||||||||||||
OTC commodity swaps | — | (80.0 | ) | — | (80.0 | ) | ||||||||||
RIN commitment contracts | — | (2.2 | ) | — | (2.2 | ) | ||||||||||
J. Aron step-out liability | — | (145.4 | ) | — | (145.4 | ) | ||||||||||
Total liabilities | — | (227.6 | ) | — | (227.6 | ) | ||||||||||
Net liabilities | $ | — | $ | (159.6 | ) | $ | — | $ | (159.6 | ) | ||||||
As of December 31, 2016 | ||||||||||||||||
Level 1 | Level 2 | Level 3 | Total | |||||||||||||
Assets | ||||||||||||||||
OTC commodity swaps | $ | — | $ | 53.1 | $ | — | $ | 53.1 | ||||||||
RINs Obligation surplus | — | 4.9 | — | 4.9 | ||||||||||||
Total assets | — | 58.0 | — | 58.0 | ||||||||||||
Liabilities | ||||||||||||||||
OTC commodity swaps | — | (103.6 | ) | — | (103.6 | ) | ||||||||||
RIN commitment contracts | — | (0.8 | ) | — | (0.8 | ) | ||||||||||
RINs Obligation deficit | — | (25.6 | ) | — | (25.6 | ) | ||||||||||
J. Aron step-out liability | — | (144.8 | ) | — | (144.8 | ) | ||||||||||
Total liabilities | — | (274.8 | ) | — | (274.8 | ) | ||||||||||
Net liabilities | $ | — | $ | (216.8 | ) | $ | — | $ | (216.8 | ) | ||||||
The derivative values above are based on analysis of each contract as the fundamental unit of account as required by ASC 820. Derivative assets and liabilities with the same counterparty are not netted where the legal right of offset exists. This differs from the presentation in the financial statements which reflects our policy, wherein we have elected to offset the fair value amounts recognized for multiple derivative instruments executed with the same counterparty and where the legal right of offset exists. As of June 30, 2017 and December 31, 2016, $5.7 million and $14.7 million, respectively, of cash collateral was held by counterparty brokerage firms and has been netted with the net derivative positions with each counterparty. See Note 15 for further information regarding derivative instruments.
22
15. Derivative Instruments
We use derivatives to reduce normal operating and market risks with the primary objective of reducing the impact of market price volatility on our results of operations. As such, our use of derivative contracts is aimed at:
• | limiting the exposure to price fluctuations of commodity inventory above or below target levels at each of our segments; |
• | managing our exposure to commodity price risk associated with the purchase or sale of crude oil, feedstocks and finished grade fuel products at each of our segments; and |
• | limiting the exposure to interest rate fluctuations on our floating rate borrowings. |
We primarily utilize OTC commodity swaps, generally with maturity dates of three years or less, and interest rate swap and cap agreements to achieve these objectives. OTC commodity swap contracts require cash settlement for the commodity based on the difference between a fixed or floating price and the market price on the settlement date. As of June 30, 2017, there are no interest rate swap or cap agreements outstanding. At this time, we do not believe there is any material credit risk with respect to the counterparties to these contracts.
From time to time, we also enter into future commitments to purchase or sell RINs at fixed prices and quantities, which are used to manage the costs associated with our RINs Obligation. These future RIN commitment contracts meet the definition of derivative instruments under ASC 815, and are recorded at estimated fair value in accordance with the provisions of ASC 815. Changes in the fair value of these future RIN commitment contracts are recorded in cost of goods sold on the consolidated statements of income.
In accordance with ASC 815, certain of our OTC commodity swap contracts have been designated as cash flow hedges and the effective portion of the change in fair value between the execution date and the end of period has been recorded in other comprehensive income. The effective portion of the fair value of these contracts is recognized in income at the time the positions are closed and the hedged transactions are recognized in income.
From time to time, we also enter into futures contracts with supply vendors that secure supply of product to be purchased for use in the normal course of business at our refining segment. These contracts are priced based on an index that is clearly and closely related to the product being purchased, contain no net settlement provisions and typically qualify under the normal purchase exemption from derivative accounting treatment under ASC 815.
23
The following table presents the fair value of our derivative instruments as of June 30, 2017 and December 31, 2016. The fair value amounts below are presented on a gross basis and do not reflect the netting of asset and liability positions permitted under our master netting arrangements, including cash collateral on deposit with our counterparties. We have elected to offset the recognized fair value amounts for multiple derivative instruments executed with the same counterparty in our financial statements. As a result, the asset and liability amounts below differ from the amounts presented in our condensed consolidated balance sheets. See Note 14 for further information regarding the fair value of derivative instruments (in millions):
June 30, 2017 | December 31, 2016 | ||||||||||||||||
Derivative Type | Balance Sheet Location | Assets | Liabilities | Assets | Liabilities | ||||||||||||
Derivatives not designated as hedging instruments: | |||||||||||||||||
OTC commodity swaps(1) | Other current assets | $ | 53.3 | $ | (46.9 | ) | $ | 37.4 | $ | (30.6 | ) | ||||||
OTC commodity swaps(1) | Other current liabilities | — | — | 14.4 | (35.2 | ) | |||||||||||
OTC commodity swaps(1) | Other long term assets | 1.8 | (1.8 | ) | — | — | |||||||||||
OTC commodity swaps(1) | Other long term liabilities | 4.2 | (4.5 | ) | — | — | |||||||||||
RIN commitment contracts(2) | Other current assets | — | (1.0 | ) | — | — | |||||||||||
RIN commitment contracts(2) | Other current liabilities | — | (1.2 | ) | — | (0.8 | ) | ||||||||||
Derivatives designated as hedging instruments: | |||||||||||||||||
OTC commodity swaps(1) | Other current assets | — | — | 0.1 | (2.5 | ) | |||||||||||
OTC commodity swaps(1) | Other current liabilities | — | — | 1.2 | (18.0 | ) | |||||||||||
OTC commodity swaps(1) | Other long term liabilities | — | (26.8 | ) | — | (17.3 | ) | ||||||||||
Total gross fair value of derivatives | $ | 59.3 | $ | (82.2 | ) | $ | 53.1 | $ | (104.4 | ) | |||||||
Less: Counterparty netting and cash collateral(3) | 47.2 | (52.9 | ) | 46.3 | (61.0 | ) | |||||||||||
Less: Amounts subject to master netting arrangements that are not netted on the balance sheet | 2.0 | (2.0 | ) | — | — | ||||||||||||
Total net fair value of derivatives | $ | 10.1 | $ | (27.3 | ) | $ | 6.8 | $ | (43.4 | ) | |||||||
(1) | As of June 30, 2017 and December 31, 2016, we had open derivative positions representing 25,419,902 barrels and 9,348,000 barrels, respectively, of crude oil and refined petroleum products. Of these open positions, contracts representing 1,150,000 barrels and 3,392,000 barrels were designated as cash flow hedging instruments as of June 30, 2017 and December 31, 2016, respectively. |
(2) | As of June 30, 2017 and December 31, 2016, we had open RIN contracts representing 96,250,000 and 36,750,000 RINs, respectively. |
(3) | As of June 30, 2017 and December 31, 2016, $5.7 million and $14.7 million, respectively, of cash collateral held by counterparties has been netted with the derivatives with each counterparty. |
Total losses on our commodity derivatives and RIN commitment contracts recorded in cost of goods sold on the condensed consolidated statements of income for the three and six months ended June 30, 2017 and 2016 are as follows (in millions):
Three Months Ended June 30, | Six Months Ended June 30, | |||||||||||||||
2017 | 2016 | 2017 | 2016 | |||||||||||||
Gains (losses) on derivatives not designated as hedging instruments | $ | 3.9 | $ | (13.1 | ) | $ | 8.5 | $ | (12.6 | ) | ||||||
Realized losses reclassified out of OCI on derivatives designated as cash flow hedging instruments | (31.7 | ) | (7.1 | ) | (39.5 | ) | (14.4 | ) | ||||||||
Gains recognized due to cash flow hedging ineffectiveness | 0.1 | 1.5 | 0.4 | 0.5 | ||||||||||||
Total | $ | (27.7 | ) | $ | (18.7 | ) | $ | (30.6 | ) | $ | (26.5 | ) | ||||
For cash flow hedges, no component of the derivative instruments’ gains or losses was excluded from the assessment of hedge effectiveness for the three and six months ended June 30, 2017 or 2016. As of June 30, 2017 and December 31, 2016, losses of $3.2 million and $16.2 million, respectively, on cash flow hedges, net of tax, primarily related to future purchases of crude oil and the associated sale of finished grade fuel, remained in accumulated other comprehensive income. Losses of $20.6 million and $25.7 million, net of tax, on settled contracts were reclassified into cost of goods sold in the condensed consolidated statements of income during the three and six months ended June 30, 2017, respectively. Losses of $4.6 million and $9.4 million, net of tax, on settled contracts were reclassified into cost of goods sold in the condensed consolidated statements of income during the three and six months ended June 30, 2016, respectively. We estimate that $4.9 million of deferred
24
losses will be reclassified into cost of goods sold over the next 12 months as a result of hedged transactions that are forecasted to occur. For the six months ended June 30, 2017 and June 30, 2016, there were no amounts reclassified from accumulated other comprehensive income into income as a result of the discontinuation of cash flow hedge accounting.
16. Commitments and Contingencies
Litigation
In the ordinary conduct of our business, we are from time to time subject to lawsuits, investigations and claims, including environmental claims and employee-related matters.
Although we cannot predict with certainty the ultimate resolution of lawsuits, investigations and claims asserted against us, including civil penalties or other enforcement actions, we do not believe that any currently pending legal proceeding or proceedings to which we are a party will have a material adverse effect on our business, financial condition or results of operations.
Self-insurance
Delek is self-insured for workers’ compensation claims up to $1.0 million on a per-accident basis. We self-insure for general liability claims up to $4.0 million on a per-occurrence basis. We self-insure for auto liability up to $4.0 million on a per-accident basis.
We have umbrella liability insurance available to each of our segments in an amount determined reasonable by management.
Environmental, Health and Safety
We are subject to extensive federal, state and local environmental and safety laws and regulations enforced by various agencies, including the EPA, the United States Department of Transportation, the Occupational Safety and Health Administration, the Texas Commission on Environmental Quality, the Railroad Commission of Texas, the Arkansas Department of Environmental Quality (the "ADEQ") and the Tennessee Department of Environment and Conservation, as well as other state and federal agencies. These laws and regulations govern the discharge of materials into the environment, waste management practices, pollution prevention measures and the composition of the fuels we produce, as well as the safe operation of our plants and pipelines and the safety of our workers and the public. Numerous permits or other authorizations are required under these laws and regulations for the operation of our refineries, biodiesel facilities, terminals, pipelines, trucks, rail cars and related operations, and may be subject to revocation, modification and renewal.
These laws and permits raise potential exposure to future claims and lawsuits involving environmental and safety matters which could include soil and water contamination, air pollution, personal injury and property damage allegedly caused by substances which we manufactured, handled, used, released or disposed of, transported, or that relate to pre-existing conditions for which we have assumed responsibility. We believe that our current operations are in substantial compliance with existing environmental and safety requirements. However, there have been and will continue to be ongoing discussions about environmental and safety matters between us and federal and state authorities, including notices of violations, citations and other enforcement actions, some of which have resulted or may result in changes to operating procedures and in capital expenditures. While it is often difficult to quantify future environmental or safety related expenditures, we anticipate that continuing capital investments and changes in operating procedures will be required for the foreseeable future to comply with existing and new requirements, as well as evolving interpretations and more strict enforcement of existing laws and regulations.
As of June 30, 2017, we have recorded an environmental liability of approximately $6.8 million, primarily related to the estimated probable costs of remediating or otherwise addressing certain environmental issues of a non-capital nature at the Tyler and El Dorado refineries. This liability includes estimated costs for ongoing investigation and remediation efforts, which were already being performed by the former operators of the Tyler and El Dorado refineries prior to our acquisition of those facilities, for known contamination of soil and groundwater, as well as estimated costs for additional issues which have been identified subsequent to the acquisitions. We expect approximately $0.2 million of this amount to be reimbursable by a prior owner of the El Dorado refinery, which we have recorded in other current assets in our condensed consolidated balance sheet as of June 30, 2017. Approximately $1.0 million of the total liability is expected to be expended over the next 12 months with most of the balance expended by 2022. In the future, we could be required to extend the expected remediation period or undertake additional investigations of our refineries, pipelines and terminal facilities, which could result in additional remediation liabilities.
We have experienced several crude oil releases from pipelines owned by our logistics segment, including, but not limited to, a release at Magnolia Station in March 2013, a release near Fouke, Arkansas in April 2015 and a release near Woodville, Texas in January 2016. In June 2015, the United States Department of Justice notified Delek Logistics that they were evaluating an enforcement action on behalf of the EPA with regard to potential Clean Water Act violations arising from the March 2013 Magnolia Station release. We are currently attempting to negotiate a resolution to this matter with the EPA and the ADEQ, which may include monetary penalties and/or other relief. Based on current information available to us, we do not believe the total costs associated with these events, whether alone or in the aggregate, including any fines or penalties, will have a material adverse effect upon our business, financial condition or results of operations.
25
Letters of Credit
As of June 30, 2017, we had in place letters of credit totaling approximately $110.0 million with various financial institutions securing obligations primarily with respect to our commodity purchases for the refining segment, our gasoline and diesel purchases for the logistics segment and our workers’ compensation and general liability self-insurance programs. No amounts were drawn by beneficiaries of these letters of credit at June 30, 2017.
17. Subsequent Events
Dividend Declaration
On August 1, 2017, our Board of Directors voted to declare a quarterly cash dividend of $0.15 per share of our common stock, payable on September 13, 2017 to shareholders of record on August 23, 2017.
Delek/Alon Merger
In January 2017, we announced that Old Delek (and various related entities) entered into the Merger Agreement with Alon USA, as subsequently amended on February 27 and April 21, 2017. The related mergers (the "Mergers" or the "Delek/Alon Merger") were effective July 1, 2017 (as previously defined, the “Effective Time”), resulting in a new post-combination consolidated registrant renamed as Delek US Holdings, Inc. (as previously defined, “New Delek”), with Alon USA and Old Delek surviving as wholly-owned subsidiaries of New Delek. New Delek is the successor issuer to Old Delek and Alon pursuant to Rule 12g-3(c) under the Exchange Act, as amended. In addition, as a result of the Delek/Alon Merger, the shares of common stock of Old Delek and Alon USA were delisted from the New York Stock Exchange in July 2017, and their respective reporting obligations under the Exchange Act were terminated. Prior to the Mergers, Old Delek owned a non-controlling equity interest of approximately 47% of the outstanding shares of Alon USA, which was accounted for under the equity method of accounting (See Note 3).
Subject to the terms and conditions of the Merger Agreement, at the Effective Time, each issued and outstanding share of Alon USA Common Stock, other than shares owned by Old Delek and its subsidiaries or held in the treasury of Alon USA, was converted into the right to receive 0.504 of a share of New Delek Common Stock, or, in the case of fractional shares of New Delek Common Stock, cash (without interest) in an amount equal to the product of (i) such fractional part of a share of New Delek Common Stock multiplied by (ii) $25.96 per share, which was the volume weighted average price of the Old Delek Common Stock, par value $0.01 per share as reported on the NYSE Composite Transactions Reporting System for the twenty consecutive New York Stock Exchange (“NYSE”) full trading days ending on June 30, 2017. Each outstanding share of restricted Alon USA Common Stock was assumed by New Delek and converted into restricted stock denominated in shares of New Delek Common Stock.
In addition, subject to the terms and conditions of the Merger Agreement, each share of Old Delek Common Stock or fraction thereof issued and outstanding immediately prior to the Effective Time (other than Old Delek Common Stock held in the treasury of Old Delek) was converted at the Effective Time into the right to receive one validly issued, fully paid and non‑assessable share of New Delek Common Stock or such fraction thereof equal to the fractional share of New Delek Common Stock. All existing Old Delek stock options, restricted stock awards and stock appreciation rights were converted into equivalent rights with respect to New Delek Common Stock.
In connection with the Mergers, Alon USA, New Delek and U.S. Bank National Association, as trustee (the “Trustee”) entered into a First Supplemental Indenture (the “Supplemental Indenture”), effective as of July 1, 2017, supplementing the Indenture, dated as of September 16, 2013 (the “Indenture”), pursuant to which Alon USA issued its 3.00% Convertible Senior Notes due 2018 (the “Notes”), which were convertible into shares of Alon USA’s Common Stock, par value $0.01 per share or cash or a combination of cash and Alon USA Common Stock, all as provided in the Indenture. The Supplemental Indenture provides that, as of the Effective Time, the right to convert each $1,000 principal amount of the Notes based on a number of shares of Alon USA Common Stock equal to the Conversion Rate (as defined in the Indenture) in effect immediately prior to the Mergers was changed into a right to convert each $1,000 principal amount of Notes into or based on a number of shares of New Delek Common Stock (at the exchange rate of 0.504), par value $0.01 per share, equal to the Conversion Rate in effect immediately prior to the Mergers. In addition, the Supplemental Indenture provides that, as of the Effective Time, New Delek fully and unconditionally guaranteed, on a senior basis, Alon USA’s obligations under the Notes.
Alon USA is a refiner and marketer of petroleum products, operating primarily in the south central, southwestern and western regions of the United States. Alon USA owns 100% of the general partner and 81.6% of the limited partner interests in Alon USA Partners, LP (NYSE: ALDW), which owns a crude oil refinery in Big Spring, Texas with a crude oil throughput capacity of 73,000 bpd and an integrated wholesale marketing business. In addition, Alon USA directly owns a crude oil refinery in Krotz Springs, Louisiana with a crude oil throughput capacity of 74,000 bpd. Alon USA also owns crude oil refineries in California, which have not processed crude oil since 2012. Alon USA is a marketer of asphalt, which it distributes through asphalt terminals located predominantly in the southwestern and western United States. Alon USA is the largest 7-Eleven licensee in the United States and operates approximately 300 convenience stores which market motor fuels in central and west Texas and New Mexico. The primary purpose of the Mergers was to enter into a strategic combination that has resulted in a larger, more
26
diverse company that we believe is well positioned to take advantage of opportunities in the market and better navigate the cyclical nature of the business. The combination is also expected to provide opportunities for synergies across the organization as well as create a refining system that enhances its position as a significant buyer of crude from the Permian Basin among the independent refiners.
Total consideration paid/issued to effect the Delek/Alon Merger totaled approximately $499.8 million (excluding the fair value of the non-controlling interest, which is still being determined), consisting of approximately 19.3 million shares of newly issued incremental New Delek common stock. Transaction costs incurred by the Company totaling approximately $2.4 million and $4.0 million were included in general and administrative expenses in the accompanying condensed consolidated statements of income for the three and six month periods ended June 30, 2017, respectively. The Mergers will be accounted for using the acquisition method. Valuations and other required information associated with the business combination are not yet available as of the date these financial statements were issued. Therefore, the calculation of fair value of the consideration transferred (including the fair value of the pre-existing non-controlling interest), as well as the fair value of identifiable net assets acquired, resulting goodwill and the associated tax effect have not yet been determined.
The following unaudited pro forma financial information presents the condensed combined results of operations of Delek and Alon USA for the three and six months ended June 30, 2017 and 2016 as if the Delek/Alon Merger had occurred on January 1, 2016. The unaudited pro forma financial information is not intended to represent or be indicative of the consolidated results of operations that would have been reported had the Delek/Alon merger been completed as of January 1, 2016, and should not be taken as indicative of New Delek's future consolidated results of operations. In addition, the unaudited pro forma condensed combined results of operations do not reflect any cost savings or associated costs to achieve such savings from operating efficiencies, synergies, debt refinancing or other restructuring that may result from the Delek/Alon Merger. The pro forma financial information also does not consider adjustments that may be necessary to conform Alon USA's accounting policies to Delek's accounting policies, as such determinations have not yet been completed. Pro forma adjustments are tax-effected at the Company's estimated statutory tax rates.
Three Months Ended | Six Months Ended | |||||||||||||||
June 30, | June 30, | |||||||||||||||
(in millions, except per share data) | 2017 | 2016 | 2017 | 2016 | ||||||||||||
Net sales | $ | 2,337.3 | $ | 2,155.3 | $ | 4,662.1 | $ | 3,885.8 | ||||||||
Net income (loss) attributable to Delek | (36.0 | ) | (20.7 | ) | (19.3 | ) | (73.9 | ) | ||||||||
Earnings (loss) per share: | ||||||||||||||||
Basic | $ | (0.44 | ) | $ | (0.26 | ) | $ | (0.24 | ) | $ | (0.91 | ) | ||||
Diluted | (0.44 | ) | (0.26 | ) | (0.24 | ) | (0.91 | ) | ||||||||
The unaudited pro forma statements of operations reflect the following adjustments:
(a) | To eliminate transactions between Delek and Alon USA for purchases and sales of refined product reducing revenue and the associated cost of goods sold. Such pro forma eliminations reduced combined pro forma sales by $12.5 million and $0.4 million for the three months ended June 30, 2017 and 2016, respectively, and $20.4 million and $5.9 million for the six months ended June 30, 2017 and 2016, respectively. |
(b) | To eliminate Delek’s equity income in Alon USA as the closing of the Delek/Alon Merger resulted in New Delek obtaining full control of Alon USA effective July 1, 2017. Such pro forma elimination resulted in an increase (decrease) to pre-tax income of of $(0.4) million and $10.4 million for the three months ended June 30, 2017 and 2016, respectively, and $(3.2) million and $28.2 million for the six months ended June 30, 2017 and 2016, respectively. |
(c) | To record the tax effect on pro forma adjustments and additional tax benefit associated with dividends received from Alon USA at a combined U.S. (federal and state) income tax statutory blended rate of 35.59% for the three and six months ended June 30, 2017, and 35.37% for the three and six months ended June 30, 2016. |
(d) | To adjust the weighted average number of shares outstanding based on 0.504 of a share of Delek common stock for each share of Alon USA common stock outstanding as of June 30, 2017, reflecting the elimination of Alon USA historical weighted average shares outstanding and the addition of the estimated New Delek incremental shares issued. |
The pro forma income statement does not reflect certain non-recurring adjustments that have been or are expected to be recorded in connection with the Delek/Alon Merger, including any accrual for integration costs or additional transaction costs expected to be incurred at or subsequent to closing, as well as the anticipated gain (loss) on the reversal of the non-controlling equity method investment in Alon USA and its related tax effects (including the applicable utilization of related deferred tax assets), as such adjustments are not expected to be indicative of on-going operations of the combined company.
27
28
ITEM 2. MANAGEMENT’S DISCUSSION AND ANALYSIS OF FINANCIAL CONDITION AND RESULTS OF OPERATIONS
Management’s Discussion and Analysis of Financial Condition and Results of Operations ("MD&A") is management’s analysis of our financial performance and of significant trends that may affect our future performance. The MD&A should be read in conjunction with our condensed consolidated financial statements and related notes included elsewhere in this Quarterly Report on Form 10-Q and in the Annual Report on Form 10-K filed with the Securities and Exchange Commission ("SEC") on February 28, 2017 (the "Annual Report on Form 10-K"). Those statements in the MD&A that are not historical in nature should be deemed forward-looking statements that are inherently uncertain.
As of June 30, 2017, Old Delek owned a non-controlling equity interest of approximately 47% of the outstanding shares (the "ALJ Shares") in Alon USA Energy, Inc. (NYSE: ALJ) (Alon USA"). Alon USA is a refiner and marketer of petroleum products, operating primarily in the south central, southwestern and western regions of the United States. Alon USA owns 100% of the general partner and 81.6% of the limited partner interests in Alon USA Partners, LP (NYSE: ALDW), which owns a crude oil refinery in Big Spring, Texas with a crude oil throughput capacity of 73,000 bpd and an integrated wholesale marketing business. In addition, Alon USA directly owns a crude oil refinery in Krotz Springs, Louisiana with a crude oil throughput capacity of 74,000 bpd. Alon USA also owns crude oil refineries in California, which have not processed crude oil since 2012. Alon USA is a marketer of asphalt, which it distributes through asphalt terminals located predominantly in the southwestern and western United States. Alon USA is the largest 7-Eleven licensee in the United States and operates approximately 300 convenience stores which market motor fuels in central and west Texas and New Mexico.
In January 2017, we announced that Delek US Holdings, Inc. (and various related entities) had entered into an Agreement and Plan of Merger with Alon USA, as subsequently amended on February 27 and April 21, 2017 (as so amended, the "Merger Agreement"). The related Merger (the "Delek/Alon Merger") was effective July 1, 2017 (the “Effective Time”), resulting in a new post-combination consolidated registrant renamed as Delek US Holdings, Inc. (“New Delek”), with Alon USA and the previous Delek US Holdings, Inc. (“Old Delek”) surviving as wholly-owned subsidiaries. New Delek is the successor issuer to Old Delek and Alon pursuant to Rule 12g-3(c) under the Securities Exchange Act of 1934 (the "Exchange Act"), as amended. In addition, as a result of the Delek/Alon Merger, the shares of common stock of Old Delek and Alon were delisted from the New York Stock Exchange in July 2017, and their respective reporting obligations under the Exchange Act were terminated. Concurrently, the shares of common stock of New Delek began trading under Old Delek's former ticker symbol, "DK."
Unless otherwise noted or the context requires otherwise, the disclosures and financial information included in this report for the periods ended June 30, 2017 and 2016, and as of June 30, 2017 and December 31, 2016, reflect that of Old Delek, and the terms "we," "our," "us," "Delek," the "Company" and like terms are used to refer to Old Delek and its consolidated subsidiaries as of June 30, 2017.
Forward-Looking Statements
This Quarterly Report on Form 10-Q contains "forward-looking statements" within the meaning of Section 27A of the Securities Act of 1933, as amended, and Section 21E of the Securities Exchange Act of 1934, as amended (the "Exchange Act"). These forward-looking statements reflect our current estimates, expectations and projections about our future results, performance, prospects and opportunities. Forward-looking statements include, among other things, the information concerning our possible future results of operations, business and growth strategies, financing plans, expectations that regulatory developments or other matters will or will not have a material adverse effect on our business or financial condition, our competitive position and the effects of competition, the projected growth of the industry in which we operate, and the benefits and synergies to be obtained from our completed and any future acquisitions, statements of management’s goals and objectives, and other similar expressions concerning matters that are not historical facts. Words such as "may," "will," "should," "could," "would," "predicts," "potential," "continue," "expects," "anticipates," "future," "intends," "plans," "believes," "estimates," "appears," "projects" and similar expressions, as well as statements in future tense, identify forward-looking statements.
Forward-looking statements should not be read as a guarantee of future performance or results, and will not necessarily be accurate indications of the times at, or by, which such performance or results will be achieved. Forward-looking information is based on information available at the time and/or management’s good faith belief with respect to future events, and is subject to risks and uncertainties that could cause actual performance or results to differ materially from those expressed in the statements. Important factors that, individually or in the aggregate, could cause such differences include, but are not limited to:
• | volatility in our refining margins or fuel gross profit as a result of changes in the prices of crude oil, other feedstocks and refined petroleum products; |
• | risk factors relating to the Delek/Alon Merger, including but not limited to risks surrounding the combining of operations, financial position and cash flows as well as systems, processes and controls going forward, as further discussed in Part II, Item 1A, "Risk Factors"; |
• | our ability to execute our strategy of growth through acquisitions and the transactional risks inherent in such acquisitions; |
• | acquired assets may suffer a diminishment in fair value, which may require us to record a write-down or impairment; |
29
• | liabilities related to, and the effects of, the sale of the Retail Entities (as defined below); |
• | reliability of our operating assets; |
• | competition; |
• | changes in, or the failure to comply with, the extensive government regulations applicable to our industry segments; |
• | diminution in value of long-lived assets may result in an impairment in the carrying value of the assets on our balance sheet and a resultant loss recognized in the statement of operations; |
• | general economic and business conditions affecting the southern United States; |
• | volatility under our derivative instruments; |
• | deterioration of creditworthiness or overall financial condition of a material counterparty (or counterparties); |
• | unanticipated increases in cost or scope of, or significant delays in the completion of, our capital improvement and periodic turnaround projects; |
• | risks and uncertainties with respect to the quantities and costs of refined petroleum products supplied to our pipelines and/or held in our terminals; |
• | operating hazards, natural disasters, casualty losses and other matters beyond our control; |
• | increases in our debt levels or costs; |
• | changes in our ability to continue to access the credit markets; |
• | compliance, or failure to comply, with restrictive and financial covenants in our various debt agreements; |
• | the inability of our subsidiaries to freely make dividends, loans or other cash distributions to us; |
• | seasonality; |
• | acts of terrorism aimed at either our facilities or other facilities that could impair our ability to produce or transport refined products or receive feedstocks; |
• | changes in the cost or availability of transportation for feedstocks and refined products; and |
• | other factors discussed under the headings "Management’s Discussion and Analysis of Financial Condition and Results of Operations" and "Risk Factors" and in our other filings with the SEC. |
In light of these risks, uncertainties and assumptions, our actual results of operations and execution of our business strategy could differ materially from those expressed in, or implied by, the forward-looking statements, and you should not place undue reliance upon them. In addition, past financial and/or operating performance is not necessarily a reliable indicator of future performance and you should not use our historical performance to anticipate future results or period trends. We can give no assurances that any of the events anticipated by any forward-looking statements will occur or, if any of them do, what impact they will have on our results of operations and financial condition.
Forward-looking statements speak only as of the date the statements are made. We assume no obligation to update forward-looking statements to reflect actual results, changes in assumptions or changes in other factors affecting forward-looking information except to the extent required by applicable securities laws. If we do update one or more forward-looking statements, no inference should be drawn that we will make additional updates with respect thereto or with respect to other forward-looking statements.
Executive Summary and Strategic Overview
Business Overview
Unless otherwise noted or the context otherwise requires, the information presented in the Business Overview section speaks as of June 30, 2017.
As of June 30, 2017, we are an integrated downstream energy business focused on petroleum refining and the transportation, storage and wholesale distribution of crude oil, intermediate and refined products. Prior to August 2016, we aggregated our operating units into three reportable segments: refining, logistics and retail. However, in August 2016, we entered into a definitive equity purchase agreement (the
30
"Purchase Agreement") with COPEC. Under the terms of the Purchase Agreement, Delek agreed to sell, and COPEC agreed to purchase, 100% of the equity interests in Delek's wholly-owned subsidiaries MAPCO Express, Inc., MAPCO Fleet, Inc., Delek Transportation, LLC, NTI Investments, LLC and GDK Bearpaw, LLC (collectively, the “Retail Entities”) for cash consideration of $535 million, subject to certain customary adjustments (the “Transaction”). The Retail Transaction closed in November 2016.
As of June 30, 2017, our refining segment operates refineries in Tyler, Texas (the "Tyler refinery") and El Dorado, Arkansas (the "El Dorado refinery") with a combined design crude throughput capacity of 155,000 barrels per day ("bpd"). Our logistics segment gathers, transports and stores crude oil and markets, distributes, transports and stores refined products in select regions of the southeastern United States and west Texas for our refining segment and third parties. Our refining segment also includes two biodiesel facilities we own and operate that are engaged in the production of biodiesel fuels and related activities, located in Crossett, Arkansas and Cleburn, Texas.
At June 30, 2017, we own a 61.5% limited partner interest in Delek Logistics Partners, LP ("Delek Logistics") and a 94.6% interest in the entity that owns the entire 2.0% general partner interest in Delek Logistics and all of the incentive distribution rights. Delek Logistics was formed by Delek in 2012 to own, operate, acquire and construct crude oil and refined products logistics and marketing assets. Delek Logistics' initial assets were contributed by us and included certain assets formerly owned or used by certain of our subsidiaries. A substantial majority of Delek Logistics' assets are currently integral to our refining and marketing operations.
Our profitability in the refining segment is substantially determined by the difference between the cost of the crude oil feedstocks we purchase and the price of the refined products we sell, referred to as the "crack spread", "refining margin" or "refined product margin." The cost to acquire feedstocks and the price of the refined petroleum products we ultimately sell from our refineries depend on numerous factors beyond our control, including the supply of, and demand for, crude oil, gasoline and other refined petroleum products which, in turn, depend on, among other factors, changes in domestic and foreign economies, weather conditions such as hurricanes or tornadoes, local, domestic and foreign political affairs, global conflict, production levels, the availability of imports, the marketing of competitive fuels and government regulation. Other significant factors that influence our results in the refining segment include operating costs (particularly the cost of natural gas used for fuel and the cost of electricity), seasonal factors, refinery utilization rates and planned or unplanned maintenance activities or turnarounds. Moreover, while the fluctuations in the cost of crude oil are typically reflected in the prices of light refined products, such as gasoline and diesel fuel, the price of other residual products, such as asphalt, coke, carbon black oil and liquefied petroleum gas ("LPG"), are less likely to move in parallel with crude cost. This could cause additional pressure on our realized margin during periods of rising or falling crude oil prices. Additionally, our margins are impacted by the pricing differentials of the various types and sources of crude oil we use at our two refineries and their relation to product pricing, such as the differentials between Midland West Texas Intermediate crude oil ("WTI") and Cushing WTI or Cushing WTI and Brent crude oil.
For our Tyler refinery, we compare our per barrel refined product margin to a well established industry metric: the U.S. Gulf Coast 5-3-2 crack spread ("Gulf Coast crack spread"). The Gulf Coast crack spread is used as a benchmark for measuring a refinery's product margins by measuring the difference between the market price of light products and crude oil. It represents the approximate gross margin resulting from processing one barrel of crude oil into three-fifths of a barrel of gasoline and two-fifths of a barrel of high-sulfur diesel. We calculate the Gulf Coast crack spread using the market value of U.S. Gulf Coast Pipeline CBOB and U.S. Gulf Coast Pipeline No. 2 Heating Oil (high sulfur diesel) and the first month futures price of WTI on the New York Mercantile Exchange ("NYMEX"). U.S. Gulf Coast CBOB is a grade of gasoline commonly blended with biofuels and marketed as Regular Unleaded at retail locations. U.S. Gulf Coast Pipeline No. 2 Heating Oil is a petroleum distillate that can be used as either a diesel fuel or a fuel oil. This is the standard by which other distillate products (such as ultra low sulfur diesel) are priced. The NYMEX is a commodities trading exchange where contracts for the future delivery of petroleum products are bought and sold.
The crude oil and product slate flexibility of the El Dorado refinery allows us to take advantage of changes in the crude oil and product markets; therefore, we anticipate that the quantities and varieties of crude oil processed and products manufactured at the El Dorado refinery will continue to vary. Thus, we do not believe that it is possible to develop a reasonable refined product margin benchmark that would accurately portray our refined product margins at the El Dorado refinery.
The cost to acquire the refined fuel products we sell to our wholesale customers in our logistics segment depends on numerous factors beyond our control, including the supply of, and demand for, crude oil, gasoline and other refined petroleum products which, in turn, depend on, among other factors, changes in domestic and foreign economies, weather conditions, domestic and foreign political affairs, production levels, the availability of imports, the marketing of competitive fuels and government regulation.
As previously discussed, as of June 30, 2017, we also owned a non-controlling equity interest of approximately 47% of the outstanding shares in Alon USA. As of June 30, 2017 and December 31, 2016, and for the three and six months ended June 30, 2017 and 2016, our investment in Alon USA was accounted for as an equity method investment and the earnings from this equity method investment reflected in our consolidated statements of income included our share of net earnings directly attributable to this equity method investment, and amortization of the excess of our investment balance over the underlying net assets of Alon USA. As of June 30, 2017, the market value of our ALJ Shares was $448.8 million, based on quoted market prices. There were no indicators of impairment of our investment in Alon USA as of June 30, 2017.
31
As part of our overall business strategy, we regularly evaluate opportunities to expand our portfolio of businesses and may at any time be discussing or negotiating a transaction that, if consummated, could have a material effect on our business, financial condition, liquidity or results of operations.
Recent Developments
Delek/Alon Merger
In January 2017, we announced that Old Delek (and various related entities) entered into a Merger Agreement with Alon USA, as subsequently amended on February 27 and April 21, 2017. The related mergers (the "Mergers" or the "Delek/Alon Merger") were effective July 1, 2017 (as previously defined, the “Effective Time”), resulting in a new post-combination consolidated registrant renamed as Delek US Holdings, Inc. (as previously defined, “New Delek”), with Alon USA and Old Delek surviving as wholly-owned subsidiaries of New Delek. New Delek is the successor issuer to Old Delek and Alon pursuant to Rule 12g-3(c) under the Exchange Act, as amended. In addition, as a result of the Delek/Alon Merger, the shares of common stock of Old Delek and Alon USA were delisted from the New York Stock Exchange in July 2017, and their respective reporting obligations under the Exchange Act were terminated. The Mergers resulted in total stock consideration paid of approximately $499.8 million consisting of approximately 19.3 million incremental shares of New Delek common stock.
Subject to the terms and conditions of the Merger Agreement, at the Effective Time, each issued and outstanding share of Alon USA Common Stock, other than shares owned by Old Delek and its subsidiaries or held in the treasury of Alon USA, was converted into the right to receive 0.504 of a share of New Delek Common Stock, or, in the case of fractional shares of New Delek Common Stock, cash (without interest) in an amount equal to the product of (i) such fractional part of a share of New Delek Common Stock multiplied by (ii) $25.96 per share, which was the volume weighted average price of the Old Delek Common Stock, par value $0.01 per share as reported on the NYSE Composite Transactions Reporting System for the twenty consecutive NYSE full trading days ending on June 30, 2017. Each outstanding share of restricted Alon USA Common Stock was assumed by New Delek and converted into restricted stock denominated in shares of New Delek Common Stock.
In addition, subject to the terms and conditions of the Merger Agreement, each share of Old Delek Common Stock or fraction thereof issued and outstanding immediately prior to the Effective Time (other than Old Delek Common Stock held in the treasury of Old Delek) was converted at the Effective Time into the right to receive one validly issued, fully paid and non‑assessable share of New Delek Common Stock or such fraction thereof equal to the fractional share of New Delek Common Stock. All existing Old Delek stock options, restricted stock awards and stock appreciation rights were converted into equivalent rights with respect to New Delek Common Stock.
In connection with the Mergers, Alon USA, New Delek and U.S. Bank National Association, as trustee (the “Trustee”) entered into a First Supplemental Indenture (the “Supplemental Indenture”), effective as of July 1, 2017, supplementing the Indenture, dated as of September 16, 2013 (the “Indenture”), pursuant to which Alon USA issued its 3.00% Convertible Senior Notes due 2018 (the “Notes”), which were convertible into shares of Alon USA’s Common Stock, par value $0.01 per share or cash or a combination of cash and Alon USA Common Stock, all as provided in the Indenture. The Supplemental Indenture provides that, as of the Effective Time, the right to convert each $1,000 principal amount of the Notes based on a number of shares of Alon USA Common Stock equal to the Conversion Rate (as defined in the Indenture) in effect immediately prior to the Mergers was changed into a right to convert each $1,000 principal amount of Notes into or based on a number of shares of New Delek Common Stock (at the exchange rate of 0.504), par value $0.01 per share, equal to the Conversion Rate in effect immediately prior to the Mergers. In addition, the Supplemental Indenture provides that, as of the Effective Time, New Delek fully and unconditionally guaranteed, on a senior basis, Alon USA’s obligations under the Notes.
The primary purpose of the Mergers was to enter into a strategic combination that has resulted in a larger, more diverse company that we believe is well positioned to take advantage of opportunities in the market and better navigate the cyclical nature of the business. The combination is also expected to provide opportunities for synergies across the organization as well as create a refining system that enhances its position as a significant buyer of crude from the Permian Basin among the independent refiners.
El Dorado Refinery RIN Waiver
In March 2017, the El Dorado refinery received approval from the Environmental Protection Agency for a small refinery exemption from the requirements of the renewable fuel standard for the 2016 calendar year. This waiver resulted in approximately $47.5 million of Renewable Identification Number ("RIN") expense reduction, based on an aggregated average price of $0.45 per RIN.
Return to Shareholders
Dividends
On June 2, 2017, we paid a regular dividend of $0.15 per share of our common stock, declared on May 8, 2017 to shareholders of record on May 23, 2017. On August 1, 2017, our Board of Directors voted to declare a quarterly cash dividend of $0.15 per share of our common stock, payable on September 13, 2017 to shareholders of record on August 23, 2017.
32
Share Repurchase Program
In December 2016, our Board of Directors authorized a share repurchase program for up to $150.0 million of Delek common stock. Any share repurchases under the repurchase program may be implemented through open market transactions or in privately negotiated transactions, in accordance with applicable securities laws. The timing, price, and size of repurchases will be made at the discretion of management and will depend on prevailing market prices, general economic and market conditions and other considerations. The repurchase program does not obligate us to acquire any particular amount of stock and does not expire. There were no shares repurchased during the three and six months ended June 30, 2017.
Market Trends
Our results of operations are significantly affected by fluctuations in the prices of certain commodities, including, but not limited to, crude oil, gasoline, distillate fuel, biofuels and natural gas and electricity, among others. Historically, our profitability has been affected by commodity price volatility, specifically as it relates to the price of crude oil and refined products.
The table below reflects the quarterly high, low and average prices of Cushing WTI crude oil for each of the quarterly periods in 2016 and the six months ended June 30, 2017.
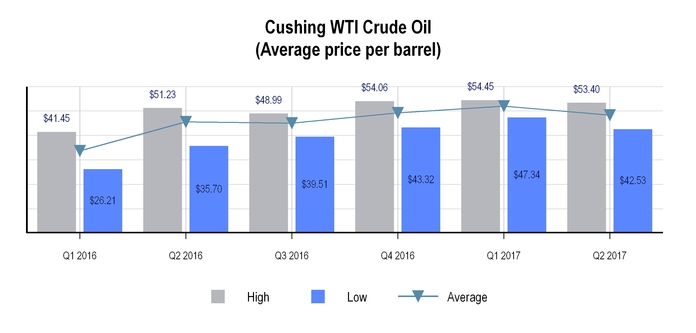
33
The table below reflects the quarterly high, low and average 5-3-2 crack spread for each of the quarterly periods in 2016 and the six months ended June 30, 2017.
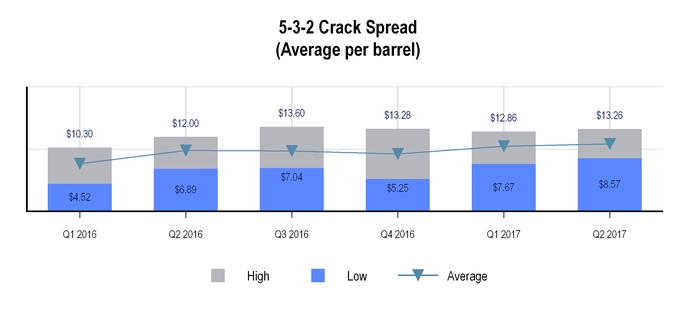
The average Gulf Coast 5-3-2 crack spread increased to $10.68 during the first six months of 2017 from $8.74 during the first six months of 2016. The wholesale price of refined products contributed to the increase in the Gulf Coast 5-3-2 crack spread in the six months ended June 30, 2017, with the U.S. Gulf Coast price of gasoline increasing 23.1%, from an average of $1.21 per gallon in the first six months of 2016 to $1.49 per gallon in the first six months of 2017 and the U.S. Gulf Coast price of High Sulfur Diesel increased 31.1%, from an average of $1.06 per gallon in the first six months of 2016 to $1.39 per gallon in the first six months of 2017. The charts below illustrate the average price of U.S. Gulf Coast Gasoline and U.S. High Sulfur Diesel for each of the quarterly periods in 2016 and the six months ended June 30, 2017.
34
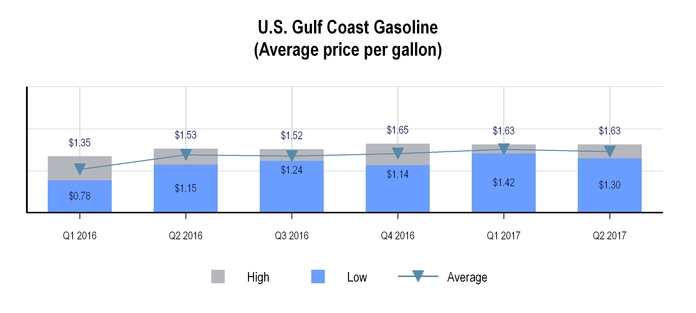
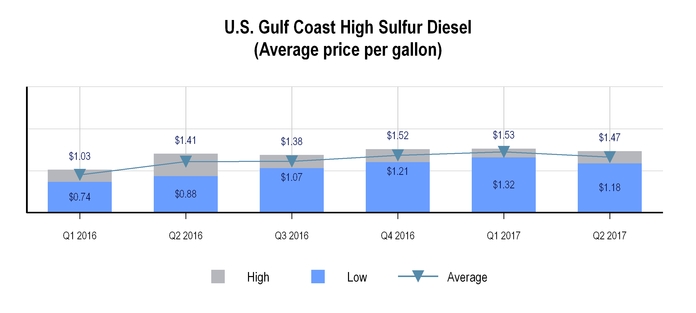
35
Our Tyler and El Dorado refineries both continue to have greater access to Midland WTI and Midland WTI-linked crude feedstocks compared to certain of our competitors. As new pipelines have increased the ability to ship price-advantaged crude oil supplies to and from the mid-continent region, we have experienced a decline in certain crude oil price differentials favorable to us. As these price differentials decrease, so does our competitive advantage created by our access to WTI-linked crude oil. The chart below illustrates the differentials of both Brent crude oil and Midland WTI crude oil as compared to Cushing WTI crude oil for each of the quarterly periods in 2016 and the six months ended June 30, 2017.
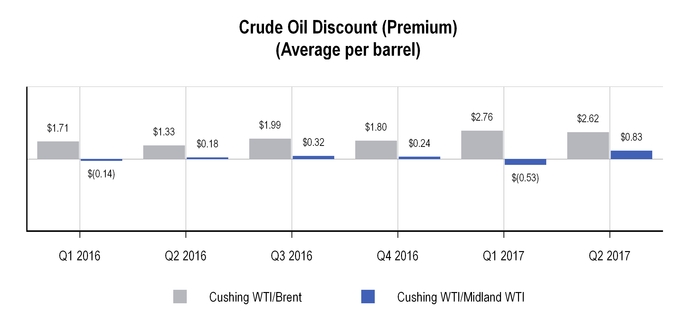
36
Environmental regulations continue to affect our margins in the form of the increasing cost of RINs. On a consolidated basis, we work to balance our RINs obligations in order to minimize the effect of RINs on our results. While we generate RINs in both of our operating segments through our ethanol blending and biodiesel production, our refining segment needs to purchase additional RINs to satisfy its obligations. As a result, increases in the price of RINs generally adversely affect our results of operations. It is not possible at this time to predict with certainty what future volumes or costs may be, but given the increase in required volumes and the volatile price of RINs, the cost of purchasing sufficient RINs could have an adverse impact on our results of operations if we are unable to recover those costs in the price of our refined products. The chart below illustrates the volatile nature of the price for RINs for each of the quarterly periods in 2016 and the six months ended June 30, 2017.
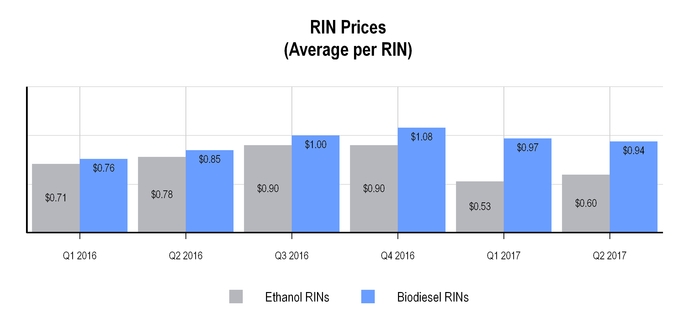
Seasonality
Demand for gasoline and asphalt products is generally lower during the winter months due to seasonal decreases in motor vehicle traffic and road and home construction. Additionally, varying vapor pressure requirements between the summer and winter months tighten summer gasoline supply. As a result, our operating results are generally lower during the first and fourth quarters of the year.
Contractual Obligations
There have been no material changes to our contractual obligations and commercial commitments during the six months ended June 30, 2017, from those disclosed in our Annual Report on Form 10-K, other than the addition of the DKL Notes (as discussed in Note 7 to the financial statements).
Critical Accounting Policies
The preparation of our consolidated financial statements requires us to make estimates and judgments that affect the reported amounts of assets, liabilities, revenues and expenses and related disclosure of contingent assets and liabilities. The SEC has defined critical accounting policies as those that are both most important to the portrayal of our financial condition and results of operations and require our most difficult, complex or subjective judgments or estimates. Based on this definition and as further described in our Annual Report on Form 10-K, we believe our critical accounting policies include the following: (i) determining our inventory using the last-in, first-out valuation method, (ii) evaluating impairment for property, plant and equipment and definite life intangibles, (iii) valuing goodwill and evaluating potential impairment, and (iv) estimating environmental expenditures. For all financial statement periods presented, there have been no material modifications to the application of these critical accounting policies or estimates since our most recently filed Annual Report on Form 10-K.
37
Summary Financial and Other Information
The following table provides summary financial data for Delek (in millions, except share and per share data):
Three Months Ended | Six Months Ended | |||||||||||||||
Statement of Operations Data | June 30, | June 30, | ||||||||||||||
2017 | 2016 | 2017 | 2016 | |||||||||||||
Net sales: | ||||||||||||||||
Refining | $ | 1,153.0 | $ | 1,077.7 | $ | 2,252.5 | $ | 1,905.0 | ||||||||
Logistics | 126.7 | 111.8 | 256.2 | 215.9 | ||||||||||||
Other | (49.0 | ) | (42.2 | ) | (95.9 | ) | (87.5 | ) | ||||||||
Net sales | $ | 1,230.7 | $ | 1,147.3 | $ | 2,412.8 | $ | 2,033.4 | ||||||||
Operating costs and expenses: | ||||||||||||||||
Cost of goods sold | 1,157.8 | 1,025.3 | 2,193.5 | 1,841.1 | ||||||||||||
Operating expenses | 62.1 | 57.8 | 123.3 | 126.8 | ||||||||||||
Insurance proceeds — business interruption | — | — | — | (42.4 | ) | |||||||||||
General and administrative expenses | 27.5 | 23.6 | 54.0 | 52.6 | ||||||||||||
Depreciation and amortization | 29.5 | 29.3 | 58.5 | 57.6 | ||||||||||||
Other operating expense | 0.3 | — | 0.3 | — | ||||||||||||
Total operating costs and expenses | 1,277.2 | 1,136.0 | 2,429.6 | 2,035.7 | ||||||||||||
Operating (loss) income | (46.5 | ) | 11.3 | (16.8 | ) | (2.3 | ) | |||||||||
Interest expense | 14.9 | 13.6 | 28.4 | 26.8 | ||||||||||||
Interest income | (0.8 | ) | (0.4 | ) | (1.8 | ) | (0.7 | ) | ||||||||
(Income) loss from equity method investments | (1.5 | ) | 10.6 | (4.6 | ) | 28.6 | ||||||||||
Other expense (income), net | 0.1 | (0.1 | ) | 0.1 | 0.5 | |||||||||||
Total non-operating expenses, net | 12.7 | 23.7 | 22.1 | 55.2 | ||||||||||||
Loss from continuing operations before income tax benefit | (59.2 | ) | (12.4 | ) | (38.9 | ) | (57.5 | ) | ||||||||
Income tax benefit | (27.0 | ) | (9.9 | ) | (22.0 | ) | (33.5 | ) | ||||||||
Loss from continuing operations | (32.2 | ) | (2.5 | ) | (16.9 | ) | (24.0 | ) | ||||||||
Income (loss) from discontinued operations, net of tax | — | 1.9 | — | (0.5 | ) | |||||||||||
Net loss | (32.2 | ) | (0.6 | ) | (16.9 | ) | (24.5 | ) | ||||||||
Net income attributed to non-controlling interest | 5.7 | 6.4 | 9.8 | 11.7 | ||||||||||||
Net loss attributable to Delek | $ | (37.9 | ) | $ | (7.0 | ) | $ | (26.7 | ) | $ | (36.2 | ) | ||||
Basic earnings per share: | ||||||||||||||||
Loss from continuing operations | $ | (0.61 | ) | $ | (0.14 | ) | $ | (0.43 | ) | $ | (0.58 | ) | ||||
Income (loss) from discontinued operations | — | 0.03 | — | (0.01 | ) | |||||||||||
Total basic loss per share | $ | (0.61 | ) | $ | (0.11 | ) | $ | (0.43 | ) | $ | (0.59 | ) | ||||
Diluted earnings per share: | ||||||||||||||||
Loss from continuing operations | $ | (0.61 | ) | $ | (0.14 | ) | $ | (0.43 | ) | $ | (0.58 | ) | ||||
Income (loss) from discontinued operations | — | 0.03 | — | (0.01 | ) | |||||||||||
Total diluted loss per share | $ | (0.61 | ) | $ | (0.11 | ) | $ | (0.43 | ) | $ | (0.59 | ) | ||||
38
Results of Operations
Consolidated Results of Operations — Comparison of the Three Months Ended June 30, 2017 versus the Three Months Ended June 30, 2016
Net Income (Loss)
Consolidated net loss for the second quarter of 2017 was $37.9 million, or $0.61 per diluted share, compared to net loss of $7.0 million, or $0.11 per basic share, for the second quarter of 2016.
Net Sales
In the second quarters of 2017 and 2016, we generated net sales of $1,230.7 million and $1,147.3 million, respectively, an increase of $83.4 million, or 7.3%. The increase in net sales was primarily due to the effects of increases in the price of finished petroleum products in both of our segments in the second quarter of 2017 compared to the same period in 2016, combined with increases in sales volume at the Tyler refinery and in our west Texas marketing operations, partially offset by a decline in sales volumes at the El Dorado refinery and a decline in fees on our Paline Pipeline System related to a change in the fee structure as compared to the prior year period.
Cost of Goods Sold
Cost of goods sold was $1,157.8 million for the second quarter of 2017 compared to $1,025.3 million for the second quarter of 2016, an increase of $132.5 million, or 12.9%. The increase in cost of goods sold primarily resulted from the increase in the cost of both crude oil feedstocks in the refining segment and refined products in the logistics segment, as well as increased sales volumes at the Tyler refinery.
Operating Expenses
Operating expenses were $62.1 million for the second quarter of 2017 compared to $57.8 million for the second quarter of 2016, an increase of $4.3 million, or 7.4%. The increase in operating expenses was primarily due to an increase in outside services related to certain maintenance initiatives that occurred at the Tyler refinery, combined with increases in labor and utilities costs associated with certain of our pipelines.
General and Administrative Expenses
General and administrative expenses were $27.5 million and $23.6 million for the second quarter of 2017 and 2016, respectively, an increase of $3.9 million, or 16.5%. The increase was primarily due to merger related expenses incurred associated with the Delek/Alon merger that were not incurred during the same period of 2016, combined with an increase in benefits expense compared to 2016 where the second quarter of 2016 included a reversal of previously accrued bonuses.
Depreciation and Amortization
Depreciation and amortization was $29.5 million for the second quarter of 2017 compared to $29.3 million for the second quarter of 2016, an increase of $0.2 million, or 0.7%. The increase in depreciation expense was primarily attributable to capital expenditures and acquisitions completed to date in 2017.
Interest Expense
Interest expense was $14.9 million for the second quarter of 2017 compared to $13.6 million for the second quarter of 2016, an increase of $1.3 million, or 9.6%. The increase was primarily attributable to increases in the weighted average interest rate under our credit facilities, partially offset by a decrease in average amounts outstanding, compared to the same period in 2016.
Results from Equity Method Investments
During the second quarter of 2017, we recognized income from equity method investments of $1.5 million, compared to a loss of $10.6 million for the second quarter of 2016. Results from equity method investments for the second quarters of 2017 and 2016 were primarily attributable to our proportionate share of the net income (loss) from our investment in Alon USA of $1.0 million and $(9.7) million, respectively, and $(0.6) million in amortization of the excess of our investment over our equity in the underlying net assets of Alon USA during each of the second quarters of 2017 and 2016.
Income Taxes
Under ASC 740, Income Taxes (“ASC 740”), companies are required to apply an estimated annual tax rate to interim period results on a year-to-date basis; however, the estimated annual tax rate should not be applied to interim financial results if a reliable estimate cannot be made. In this situation, the interim tax rate should be based on actual year-to-date results. Based on our current projections, which have fluctuated as a result of changes in crude oil prices and the related crack spreads, we believe that using actual year-to-date results to compute our effective tax rate will produce a more reliable estimate of our tax expense or benefit. As such, we recorded a tax provision for the three and six months ended June 30, 2017 and 2016 based on actual year-to-date results, in accordance with ASC 740.
Income tax benefit was $27.0 million for the second quarter of 2017, compared to benefit of $9.9 million for the second quarter of 2016, an increase in benefit of $17.1 million. The increase in benefit was primarily attributable to a pre-tax loss of $59.2 million in the second quarter of 2017, as compared to pre-tax loss of $12.4 million for the second quarter of 2016. Our effective tax rate was 45.6% for the second quarter of 2017, compared to 79.8% for the second quarter of 2016. The decrease in our effective tax rate in the three months ended June 30, 2017 was primarily due to the expiration of provisions for certain tax credits and incentives that expired as of December 31, 2016 and have not been extended by Congress.
39
Consolidated Results of Operations — Comparison of the Six Months Ended June 30, 2017 versus the Six Months Ended June 30, 2016
Net (Loss) Income
Consolidated net loss for the six months ended June 30, 2017 was $26.7 million, or $0.43 per basic share, compared to net loss of $36.2 million, or $0.59 per basic share, for the six months ended June 30, 2016.
Net Sales
For the six months ended June 30, 2017 and 2016, we generated net sales of $2,412.8 million and $2,033.4 million, respectively, an increase of $379.4 million, or 18.7%. The increase in net sales was primarily due to the effects of increases in the price of finished petroleum products in both operating segments in the six months ended June 30, 2017, compared to the same period in 2016, partially offset by a decline in fees on our Paline Pipeline System. related to a change in the fee structure as compared to 2016.
Cost of Goods Sold
Cost of goods sold was $2,193.5 million for the six months ended June 30, 2017, compared to $1,841.1 million for the six months ended June 30, 2016, an increase of $352.4 million, or 19.1%. The increase in cost of goods sold primarily resulted from the increase in the cost of both crude oil feedstocks in the refining segment and refined products in the logistics segment, partially offset by the $47.5 million reduction in RINs expense associated with the RINs waiver received by the El Dorado refinery in the first quarter of 2017.
Operating Expenses
Operating expenses were $123.3 million for the six months ended June 30, 2017 compared to $126.8 million for the six months ended June 30, 2016, a decrease of $3.5 million, or 2.8%. The decrease in operating expenses was primarily due to decreases in workers compensation expense as well as tank cleaning and oil spill remediation expenses in the refining segment, partially offset by an increase in labor and utilities expenses associated with increased usage of certain of our pipelines and increased maintenance expenses in the logistics segment.
General and Administrative Expenses
General and administrative expenses were $54.0 million and $52.6 million for the six months ended June 30, 2017 and 2016, respectively, an increase of $1.4 million, or 2.7%. The increase was primarily due to merger related expenses incurred associated with the Delek/Alon merger for the six months ended June 30, 2017 that were not incurred during the same period of 2016, combined with an increase in benefits expense for the six months ended June 30, 2017, compared to 2016, partially offset by a decrease in consulting expenses related to management consulting costs that were incurred in 2016 but not in 2017.
Depreciation and Amortization
Depreciation and amortization was $58.5 million compared to $57.6 million for the the six months ended June 30, 2017 and 2016, respectively, an increase of $0.9 million, or 1.6%. The increase in depreciation expense was primarily attributable to capital expenditures and acquisitions completed to date in 2017.
Interest Expense
Interest expense was $28.4 million compared to $26.8 million for the six months ended June 30, 2017 and 2016, respectively, an increase of $1.6 million, or 6.0%. The increase was primarily attributable to increases in the weighted average interest rate under our credit facilities, partially offset by a decrease in average amounts outstanding, compared to the same period in 2016.
Results from Equity Method Investments
During the six months ended June 30, 2017, we recognized income from equity method investments of $4.6 million, compared to loss of $28.6 million for the six months ended June 30, 2016. Results from equity method investments for the six months ended June 30, 2017 and 2016 are primarily attributable to our proportionate share of the net income (loss) from our investment in Alon USA of $4.5 million and $(26.8) million, respectively, and $(1.3) million and $(1.4) million in amortization of the excess of our investment over our equity in the underlying net assets of Alon USA.
Income Taxes
Under ASC 740, Income Taxes (“ASC 740”), companies are required to apply an estimated annual tax rate to interim period results on a year-to-date basis; however, the estimated annual tax rate should not be applied to interim financial results if a reliable estimate cannot be made. In this situation, the interim tax rate should be based on actual year-to-date results. Based on our current projections, which have fluctuated as a result of changes in oil prices and related crack spread, we believe that using actual year-to-date results to compute our effective tax rate will produce a more reliable estimate of our tax expense for the six months ended June 30, 2017. As such, in contrast with our previous methods of recording income tax expense, we recorded a tax provision for the six months ended June 30, 2017 based on actual year-to-date results, in accordance with ASC 740.
Income tax benefit was $22.0 million for the six months ended June 30, 2017, compared to income tax benefit of $33.5 million for the six months ended June 30, 2016, a decrease in benefit of $11.5 million. The decrease in benefit was primarily attributable to a pre-tax loss of $38.9 million compared to pre-tax loss of $57.5 million for the six months ended June 30, 2017 and 2016, respectively. Our effective tax rate was 56.6% compared to 58.3% for the for the six months ended June 30, 2017 and 2016, respectively. The decrease in our effective tax rate was primarily due to the expiration of certain tax credits and incentives that expired as of December 31, 2016 and have not been extended by Congress.
40
Operating Segments
We report operating results in two reportable segments: refining and logistics. Decisions concerning the allocation of resources and assessment of operating performance are made based on this segmentation. Management measures the operating performance of each of its reportable segments based on the segment contribution margin.
Refining Segment
The tables and charts below set forth certain information concerning our refining segment operations ($ in millions, except per barrel amounts):
Three Months Ended June 30, | Six Months Ended June 30, | |||||||||||||||
2017 | 2016 | 2017 | 2016 | |||||||||||||
Net sales | $ | 1,153.0 | $ | 1,077.7 | $ | 2,252.5 | $ | 1,905.0 | ||||||||
Cost of goods sold | 1,115.4 | 988.1 | 2,099.7 | 1,776.0 | ||||||||||||
Gross margin | 37.6 | 89.6 | 152.8 | 129.0 | ||||||||||||
Operating expenses | 51.6 | 49.6 | 102.4 | 107.9 | ||||||||||||
Insurance proceeds — business interruption | — | — | — | (42.4 | ) | |||||||||||
Contribution margin | $ | (14.0 | ) | $ | 40.0 | $ | 50.4 | $ | 63.5 | |||||||
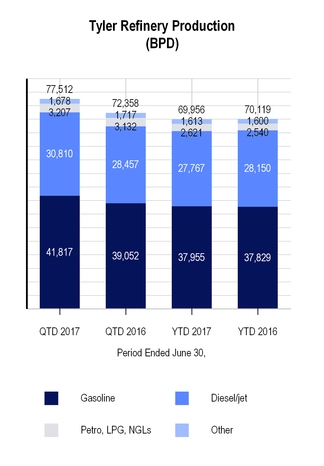
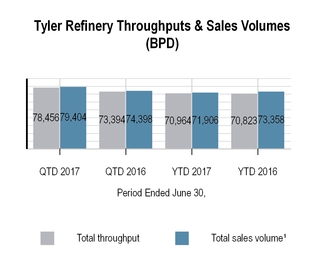 _____________________________
1 | Total sales volume includes 743 and 842 bpd sold to the logistics segment during the three and six months ended June 30, 2017, respectively, and 785 and 1,070 bpd during the three and six months ended June 30, 2016, respectively. Total sales volume also includes sales of 1 and 5 bpd of intermediate and finished products to the El Dorado refinery during the three and six months ended June 30, 2017, respectively, and 797 and 516 bpd during the three and six months ended June 30, 2016, respectively. Total sales volume excludes 4,177 and 5,297 bpd of wholesale activity |
41
during the three and six months ended June 30, 2017, respectively, and 740 and 371 during the three and six months ended June 30, 2016, respectively.
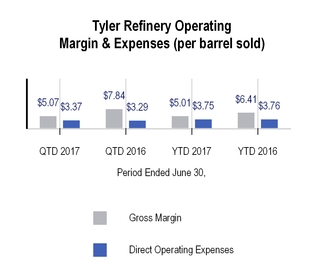
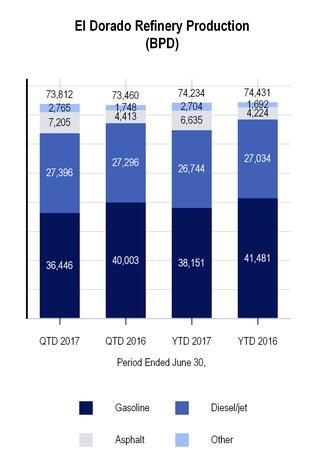
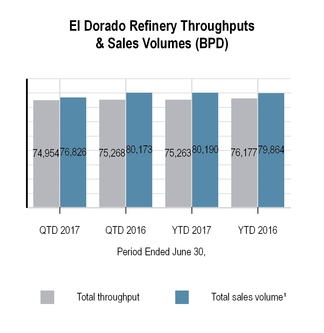
_____________________________
1 | Total sales volume includes 525 and 787 bpd of produced finished product sold to the Tyler refinery during the three and six months ended June 30, 2017, respectively. There were no produced finished products sold to the Tyler refinery during the three and six months ended June 30, 2016. Total sales volume excludes 19,219 and 18,880 bpd of wholesale activity during the three and six months ended June 30, 2017, respectively, and 20,450 and 22,585 bpd during the three and six months ended June 30, 2016, respectively. |
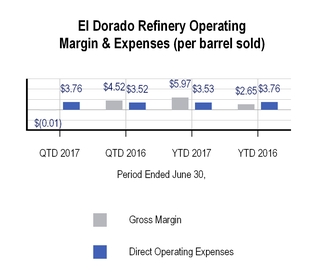
42
Refining Segment Operational Comparison of the Three Months Ended June 30, 2017 versus the Three Months Ended June 30, 2016
Net Sales
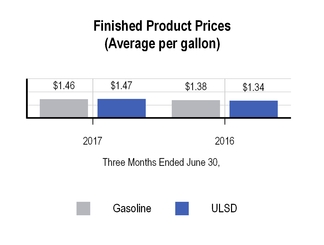
Net sales for the refining segment were $1,153.0 million for the second quarter of 2017 compared to $1,077.7 million for the second quarter of 2016, an increase of $75.3 million, or 7.0%. The increase in net sales primarily resulted from an increase in sales volume at the Tyler refinery and increases in the price of U.S. Gulf Coast gasoline and Ultra-Low-Sulfur diesel ("ULSD") in the second quarter of 2017 as compared to the second quarter of 2016, partially offset by a decline in sales volumes at the El Dorado refinery, primarily resulting from a reduction in gasoline production in the second quarter of 2017.
Cost of Goods Sold
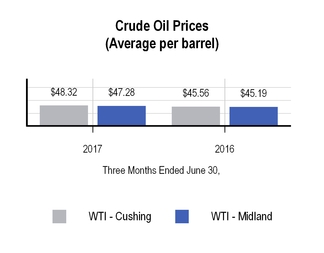
Cost of goods sold for the second quarter of 2017 for the refining segment was $1,115.4 million compared to $988.1 million for the second quarter of 2016, an increase of $127.3 million, or 12.9%. This increase was primarily attributable to an increase in the cost of WTI - Midland crude oil, from an average of $45.19 per barrel in the second quarter of 2016 to an average of $47.28 in the second
quarter of 2017, and an increase in sales volumes at the Tyler refinery in the second quarter of 2017.
Our refining segment has multiple service agreements with our logistics segment which, among other things, require the refining segment to pay terminalling and storage fees based on the throughput volume of crude and finished product in the logistics segment pipelines and the volume of crude and finished product stored in the logistics segment storage tanks. These fees were $33.1 million and $30.7 million during the second quarters of 2017 and 2016, respectively. We eliminate these intercompany fees in consolidation.
Operating Expenses
Operating expenses for the refining segment were $51.6 million for the second quarter of 2017 compared to $49.6 million for the second quarter of 2016, an increase of $2.0 million, or 4.0%. The increase in operating expenses was primarily due to an increase in outside services related to certain maintenance initiatives that occurred at the Tyler refinery in the second quarter of 2017.
Contribution Margin
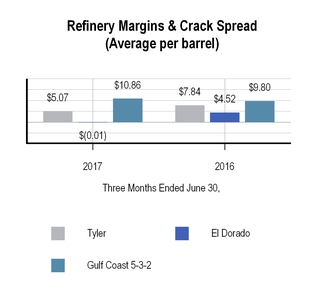
Contribution margin for the refining segment decreased to $(14.0) million, or (129.6)% of our consolidated segment contribution margin, in the second quarter of 2017, compared to $40.0 million, or 62.3% of our consolidated segment contribution margin, in the second quarter of 2016. The refining segment contribution margin decrease was primarily attributable to a decrease in gross margin at the El Dorado refinery and an increase in operating expenses at both refineries. The gross margin at the El Dorado refinery was negatively impacted by a $30.2 million loss on hedging activities in the second quarter of 2017, compared to a loss of $9.5 million in the second quarter of 2016.
43
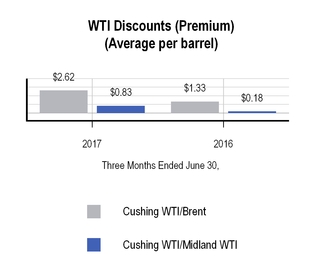
Margins at both refineries were negatively impacted by losses on derivative activities in the refining segment of $29.5 million in the second quarter of 2017, compared to losses of $17.4 million in the second quarter of 2016, inventory losses of $14.0 million in the second quarter of 2017, compared to benefits of $12.9 million in the second quarter of 2016, primarily resulting from lower of cost or market adjustments in both periods, and a contango futures market which lowered crude purchase prices by $0.54 per barrel in the second quarter of 2017, compared to $1.43 per barrel in the second quarter of 2016. These negative factors were partially offset by a 10.8% increase in the average Gulf Coast 5-3-2 crack spread in the second quarter of 2017, as compared to the second quarter of 2016, lower RINs expenses in the second quarter of 2017 as compared to the second quarter of 2016 and by an increase in the discount between WTI Midland crude oil and WTI Cushing crude oil to $0.83 in the second quarter of 2017 compared to $0.18 in the second quarter of 2016.
Refining Segment Operational Comparison of the Six Months Ended June 30, 2017 versus the Six Months Ended June 30, 2016
Net Sales
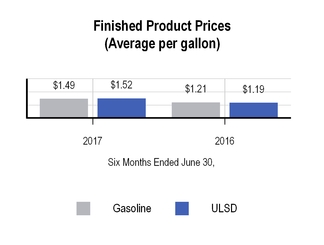
Net sales for the refining segment were $2,252.5 million for the six months ended June 30, 2017 compared to $1,905.0 million for the six months ended June 30, 2016, an increase of $347.5 million, or 18.2%. The increase in net sales resulted from an increase in the price of both U.S. Gulf Coast gasoline and ULSD in the six months ended June 30, 2017 as compared to the six months ended June 30, 2016.
Cost of Goods Sold
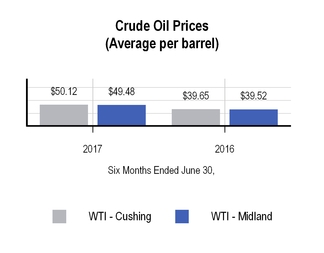
Cost of goods sold for the refining segment for the six months ended June 30, 2017 was $2,099.7 million, compared to $1,776.0 million for the six months ended June 30, 2016, an increase of $323.7 million, or 18.2%. This increase was primarily attributable to an increase in the cost of WTI - Midland crude oil, from an average of $39.52 per barrel for the six months ended June 30, 2016 to an average of $49.48 for the six months ended June 30, 2017. These increases were partially offset by the $47.5 million reduction in RINs expense associated with the RINs waiver received by the El Dorado refinery in the first quarter of 2017.
Our refining segment has multiple service agreements with our logistics segment which, among other things, require the refining segment to pay terminalling and storage fees based on the throughput volume of crude and finished product in the logistics segment pipelines and the volume of crude and finished product stored in the logistics segment storage tanks. These fees were $64.3 million and $61.7 million during the six months ended June 30, 2017 and 2016, respectively. We eliminate these intercompany fees in consolidation.
Operating Expenses
Operating expenses for the refining segment were $102.4 million for the six months ended June 30, 2017 compared to $107.9 million for the six months ended June 30, 2016, a decrease of $5.5 million, or 5.1%. The decrease in operating expenses was primarily due to a decrease in workers compensation expense and the absence of outside services related to tank cleaning and oil spill remediation that occurred in the first quarter of 2016.
44
Contribution Margin
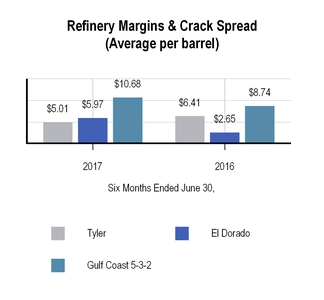
Contribution margin for the refining segment decreased to $50.4 million, or 52.5% of our consolidated segment contribution margin, in the six months ended June 30, 2017, compared to $63.5 million, or 58.9% of our consolidated segment contribution margin, in the six months ended June 30, 2016. The refining segment contribution margin decrease was primarily attributable to a decline in operating margins at both refineries, which were negatively impacted by inventory losses of $11.2 million in the six months ended June 30, 2017, compared to $1.4 million in the six months ended June 30, 2016, primarily resulting from lower of cost or market adjustments in both periods, and by business interruption insurance proceeds of $42.4 million associated with a settlement of litigation received in the first quarter of 2016. This decrease was partially offset by a reduction in RINs expense, primarily associated with the $47.5 million reduction in RINs expense associated with the RINs waiver received by the El Dorado refinery in the first quarter of 2017.
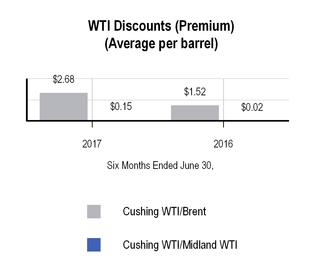
Margins at both refineries were positively impacted by the 22.2% increase in the Gulf Coast 5-3-2 crack spread in the six months ended June 30, 2017, as compared to the six months ended June 30, 2016. Offsetting the increase in margins were losses on derivative positions of $30.3 million for the six months ended June 30, 2017, compared to losses of $25.0 million for the six months ended June 30, 2016, higher net inventory valuation losses during the the six months ended June 30, 2017, as compared to the six months ended June 30, 2016 and a contango futures market in both the six months ended June 30, 2017, which lowered crude purchase prices by $0.77 per barrel in the six months ended June 30, 2017, compared to $1.62 per barrel during the six months ended June 30, 2016.
45
Logistics Segment
The table below sets forth certain information concerning our logistics segment operations ($ in millions, except per barrel amounts):
Three Months Ended June 30, | Six Months Ended June 30, | |||||||||||||||
2017 | 2016 | 2017 | 2016 | |||||||||||||
Logistics Segment Contribution: | ||||||||||||||||
Net sales | $ | 126.7 | $ | 111.8 | $ | 256.2 | $ | 215.9 | ||||||||
Cost of goods sold | 85.0 | 73.1 | 177.6 | 139.9 | ||||||||||||
Gross margin | 41.7 | 38.7 | 78.6 | 76.0 | ||||||||||||
Operating expenses | 10.0 | 8.7 | 20.3 | 19.2 | ||||||||||||
Contribution margin | $ | 31.7 | $ | 30.0 | $ | 58.3 | $ | 56.8 | ||||||||
Operating Information: | ||||||||||||||||
East Texas - Tyler Refinery sales volumes (average bpd) (1) | 77,878 | 70,188 | 70,677 | 68,301 | ||||||||||||
West Texas wholesale marketing throughputs (average bpd) | 13,422 | 12,594 | 13,942 | 13,482 | ||||||||||||
West Texas wholesale marketing margin per barrel | $ | 4.26 | $ | 2.13 | $ | 3.44 | $ | 1.00 | ||||||||
Terminalling throughputs (average bpd) (2) | 128,111 | 126,476 | 122,026 | 122,645 | ||||||||||||
Throughputs (average bpd) | ||||||||||||||||
Lion Pipeline System: | ||||||||||||||||
Crude pipelines (non-gathered) | 59,953 | 56,302 | 59,351 | 56,322 | ||||||||||||
Refined products pipelines to Enterprise Systems | 49,820 | 53,670 | 50,583 | 53,725 | ||||||||||||
SALA Gathering System | 15,957 | 18,288 | 16,242 | 18,645 | ||||||||||||
East Texas Crude Logistics System | 13,591 | 12,909 | 14,876 | 11,127 | ||||||||||||
El Dorado Rail Offloading Rack | — | — | — | — | ||||||||||||
_____________________________
(1) | Excludes jet fuel and petroleum coke. |
(2) | Consists of terminalling throughputs at our Tyler, Big Sandy and Mount Pleasant, Texas, El Dorado and North Little Rock, Arkansas, and Memphis and Nashville, Tennessee terminals. |
Logistics Segment Operational Comparison of the Three Months Ended June 30, 2017 versus the Three Months Ended June 30, 2016
Net Sales
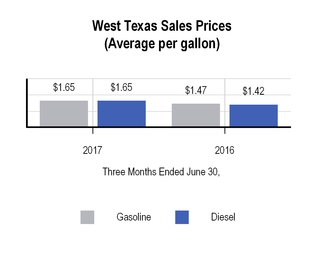
Net sales for the logistics segment were $126.7 million in the second quarter of 2017, compared to $111.8 million for the second quarter of 2016, an increase of $14.9 million, or 13.3%. The increase was primarily attributable to increases in the average sales prices per gallon of gasoline and diesel and in volumes sold in our west Texas marketing operations. The average sales prices per gallon of gasoline and diesel sold increased $0.18 per gallon and $0.23 per gallon, respectively, during the second quarter of 2017 compared to the second quarter of 2016. The net increase of gasoline and diesel volumes sold was 3.3 million gallons. Partially offsetting the increase was a decline in fees on our Paline Pipeline System relative to the prior year period. During the second quarter of 2017, the Paline Pipeline System was a FERC regulated pipeline with a tariff established for potential shippers, compared to the second quarter of 2016, when the pipeline capacity was under contract with two third parties for a monthly fee.
Net sales included $5.3 million and $4.2 million of net service fees paid by our refining segment to our logistics segment during the second quarter of 2017 and 2016, respectively. These service fees are based on the number of gallons sold and a shared portion of the margin achieved in return for providing sales and customer support services. Net sales also included crude and refined product transportation, terminalling and storage fees paid by our refining segment to our logistics segment. These fees were $33.1 million and $30.7 million in the second quarter of 2017 and 2016, respectively. The logistics segment also sold $1.2 million and $1.4 million of RINs to the refining segment in the second quarter of 2017 and 2016, respectively. These intercompany sales and fees are eliminated in consolidation.
46
Cost of Goods Sold
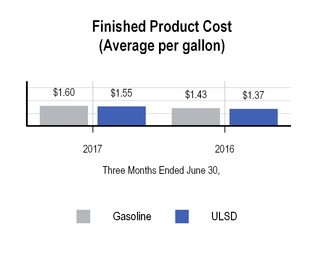
Cost of goods sold for the logistics segment increased $11.9 million, or 16.3%, to $85.0 million in the second quarter of 2017, compared to $73.1 million in the second quarter of 2016. The increase in cost of goods sold was primarily attributable to increases in the average cost per gallon of gasoline and diesel and in volumes purchased in our west Texas marketing operations. The average cost per gallon of gasoline and diesel purchased increased $0.17 per gallon and $0.18 per gallon, respectively, during the second quarter of 2017 compared to the second quarter of 2016. The net increase of gasoline and diesel volumes sold was 3.3 million gallons.
Operating Expenses
Operating expenses for the logistics segment were approximately $10.0 million and $8.7 million for the second quarter of 2017 and 2016, respectively, an increase of $1.3 million, or 14.9%. The increase in operating expenses was primarily due to increases in labor and utilities costs associated with certain of our pipelines as a result of increased usage due to additional customers using our pipeline assets.
Contribution Margin
Contribution margin for the logistics segment increased to $31.7 million, or 293.5% of our consolidated segment contribution margin, in the second quarter of 2017, compared to $30.0 million, or 46.7% of our consolidated segment contribution margin, in the second quarter of 2016. The increase in contribution margin was primarily attributable to improved contribution margin in our west Texas operations as a result of increased drilling activity in the region, which has improved market conditions and increased demand. Also contributing to the increase were higher fees associated with our marketing agreement with Delek as a result of increased throughput. These increases were partially offset by a decline in fees on our Paline Pipeline System as described above.
Logistics Segment Operational Comparison of the Six Months Ended June 30, 2017 versus the Six Months Ended June 30, 2016
Net Sales
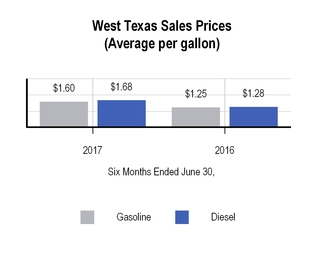
Net sales for the logistics segment were $256.2 million during the six months ended June 30, 2017, compared to $215.9 million during the six months ended June 30, 2016, an increase of $40.3 million, or 18.7%. The increase was primarily attributable to increases in the average sales prices per gallon of gasoline and diesel and in volumes sold in our west Texas marketing operations. The average sales prices per gallon of gasoline and diesel increased $0.35 per gallon and $0.40 per gallon, respectively, during the six months ended June 30, 2017 compared to the six months ended June 30, 2016. Gallons of gasoline and diesel sold in west Texas increased 2.7 million gallons and 0.9 million gallons, respectively, during the six months ended June 30, 2017 compared to the six months ended June 30, 2016. Partially offsetting the increase was a decline in fees on our Paline Pipeline System. During the six months ended June 30, 2017, the Paline Pipeline System was a FERC regulated pipeline with a tariff established for potential shippers, compared to the six months ended June 30, 2016, when the pipeline capacity was under contract with two third parties for a monthly fee.
Net sales included $9.6 million and $8.1 million of net service fees paid by our refining segment to our logistics segment during the six months ended June 30, 2017 and 2016, respectively. These service fees are based on the number of gallons sold and a shared portion of the margin achieved in return for providing sales and customer support services. Net sales also included crude and refined product transportation, terminalling and storage fees paid by our refining segment to our logistics segment. These fees were $64.3 million and $61.7 million in the six months ended June 30, 2017 and 2016, respectively. The logistics segment also sold $2.3 million and $2.9 million of RINs to the refining segment in the six months ended June 30, 2017 and 2016, respectively. These intercompany sales and fees are eliminated in consolidation.
47
Cost of Goods Sold
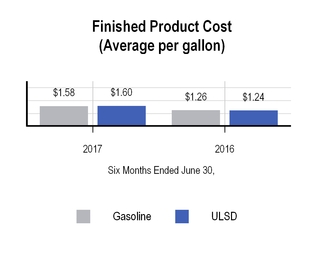
Cost of goods sold for the logistics segment increased $37.7 million, or 26.9%, to $177.6 million in the six months ended June 30, 2017, compared to $139.9 million in the six months ended June 30, 2016. The increase in cost of goods sold was primarily attributable to increases in the average cost per gallon of gasoline and diesel and in volumes purchased in our west Texas marketing operations. The average cost per gallon of gasoline and diesel purchased increased $0.32 per gallon and $0.36 per gallon, respectively, during the six months ended June 30, 2017, compared to the six months ended June 30, 2016. Gallons of gasoline and diesel purchased in west Texas increased 2.7 million gallons and 0.9 million gallons, respectively, during the six months ended June 30, 2017 compared to the six months ended June 30, 2016.
Operating Expenses
Operating expenses for the logistics segment were $20.3 million and $19.2 million for the six months ended June 30, 2017 and 2016, respectively, an increase of $1.1 million, or 5.7%. The increase in operating expenses was primarily due to increases in labor and utilities costs associated with certain of our pipelines as a result of increased usage and higher maintenance costs associated with certain of our tanks at our tank farms. Partially offsetting these increases were a reduction in operating expenses for one of our terminal locations at which we incurred costs related to internal tank contamination during the six months ended June 30, 2016 and decreases in maintenance costs at our Memphis Terminal.
Contribution Margin
Contribution margin for the logistics segment increased to $58.3 million, or 60.7% of our consolidated segment contribution margin, for the six months ended June 30, 2017, compared to $56.8 million, or 52.6% of our consolidated segment contribution margin, for the six months ended June 30, 2016. The increase in contribution margin was primarily attributable to improved contribution margin in our west Texas operations as a result of increased drilling activity in the region, which has improved market conditions and increased demand. Also contributing to the increase were increased fees associated with our marketing agreement with Delek as a result of
increased throughput, volume increases at our Nashville and Tyler Terminals and a reduction in operating expenses at our Memphis and El Dorado Terminals. Partially offsetting these increases was a decline in fees on our Paline Pipeline System as described above.
Liquidity and Capital Resources
Our primary sources of liquidity are cash generated from our operating activities and borrowings under our debt facilities. We believe that our cash flows from operations and borrowings under our current or new debt agreements will be sufficient to satisfy the anticipated cash requirements associated with our existing operations and capital expenditures for at least the next 12 months.
Cash Flows
The following table sets forth a summary of our consolidated cash flows for the six months ended June 30, 2017 and 2016 (in millions):
Six Months Ended June 30, | ||||||||
2017 | 2016 | |||||||
Cash Flow Data: | ||||||||
Operating activities | $ | (36.3 | ) | $ | 156.6 | |||
Investing activities | (42.7 | ) | (59.4 | ) | ||||
Financing activities | (37.9 | ) | (22.3 | ) | ||||
Net (decrease) increase | $ | (116.9 | ) | $ | 74.9 | |||
Cash Flows from Operating Activities
Net cash used in operating activities was $36.3 million for the six months ended June 30, 2017, compared to cash provided of $156.6 million for the comparable period of 2016. The decrease in cash flows from operations was primarily due to a decrease in accounts payable and other current liabilities in the first six months of 2017, as compared to the first six months of 2016. Further contributing to the decrease were increases in accounts receivable and inventory and other current assets due to an increase in line space inventory purchases in the refining segment and an increase in sales in the logistics segment. Partially offsetting the decrease was net loss for the six months ended June 30, 2017 of $16.9 million, compared to net loss of $24.5 million in the same period of 2016. The net loss for the six months ended June 30, 2016 included $42.4 million of business interruption proceeds associated with a litigation settlement. The total litigation settlement received was approximately $49.0 million, of which a total of $6.8 million was recognized as a reduction in general and administrative expenses in the fourth quarter of 2015 and the first quarter of 2016, related to legal expenses incurred as part of the litigation. Additionally, the disposed retail segment provided $13.3 million of cash flows from operations in 2016 that was not recurring in 2017.
48
Cash Flows from Investing Activities
Net cash used in investing activities was $42.7 million for the first six months of 2017, compared to $59.4 million in the comparable period of 2016. The decrease in cash used in investing activities was primarily due to decreased equity method investment contributions in 2017 as compared to the first six months of 2016, partially offset by an increase in our capital expenditures in the six months ended June 30, 2017, as compared to the same period in 2016. Additionally, the disposed retail segment used $7.1 million of cash flows from investing activities in 2016 that was not recurring in 2017.
Cash used in investing activities includes the cash portion of our capital expenditures, which was $35.0 million and $18.7 million for the six months ended June 30, 2017 and 2016, respectively.
Cash Flows from Financing Activities
Net cash used in financing activities was $37.9 million for the six months ended June 30, 2017, compared to cash used of $22.3 million in the comparable 2016 period. The increase in net cash used in financing activities was primarily attributable to net repayments under our revolving credit facilities of $193.1 million in the six months ended June 30, 2017 compared to net borrowings $10.9 million in the comparable period of 2016, partially offset by net borrowings under our term loans of $187.7 million during the six months ended June 30, 2017 compared to net repayments of $35.3 million in the comparable 2016 period, and was also impacted by $15.0 million of net proceeds from product financing agreements in the six months ended June 30, 2017 compared to proceeds of $50.4 million in the six months ended June 30, 2016. Additionally, the disposed retail segment used $10.6 million of cash flows from financing activities in 2016 that was not recurring in 2017.
Cash Position and Indebtedness
As of June 30, 2017, our total cash and cash equivalents were $572.3 million and we had total indebtedness of approximately $822.5 million. Total unused credit commitments or borrowing base availability, as applicable, under our three separate revolving credit facilities was approximately $684.0 million and we had letters of credit issued of approximately $110.0 million. We believe we were in compliance with our covenants in all debt facilities as of June 30, 2017. See Note 7 of the condensed consolidated financial statements in Item 1, Financial Statements, for additional information about our three separate revolving credit facilities.
Capital Spending
A key component of our long-term strategy is our capital expenditure program. Our capital expenditures for the six months ended June 30, 2017 were $30.2 million, of which approximately $22.0 million was spent in our refining segment, $4.9 million in our logistics segment and $3.3 million at the holding company level. The following table summarizes our actual capital expenditures for the six months ended June 30, 2017 and planned capital expenditures for Old Delek and its subsidiaries (excluding Alon USA and its subsidiaries) for the full year 2017 by operating segment and major category (in millions):
Full Year 2017 Forecast | Six Months Ended June 30, 2017 | |||||||
Refining: | ||||||||
Sustaining maintenance, including turnaround activities | $ | 42.8 | $ | 16.8 | ||||
Regulatory | 12.8 | 1.1 | ||||||
Discretionary projects | 7.4 | 4.1 | ||||||
Refining segment total | 63.0 | 22.0 | ||||||
Logistics: | ||||||||
Regulatory | 5.2 | 0.3 | ||||||
Sustaining maintenance | 8.8 | 3.1 | ||||||
Discretionary projects | 7.1 | 1.5 | ||||||
Logistics segment total | 21.1 | 4.9 | ||||||
Other: | ||||||||
Regulatory | 1.2 | 0.1 | ||||||
Sustaining maintenance | 0.2 | 0.1 | ||||||
Growth/profit improvements | 9.5 | 3.1 | ||||||
Other total | 10.9 | 3.3 | ||||||
Total capital spending | $ | 95.0 | $ | 30.2 | ||||
Additionally, the forecasted capital expenditures for the remainder of 2017 related to Alon USA and its subsidiaries are expected to be approximately $74.5 million.
The amount of our capital expenditure budget is subject to change due to unanticipated increases in the cost, scope and completion time for our capital projects. For example, we may experience increases in the cost of and/or timing to obtain necessary equipment required for our continued compliance with government regulations or to complete improvement projects or scheduled maintenance activities. Additionally, the scope and cost of employee or contractor labor expense related to installation of that equipment could exceed our projections. Our capital expenditure budget may also be revised as management continues to evaluate projects for reliability or profitability.
Off-Balance Sheet Arrangements
We have no off-balance sheet arrangements through the date of the filing of this Quarterly Report on Form 10-Q.
49
ITEM 3. QUANTITATIVE AND QUALITATIVE DISCLOSURES ABOUT MARKET RISK
These disclosures should be read in conjunction with the condensed consolidated financial statements, "Management's Discussion and Analysis of Financial Condition and Results of Operations," and other information presented herein as well as in the "Quantitative and Qualitative Disclosures About Market Risk" section contained in our Annual Report on Form 10-K.
Price Risk Management Activities. At times, we enter into commodity derivative contracts to manage our price exposure to our inventory positions, future purchases of crude oil and ethanol, future sales of refined products or to fix margins on future production. We also enter into future commitments to purchase or sell RINs at fixed prices and quantities, which are used to manage the costs associated with our RINs obligations. These future RIN commitments meet the definition of derivative instruments under ASC 815, Derivatives and Hedging ("ASC 815"). In accordance with ASC 815, all of these commodity contracts and future purchase commitments are recorded at fair value, and any change in fair value between periods has historically been recorded in the profit and loss section of our condensed consolidated financial statements. Occasionally, at inception, the company will elect to designate the commodity derivative contracts as cash flow hedges under ASC 815. Gains or losses on commodity derivative contracts accounted for as cash flow hedges are recognized in other comprehensive income on the condensed consolidated balance sheets and ultimately, when the forecasted transactions are completed in net sales or cost of goods sold in the condensed consolidated statements of income.
The following table sets forth information relating to our open commodity derivative contracts as of June 30, 2017 ($ in millions).
Total Outstanding | Notional Contract Volume by Year of Maturity | |||||||||||||||
Contract Description | Fair Value | Notional Contract Volume | 2017 | 2018 | 2019 | |||||||||||
Contracts not designated as hedging instruments: | ||||||||||||||||
Crude oil price swaps - long(1) | $ | 1.6 | 3,214,000 | 1,714,000 | 1,500,000 | — | ||||||||||
Crude oil price swaps - short(1) | (2.8 | ) | 2,824,000 | 1,564,000 | 1,260,000 | — | ||||||||||
Inventory, refined product and crack spread swaps - long(1) | (4.4 | ) | 10,027,311 | 8,617,311 | 1,410,000 | — | ||||||||||
Inventory, refined product and crack spread swaps - short(1) | 11.7 | 8,204,590 | 6,569,590 | 1,635,000 | — | |||||||||||
RIN commitment contracts - long(2) | 4.2 | 52,050,000 | 52,050,000 | — | — | |||||||||||
RIN commitment contracts - short(2) | (6.4 | ) | 44,200,000 | 44,200,000 | — | — | ||||||||||
Total | $ | 3.9 | 120,519,901 | 114,714,901 | 5,805,000 | — | ||||||||||
Contracts designated as cash flow hedging instruments: | ||||||||||||||||
Crude oil price swaps - long(1) | $ | (26.8 | ) | 1,150,000 | — | 1,150,000 | — | |||||||||
Total | $ | (26.8 | ) | 1,150,000 | — | 1,150,000 | — | |||||||||
(1)Volume in barrels
(2)Volume in RINs
ITEM 4. CONTROLS AND PROCEDURES
(a) Evaluation of Disclosure Controls and Procedures
Our management has evaluated, with the participation of our principal executive and principal financial officers, the effectiveness of our disclosure controls and procedures (as defined in Rule 13a-15(e) or Rule 15d-15(e) under the Exchange Act) as of the end of the period covered by this report, and has, based on this evaluation, concluded that our disclosure controls and procedures are effective to provide reasonable assurance that information required to be disclosed by us in the reports that we file or submit under the Exchange Act is recorded, processed, summarized and reported within the time periods specified in the SEC's rules and forms including, without limitation, controls and procedures designed to ensure that information required to be disclosed by us in the reports that we file or submit under the Exchange Act is accumulated
50
and communicated to our management, including our principal executive and principal financial officers, as appropriate to allow timely decisions regarding required disclosures.
(b) Changes in Internal Control over Financial Reporting
There has been no change in our internal control over financial reporting (as defined in Rule 13a-15(f) and 15d-15(f) under the Exchange Act) that occurred during our last fiscal quarter that has materially affected, or is reasonably likely to materially affect, our internal control over financial reporting.
51
PART II.
OTHER INFORMATION
ITEM 1A. RISK FACTORS
In January 2017, we announced that Delek (and various related entities) had entered into an Agreement and Plan of Merger with Alon USA Energy, Inc. (NYSE: ALJ) ("Alon USA"), as subsequently amended on February 27 and April 21, 2017 (as so amended, the "Merger Agreement"). The related Merger (the "Delek/Alon Merger" or the "Merger") was effective July 1, 2017 (the “Effective Time”), resulting in a new post-combination consolidated registrant renamed as Delek US Holdings, Inc. (“New Delek”), with Alon USA and the previous Delek US Holdings, Inc. (“Old Delek”) surviving as wholly-owned subsidiaries. New Delek is the successor issuer to Old Delek and Alon USA pursuant to Rule 12g-3(c) under the Securities Exchange Act of 1934, as amended (the "Exchange Act"). In addition, as a result of the Delek/Alon Merger, the shares of common stock of Old Delek and Alon USA were delisted from the New York Stock Exchange in July 2017, and their respective reporting obligations under the Exchange Act were terminated. The Risk Factors considered for presentation herein are based on identified and anticipated risks to New Delek unless specifically attributed to one of its subsidiaries in the discussion below.
There have been no material changes in the risk factors previously disclosed in "Item 1A. Risk Factors" of Old Delek's Annual Report on Form 10-K, except as disclosed below, which updates the risk factors previously disclosed in Part I, Item 1A of Old Delek's Annual Report on Form 10-K for the year ended December 31, 2016.
Following the Delek/Alon Merger, New Delek may be unable to integrate successfully the businesses of OldDelek and Alon USA and realize the anticipated benefits of the Delek/Alon Merger.
The Delek/Alon Merger involve the combination of two companies which, prior to July 1, 2017, operated as independent public companies. Following the Delek/Alon Merger, New Delek will be required to devote significant management attention and resources to integrating the business practices and operations of Old Delek and Alon USA. New Delek may fail to realize some or all of the anticipated benefits of the Delek/Alon Merger if the integration process takes longer than expected or is more costly than expected. Potential difficulties New Delek may encounter in the integration process include the following:
• | the inability to successfully combine the businesses of Old Delek and Alon USA in a manner that permits New Delek to achieve the synergies anticipated to result from the Delek/Alon Merger, which would result in the anticipated benefits of the Delek/Alon Merger not being realized partly or wholly in the time frame currently anticipated or at all; |
• | lost sales and customers as a result of certain customers of either of the two companies deciding not to do business with New Delek; |
• | complexities associated with managing the combined businesses; |
• | integrating personnel from the two companies; |
• | challenges in the creation of uniform standards, controls, procedures, policies and information systems; |
• | potential unknown liabilities and unforeseen increased expenses, delays or regulatory conditions associated with the Delek/Alon Merger; and |
• | performance shortfalls at one or both of the two companies as a result of the diversion of management’s attention caused by completing the Delek/Alon Merger and integrating the companies’ operations. |
New Delek is expected to incur substantial expenses related to the integration of Old Delek and Alon USA.
New Delek is expected to incur substantial expenses in connection with the integration of the business, policies, procedures, operations, technologies and systems of Alon USA with those of Old Delek. There are a large number of systems that must be integrated, including management information, purchasing, administrative, accounting and finance, sales, marketing, billing, payroll and benefits, installation, engineering, infrastructure and regulatory compliance, among others. While New Delek has assumed that a certain level of expenses would be incurred, there are a number of factors beyond its control that could affect the total amount or the timing of all of the expected integration expenses. Moreover, many of the expenses that will be incurred are, by their nature, difficult to estimate. These integration expenses likely will result in New Delek taking significant charges against earnings, but the amount and timing of such charges is uncertain, and if such charges are greater than expected, they could offset the cost synergies that New Delek expects to achieve from the Delek/Alon Merger.
In connection with the continuing operations of New Delek following the Merger, New Delek may refinance a significant amount of indebtedness and otherwise require additional financing; it cannot guarantee that it will be able to obtain the necessary funds on favorable terms or at all.
52
New Delek may elect to refinance certain of Old Delek's or Alon USA’s indebtedness even if not required to do so by the terms of such indebtedness. In addition, New Delek may need or want to raise additional funds for the operations of New Delek following the Delek/Alon Merger. New Delek has been and may continue to be engaged in discussions with certain potential financing sources, which could provide a source of additional funds and liquidity for the operations of New Delek. However, the ability of New Delek to obtain such financing will depend on, among other factors, prevailing market conditions at the time of the proposed financing and other factors beyond the control of New Delek. There is no assurance that New Delek will be able to obtain additional financing on terms acceptable to New Delek, or at all.
In connection with the Delek/Alon Merger, New Delek will be subject to significant additional indebtedness, which could adversely affect New Delek, including by decreasing New Delek’s business flexibility and increasing New Delek’s interest expense.
As of June 30, 2017, Delek’s consolidated indebtedness was approximately $822.5 million, and Alon USA’s consolidated indebtedness was approximately $564.7 million . Following the completion of the Delek/Alon Merger, New Delek may have to incur additional indebtedness in connection with any extinguishment of Alon USA debt, as well as for its ongoing business needs. As a result, New Delek is subject to substantially increased indebtedness in comparison to Old Delek’s indebtedness on a recent historical basis. This increased indebtedness could have the effect, among other things, of reducing New Delek’s flexibility to respond to changing business and economic conditions and increasing New Delek’s interest expense. The increased levels of indebtedness could reduce funds available for working capital, capital expenditures, acquisitions, share repurchases, dividends and other general corporate purposes.
New Delek’s future results will suffer if it does not effectively manage its expanded operations following the Delek/Alon Merger.
The size and scope of operations of the business of New Delek have increased beyond the current size and scope of operations of either Old Delek’s or Alon USA’s businesses prior to the Delek/Alon Merger. In addition, New Delek may continue to expand its size and operations through additional acquisitions or other strategic transactions. New Delek’s future success depends, in part, upon its ability to manage its expanded business, which may pose substantial challenges for management, including challenges related to the management and monitoring of new operations and associated increased costs and complexity. There can be no assurance that New Delek will be successful or that it will realize the expected economies of scale, synergies and other benefits currently anticipated from the Delek/Alon Merger or anticipated from any additional acquisitions or strategic transactions.
The Delek/Alon Merger could adversely affect our relationships with employees, customers, commercial partners, financing parties and other third parties.
Uncertainty about the effect of the Delek/Alon Merger on employees, customers, commercial partners and other third parties may have an adverse effect on New Delek. These uncertainties may cause customers, suppliers, commercial partners, financing parties and others that dealt with Alon USA or Old Delek to seek to change, delay or defer decisions with respect to existing or future business relationships. These uncertainties may impair New Delek’s ability to retain, hire and motivate certain current and prospective employees. If key employees, customers, suppliers, commercial partners, financing parties and other third parties terminate or change, or seek to terminate or change, their existing relationships with New Delek, our business could be harmed.
The trading price of New Delek common stock is likely to be volatile.
The trading price of Old Delek common stock and Alon USA common stock prior to the Delek/Alon Merger were highly volatile. The trading price of New Delek common stock could also be subject to wide fluctuations in response to various factors, some of which are beyond New Delek’s control. The stock market in general, and the market for energy companies in particular, has experienced extreme price and volume fluctuations that have often been unrelated or disproportionate to the operating performance of those companies. Broad market and industry factors may seriously affect the market price of companies’ stock, including New Delek’s, regardless of actual operating performance. In addition, in the past, following periods of volatility in the overall market and the market price of a particular company’s securities, securities class action litigation has often been instituted against these companies. Any such stockholder litigation could result in substantial costs and a diversion of the attention and resources of New Delek’s management.
The Delek/Alon Merger may not be as accretive to Delek’s earnings per share as anticipated, which may negatively affect the market price of New Delek common stock.
New Delek currently anticipates that the Delek/Alon Merger will be accretive to earnings per share in 2018, assuming certain pre-tax synergies are realized. This expectation, however, is based on preliminary estimates which may materially change. New Delek could encounter additional transaction-related costs or other factors such as the failure to realize all of the benefits anticipated in the Delek/Alon Merger. All of these factors could decrease or delay the expected accretive effect of the Delek/Alon Merger and cause a decrease in the market price of New Delek common stock.
53
New Delek will record goodwill and other intangible assets that could become impaired and result in material non-cash charges to the results of operations of New Delek in the future.
The Delek/Alon Merger will be accounted for as an acquisition by New Delek in accordance with accounting principles generally accepted in the United States. Under the acquisition method of accounting, the assets and liabilities of Alon USA and its subsidiaries will be recorded, as of the completion of the Delek/Alon Merger, at their respective fair values and added to those of Old Delek. Under the acquisition method of accounting, the total purchase price will be allocated (once completed) to Alon USA’s tangible assets and liabilities and identifiable intangible assets based on their fair values as of the date of completion of the Delek/Alon Merger. The excess of the purchase price over those fair values will be recorded as goodwill. To the extent the value of goodwill or intangibles becomes impaired, New Delek may be required to incur material non-cash charges relating to such impairment. New Delek’s operating results may be significantly impacted from both the impairment and the underlying trends in the business that triggered the impairment.
We operate in a highly regulated industry and increased costs of compliance with, or liability for violation of, existing or future laws, regulations and other requirements could significantly increase our costs of doing business, thereby adversely affecting our profitability.
Our industry is subject to extensive laws, regulations, permits and other requirements including, but not limited to, those relating to the environment, fuel composition, safety, transportation, pipeline tariffs, employment, labor, immigration, minimum wages, overtime pay, health care benefits, working conditions, public accessibility, retail fuel pricing,the sale of alcohol and tobacco and other requirements. These permits, laws and regulations are enforced by federal agencies including the United States ("U.S.") Environmental Protection Agency ("EPA"), U.S. Department of Transportation, Pipeline and Hazardous Materials Safety Administration, Federal Motor Carrier Safety Administration, Federal Railroad Administration, the Occupational Safety and Health Administration ("OSHA"), National Labor Relations Board, Equal Employment Opportunity Commission, Federal Trade Commission and the Federal Energy Regulatory Commission ("FERC"), and numerous other state and federal agencies. We anticipate that compliance with environmental, health and safety regulations could require us to spend significant amounts in capital costs during the next five years. These estimates do not include amounts related to capital investments that management has deemed to be strategic investments. These amounts could materially change as a result of governmental and regulatory actions.
Various permits, licenses, registrations and other authorizations are required under these laws for the operation of our refineries, terminals, pipelines and related operations, and these permits are subject to renewal and modification that may require operational changes involving significant costs. If key permits cannot be renewed or are revoked, the ability to continue operation of the affected facilities could be threatened.
Ongoing compliance with or violation of laws, regulations and other requirements could also have a material adverse effect on our business, financial condition and results of operations. We face potential exposure to future claims and lawsuits involving environmental matters including but not limited to, soil, groundwater and waterway contamination, air pollution, personal injury and property damage allegedly caused by substances we manufactured, handled, used, released or disposed. We are and have been the subject of various state, federal and private proceedings relating to environmental regulations, conditions and inquiries.
In addition, new legal requirements, new interpretations of existing legal requirements, increased legislative activity and governmental enforcement and other developments could require us to make additional unforeseen expenditures. Companies in the petroleum industry, such as us, are often the target of activist and regulatory activity regarding pricing, safety, environmental compliance, derivatives trading and other business practices which could result in price controls, fines, increased taxes or other actions affecting the conduct of our business. For example, consumer activists are lobbying various authorities to enact laws and regulations mandating the removal of tetra-ethyl lead from aviation gasoline. Other activists seek to require reductions in greenhouse gas emissions from our refineries and fuel products and are increasingly protesting new energy infrastructure projects such as pipelines and crude by rail facilities. The specific impact of laws and regulations or other actions may vary depending on a number of factors, including the age and location of operating facilities, marketing areas, crude oil and feedstock sources and production processes.
We generate wastes that may be subject to the Resource Conservation and Recovery Act ("RCRA") and comparable state and local requirements. The EPA and various state agencies have limited the approved methods of managing, transporting, recycling and disposal of hazardous and certain non-hazardous wastes. Our refineries are large quantity generators of hazardous waste and require hazardous waste permits issued by the EPA or state agencies. Additionally, certain of our other facilities such as terminals and biodiesel plants generate lesser quantities of hazardous wastes.
Ongoing compliance with laws, regulations and other requirements could also have a material adverse effect on our business, financial condition and results of operations. Under RCRA and the Comprehensive Environmental Response, Compensation and Liability Act ("CERCLA") and other federal, state and local environmental requirements, as the owner or operator of refineries, biodiesel plants, bulk terminals, pipelines, tank farms, rail cars and trucks, we may be liable for the costs of removal or remediation of contamination at our existing or former locations, whether we knew of, or were responsible for, the presence of such contamination. We have incurred such liability in the past and several of our
54
current and former locations are the subject of ongoing remediation projects. The failure to timely report and properly remediate contamination may subject us to liability to third parties and may adversely affect our ability to sell or rent our property or to borrow money using our property as collateral. Additionally, persons who arrange for the disposal or treatment of hazardous substances also may be liable for the costs of removal or remediation of these substances at sites where they are located, regardless of whether the site is owned or operated by that person. We typically arrange for the treatment or disposal of hazardous substances in our refining and other operations. Therefore, we may be liable for removal or remediation costs, as well as other related costs, including fines, penalties and damages resulting from injuries to persons, property and natural resources. Our El Dorado refinery is a minor potentially responsible party at a Superfund site for which we expect our costs to be non-material. In the future, we may incur substantial expenditures for investigation or remediation of contamination that has not been discovered at our current or former locations or locations that we may acquire.
Our operations are subject to certain requirements of the federal Clean Air Act (“CAA”) as well as related state and local laws and regulations governing air emissions. Certain CAA regulatory programs applicable to our refineries, terminals and other operations require capital expenditures for the installation of air pollution control devices, operational procedures to minimize emissions and monitoring and reporting of emissions. In 2012, the EPA announced an industry-wide enforcement initiative directed at flaring operations and performance at refineries and petrochemical plants and finalized revisions to New Source Performance Standard ("NSPS") Subpart Ja that primarily affects flares and process heaters. We completed capital projects at our Tyler and El Dorado refineries related to flare compliance with NSPS Ja in 2015.
Our recently acquired Big Spring refinery has been negotiating an agreement with EPA for over 10 years under EPA’s National Petroleum Refinery Initiative regarding alleged historical violations of the CAA. According to the EPA, approximately 95% of the nation’s refining capacity has entered into “global” settlements under this EPA enforcement initiative. Our El Dorado and Tyler refineries entered into similar global settlements in 2002 and 2009. A Consent Decree resolving these alleged historical violations for the Big Spring refinery was lodged with the federal court on June 6, 2017, and we expect that Consent Decree to become final later this year. If finalized, the Consent Decree will require payment of a $456,250 civil penalty and capital expenditures for pollution control equipment that may be significant over the next 5 years.
In 2015, EPA finalized reductions in the National Ambient Air Quality Standard (NAAQS) for ozone, from 75 ppb to 70 ppb. Our Tyler refinery is likely to be located in an area reclassified as non-attainment with the new standard. While we do not yet know what specific actions we will be required to take or when, it is possible we will have to install additional air pollution control equipment for ozone forming emissions or change the formulation of gasoline we make for use in some areas. We do not believe such capital expenditures or the changes in our operation will result in a material adverse effect on our business.
In late 2015, the EPA finalized additional rules regulating refinery air emissions from a variety of sources (such as cokers, flares, tanks, and other process units) through additional NSPS and National Emission Standards for Hazardous Air Pollutants and changing the way emissions from startup, shutdown and malfunction operations are regulated (the "Refinery Risk and Technology Review Rules" or “RTR”). The RTR rule also requires that starting in January 2018 we monitor property line benzene concentrations at our refineries and starting in 2019 report those concentrations quarterly to EPA, which will make the results available to the public. Even though the concentrations are not expected to exceed regulatory or health based standards, the availability of such data may increase the likelihood of lawsuits against our refineries by the local public or organized public interest groups. Compliance with the rules will require additional capital projects and changes in the way we operate some equipment over the next three years but is not expected to have a material adverse effect on our business, financial condition or results of operations.
In addition to our operations, many of the fuel products we manufacture are subject to requirements of the CAA as well as related state and local laws and regulations. The EPA has the authority under the CAA to modify the formulation of the refined transportation fuel products we manufacture in order to limit the emissions associated with their final use. In 2007, the EPA issued final Mobile Source Air Toxic II rules for gasoline formulation that required the reduction of average benzene content beginning January 1, 2011 and the reduction of maximum annual average benzene content by July 1, 2012. We have purchased credits in the past to comply with these content requirements for two of our refineries. Although credits have been readily available, there can be no assurance that such credits will continue to be available for purchase at reasonable prices or at all and we could have to implement capital projects in the future to reduce benzene levels.
In March 2014, the EPA issued final Tier 3 gasoline rules that require a reduction in annual average gasoline sulfur content from 30 ppm to 10 ppm by January 1, 2017 for "large refineries" and retains the current maximum per-gallon sulfur content limit of 80 ppm. Under the final rules, all of our refineries are considered “small refineries” and are exempt from complying with the rules' requirements until January 1, 2020. We anticipate that the Tyler refinery will meet these new limits when they become effective with only minor operational changes and that capital projects will be required for additional sulfur removal capacity at our other refineries, but compliance is not expected to have a material adverse effect on our business, financial condition or results of operations. In April 2016, EPA finalized a change to the Tier 3 standard requiring small volume refineries that increase their annual average crude processing rate above 75,000 bpd to meet the Tier 3 sulfur limits 30 months from that “disqualifying” date. We do not anticipate that this rule change will affect our refineries.
Our operations are also subject to the Federal Clean Water Act (“CWA”), the Oil Pollution Act of 1990 (“OPA-90”) and comparable state and local requirements. The CWA and similar laws prohibit any discharge into surface waters, ground waters, injection wells and publicly-owned
55
treatment works except as allowed by pre-treatment permits and National Pollutant Discharge Elimination System (“NPDES”) permits, issued by federal, state and local governmental agencies. The OPA-90 prohibits the discharge of oil into Waters of the U.S. and requires that affected facilities have plans in place to respond to spills and other discharges. The CWA also regulates filling or discharges to wetlands and other Waters of the U.S. In 2015, the EPA, in conjunction with the Army Corps of Engineers, issued a final rule regarding the definition of “Waters of the U.S.,” which expanded the regulatory reach of the existing clean water regulations. Although the final rule is currently stayed pending litigation, if the rule becomes enforceable, it could increase costs for expanding our facilities or constructing new facilities, including pipelines.
We are subject to regulation by the United States Department of Transportation and various state agencies in connection with our pipeline, trucking and rail transportation operations. These regulatory authorities exercise broad powers, governing activities such as the authorization to operate hazardous materials pipelines and engage in motor carrier operations. There are additional regulations specifically relating to the transportation industry, including integrity management of pipelines, testing and specification of equipment, product handling and labeling requirements and personnel qualifications. The transportation industry is subject to possible regulatory and legislative changes that may affect the economics of our business by requiring changes in operating practices or pipeline construction or by changing the demand for common or contract carrier services or the cost of providing truckload services. Possible changes include, among other things, increasingly stringent environmental regulations, increased frequency and stringency for testing and repairing pipelines, replacement of older pipelines, changes in the hours of service regulations that govern the amount of time a driver may drive in any specific period, onboard black box recorder devices or limits on vehicle weight and size and properties of the materials that can be shipped. Required changes to the specifications governing rail cars carrying crude oil will eliminate the most commonly used tank car or require that such cars be upgraded. In January 2017, PHMSA announced they were considering limits on the volatility of crude oil that could be shipped by rail and other modes of transportation. These rules could limit the availability of tank cars to transport crude to our refineries and increase the cost of crude oil transported by rail or truck. In addition to the substantial remediation costs that could be caused by leaks or spills from our pipelines, regulators could prohibit our use of affected portions of the pipeline for extended periods thereby interrupting the delivery of crude oil to, or the distribution of refined products from, our refineries.
Our operations are subject to various laws and regulations relating to occupational health and safety and process safety administered by OSHA, EPA and various state equivalent agencies. We maintain safety, training, design standards, mechanical integrity and maintenance programs as part of our ongoing efforts to ensure compliance with applicable laws and regulations and protect the safety of our workers and the public. More stringent laws or regulations or adverse changes in the interpretation of existing laws or regulations by government agencies could have an adverse effect on our financial position and the results of our operations and could require substantial expenditures for the installation and operation of systems and equipment.
Health and safety legislation and regulations change frequently. We cannot predict what additional health and safety legislation or regulations will be enacted or become effective in the future or how existing or future laws or regulations will be administered or interpreted with respect to our operations. Compliance with applicable health and safety laws and regulations has required and continues to require substantial expenditures. Future process safety rules could also mandate changes to the way we operate, the processes and chemicals we use and the materials from which our process units are constructed. Such regulations could have a significant negative effect on our operations and profitability. For example, in response to Executive Order 13650, Improving Chemical Facility Safety and Security, OSHA announced it intends to propose comprehensive changes to process safety requirements. In January 2017, the EPA finalized changes to process safety requirements in its Risk Management Program rules that require evaluation of safer alternatives and technologies, expanded routine audits, independent third party audits following certain process safety events and increased sharing of information with the public and emergency response organizations. Pending reconsideration of this rule, EPA has subsequently delayed the effective date until 2019.
Environmental regulations are becoming more stringent and new environmental laws and regulations are continuously being enacted or proposed. Compliance with any future legislation or regulation of our produced fuels, including renewable fuel or carbon content; greenhouse gas ("GHG") emissions; sulfur, benzene or other toxic content; vapor pressure; octane; or other fuel characteristics, may result in increased capital and operating costs and may have a material adverse effect on our results of operations and financial condition. While it is impractical to predict the impact that potential regulatory and activist activity may have, such future activity may result in increased costs to operate and maintain our facilities, as well as increased capital outlays to improve our facilities. Such future activity could also adversely affect our ability to expand production, result in damaging publicity about us, or reduce demand for our products. Our need to incur costs associated with complying with any resulting new legal or regulatory requirements that are substantial and not adequately provided for, could have a material adverse effect on our business, financial condition and results of operations.
The Dodd-Frank Wall Street Reform and Consumer Protection Act (the "Dodd-Frank Act") is comprehensive financial reform legislation that, among other things, establishes comprehensive federal oversight and regulation of over-the-counter derivatives and many of the entities that participate in that market. Although the Dodd-Frank Act was enacted on July 21, 2010, the Commodity Futures Trading Commission, or CFTC, and the SEC, along with certain other regulators, must promulgate final rules and regulations to implement many of the Dodd-Frank Act's provisions relating to over-the-counter derivatives. While some of these rules have been finalized, others have not; and, as a result, the final form and timing of the implementation of the new regulatory regime affecting commodity derivatives remains uncertain.
56
Finally, the Patient Protection and Affordable Care Act (the “ACA”) as well as other healthcare reform legislation being considered by Congress and state legislatures may have an impact on our business. Although many of the rules, reforms and regulations required to implement the ACA have not yet been adopted, and consequently the precise costs of complying with the ACA remain unknown, an increase in our employee healthcare-related costs appears likely and that increase could be extensive and changes to our healthcare cost structure could have a significant, negative impact on our business.
We may incur significant costs and liabilities with respect to investigation and remediation of environmental conditions at our refineries.
Prior to our purchase of our refineries and terminals, the previous owners had been engaged for many years in the investigation and remediation of hydrocarbons and other materials which contaminated soil and groundwater at the purchased facilities. Upon purchase of the facilities, we became responsible and liable for certain costs associated with the continued investigation and remediation of known and unknown impacted areas at the refineries. In the future, it may be necessary to conduct further assessments and remediation efforts at impacted areas at our refinery, pipeline, tank, terminal and store locations and elsewhere. In addition, we have identified and self-reported certain other environmental matters subsequent to our purchase of the refineries.
Based upon environmental evaluations performed internally and by third parties we recorded and periodically update environmental liabilities and accrued amounts we believe are sufficient to complete remediation. We expect remediation of soil, sediment and groundwater at some properties to continue for the foreseeable future. The need to make future expenditures for these purposes that exceed the amounts we estimated and accrued for could have a material adverse effect on our business, financial condition and results of operations.
Alon USA indemnified certain parties to which they sold assets for costs and liabilities that may be incurred as a result of environmental conditions existing at the time of the sale. As a result of our purchase of Alon, if we are forced to incur costs or pay liabilities in connection with these indemnifications, such costs and payments could be significant and adversely affect our business, results of operations and cash flows.
In the future, we may incur substantial expenditures for investigation or remediation of contamination that has not been discovered at our current or former locations or locations that we may acquire. Our handling and storage of petroleum and hazardous substances may lead to additional contamination at our facilities or along our pipelines and at facilities to which we send or have sent wastes or by-products for treatment of disposal. In addition, new legal requirements, new interpretations of existing legal requirements, increased legislative activity and governmental enforcement and other developments could require us to make additional unforeseen expenditures. As a result, we may be subject to additional investigation and cleanup costs, governmental penalties and third party suits alleging personal injury and property damage. Joint and several strict liability may be incurred in connection with releases of petroleum hydrocarbons, hazardous substances and/or wastes. Liabilities for future remediation costs are recorded when environmental assessments and/or remedial efforts are probable and the costs can be reasonably estimated as material. Other than for assessments, the timing and magnitude of these accruals generally are based on the completion of investigations or other studies or a commitment to a formal plan of action.
Adverse weather conditions or other unforeseen developments could damage our facilities, reduce customer traffic and impair our ability to produce and deliver refined petroleum products or receive supplies for our retail fuel and convenience stores.
The regions in which we operate are susceptible to severe storms, including hurricanes, thunderstorms, tornadoes, floods, extended periods of rain, ice storms and snow, all of which we have experienced in the past few years. Alon USA’s refineries located in California and the related pipeline and asphalt terminals are located in areas with a history of earthquakes, some of which have been quite severe. In addition, for a variety of reasons, many members of the scientific community believe that climate changes are occurring that could have significant physical effects, such as increased frequency and severity of storms, droughts and floods and other climatic events. If any such effects were to occur, they could have an adverse effect on our assets and operations.
Inclement weather conditions, earthquakes or other unforeseen developments could damage our facilities, interrupt production, adversely impact consumer behavior, travel and retail fuel and convenience store traffic patterns or interrupt or impede our ability to operate our locations. If such conditions prevail near our refineries, they could interrupt or undermine our ability to produce and transport products from our refineries and receive and distribute products at our terminals. Regional occurrences, such as energy shortages or increases in energy prices, fires and other natural disasters, could also hurt our business. The occurrence of any of these developments could have a material adverse effect on our business, financial condition and results of operations.
Shareholder litigation against Old Delek, Alon USA and certain of their directors could divert management time and result in the payment of damages if the plaintiffs are successful.
As more fully described in a Form 8-K filed by Old Delek on June 19, 2017, in June 2017, three purported stockholders of Alon USA and one purported stockholder of Old Delek filed four lawsuits in connection with the Delek/Alon Merger. Three of the lawsuits, Stephen Page v. Alon USA Energy Inc., et al., Case No. 1:17-cv-00671-RGA (D. Del.), David Phelps v. Delek US Holdings, Inc., et al., Case No. 3:17-cv-00910
57
(M.D. Tenn.) and Joseph Adler v. Alon USA Energy, Inc., et al., Case No. 1:17-cv-00742-UNA (D. Del.), alleged that the defendants violated Section 14(a) of the Exchange Act, and Rule 14a-9 promulgated thereunder, by filing the joint proxy statement/prospectus relating to the proposed Delek/Alon Merger which allegedly failed to disclose and/or misrepresented material information about the proposed Alon/Delek Merger. Each of Old Delek and Alon determined to voluntarily supplement the joint proxy statement/prospectus by filing Current Reports on Form 8-K in order to moot certain of the plaintiffs’ disclosure claims, alleviate the costs, risks and uncertainties inherent in litigation and provide additional information to their respective stockholders. To date, the Page and Phelps lawsuits have been dismissed with prejudice, subject to the plaintiffs’ right to seek a “mootness” fee.
The fourth lawsuit, Arkansas Teacher Retirement System v. Alon USA Energy, Inc., et al., Case No. 2017-0453, filed in the Delaware Court of Chancery, alleges breach of fiduciary duty claims. Specifically, it alleges that Old Delek used its position as a purportedly controlling stockholder of Alon USA’s to obtain buyout terms from Alon USA at an unfairly discounted price, and that the defendant Alon USA directors breached their fiduciary duties allegedly owed to the plaintiff stockholder and purported class by engaging in conduct that led to the sale of Alon USA’s shares at an unfairly discounted price. The plaintiff has asked the Delaware Chancery Court to, among other things, award damages to the plaintiff and purported class in an amount to be determined at trial, award additional shares of New Delek common stock to the plaintiff and purported class and award the plaintiff attorneys’ and experts’ fees. Although we believe the plaintiff’s claims are without merit, we cannot predict the outcome of or estimate the possible loss or range of loss from this litigation.
The defense or settlement of the shareholder actions disclosed above could be time-consuming and expensive, and divert the attention of New Delek’s management away from operating the business. If any one or more of these legal proceedings is adversely resolved against New Delek, it could have an adverse effect on their financial condition, results of operations or liquidity of New Delek.
Competition in the retail industry is intense, and an increase in competition in the markets in which Alon USA’s retail businesses operates could adversely affect its earnings and profitability.
Alon USA’s retail operations compete with numerous convenience stores, gasoline service stations, supermarket chains, drug stores, fast food operations and other retail outlets. Increasingly, national high-volume grocery and dry-goods retailers, such as Wal-Mart, are entering the gasoline retailing business. Many of these competitors are substantially larger than Alon USA is. Because of their diversity, integration of operations and greater resources, these companies may be better able to withstand volatile market conditions or levels of low or no profitability. In addition, these retailers may use promotional pricing or discounts, both at the pump and in the store, to encourage in-store merchandise sales. These activities by Alon USA’s competitors could adversely affect Alon USA’s profit margins. Additionally, Alon USA’s convenience stores could lose market share, relating to both gasoline and merchandise, to these and other retailers, which could adversely affect Alon USA’s business, results of operations and cash flows. Alon USA’s convenience stores compete in large part based on their ability to offer convenience to customers. Consequently, changes in traffic patterns and the type, number and location of competing stores could result in the loss of customers and reduced sales and profitability at affected stores.
The termination or expiration of our supply and offtake agreements could have a material adverse effect on our liquidity.
Our supply and offtake agreement’s with J. Aron, have expiration dates ranging from May 2019 to May 2021. Pursuant to the agreements, J. Aron purchases a substantial portion of the crude oil and refined products in our refineries’ inventory at market prices. Upon any termination of the agreements, including at expiration or in connection with a force majeure or default, the parties are required to negotiate with third parties for the assignment to us of certain contracts, commitments and arrangements, including procurement contracts, commitments for the sale of product and pipeline, terminalling, storage and shipping arrangements. Additionally, upon any termination, we will be required to repurchase or refinance the consigned crude oil and refined products from J. Aron at then market prices, which may have a material impact on our working capital needs.
Alon USA conducts its convenience store business under a license agreement with 7-Eleven, and the loss of this license could adversely affect the results of operations of Alon USA’s retail segment.
Alon USA’s convenience store operations are primarily conducted under the 7-Eleven name pursuant to a license agreement between 7-Eleven, Inc. and Alon USA. 7-Eleven may terminate the agreement if Alon USA defaults on its obligations under the agreement. This termination would result in Alon USA’s convenience stores losing the use of the 7-Eleven brand name, the accompanying 7-Eleven advertising and certain other brand names and products used exclusively by 7-Eleven. Termination of the license agreement could have a material adverse effect on Alon USA’s retail operations.
New Delek relies on information technology in its operations, and any material failure, inadequacy, interruption or security failure of that technology could harm its business.
New Delek relies on information technology systems across our operations, including management of our supply chain, point of sale
58
processing at our retail sites and various other processes and transactions. New Delek relies on commercially available systems, software, tools and monitoring to provide security for processing, transmission and storage of confidential customer information, such as payment card and personal credit information.
In addition, the systems currently used for certain transmission and approval of payment card transactions, and the technology utilized in payment cards themselves, may put certain payment card data at risk. These standards for determining the required controls applicable to these systems are mandated by credit card issuers and administered by the Payment Card Industry Security Standards Counsel and not by New Delek. The regulatory environment surrounding information security and privacy is increasingly demanding, with the frequent imposition of new and constantly changing requirements. New Delek has taken the necessary steps to comply with the Payment Card Industry Data Security Standards (PCI-DSS) at all of our locations. However, compliance with these requirements may result in cost increases due to necessary systems changes and the development of new administrative processes.
In recent years, several retailers have experienced data breaches resulting in the exposure of sensitive customer data, including payment card information. Any compromise or breach of New Delek’s information and payment technology systems could cause interruptions in our operations, damage our reputation, reduce our customers' willingness to visit our sites and conduct business with them, or expose it to litigation from customers or sanctions for violations of the PCI-DSS. In addition, a compromise of our internal data network at any of our refining or terminal locations may have disruptive impacts similar to that of our retail operations. These disruptions could range from inconvenience in accessing business information to a disruption in our refining operations. Cost increases may be incurred in this area to combat the continued escalation of cyber-attacks and/or disruptive criminal activity.
Also, we utilize information technology systems and controls that monitor the movement of petroleum products through our pipelines and terminals. An undetected failure of these systems could result in environmental damage, operational disruptions, regulatory enforcement or private litigation. Further, the failure of any of our systems to operate effectively, or problems we may experience with transitioning to upgraded or replacement systems, could significantly harm our business and operations and cause us to incur significant costs to remediate such problems.
A substantial portion of the workforce at our refineries is unionized, and we may face labor disruptions that would interfere with our operations.
As of December 31, 2016, Old Delek employed 274 and 330 people in our Tyler and El Dorado operations, respectively. From among these employees, 177 operations and maintenance hourly employees and 39 truck drivers at the Tyler refinery were represented by the United Steel, Paper and Forestry, Rubber, Manufacturing, Energy, Allied Industrial and Service Workers International Union and its Local 202 at year end. The Tyler operations and maintenance hourly employees are currently covered by a collective bargaining agreement that expires January 31, 2019. The Tyler truck drivers are currently covered by a collective bargaining agreement that expires March 1, 2018. As of December 31, 2016, 192 operations and maintenance hourly employees at the El Dorado refinery were represented by the International Union of Operating Engineers and its Local 381. These employees are covered by a collective bargaining agreement which expires on August 1, 2021. Although these collective bargaining agreements contain provisions to discourage strikes or work stoppages, we cannot assure you that strikes or work stoppages will not occur. A strike or work stoppage could have a material adverse effect on our business, financial condition and results of operations.
As of December 31, 2016, Alon USA employed approximately 210 people at its Big Spring refinery, approximately 135 of whom were covered by a collective bargaining agreement that expires in April 2019. Alon USA’s current labor agreement may not prevent a strike or work stoppage in the future, and any such work stoppage could have a material adverse effect on our results of operations and financial condition.
ITEM 5. OTHER INFORMATION
Dividend Declaration
On August 1, 2017, New Delek's Board of Directors voted to declare a quarterly cash dividend of $0.15 per share of our common stock, payable on September 13, 2017 to shareholders of record on August 23, 2017.
Employment Agreement with Chief Executive Officer
On August 1, 2017, New Delek’s Board of Directors (the “Board”) approved an employment agreement with Ezra Uzi Yemin, New Delek’s Chairman, President and Chief Executive Officer (the “Agreement”). The Agreement was executed on August 3, 2017 and is effective November 1, 2017 and will succeed his prior employment agreement that expires on October 31, 2017. The new agreement expires on October 31, 2020. Under the terms of the Agreement, Mr. Yemin will continue to serve as New Delek’s Chief Executive Officer and as the Chairman of the Board.
59
The Agreement specifies that Mr. Yemin’s base salary shall be no less than the annualized equivalent of $972,500 and sets his annual bonus target for 140% of his base salary. Additionally, Mr. Yemin will be eligible to participate in New Delek’s long-term incentive plans that may be in effect from time to time for New Delek and its subsidiaries, including, without limitation, the Old Delek 2016 Long-Term Incentive Plan and the Delek Logistics GP, LLC 2012 Long-Term Incentive Plan (the "Logistics LTIP"), on terms commensurate with his position and duties, as determined by the Board on an annual basis.
Mr. Yemin is also entitled to severance and change in control benefits under the terms of the Agreement. If Mr. Yemin’s employment is terminated by New Delek without Cause (as defined in the Agreement) or is terminated by Mr. Yemin for Good Reason (as defined in the Agreement) other than in the context of a Change in Control (as defined in the Agreement), Mr. Yemin will be entitled to receive (i) an amount equal to the product of (A) the sum of Mr. Yemin’s base salary and target annual bonus, in each case as in effect immediately prior to the notice of termination (the “Separation Base Amount”) multiplied by (B) two, (ii) the costs of continuing COBRA health insurance coverage for Mr. Yemin’s family for 18 months following termination (the “Health Benefit Continuation”), (iii) the annual bonus to which Mr. Yemin would have otherwise been entitled if his employment had continued through the end of the bonus year based upon the actual performance of New Delek, prorated for the period of actual employment during the bonus year (the “Post-Employment Annual Bonus”), and (iv) the immediate vesting of unvested equity awards granted to Mr. Yemin under New Delek’s long-term incentive plans but, in the case of performance awards, only to the extent that the applicable performance period has elapsed through the date of termination and, in the case of other awards, only to the extent that the awards would have otherwise vested within six months following the date of termination.
If within two years following a Change in Control (as defined in the Agreement) Mr. Yemin’s employment is terminated by New Delek other than for Cause (as defined in the Agreement) or by Mr. Yemin for Good Reason (as defined in the Agreement), Mr. Yemin will be entitled to receive (i) an amount equal to the product of (A) the Separation Base Amount multiplied by (B) three, (ii) the Health Benefit Continuation, (iii) the Post-Employment Annual Bonus and (iv) the immediate vesting of all unvested equity awards granted to Mr. Yemin under New Delek’s long-term incentive plans.
60
ITEM 6. EXHIBITS
Exhibit No. | Description | |||
3.1 | Amended and Restated Certificate of Incorporation of Delek US Holdings, Inc. (f/k/a Delek Holdco, Inc.), dated as of April 20, 2017 (incorporated by reference to Exhibit 3.3 to Amendment No. 3 to the Registration Statement on Form S-4, filed by the Registrant with the SEC on April 24, 2017). | |||
3.2 | Certificate of Amendment of Amended and Restated Certificate of Incorporation of Delek US Holdings, Inc. (f/k/a Delek Holdco, Inc.), dated as of June 30, 2017 (incorporated by reference to Exhibit 3.2 to the Company's Form 8-K filed on July 3, 2017). | |||
3.3 | Amended and Restated Bylaws of Delek US Holdings, Inc. (f/k/a Delek Holdco, Inc.), as amended, effective as of July 1, 2017 (incorporated by reference to Exhibit 3.2 to the Company's Form 8-K filed on July 3, 2017). | |||
10.1 | * | Second Amendment to Amended and Restated Credit Agreement, dated May 17, 2017, among Delek Refining, Ltd., as borrower and Delek Refining, Inc. and Delek U.S. Refining GP, LLC, as guarantors, Wells Fargo Bank, National Association, as administrative agent, and a syndicate of lenders. | ||
10.2 | * | First Amendment to Second Amended and Restated Financing Agreement, dated April 13, 2017, among Lion Oil Company as borrower, certain subsidiaries of Lion Oil Company named therein as guarantors, the various institutions from time to time party to this Agreement, as Lenders, Fifth Third Bank as Administrative Agent and Lead Collateral Agent and Bank Hapoalim B.M., as Designated Account Collateral Agent. | ||
10.3 | § | Executive Employment Agreement, effective April 1, 2017, by and between Delek US Holdings, Inc. and Kevin Kremke (incorporated by reference to Exhibit 10.1 to the Company's Form 8-K filed on January 31, 2017). | ||
31.1 | * | Certification of the Company’s Chief Executive Officer pursuant to Rule 13a-14(a)/15(d)-14(a) under the Securities Exchange Act of 1934, as amended. | ||
31.2 | * | Certification of the Company’s Chief Financial Officer pursuant to Rule 13a-14(a)/15(d)-14(a) under the Securities Exchange Act of 1934, as amended. | ||
32.1 | ** | Certification of the Company’s Chief Executive Officer pursuant to 18 U.S.C. Section 1350, as adopted pursuant to Section 906 of the Sarbanes-Oxley Act of 2002. | ||
32.2 | ** | Certification of the Company’s Chief Financial Officer pursuant to 18 U.S.C. Section 1350, as adopted pursuant to Section 906 of the Sarbanes-Oxley Act of 2002. | ||
101 | The following materials from Delek US Holdings, Inc.’s Quarterly Report on Form 10-Q for the quarterly period ended June 30, 2017, formatted in XBRL (eXtensible Business Reporting Language): (i) Condensed Consolidated Balance Sheets as of June 30, 2017 and December 31, 2016 (Unaudited), (ii) Condensed Consolidated Statements of Income for the three and six months ended June 30, 2017 and 2016 (Unaudited), (iii) Condensed Consolidated Statements of Comprehensive Income for the three and six months ended June 30, 2017 and 2016 (Unaudited), (iv) Condensed Consolidated Statements of Cash Flows for the six months ended June 30, 2017 and 2016 (Unaudited), and (v) Notes to Condensed Consolidated Financial Statements (Unaudited). | |||
§ | Management contract or compensatory plan or arrangement. |
* | Filed herewith. |
** | Furnished herewith. |
61
SIGNATURES
Pursuant to the requirements of the Securities Exchange Act of 1934, the registrant has duly caused this report to be signed on its behalf by the undersigned, thereunto duly authorized.
Delek US Holdings, Inc. | |
By: | /s/ Ezra Uzi Yemin |
Ezra Uzi Yemin | |
Director (Chairman), President and Chief Executive Officer (Principal Executive Officer) | |
By: | /s/ Kevin Kremke |
Kevin Kremke | |
Executive Vice President and Chief Financial Officer (Principal Financial and Accounting Officer) | |
Dated: August 4, 2017
62
EXHIBIT INDEX
Exhibit No. | Description | |||
3.1 | Amended and Restated Certificate of Incorporation of Delek US Holdings, Inc. (f/k/a Delek Holdco, Inc.), dated as of April 20, 2017 (incorporated by reference to Exhibit 3.3 to Amendment No. 3 to the Registration Statement on Form S-4, filed by the Registrant with the SEC on April 24, 2017). | |||
3.2 | Certificate of Amendment of Amended and Restated Certificate of Incorporation of Delek US Holdings, Inc. (f/k/a Delek Holdco, Inc.), dated as of June 30, 2017 (incorporated by reference to Exhibit 3.2 to the Company's Form 8-K filed on July 3, 2017). | |||
3.3 | Amended and Restated Bylaws of Delek US Holdings, Inc. (f/k/a Delek Holdco, Inc.), as amended, effective as of July 1, 2017 (incorporated by reference to Exhibit 3.2 to the Company's Form 8-K filed on July 3, 2017). | |||
10.1 | * | Second Amendment to Amended and Restated Credit Agreement, dated May 17, 2017, among Delek Refining, Ltd., as borrower and Delek Refining, Inc. and Delek U.S. Refining GP, LLC, as guarantors, Wells Fargo Bank, National Association, as administrative agent, and a syndicate of lenders. | ||
10.2 | * | First Amendment to Second Amended and Restated Financing Agreement, dated April 13, 2017, among Lion Oil Company as borrower, certain subsidiaries of Lion Oil Company named therein as guarantors, the various institutions from time to time party to this Agreement, as Lenders, Fifth Third Bank as Administrative Agent and Lead Collateral Agent and Bank Hapoalim B.M., as Designated Account Collateral Agent. | ||
10.3 | § | Executive Employment Agreement, effective April 1, 2017, by and between Delek US Holdings, Inc. and Kevin Kremke (incorporated by reference to Exhibit 10.1 to the Company's Form 8-K filed on January 31, 2017). | ||
31.1 | * | Certification of the Company’s Chief Executive Officer pursuant to Rule 13a-14(a)/15(d)-14(a) under the Securities Exchange Act of 1934, as amended. | ||
31.2 | * | Certification of the Company’s Chief Financial Officer pursuant to Rule 13a-14(a)/15(d)-14(a) under the Securities Exchange Act of 1934, as amended. | ||
32.1 | ** | Certification of the Company’s Chief Executive Officer pursuant to 18 U.S.C. Section 1350, as adopted pursuant to Section 906 of the Sarbanes-Oxley Act of 2002. | ||
32.2 | ** | Certification of the Company’s Chief Financial Officer pursuant to 18 U.S.C. Section 1350, as adopted pursuant to Section 906 of the Sarbanes-Oxley Act of 2002. | ||
101 | The following materials from Delek US Holdings, Inc.’s Quarterly Report on Form 10-Q for the quarterly period ended June 30, 2017, formatted in XBRL (eXtensible Business Reporting Language): (i) Condensed Consolidated Balance Sheets as of June 30, 2017 and December 31, 2016 (Unaudited), (ii) Condensed Consolidated Statements of Income for the three and six months ended June 30, 2017 and 2016 (Unaudited), (iii) Condensed Consolidated Statements of Comprehensive Income for the three and six months ended June 30, 2017 and 2016 (Unaudited), (iv) Condensed Consolidated Statements of Cash Flows for the six months ended June 30, 2017 and 2016 (Unaudited), and (v) Notes to Condensed Consolidated Financial Statements (Unaudited). | |||
§ | Management contract or compensatory plan or arrangement. |
* | Filed herewith. |
** | Furnished herewith. |
63