Attached files
| file | filename |
|---|---|
| 8-K - FORM 8-K - Clifton Bancorp Inc. | d400092d8k.htm |

Exhibit 99.1
Clifton Bancorp makes forward-looking statements in this presentation. These forward-looking statements may include: statements of goals, intentions, earnings expectations, and other expectations; estimates of risks and of future costs and benefits; assessments of probable loan and lease losses; assessments of market risk; and statements of the ability to achieve financial and other goals. Forward-looking statements are typically identified by words such as "believe," "expect," "anticipate," "intend," "outlook," "estimate," "forecast," "project" and other similar words and expressions. Forward-looking statements are subject to numerous assumptions, risks and uncertainties, which change over time. Forward-looking statements speak only as of the date they are made. Clifton Bancorp does not assume any duty and does not undertake to update its forward-looking statements. Because forward-looking statements are subject to assumptions and uncertainties, actual results or future events could differ, possibly materially, from those that Clifton Bancorp anticipated in its forward-looking statements and future results could differ materially from historical performance. Clifton Bancorp's forward-looking statements are subject to the following principal risks and uncertainties: general economic conditions and trends, either nationally or locally; conditions in the securities markets; changes in interest rates; changes in deposit flows, and in the demand for deposit, loan, and investment products and other financial services; changes in real estate values; changes in the quality or composition of the Company's loan or investment portfolios; changes in competitive pressures among financial institutions or from non-financial institutions; the Company's ability to retain key members of management; changes in legislation, regulations, and policies; and a variety of other matters which, by their nature, are subject to significant uncertainties. Clifton Bancorp provides greater detail regarding some of these factors in its Annual Report on Form 10-K filed on June 8, 2017 in the Risk Factors section, and in its other SEC reports. Clifton Bancorp's forward-looking statements may also be subject to other risks and uncertainties, including those that it may discuss elsewhere in this news release or in its filings with the SEC, accessible on the SEC's website at www.sec.gov. Forward Looking Statements

We all have the same job: ensuring CSBK is the choice our employees, customers and stockholders would enthusiastically make again. CSBK MISSION
CSBK STRATEGIC ROADMAP Core Deposit Growth Loan Growth Capital Management Brand Differentiation Opportunistic Acquisitions
FY 2017 ACCOMPLISHMENTS Healthy loan growth: YOY +29% Loan diversification shift: 29% CRE/MF vs. 69% Residential – 3/31/17 8% CRE/MF vs. 92% Residential – 3/31/14 Deposit gathering success: YOY +22% Deposit composition shift: 34% Checking/Savings vs. 66% CD – 3/31/17 29% Checking/Savings vs. 71% CD – 3/31/14
FY 2017 ACCOMPLISHMENTS Continued focus on organic growth Full deployment of 7 FTE deposit and loan sales professionals Continued upgrades and enhancements to products/services Business Digital Banking Platform Cash Management Services (ACH/Wires, Remote Deposit Scanner) Municipal Deposit Program Refining and elevating the customer experience Continued sales training and coaching with goal of increased cross-sales and retention Ongoing qualitative/quantitative measurements of CSBK Experience
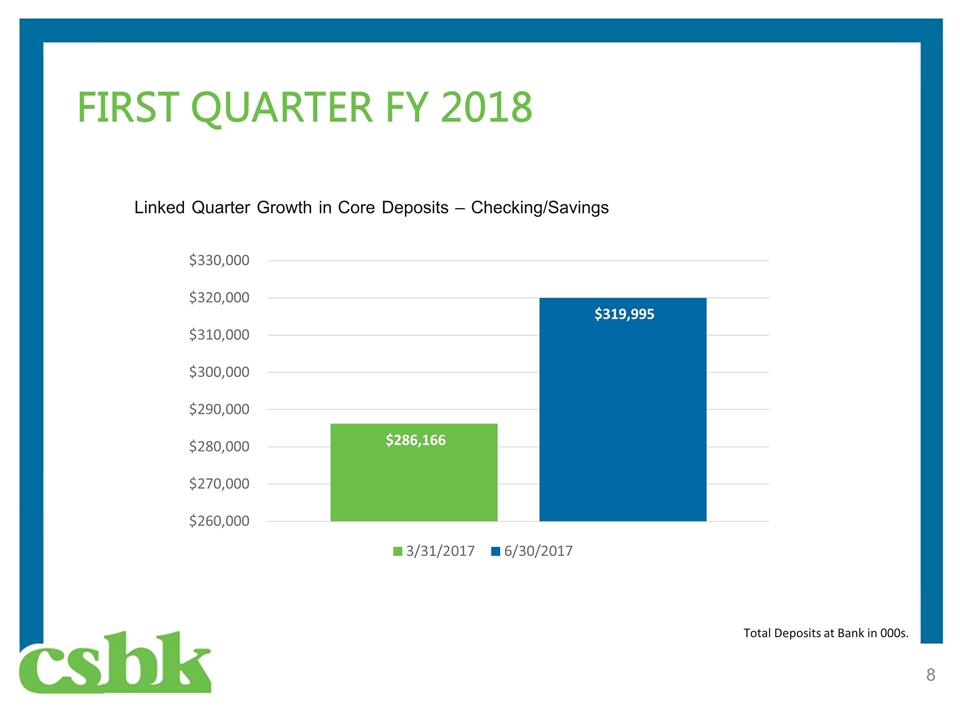
FIRST QUARTER FY 2018 Linked Quarter Growth in Core Deposits – Checking/Savings 3/31/17 3/31/17 6/30/17 Total Deposits at Bank in 000s.
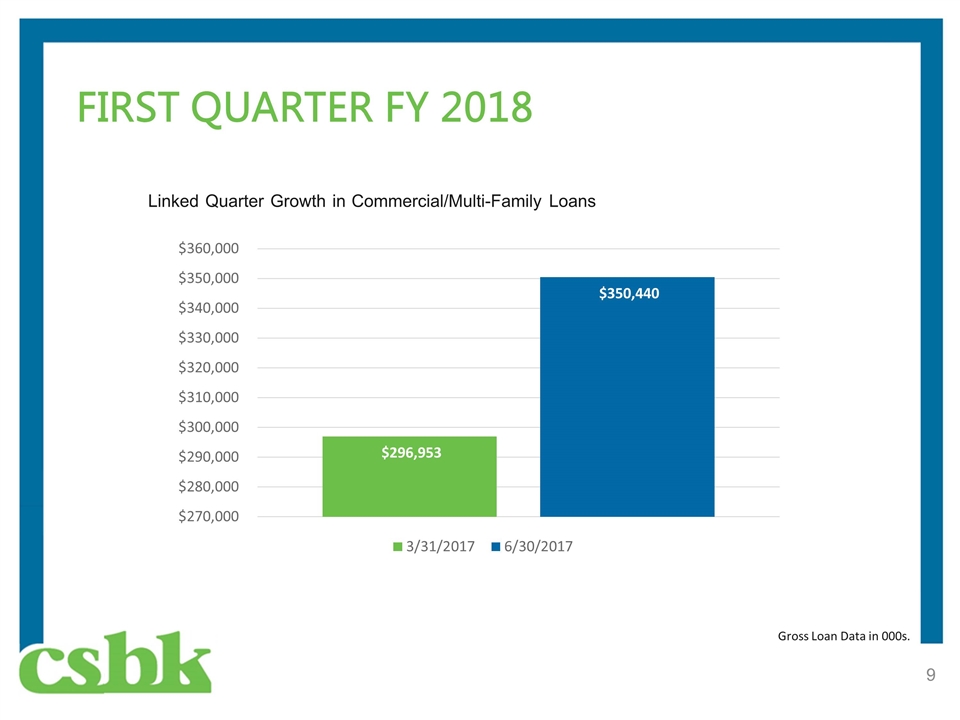
FIRST QUARTER FY 2018 Linked Quarter Growth in Commercial/Multi-Family Loans 3/31/17 3/31/17 6/30/17 Gross Loan Data in 000s.
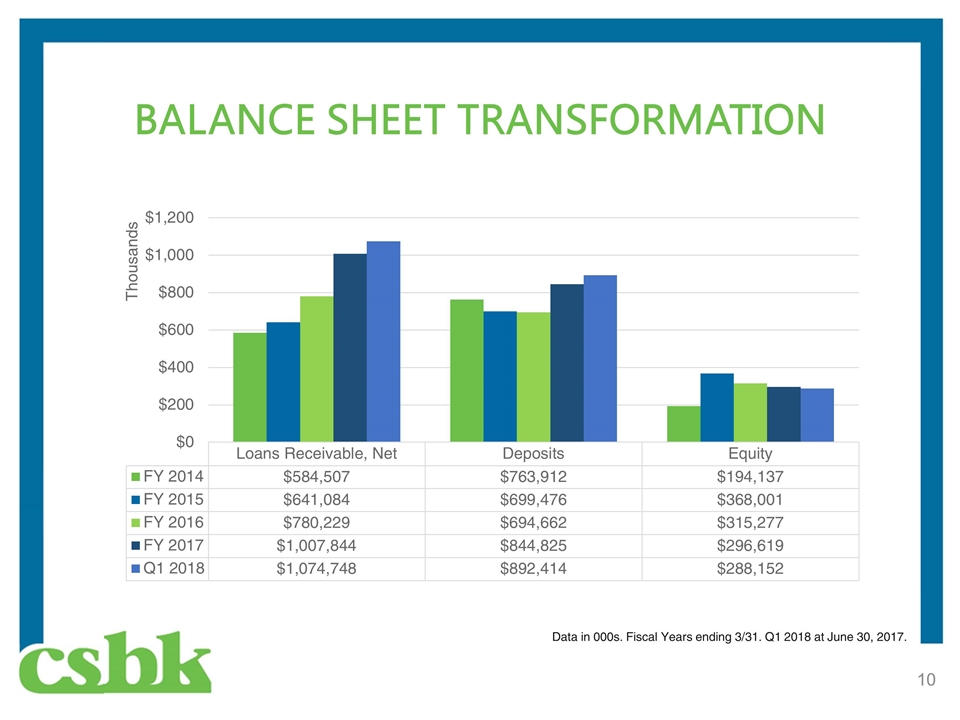
BALANCE SHEET TRANSFORMATION Data in 000s. Fiscal Years ending 3/31. Q1 2018 at June 30, 2017.
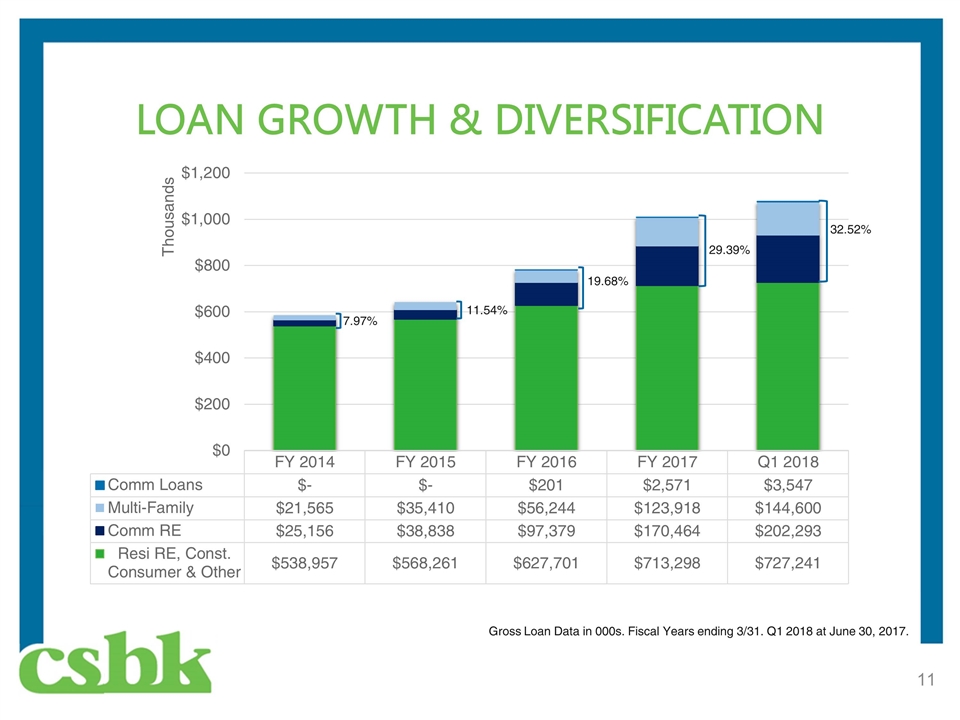
LOAN GROWTH & DIVERSIFICATION 32.52% Gross Loan Data in 000s. Fiscal Years ending 3/31. Q1 2018 at June 30, 2017. 11.54% 29.39% 7.97%
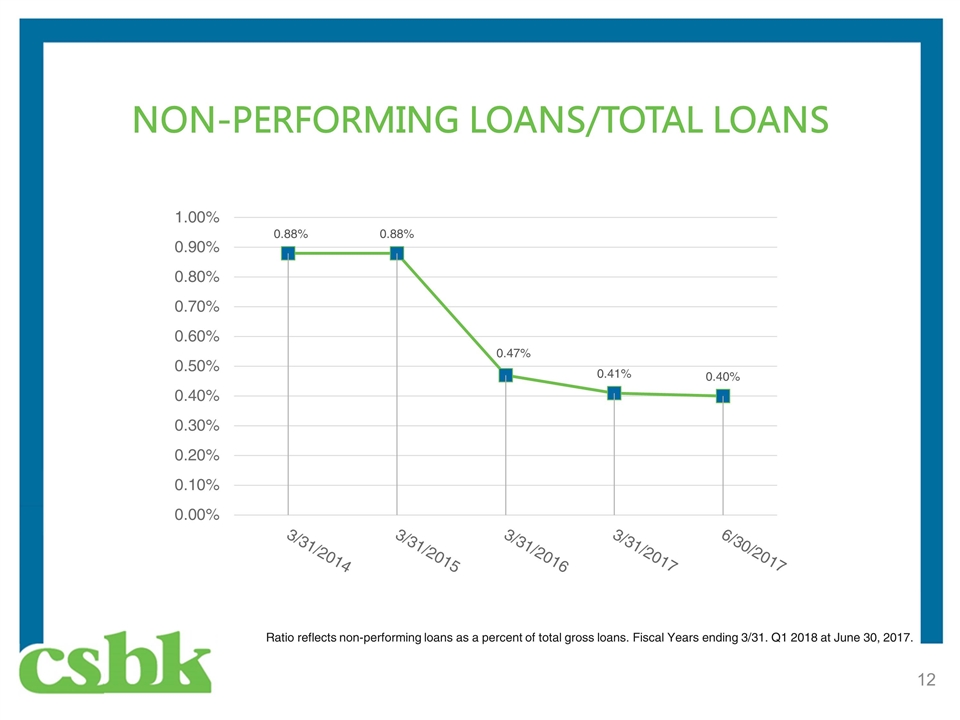
NON-PERFORMING LOANS/TOTAL LOANS Ratio reflects non-performing loans as a percent of total gross loans. Fiscal Years ending 3/31. Q1 2018 at June 30, 2017.
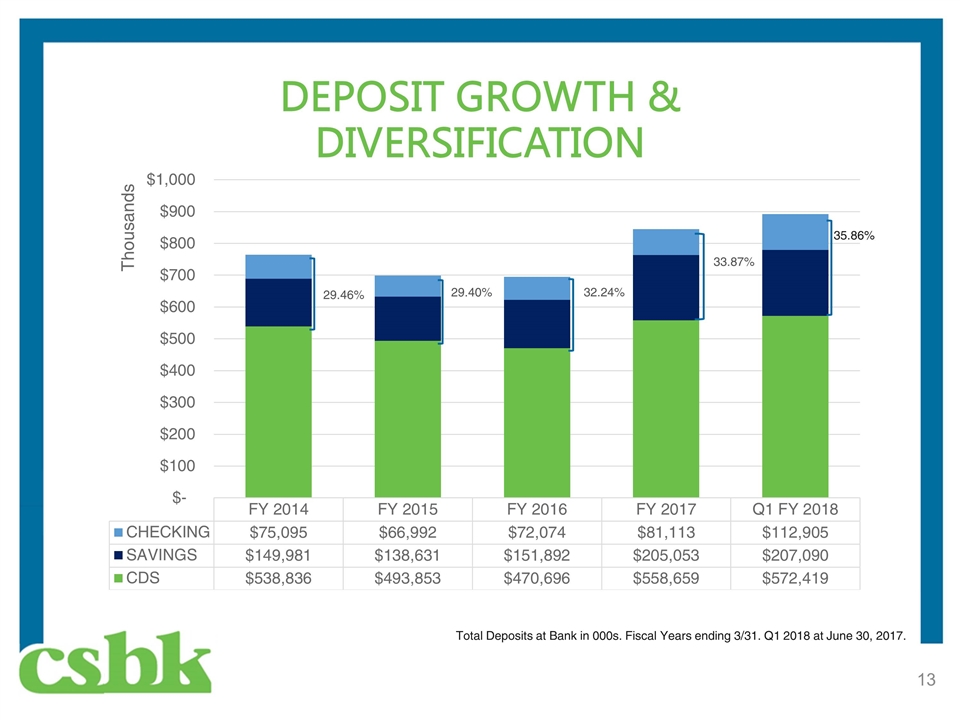
DEPOSIT GROWTH & DIVERSIFICATION 35.86% Total Deposits at Bank in 000s. Fiscal Years ending 3/31. Q1 2018 at June 30, 2017.
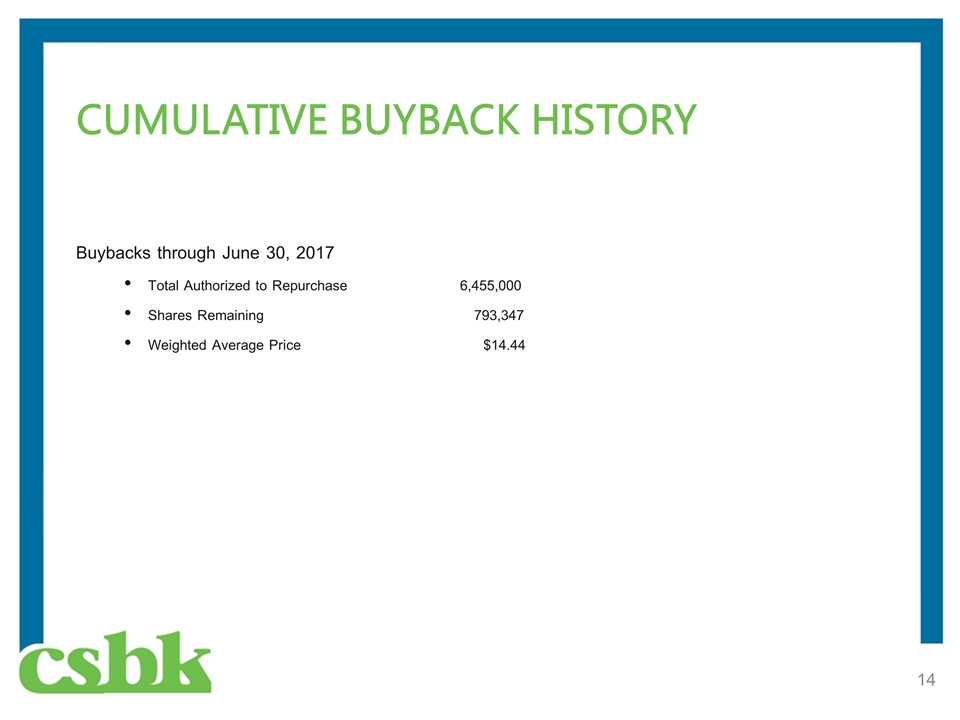
Buybacks through June 30, 2017 Total Authorized to Repurchase6,455,000 Shares Remaining 793,347 Weighted Average Price $14.44 CUMULATIVE BUYBACK HISTORY
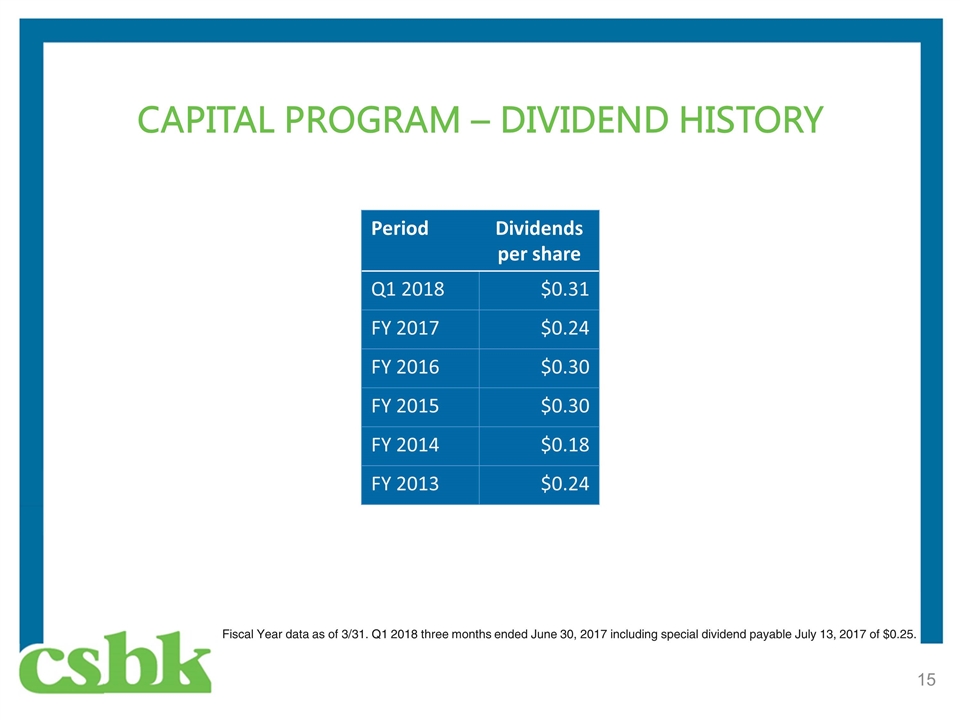
CAPITAL PROGRAM – DIVIDEND HISTORY Period Dividends per share Q1 2018 $0.31 FY 2017 $0.24 FY 2016 $0.30 FY 2015 $0.30 FY 2014 $0.18 FY 2013 $0.24 Fiscal Year data as of 3/31. Q1 2018 three months ended June 30, 2017 including special dividend payable July 13, 2017 of $0.25.

Thank you for your continued support.
