Attached files
| file | filename |
|---|---|
| EX-99.1 - EX-99.1 - CENTURY CASINOS INC /CO/ | c147-20170807xex99_1.htm |
| 8-K - 8-K - CENTURY CASINOS INC /CO/ | c147-20170807x8k.htm |
 CENTURY CASINOS Financial ResultsQ2 2017
 Forward-Looking Statements, Business Environment and Risk Factors This presentation may contain “forward-looking statements” within the meaning of Section 27A of the Securities Act of 1933, as amended, Section 21E of the Securities Exchange Act of 1934, as amended (the “Exchange Act”), and the Private Securities Litigation Reform Act of 1995. In addition, Century Casinos, Inc. (together with its subsidiaries, the “Company”) may make other written and oral communications from time to time that contain such statements. Forward-looking statements include statements as to industry trends and future expectations of the Company and other matters that do not relate strictly to historical facts and are based on certain assumptions by management at the time such statements are made. Forward-looking statements in this presentation include statements regarding future results of operations, operating efficiencies, synergies and operational performance, the prospects for and timing and costs of new projects, projects in development and other opportunities, including the Century Mile and Saw Close Casino projects, debt repayment, investments in joint ventures, outcomes of legal proceedings and plans for our casinos and our Company. These statements are often identified by the use of words such as “may,” “will,” “expect,” “believe,” “anticipate,” “intend,” “could,” “estimate,” or “continue,” and similar expressions or variations. These statements are based on the beliefs and assumptions of the management of the Company based on information currently available to management. Such forward-looking statements are subject to risks, uncertainties and other factors that could cause actual results to differ materially from future results expressed or implied by such forward-looking statements. Important factors that could cause actual results to differ materially from the forward-looking statements include, among others, the risks described in the section entitled “Risk Factors” under Item 1A in our Annual Report on Form 10-K for the year ended December 31, 2016 and our subsequent periodic and current reports filed with the SEC. We caution the reader to carefully consider such factors. Furthermore, such forward-looking statements speak only as of the date on which such statements are made. We undertake no obligation to update any forward-looking statements to reflect events or circumstances after the date of such statements. In this presentation the term “USD” refers to US dollars, the term “CAD” refers to Canadian dollars, the term “PLN” refers to Polish zloty and the term “GBP” refers to the British pound. Adjusted EBITDA and Adjusted EBITDA margin are non-GAAP financial measures. See Appendix A for the definition and reconciliation of Adjusted EBITDA and Adjusted EBITDA margin. The 2016 financial statements reflect adjustments to net operating revenue, earnings from operations, net earnings attributable to Century Casinos, Inc. shareholders and Adjusted EBITDA to correct an erroneously recognized reduction in pari-mutuel revenue totaling $0.7 million (CAD 0.9 million) in the six months ended June 30, 2016.Amounts presented are rounded. As such, rounding differences could occur in period-over-period changes and percentages reported throughout this presentation.
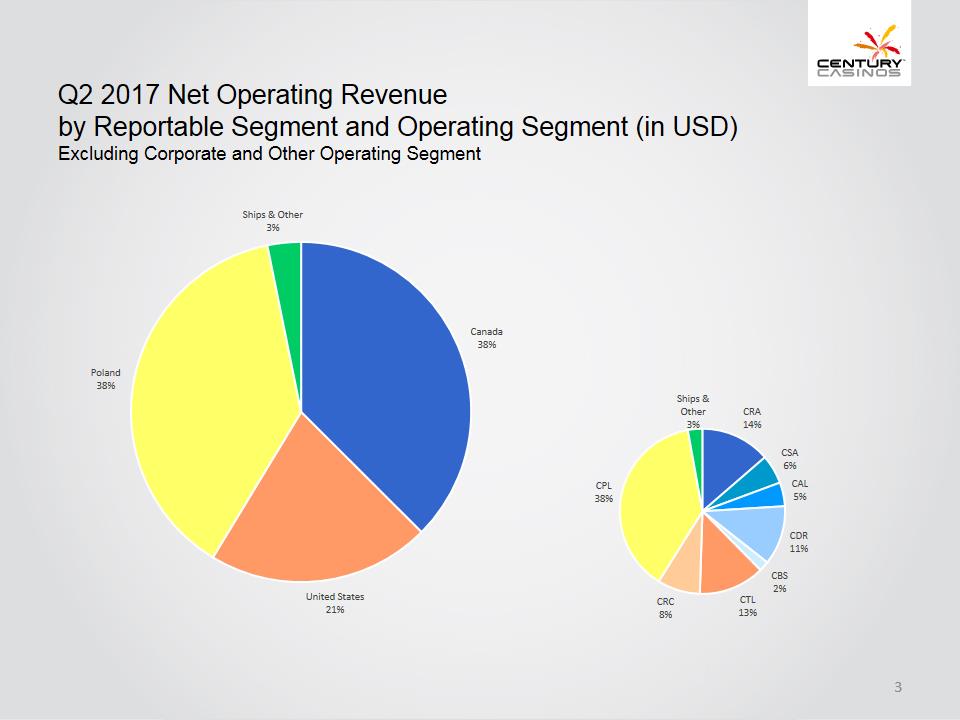 Q2 2017 Net Operating Revenue by Reportable Segment and Operating Segment (in USD)Excluding Corporate and Other Operating SegmentCanada38%United States21%Poland38%Ships & Other3%CRA14%CSA6%CAL5%CDR11%CBS2%CTL13%CRC8%CPL38%Ships & Other3%
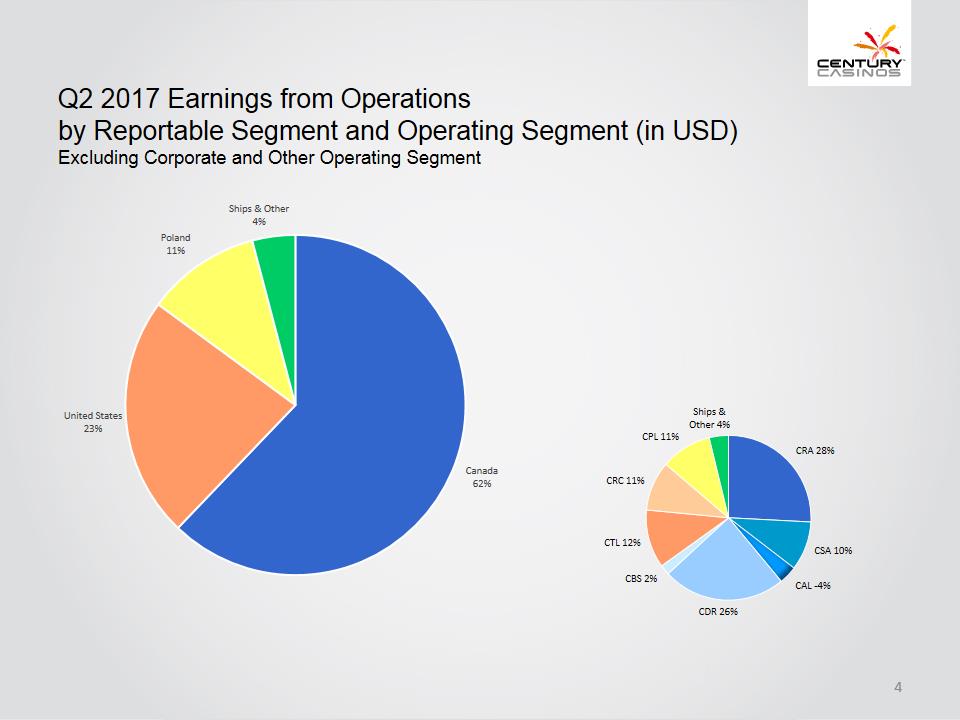 Q2 2017 Earnings from Operations by Reportable Segment and Operating Segment (in USD)Excluding Corporate and Other Operating SegmentCanada62%United States23%Poland11%Ships & Other4%CRA28%CSA10%CAL-4%CDR26%CBS2%CTL12%CRC11%CPL11%Ships & Other4%
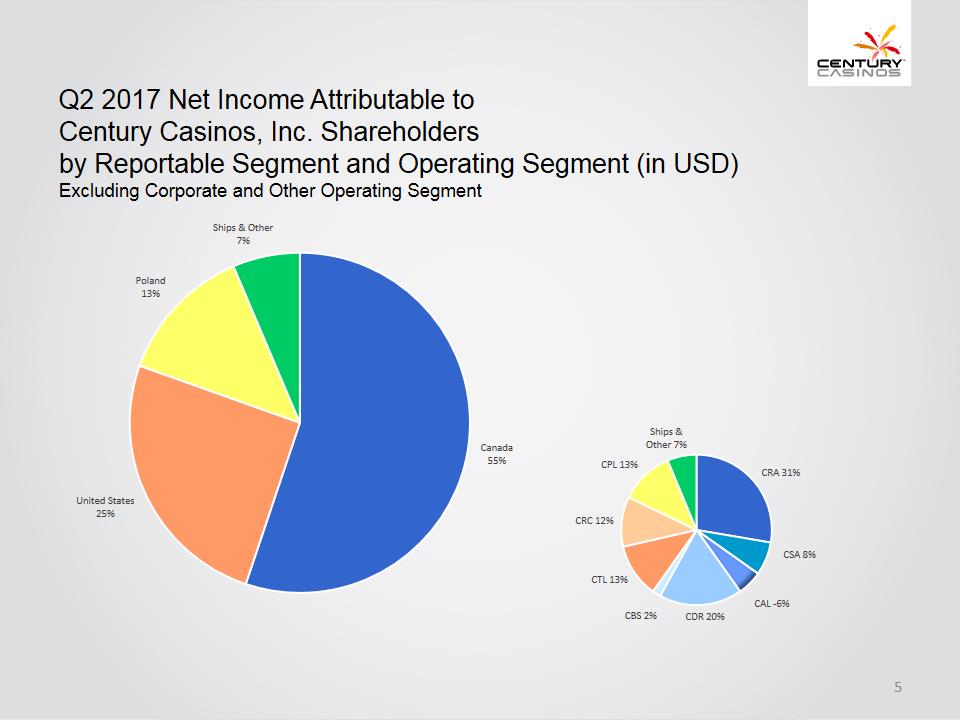 Q2 2017 Net Income Attributable to Century Casinos, Inc. Shareholders by Reportable Segment and Operating Segment (in USD)Excluding Corporate and Other Operating SegmentCanada55%United States25%Poland13%Ships & Other7%CRA31%CSA8%CAL-6%CDR20%CBS2%CTL13%CRC12%CPL13%Ships & Other7%
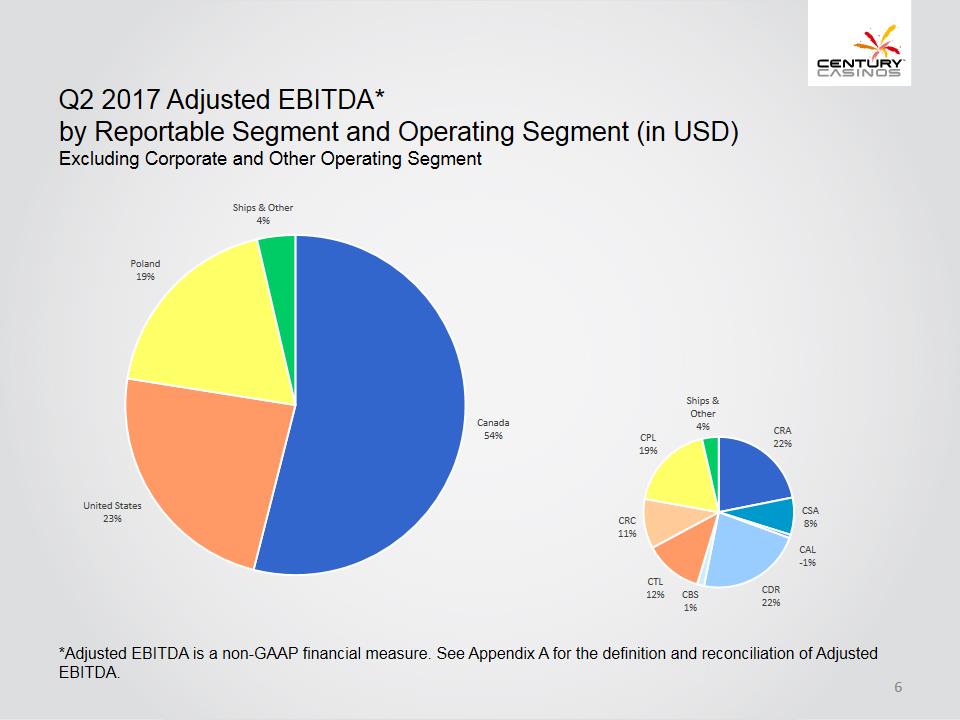 Q2 2017 Adjusted EBITDA*by Reportable Segment and Operating Segment (in USD)Excluding Corporate and Other Operating SegmentCanada54%United States23%Poland19%Ships & Other4%CRA22%CSA8%CAL-1%CDR22%CBS1%CTL12%CRC11%CPL19%Ships & Other4%*Adjusted EBITDA is a non-GAAP financial measure. See Appendix A for the definition and reconciliation of Adjusted EBITDA.
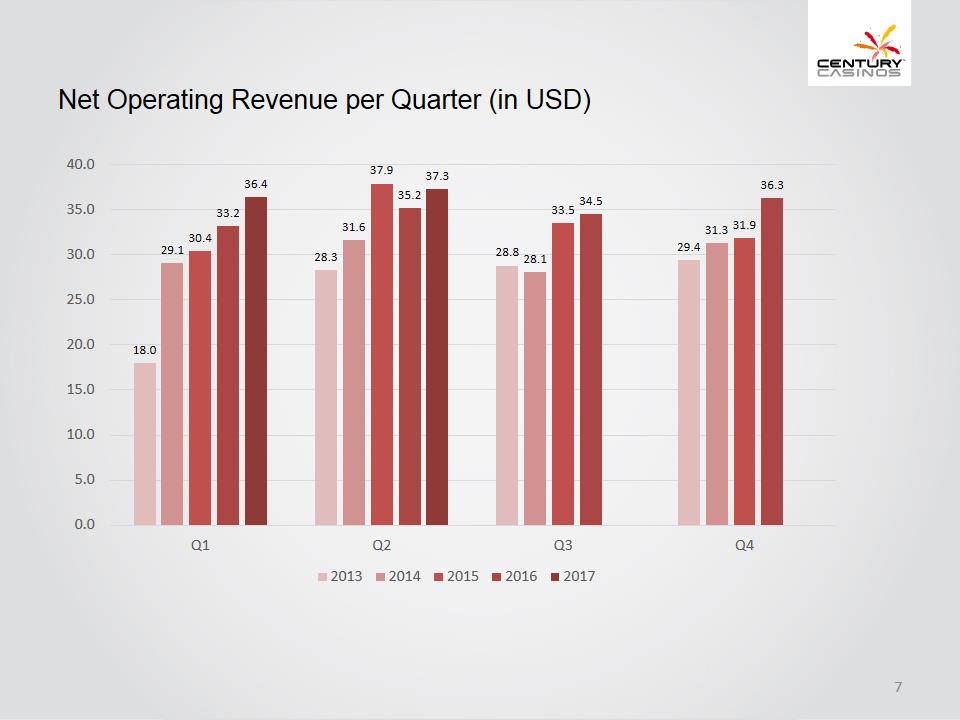 Net Operating Revenue per Quarter (in USD)18.028.328.829.429.131.628.131.330.437.933.531.933.235.234.536.336.437.30.05.010.015.020.025.030.035.040.0Q1Q2Q3Q420132014201520162017
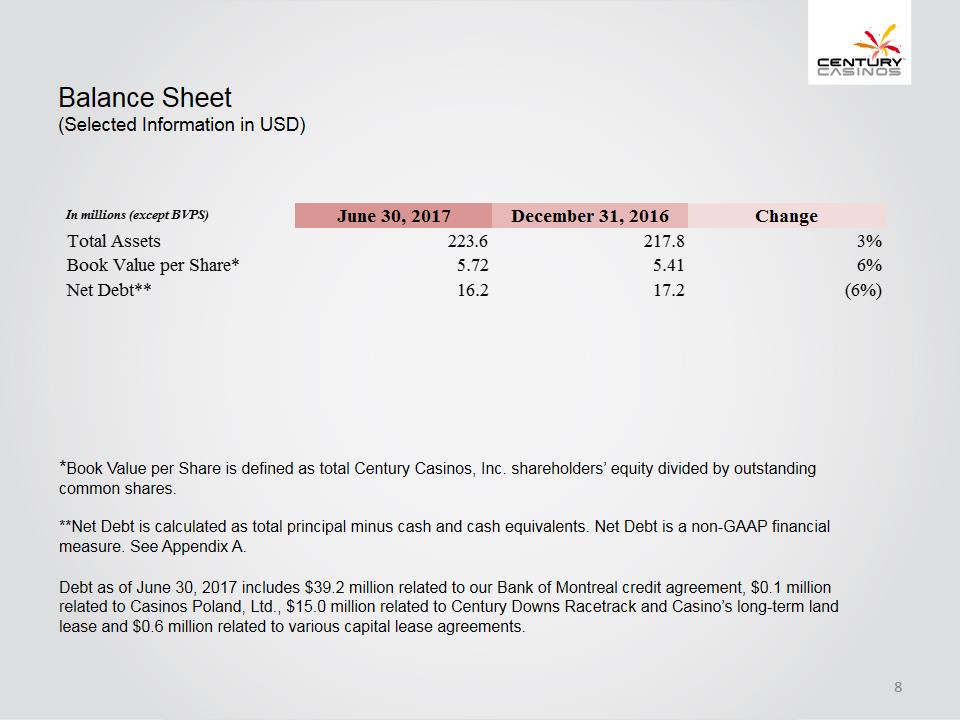 Balance Sheet(Selected Information in USD)In millions (except BVPS)June 30, 2017 December 31, 2016 Change Total Assets 223.6 217.8 3%Book Value per Share* 5.72 5.41 6%Net Debt** 16.2 17.2 (6%)*Book Value per Share is defined as total Century Casinos, Inc. shareholders’ equity divided by outstanding common shares.**Net Debt is calculated as total principal minus cash and cash equivalents. Net Debt is a non-GAAP financial measure. See Appendix A. Debt as of June 30, 2017 includes $39.2 million related to our Bank of Montreal credit agreement, $0.1 million related to Casinos Poland, Ltd., $15.0 million related to Century Downs Racetrack and Casino’s long-term land lease and $0.6 million related to various capital lease agreements.
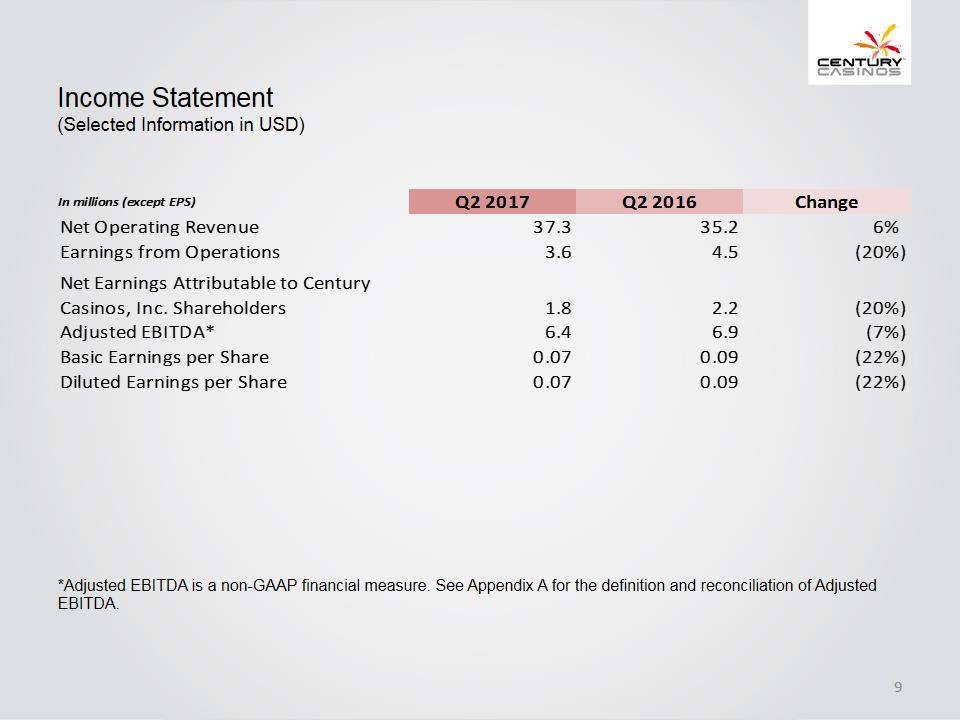 Income Statement (Selected Information in USD)In millions (except EPS) Q2 2017 Q2 2016 Change Net Operating Revenue37.3 35.2 6%Earnings from Operations 3.6 4.5 (20%)Net Earnings Attributable to Century Casinos, Inc. Shareholders 1.8 2.2 (20%)Adjusted EBITDA* 6.4 6.9 (7%)Basic Earnings per Share 0.07 0.09 (22%)Diluted Earnings per Share 0.07 0.09 (22%)*Adjusted EBITDA is a non-GAAP financial measure. See Appendix A for the definition and reconciliation of Adjusted EBITDA.
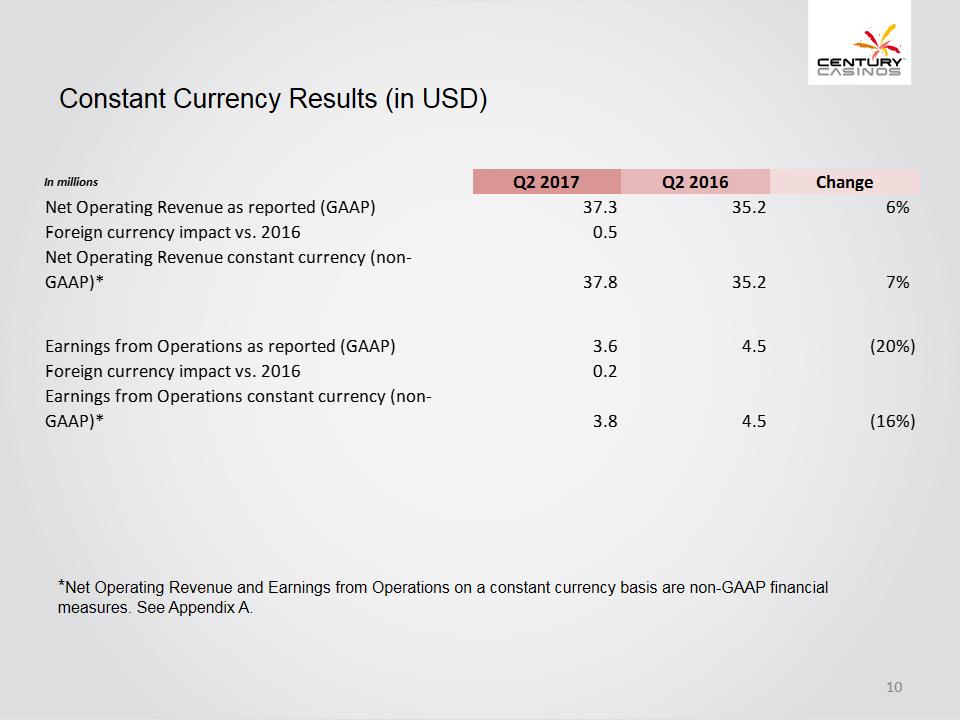 Constant Currency Results (in USD)In millions Q2 2017 Q2 2016 Change Net Operating Revenue as reported (GAAP) 37.3 35.2 6%Foreign currency impact vs. 2016 0.5 Net Operating Revenue constant currency (non-GAAP)* 37.8 35.2 7%Earnings from Operations as reported (GAAP) 3.6 4.5 (20%)Foreign currency impact vs. 2016 0.2 Earnings from Operations constant currency (non-GAAP)* 3.8 4.5 (16%)*Net Operating Revenue and Earnings from Operations on a constant currency basis are non-GAAP financial measures. See Appendix A.
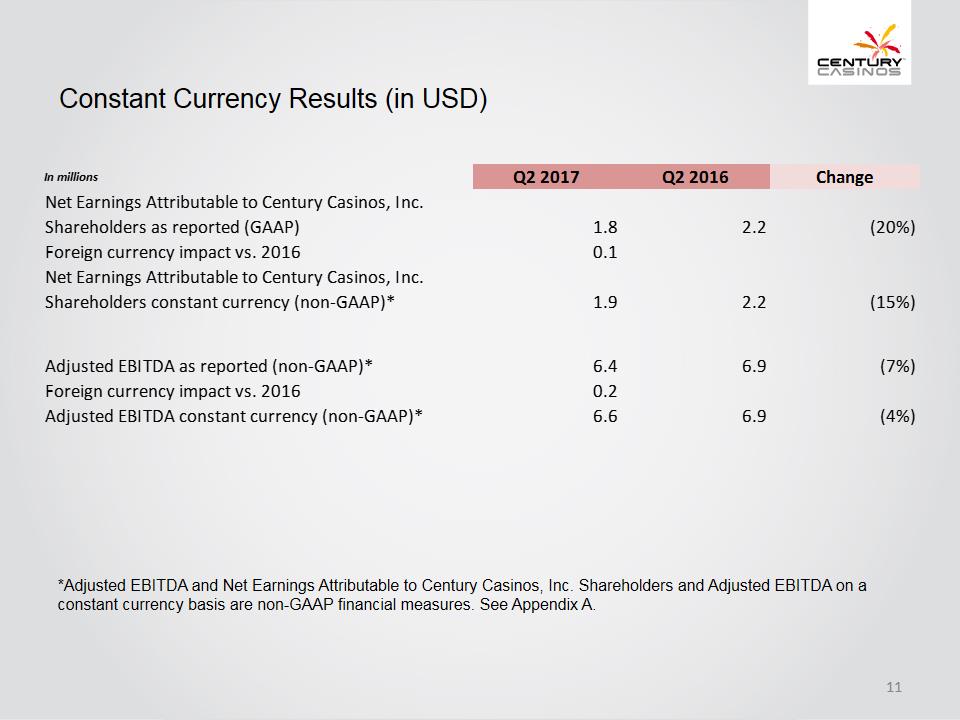 Constant Currency Results (in USD)In millions Q2 2017 Q2 2016 Change Net Earnings Attributable to Century Casinos, Inc. Shareholders as reported (GAAP) 1.8 2.2 (20%)Foreign currency impact vs. 2016 0.1 Net Earnings Attributable to Century Casinos, Inc. Shareholders constant currency (non-GAAP)* 1.9 2.2 (15%)Adjusted EBITDA as reported (non-GAAP)* 6.4 6.9 (7%)Foreign currency impact vs. 2016 0.2 Adjusted EBITDA constant currency (non-GAAP)* 6.6 6.9 (4%)*Adjusted EBITDA and Net Earnings Attributable to Century Casinos, Inc. Shareholders and Adjusted EBITDA on a constant currency basis are non-GAAP financial measures. See Appendix A.
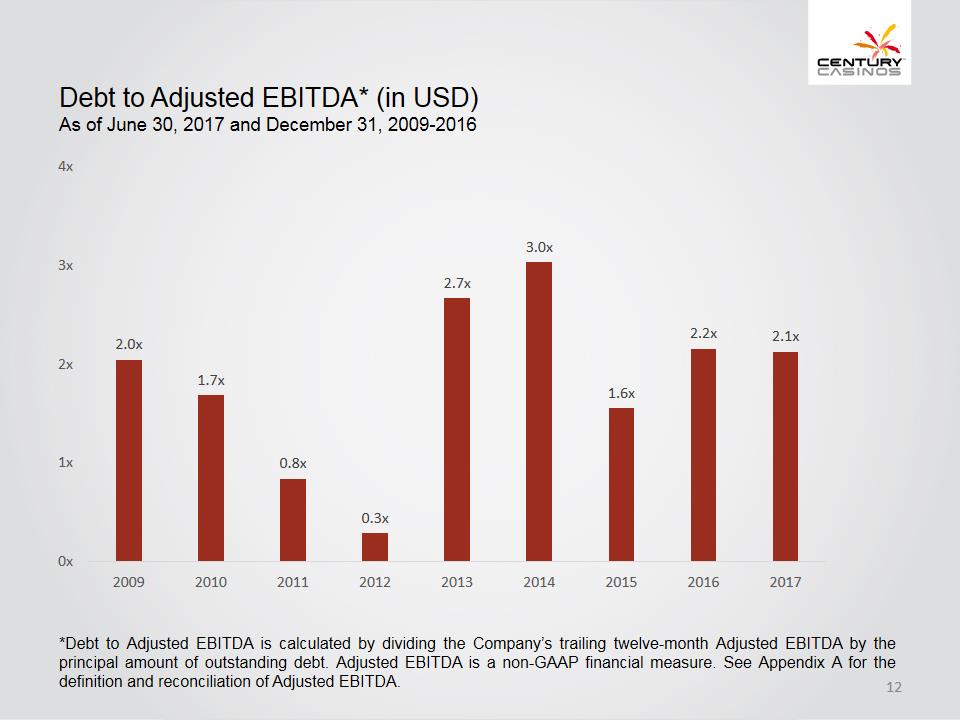 Debt to Adjusted EBITDA* (in USD)As of June 30, 2017 and December 31, 2009-20162.0x1.7x0.8x0.3x2.7x3.0x1.6x2.2x2.1x0x1x2x3x4x200920102011201220132014201520162017*Debt to Adjusted EBITDA is calculated by dividing the Company’s trailing twelve-month Adjusted EBITDA by the principal amount of outstanding debt. Adjusted EBITDA is a non-GAAP financial measure. See Appendix A for the definition and reconciliation of Adjusted EBITDA.
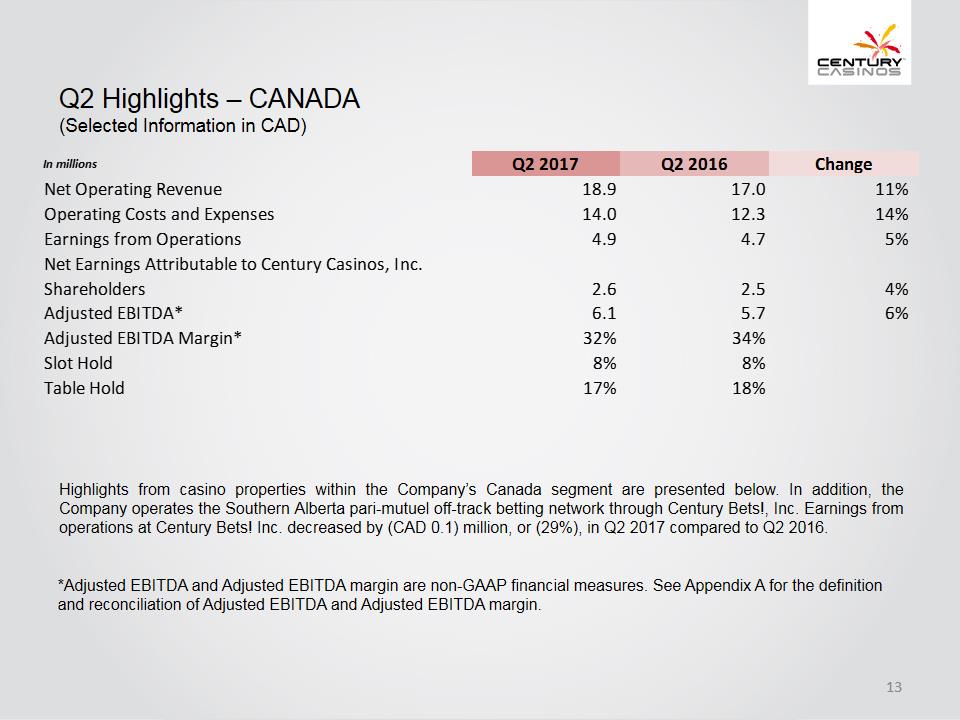 Q2 Highlights – CANADA (Selected Information in CAD)In millions Q2 2017 Q2 2016 Change Net Operating Revenue 18.9 17.0 11%Operating Costs and Expenses 14.0 12.3 14%Earnings from Operations 4.9 4.7 5%Net Earnings Attributable to Century Casinos, Inc. Shareholders 2.6 2.5 4%Adjusted EBITDA* 6.1 5.7 6%Adjusted EBITDA Margin* 32% 34%Slot Hold 8% 8%Table Hold 17% 18%Highlights from casino properties within the Company’s Canada segment are presented below. In addition, the Company operates the Southern Alberta pari-mutuel off-track betting network through Century Bets!, Inc. Earnings from operations at Century Bets! Inc. decreased by (CAD 0.1) million, or (29%), in Q2 2017 compared to Q2 2016.*Adjusted EBITDA and Adjusted EBITDA margin are non-GAAP financial measures. See Appendix A for the definition and reconciliation of Adjusted EBITDA and Adjusted EBITDA margin.
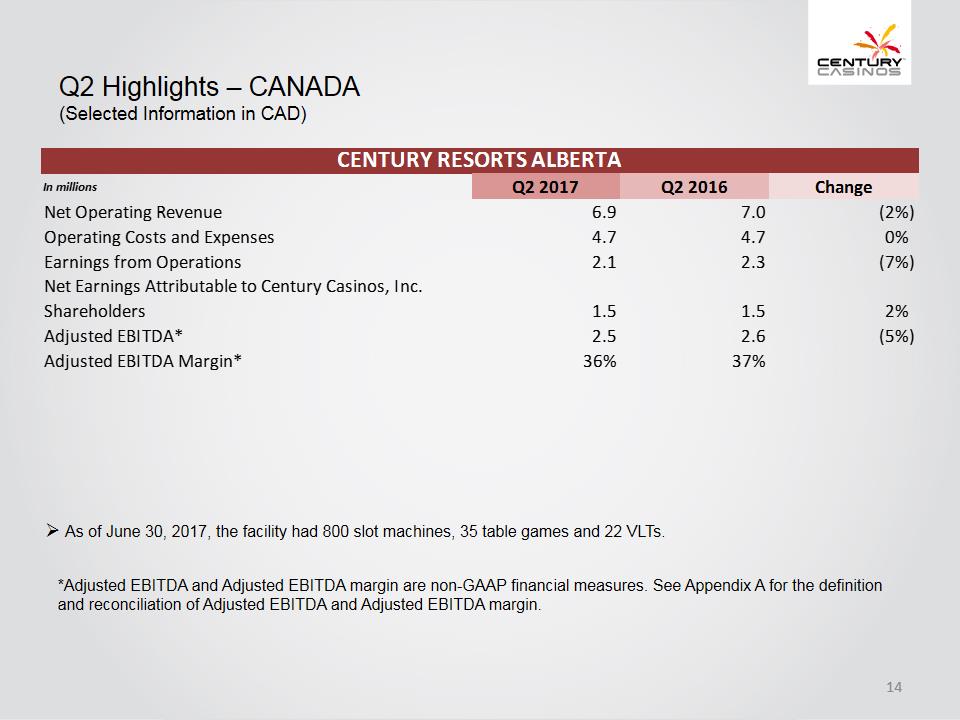 Q2 Highlights – CANADA(Selected Information in CAD)CENTURY RESORTS ALBERTA In millions Q2 2017 Q2 2016 Change Net Operating Revenue 6.9 7.0 (2%)Operating Costs and Expenses 4.7 4.7 0%Earnings from Operations 2.1 2.3 (7%)Net Earnings Attributable to Century Casinos, Inc. Shareholders 1.5 1.5 2%Adjusted EBITDA* 2.5 2.6 (5%)Adjusted EBITDA Margin* 36% 37%As of June 30, 2017, the facility had 800 slot machines, 35 table games and 22 VLTs.*Adjusted EBITDA and Adjusted EBITDA margin are non-GAAP financial measures. See Appendix A for the definition and reconciliation of Adjusted EBITDA and Adjusted EBITDA margin.
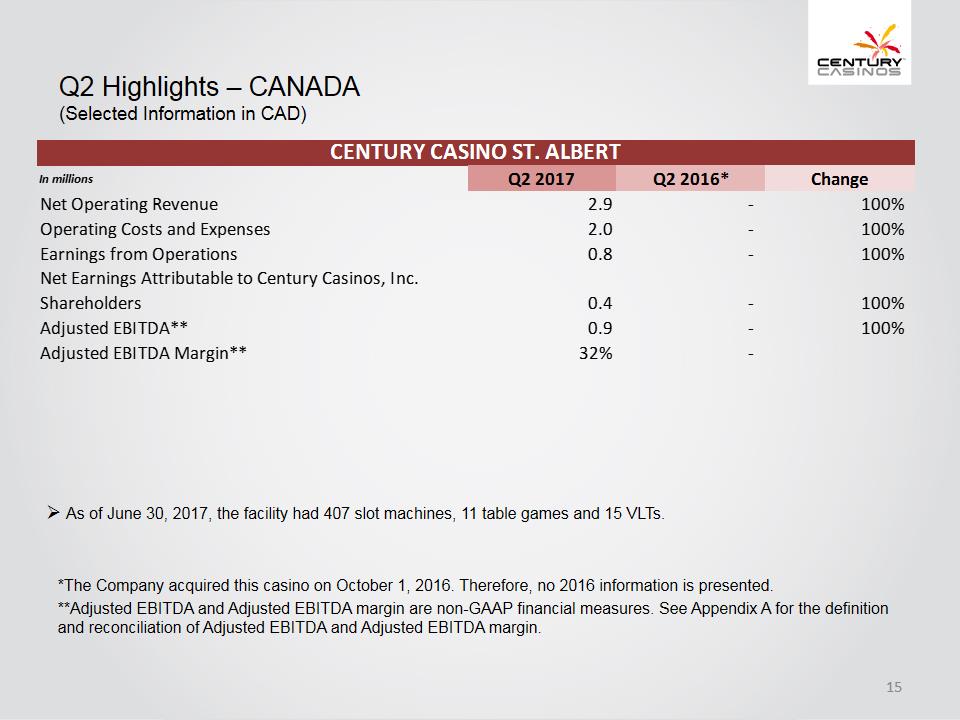 Q2 Highlights – CANADA(Selected Information in CAD)CENTURY CASINO ST. ALBERT In millions Q2 2017 Q2 2016* Change Net Operating Revenue 2.9 - 100%Operating Costs and Expenses 2.0 - 100%Earnings from Operations0.8 - 100%Net Earnings Attributable to Century Casinos, Inc. Shareholders 0.4 - 100%Adjusted EBITDA** 0.9 - 100%Adjusted EBITDA Margin** 32%As of June 30, 2017, the facility had 407 slot machines, 11 table games and 15 VLTs.*The Company acquired this casino on October 1, 2016. Therefore, no 2016 information is presented.**Adjusted EBITDA and Adjusted EBITDA margin are non-GAAP financial measures. See Appendix A for the definition and reconciliation of Adjusted EBITDA and Adjusted EBITDA margin.
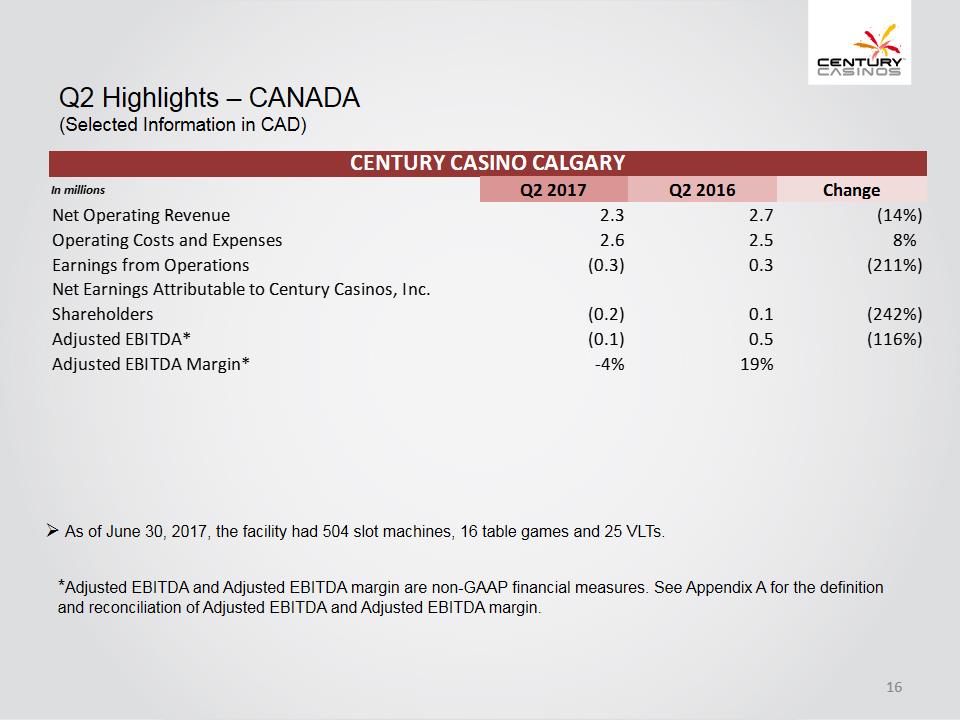 Q2 Highlights – CANADA(Selected Information in CAD)CENTURY CASINO CALGARY In millions Q2 2017 Q2 2016 Change Net Operating Revenue 2.3 2.7 (14%)Operating Costs and Expenses 2.6 2.5 8%Earnings from Operations (0.3) 0.3 (211%)Net Earnings Attributable to Century Casinos, Inc. Shareholders (0.2) 0.1 (242%)Adjusted EBITDA* (0.1) 0.5 (116%)Adjusted EBITDA Margin* -4% 19%As of June 30, 2017, the facility had 504 slot machines, 16 table games and 25 VLTs.*Adjusted EBITDA and Adjusted EBITDA margin are non-GAAP financial measures. See Appendix A for the definition and reconciliation of Adjusted EBITDA and Adjusted EBITDA margin.
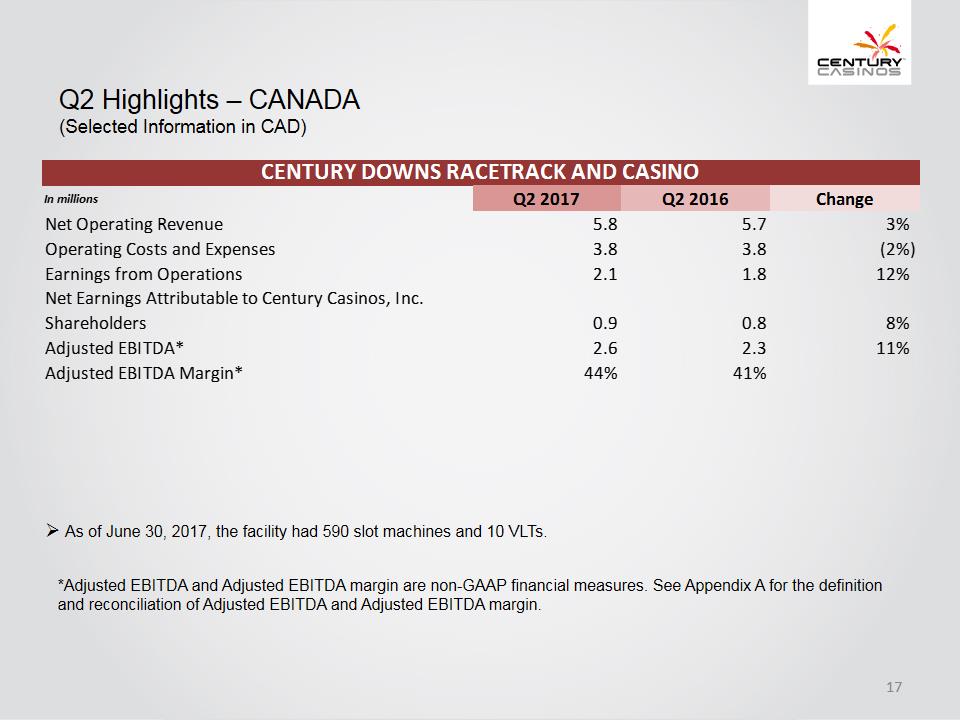 Q2 Highlights – CANADA(Selected Information in CAD)CENTURY DOWNS RACETRACK AND CASINO In millions Q2 2017 Q2 2016 Change Net Operating Revenue 5.8 5.7 3%Operating Costs and Expenses 3.8 3.8 (2%)Earnings from Operations 2.1 1.8 12%Net Earnings Attributable to Century Casinos, Inc. Shareholders 0.9 0.8 8%Adjusted EBITDA* 2.6 2.3 11%Adjusted EBITDA Margin* 44% 41%As of June 30, 2017, the facility had 590 slot machines and 10 VLTs.*Adjusted EBITDA and Adjusted EBITDA margin are non-GAAP financial measures. See Appendix A for the definition and reconciliation of Adjusted EBITDA and Adjusted EBITDA margin.
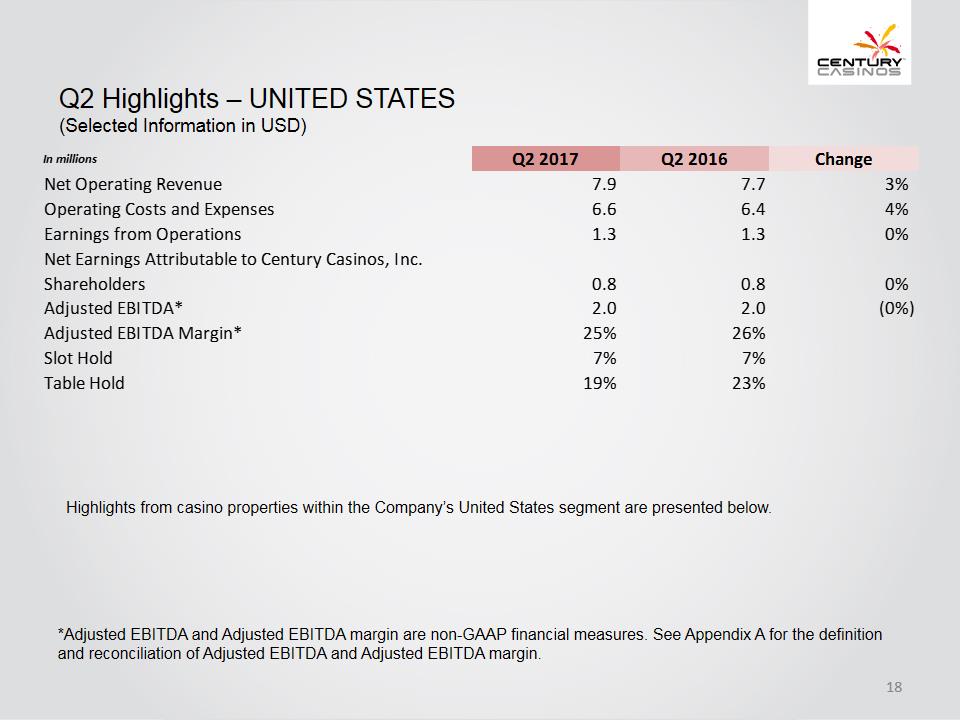 Q2 Highlights – UNITED STATES(Selected Information in USD)In millions Q2 2017 Q2 2016 Change Net Operating Revenue 7.9 7.7 3%Operating Costs and Expenses 6.6 6.4 4%Earnings from Operations 1.3 1.3 0%Net Earnings Attributable to Century Casinos, Inc. Shareholders 0.8 0.8 0%Adjusted EBITDA* 2.0 2.0 (0%)Adjusted EBITDA Margin* 25% 26%Slot Hold 7% 7%Table Hold 19% 23%Highlights from casino properties within the Company’s United States segment are presented below.*Adjusted EBITDA and Adjusted EBITDA margin are non-GAAP financial measures. See Appendix A for the definition and reconciliation of Adjusted EBITDA and Adjusted EBITDA margin.
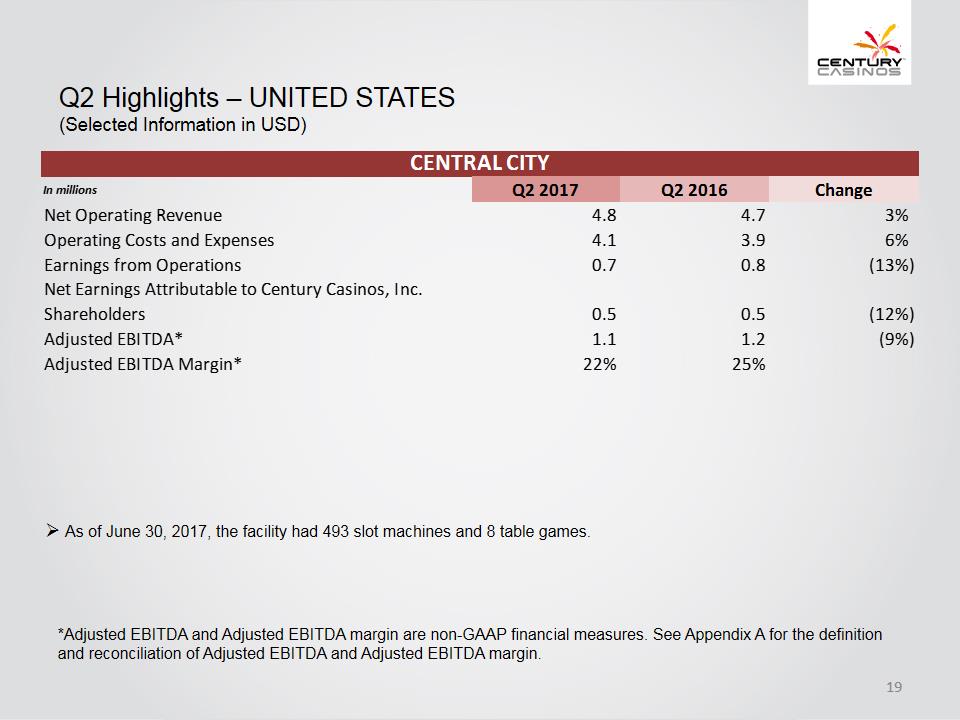 Q2 Highlights – UNITED STATES(Selected Information in USD)CENTRAL CITY In millions Q2 2017 Q2 2016 Change Net Operating Revenue 4.8 4.7 3%Operating Costs and Expenses 4.1 3.9 6%Earnings from Operations 0.7 0.8 (13%)Net Earnings Attributable to Century Casinos, Inc. Shareholders 0.5 0.5 (12%)Adjusted EBITDA* 1.1 1.2 (9%)Adjusted EBITDA Margin* 22% 25%As of June 30, 2017, the facility had 493 slot machines and 8 table games.*Adjusted EBITDA and Adjusted EBITDA margin are non-GAAP financial measures. See Appendix A for the definition and reconciliation of Adjusted EBITDA and Adjusted EBITDA margin.
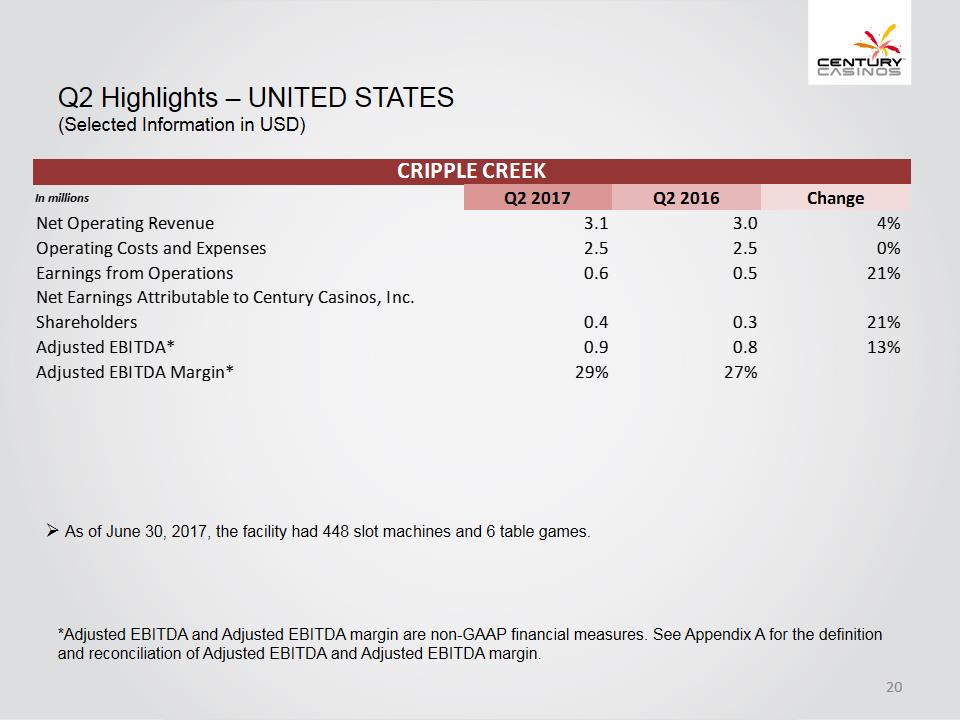 Q2 Highlights – UNITED STATES(Selected Information in USD)CRIPPLE CREEK In millions Q2 2017 Q2 2016 Change Net Operating Revenue 3.1 3.0 4%Operating Costs and Expenses 2.5 2.5 0%Earnings from Operations 0.6 0.5 21%Net Earnings Attributable to Century Casinos, Inc. Shareholders 0.4 0.3 21%Adjusted EBITDA* 0.9 0.8 13%Adjusted EBITDA Margin* 29% 27%As of June 30, 2017, the facility had 448 slot machines and 6 table games.*Adjusted EBITDA and Adjusted EBITDA margin are non-GAAP financial measures. See Appendix A for the definition and reconciliation of Adjusted EBITDA and Adjusted EBITDA margin.
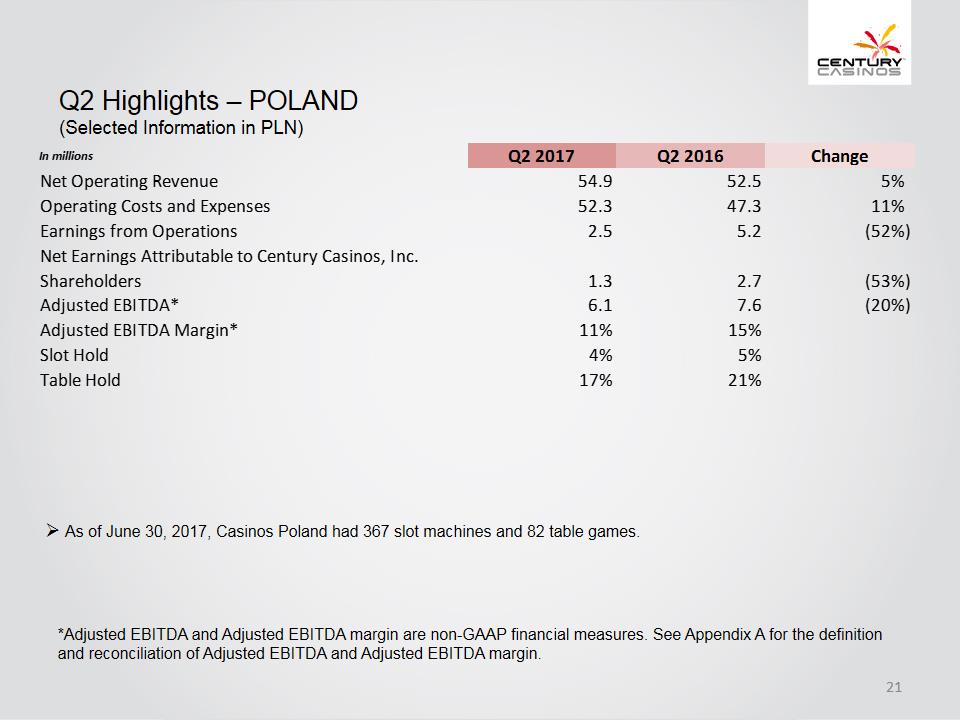 Q2 Highlights – POLAND(Selected Information in PLN)In millions Q2 2017 Q2 2016 Change Net Operating Revenue 54.9 52.5 5%Operating Costs and Expenses 52.3 47.3 11%Earnings from Operations 2.5 5.2 (52%)Net Earnings Attributable to Century Casinos, Inc. Shareholders 1.3 2.7 (53%)Adjusted EBITDA* 6.1 7.6 (20%)Adjusted EBITDA Margin* 11% 15%Slot Hold 4% 5%Table Hold 17% 21%As of June 30, 2017, Casinos Poland had 367 slot machines and 82 table games.*Adjusted EBITDA and Adjusted EBITDA margin are non-GAAP financial measures. See Appendix A for the definition and reconciliation of Adjusted EBITDA and Adjusted EBITDA margin.
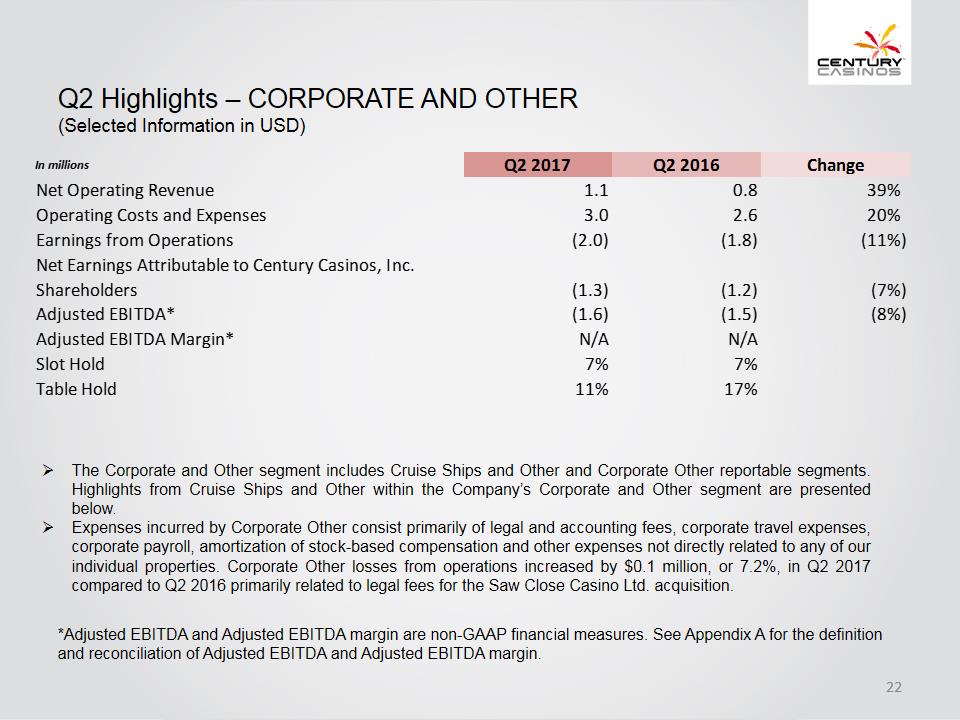 Q2 Highlights – CORPORATE AND OTHER(Selected Information in USD)In millions Q2 2017 Q2 2016 Change Net Operating Revenue 1.1 0.8 39%Operating Costs and Expenses 3.0 2.6 20%Earnings from Operations (2.0) (1.8) (11%)Net Earnings Attributable to Century Casinos, Inc. Shareholders (1.3) (1.2) (7%)Adjusted EBITDA* (1.6) (1.5) (8%)Adjusted EBITDA Margin* N/A N/A Slot Hold 7% 7%Table Hold 11% 17%The Corporate and Other segment includes Cruise Ships and Other and Corporate Other reportable segments. Highlights from Cruise Ships and Other within the Company’s Corporate and Other segment are presented below. Expenses incurred by Corporate Other consist primarily of legal and accounting fees, corporate travel expenses, corporate payroll, amortization of stock-based compensation and other expenses not directly related to any of our individual properties. Corporate Other losses from operations increased by $0.1 million, or 7.2%, in Q2 2017 compared to Q2 2016 primarily related to legal fees for the Saw Close Casino Ltd. acquisition.*Adjusted EBITDA and Adjusted EBITDA margin are non-GAAP financial measures. See Appendix A for the definition and reconciliation of Adjusted EBITDA and Adjusted EBITDA margin.
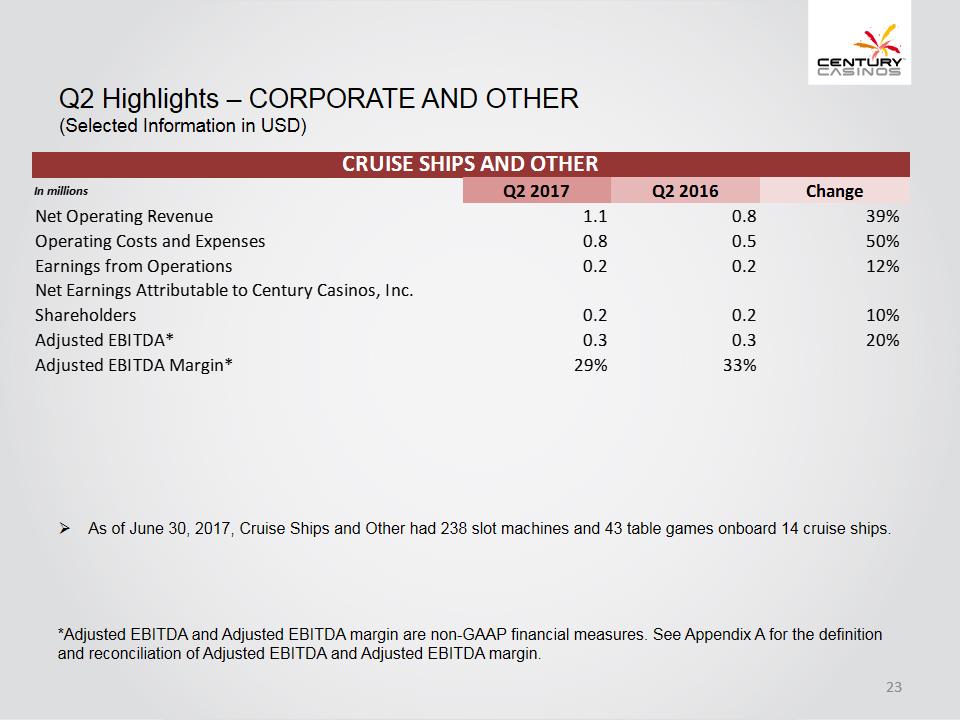 Q2 Highlights – CORPORATE AND OTHER(Selected Information in USD)CRUISE SHIPS AND OTHER In millions Q2 2017 Q2 2016 Change Net Operating Revenue 1.1 0.8 39%Operating Costs and Expenses 0.8 0.5 50%Earnings from Operations 0.2 0.2 12%Net Earnings Attributable to Century Casinos, Inc. Shareholders 0.2 0.2 10%Adjusted EBITDA* 0.3 0.3 20%Adjusted EBITDA Margin* 29% 33%As of June 30, 2017, Cruise Ships and Other had 238 slot machines and 43 table games onboard 14 cruise ships.*Adjusted EBITDA and Adjusted EBITDA margin are non-GAAP financial measures. See Appendix A for the definition and reconciliation of Adjusted EBITDA and Adjusted EBITDA margin.
 Q2 Highlights – ADDITIONAL PROJECTS UNDER DEVELOPMENT Saw Close Casino Ltd. In June 2017, the Company acquired 100% of the outstanding common stock and the casino licenses held by Saw Close Casino Ltd. (“SCCL”). The Company plans to utilize the casino licenses to develop and operate a casino in Bath, England. The Company estimates that the project will cost approximately $7.5 million and that the casino will open in the first half of 2018, subject to the receipt of certain regulatory and governmental approvals. Century Mile In September 2016, the Company was selected as the successful applicant by Horse Racing Alberta to own, build and operate a horse racing facility in the Edmonton market area, which the Company will operate as Century Mile Racetrack and Casino. Century Mile will be a one-mile horse racetrack and multi-level racing and entertainment center. The project is located on Edmonton International Airport land close to the city of Leduc, south of Edmonton and positioned off Queen Elizabeth II highway. The Company estimates that the project will cost approximately $46.2 million. Construction of the Century Mile project began in July 2017. The Company estimates that construction of the project will take approximately 15 months and that it will be completed by the fourth quarter of 2018. The Company is seeking to obtain financing for the Century Mile project.
 Appendix A – NON-GAAP FINANCIAL MEASURES The Company supplements its condensed consolidated financial statements prepared in accordance with U.S. generally accepted accounting principles (“US GAAP”) by using the following non-GAAP financial measures, which management believes are useful in properly understanding the Company’s short-term and long-term financial trends. Management uses these non-GAAP financial measures to forecast and evaluate the operational performance of the Company as well as to compare results of current periods to prior periods on a consolidated basis. Adjusted EBITDA Adjusted EBITDA margin Constant currency results Net Debt Management believes presenting the non-GAAP financial measures used in this presentation provides investors greater transparency to the information used by management for financial and operational decision- making and allows investors to see the Company’s results “through the eyes” of management. Management also believes providing this information better enables our investors to understand the Company’s operating performance and evaluate the methodology used by management to evaluate and measure such performance. The adjustments made to U.S. GAAP financial measures result from facts and circumstances that vary in frequency and impact on the Company’s results of operations. The following is an explanation of each of the adjustments that management excludes in calculating its non-GAAP financial measures.
 Appendix A – NON-GAAP FINANCIAL MEASURES The Company defines Adjusted EBITDA as net earnings (loss) attributable to Century Casinos, Inc. shareholders before interest expense (income), net, income taxes (benefit), depreciation, amortization, non- controlling interest (earnings) losses and transactions, pre-opening expenses, acquisition costs, non-cash stock-based compensation charges, asset impairment costs, (gain) loss on disposition of fixed assets, discontinued operations, (gain) loss on foreign currency transactions and other, gain on business combination and certain other one-time items, such as acquisition costs. Intercompany transactions consisting primarily of management and royalty fees and interest, along with their related tax effects, are excluded from the presentation of net earnings (loss) and Adjusted EBITDA reported for each segment and property. Not all of the aforementioned items occur in each reporting period, but have been included in the definition based on historical activity. These adjustments have no effect on the consolidated results as reported under US GAAP. Adjusted EBITDA is not considered a measure of performance recognized under US GAAP. Management believes that Adjusted EBITDA is a valuable measure of the relative performance of the Company and its properties. The gaming industry commonly uses Adjusted EBITDA as a method of arriving at the economic value of a casino operation. Management uses Adjusted EBITDA to compare the relative operating performance of separate operating units by eliminating the above mentioned items associated with the varying levels of capital expenditures for infrastructure required to generate revenue, and the often high cost of acquiring existing operations. Adjusted EBITDA is used by the Company’s lending institution to gauge operating performance. The Company’s computation of Adjusted EBITDA may be different from, and therefore may not be comparable to, similar measures used by other companies within the gaming industry. Please see the reconciliation of Adjusted EBITDA to net earnings (loss) attributable to Century Casinos, Inc. shareholders below. The Company defines Adjusted EBITDA margin as Adjusted EBITDA divided by net operating revenue. Management uses this margin as one of several measures to evaluate the efficiency of the Company’s casino operations.
 Appendix A – NON-GAAP FINANCIAL MEASURES The impact of foreign exchange rates is highly variable and difficult to predict. The Company uses a constant currency basis to show the impact from foreign exchange rates on current period revenue compared to prior period revenue using the prior period’s foreign exchange rates. In order to properly understand the underlying business trends and performance of the Company’s ongoing operations, management believes that investors may find it useful to consider the impact of excluding changes in foreign exchange rates from the Company’s net operating revenue, net earnings (loss) attributable to Century Casinos, Inc. shareholders and Adjusted EBITDA. The Company defines Net Debt as total long-term debt (including current portion) plus deferred financing costs minus cash and cash equivalents. Net Debt is not considered a liquidity measure recognized under US GAAP. Management believes that Net Debt is a valuable measure of our overall financial situation. Net Debt provides investors with an indication of our ability to pay off all of our long-term debt if it became due simultaneously.
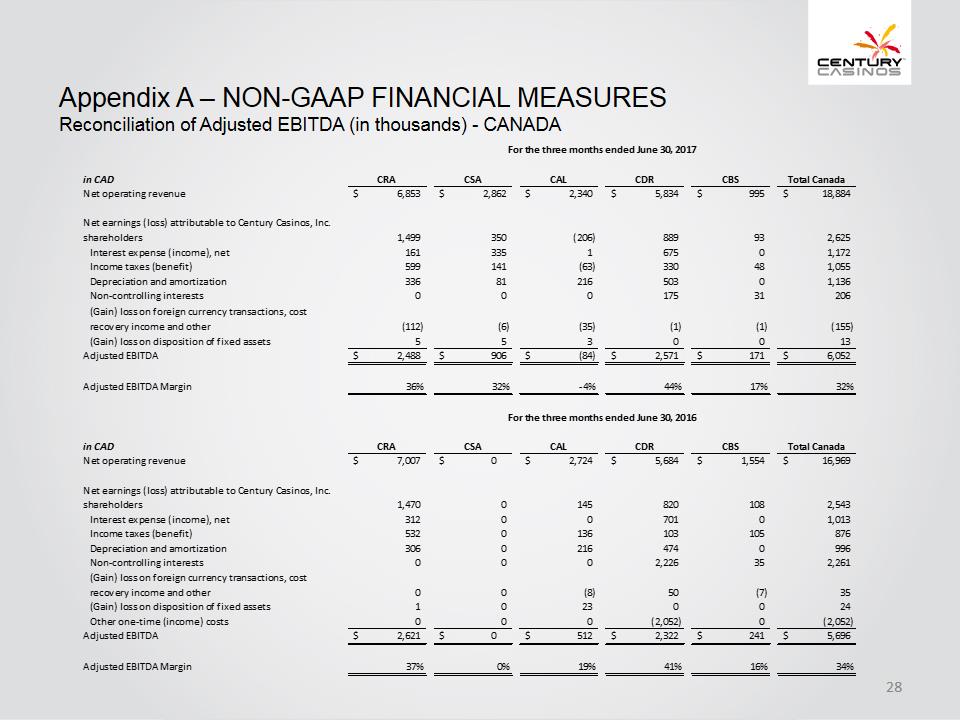 Appendix A –NON-GAAP FINANCIAL MEASURES Reconciliation of Adjusted EBITDA (in thousands) –CANADA For the three months ended June 30, 2017in CAD CRA CSA CAL CDR CBS Total Canada Net operating revenue 6,853 2,862 2,340 5,834 995 18,884 Net earnings (loss) attributable to Century Casinos, Inc. Shareholders 1,499 350 (206) 889 93 2,625Interest expense (income), net 161 335 1 675 0 1,172Income taxes (benefit) 599 141 (63) 330 48 1,055Depreciation and amortization 336 81 216 503 0 1,136Non-controlling interests 0 0 0 175 31 206(Gain) loss on foreign currency transactions, cost recovery income and other (112) (6) (35) (1) (1) (155)(Gain) loss on disposition of fixed assets 5 5 3 0 0 13Adjusted EBITDA 2,488 906 (84) 2,571 171 6,052 Adjusted EBITDA Margin 36% 32% -4% 44% 17% 32%For the three months ended June 30, 2016in CAD CRA CSA CAL CDR CBS Total Canada Net operating revenue 7,007 0 2,724 5,684 1,554 16,969 Net earnings (loss) attributable to Century Casinos, Inc. Shareholders 1,470 0 145 820 108 2,543Interest expense (income), net 312 0 0 701 0 1,013Income taxes (benefit) 532 0 136 103 105 876Depreciation and amortization 306 0 216 474 0 996Non-controlling interests 0 0 0 2,226 35 2,261 (Gain) loss on foreign currency transactions, cost recovery income and other 0 0 (8) 50 (7) 35(Gain) loss on disposition of fixed assets 1 0 23 0 0 24Other one-time (income) costs 0 0 0 (2,052) 0 (2,052)Adjusted EBITDA 2,621 0 512 2,322 241 5,696 Adjusted EBITDA Margin 37% 0% 19% 41% 16% 34%
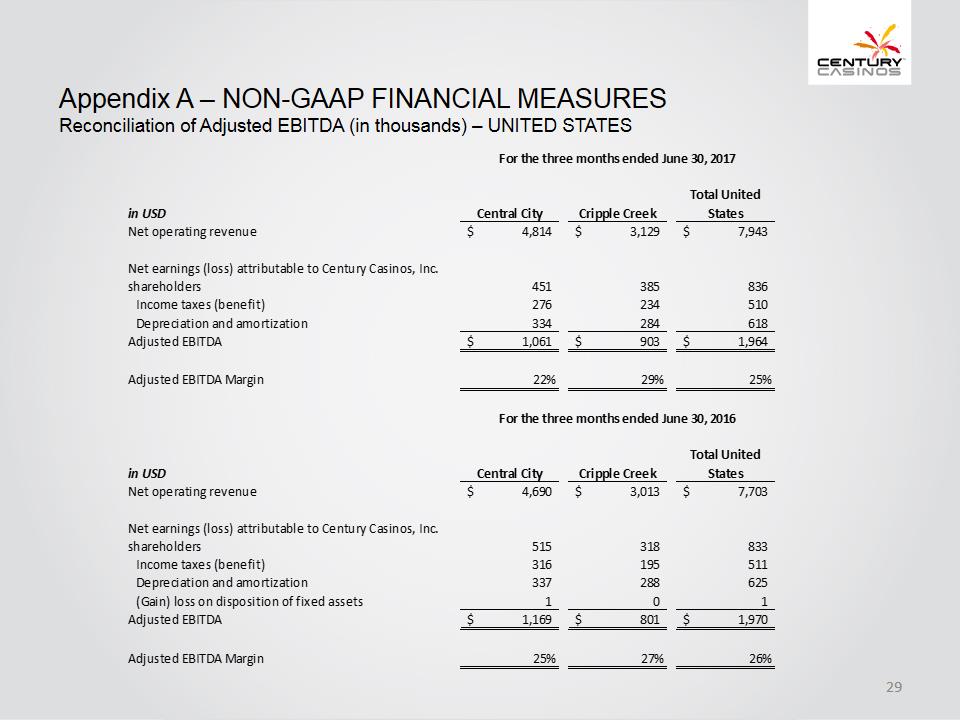 Appendix A –NON-GAAP FINANCIAL MEASURES Reconciliation of Adjusted EBITDA (in thousands) –UNITED STATES For the three months ended June 30, 2017in USD Central City Cripple Creek Total United States Net operating revenue 4,814 3,129 7,943 Net earnings (loss) attributable to Century Casinos, Inc. Shareholders 451 385 836Income taxes (benefit) 276 234 510Depreciation and amortization 334 284 618Adjusted EBITDA 1,061 903 1,964 Adjusted EBITDA Margin 22% 29% 25%For the three months ended June 30, 2016in USD Central City Cripple Creek Total United States Net operating revenue 4,690 3,013 7,703 Net earnings (loss) attributable to Century Casinos, Inc. Shareholders 515 318 833Income taxes (benefit) 316 195 511Depreciation and amortization 337 288 625(Gain) loss on disposition of fixed assets 1 0 1Adjusted EBITDA 1,169 801 1,970 Adjusted EBITDA Margin 25% 27% 26%
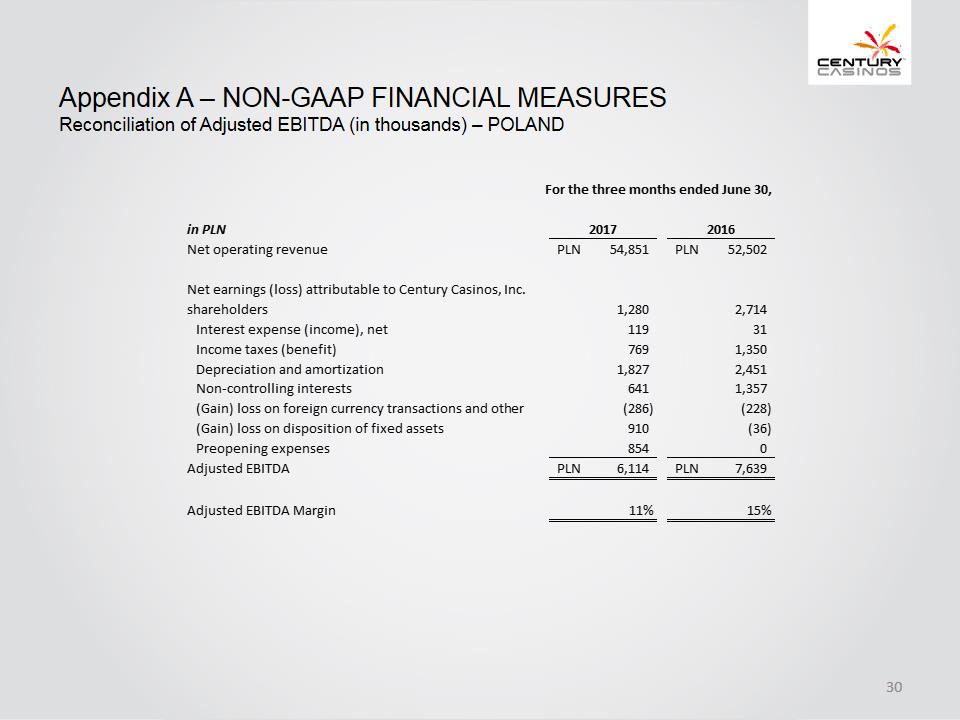 Appendix A –NON-GAAP FINANCIAL MEASURES Reconciliation of Adjusted EBITDA (in thousands) –POLAND in PLN For the three months ended June 30, 2017 2016Net operating revenue 54,851 52,502 Net earnings (loss) attributable to Century Casinos, Inc. Shareholders 1,280 2,714Interest expense (income), net 119 31Income taxes (benefit) 769 1,350Depreciation and amortization 1,827 2,451Non-controlling interests 641 1,357(Gain) loss on foreign currency transactions and other (286) (228)(Gain) loss on disposition of fixed assets 910 (36)Preopening expenses8540Adjusted EBITDA 6,114 7,639 Adjusted EBITDA Margin 11% 15%
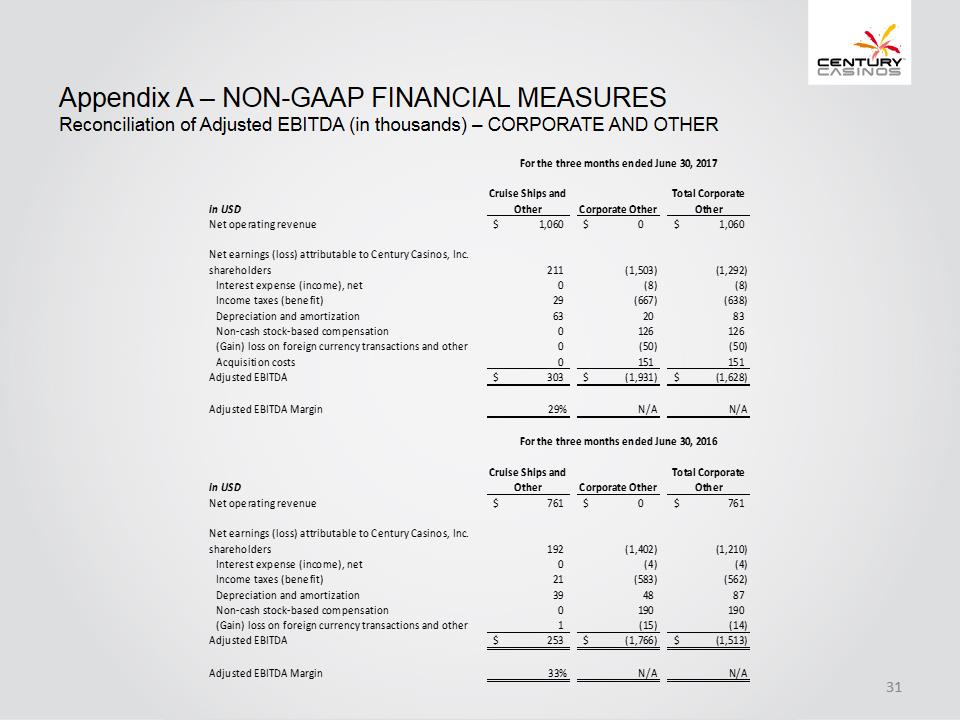 Appendix A –NON-GAAP FINANCIAL MEASURES Reconciliation of Adjusted EBITDA (in thousands) –CORPORATE AND OTHER For the three months ended June 30, 2017in USD Cruise Ships and Other Corporate Other Total Corporate Other Net operating revenue 1,060 0 1,060 Net earnings (loss) attributable to Century Casinos, Inc. Shareholders 211 (1,503) (1,292)Interest expense (income), net 0 (8) (8)Income taxes (benefit) 29 (667) (638)Depreciation and amortization 63 20 83Non-cash stock-based compensation 0 126 126(Gain) loss on foreign currency transactions and other 0 (50) (50)Acquisition costs 0 151 151Adjusted EBITDA 303 (1,931) (1,628) Adjusted EBITDA Margin 29% N/A N/A For the three months ended June 30, 2016in USD Cruise Ships and Other Corporate Other Total Corporate Other Net operating revenue 761 0 761 Net earnings (loss) attributable to Century Casinos, Inc. Shareholders 192 (1,402) (1,210)Interest expense (income), net 0 (4) (4)Income taxes (benefit) 21 (583) (562)Depreciation and amortization 39 48 87Non-cash stock-based compensation 0 190 190(Gain) loss on foreign currency transactions and other 1 (15) (14)Adjusted EBITDA 253 (1,766) (1,513) Adjusted EBITDA Margin 33% N/A N/A
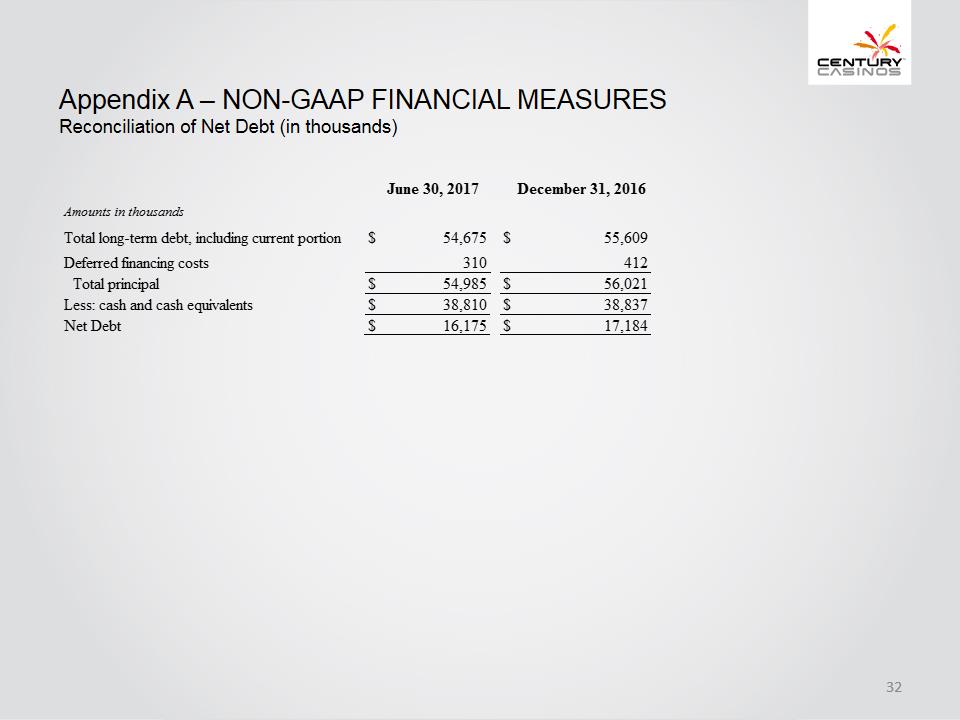 Appendix A –NON-GAAP FINANCIAL MEASURES Reconciliation of Net Debt (in thousands)Amounts in thousands June 30, 2017 December 31, 2016 Total long-term debt, including current portion 54,675 55,609Deferred financing costs 310 412Total principal 54,985 56,021Less: cash and cash equivalents 38,810 38,837Net Debt 16,175 17,184