Attached files
| file | filename |
|---|---|
| EX-32.2 - SECTION 906 CERTIFICATION - CFO - Meet Group, Inc. | meet06302017ex32-2xq22017.htm |
| EX-32.1 - SECTION 906 CERTIFICATION - CEO - Meet Group, Inc. | meet06302017ex32-1xq22017.htm |
| EX-31.2 - SECTION 302 CERTIFICATION - CFO - Meet Group, Inc. | meet06302017ex31-2xq22017.htm |
| EX-31.1 - SECTION 302 CERTIFICATION - CEO - Meet Group, Inc. | meet06302017ex31-1xq22017.htm |
UNITED STATES
SECURITIES AND EXCHANGE COMMISSION
WASHINGTON, D.C. 20549
FORM 10-Q
☒ | QUARTERLY REPORT PURSUANT TO SECTION 13 OR 15(d) OF THE | |
SECURITIES EXCHANGE ACT OF 1934 | ||
For the quarterly period ended June 30, 2017 | ||
OR | ||
☐ | TRANSITION REPORT PURSUANT TO SECTION 13 OR 15(d) OF THE | |
SECURITIES EXCHANGE ACT OF 1934 | ||
For the transition period from to
Commission file number: 001-33105
The Meet Group, Inc.
(Exact name of registrant as specified in its charter)
Delaware | 86-0879433 |
(State or other jurisdiction of | (I.R.S. Employer |
incorporation or organization) | Identification No.) |
100 Union Square Drive | |
New Hope, Pennsylvania | 18938 |
(Address of principal executive offices) | (Zip Code) |
Registrant’s telephone number: (215) 862-1162
Indicate by check mark whether the registrant (1) has filed all reports required to be filed by Section 13 or 15(d) of the Securities Exchange Act of 1934 during the preceding 12 months (or for such shorter period that the registrant was required to file such reports), and (2) has been subject to such filing requirements for the past 90 days.
Yes ☒ No ☐
Indicate by check mark whether the registrant has submitted electronically and posted on its corporate Web site, if any, every Interactive Data File required to be submitted and posted pursuant to Rule 405 of Regulation S-T during the preceding 12 months (or for such shorter period that the registrant was required to submit and post such files).
Yes ☒ No ☐
Indicate by check mark whether the registrant is a large accelerated filer, an accelerated filer, a non-accelerated filer, a smaller reporting company or an emerging growth company. See the definitions of “large accelerated filer,” “accelerated filer,” “smaller reporting company” and “emerging growth company” in Rule 12b-2 of the Exchange Act.
Large accelerated filer ☐ | Accelerated filer ☒ |
Non-accelerated filer ☐ (Do not check if a smaller reporting company) | Smaller reporting company ☐ |
Emerging growth company ☐ | |
If an emerging growth company, indicate by check mark if the registrant has elected not to use the extended transition period for comply with any new or revised financial accounting standards provided pursuant to Section 13(a) of the Exchange Act. | ☐ |
Indicate by check mark whether the registrant is a shell company (as defined in Rule 12b-2 of the Exchange Act).
Yes ☐ No ☒
Class | Outstanding as of August 1, 2017 | |||
Common Stock, $0.001 par value per share | 71,798,100 | shares | ||
THE MEET GROUP, INC. AND SUBSIDIARIES
INDEX
CERTIFICATIONS | ||
INDEX TO EXHIBITS | ||
2
PART I. FINANCIAL INFORMATION
Item 1. Financial Statements
THE MEET GROUP, INC. AND SUBSIDIARIES
CONDENSED CONSOLIDATED BALANCE SHEETS
(Unaudited) | |||||||
June 30, 2017 | December 31, 2016 | ||||||
ASSETS | |||||||
CURRENT ASSETS: | |||||||
Cash and cash equivalents | $ | 32,252,734 | $ | 21,852,531 | |||
Accounts receivable, net of allowance of $309,000 and $283,000 at June 30, 2017 and December 31, 2016, respectively | 20,810,796 | 23,737,254 | |||||
Prepaid expenses and other current assets | 5,353,355 | 1,489,267 | |||||
Total current assets | 58,416,885 | 47,079,052 | |||||
Restricted cash | 894,057 | 393,484 | |||||
Goodwill | 150,088,783 | 114,175,554 | |||||
Property and equipment, net | 3,491,539 | 2,466,110 | |||||
Intangible assets, net | 37,236,258 | 17,010,565 | |||||
Deferred taxes | 27,562,319 | 28,253,827 | |||||
Other assets | 584,292 | 110,892 | |||||
Total assets | $ | 278,274,133 | $ | 209,489,484 | |||
LIABILITIES AND STOCKHOLDERS’ EQUITY | |||||||
CURRENT LIABILITIES: | |||||||
Accounts payable | $ | 3,552,147 | $ | 5,350,336 | |||
Accrued liabilities | 12,770,565 | 8,395,060 | |||||
Current portion of long-term debt | 7,500,000 | — | |||||
Current portion of capital lease obligations | 81,761 | 221,302 | |||||
Deferred revenue | 1,188,881 | 434,197 | |||||
Total current liabilities | 25,093,354 | 14,400,895 | |||||
Long-term debt | 5,625,000 | — | |||||
Total liabilities | 30,718,354 | 14,400,895 | |||||
STOCKHOLDERS’ EQUITY: | |||||||
Preferred stock, $.001 par value; authorized - 5,000,000 shares; 0 shares issued and outstanding at June 30, 2017 and December 31, 2016 | — | — | |||||
Common stock, $.001 par value; authorized - 100,000,000 shares; 71,794,766 and 58,945,607 shares issued and outstanding at June 30, 2017 and December 31, 2016, respectively | 71,798 | 58,949 | |||||
Additional paid-in capital | 403,025,701 | 351,873,801 | |||||
Accumulated deficit | (155,541,720 | ) | (156,844,161 | ) | |||
Total stockholders’ equity | 247,555,779 | 195,088,589 | |||||
Total liabilities and stockholders’ equity | $ | 278,274,133 | $ | 209,489,484 | |||
See notes to condensed consolidated financial statements.
3
THE MEET GROUP, INC. AND SUBSIDIARIES
CONDENSED CONSOLIDATED STATEMENTS OF OPERATIONS AND COMPREHENSIVE INCOME
THREE AND SIX MONTHS ENDED JUNE 30, 2017 AND 2016
(UNAUDITED)
Three Months Ended June 30, | Six Months Ended June 30, | ||||||||||||||
2017 | 2016 | 2017 | 2016 | ||||||||||||
Revenues | $ | 31,329,468 | $ | 16,388,991 | $ | 51,388,265 | $ | 29,710,662 | |||||||
Operating costs and expenses: | |||||||||||||||
Sales and marketing | 4,599,842 | 3,226,344 | 9,705,350 | 5,547,767 | |||||||||||
Product development and content | 16,526,905 | 6,214,062 | 24,984,399 | 11,922,162 | |||||||||||
General and administrative | 5,160,799 | 1,867,590 | 8,023,226 | 4,215,758 | |||||||||||
Depreciation and amortization | 2,965,175 | 753,918 | 4,650,014 | 1,505,182 | |||||||||||
Acquisition and restructuring | 3,769,425 | 1,160,349 | 5,269,854 | 1,160,349 | |||||||||||
Total operating costs and expenses | 33,022,146 | 13,222,263 | 52,632,843 | 24,351,218 | |||||||||||
(Loss) income from operations | (1,692,678 | ) | 3,166,728 | (1,244,578 | ) | 5,359,444 | |||||||||
Other income (expense): | |||||||||||||||
Interest income | 1,400 | 6,447 | 3,970 | 11,562 | |||||||||||
Interest expense | (175,254 | ) | (5,360 | ) | (177,586 | ) | (12,105 | ) | |||||||
Change in warrant liability | — | (787,391 | ) | — | (545,614 | ) | |||||||||
(Loss) gain on foreign currency adjustment | (9,229 | ) | 18,201 | (11,429 | ) | 34,553 | |||||||||
Total other expense | (183,083 | ) | (768,103 | ) | (185,045 | ) | (511,604 | ) | |||||||
(Loss) income before income taxes | (1,875,761 | ) | 2,398,625 | (1,429,623 | ) | 4,847,840 | |||||||||
Benefit from income taxes | 2,732,356 | 27,219,764 | 2,732,064 | 27,125,446 | |||||||||||
Net income | $ | 856,595 | $ | 29,618,389 | $ | 1,302,441 | $ | 31,973,286 | |||||||
Basic and diluted net income per common stockholders: | |||||||||||||||
Basic net income per common stockholders | $ | 0.01 | $ | 0.61 | $ | 0.02 | $ | 0.67 | |||||||
Diluted net income per common stockholders | $ | 0.01 | $ | 0.55 | $ | 0.02 | $ | 0.59 | |||||||
Weighted average shares outstanding: | |||||||||||||||
Basic | 70,122,234 | 48,218,184 | 65,632,962 | 47,838,466 | |||||||||||
Diluted | 74,885,903 | 54,061,306 | 70,569,243 | 53,863,966 | |||||||||||
Comprehensive income | $ | 856,595 | $ | 29,618,389 | $ | 1,302,441 | $ | 31,973,286 | |||||||
See notes to condensed consolidated financial statements.
4
THE MEET GROUP, INC. AND SUBSIDIARIES
CONDENSED CONSOLIDATED STATEMENTS OF CHANGES IN STOCKHOLDERS’ EQUITY
SIX MONTHS ENDED JUNE 30, 2017 (UNAUDITED) AND
THE YEAR ENDED DECEMBER 31, 2016
Common Stock | Additional Paid-in Capital | Accumulated Deficit | Total Stockholders’ Equity | |||||||||||||||
Shares | Amount | |||||||||||||||||
Balance-December 31, 2015 | 47,179,486 | $ | 47,183 | $ | 300,725,791 | $ | (198,102,612 | ) | $ | 102,670,362 | ||||||||
Vesting of stock options for compensation | — | — | 3,567,987 | — | 3,567,987 | |||||||||||||
Exercise of stock options | 4,693,918 | 4,694 | 8,841,370 | — | 8,846,064 | |||||||||||||
Exercise of warrants | 1,763,340 | 1,763 | 6,368,305 | — | 6,370,068 | |||||||||||||
Issuance of common stock for Skout acquisition | 5,222,017 | 5,222 | 32,371,283 | — | 32,376,505 | |||||||||||||
Issuance of common stock for vested RSAs | 934,991 | 935 | (935 | ) | — | — | ||||||||||||
Repurchase and retirement of common stock | (848,145 | ) | (848 | ) | — | (5,010,167 | ) | (5,011,015 | ) | |||||||||
Net income | — | — | — | 46,268,618 | 46,268,618 | |||||||||||||
Balance-December 31, 2016 | 58,945,607 | $ | 58,949 | $ | 351,873,801 | $ | (156,844,161 | ) | $ | 195,088,589 | ||||||||
Vesting of stock options for compensation | — | — | 3,502,350 | — | 3,502,350 | |||||||||||||
Exercise of stock options | 2,060,964 | 2,061 | 2,776,115 | — | 2,778,176 | |||||||||||||
Exercise of warrants | 675,000 | 675 | 2,395,575 | — | 2,396,250 | |||||||||||||
Issuance of common stock | 9,200,000 | 9,200 | 42,986,171 | — | 42,995,371 | |||||||||||||
Issuance of common stock for vested RSAs | 913,195 | 913 | (913 | ) | — | — | ||||||||||||
RSAs withheld to cover taxes | — | — | (507,398 | ) | — | (507,398 | ) | |||||||||||
Net income | — | — | — | 1,302,441 | 1,302,441 | |||||||||||||
Balance-June 30, 2017 | 71,794,766 | $ | 71,798 | $ | 403,025,701 | $ | (155,541,720 | ) | $ | 247,555,779 | ||||||||
See notes to condensed consolidated financial statements.
5
THE MEET GROUP, INC. AND SUBSIDIARIES
CONDENSED CONSOLIDATED STATEMENTS OF CASH FLOWS
SIX MONTHS ENDED JUNE 30, 2017 AND 2016
(UNAUDITED)
Six Months Ended June 30, | |||||||
2017 | 2016 | ||||||
Cash flows from operating activities: | |||||||
Net income | $ | 1,302,441 | $ | 31,973,286 | |||
Adjustments to reconcile net income to net cash provided by operating activities: | |||||||
Depreciation and amortization | 4,650,014 | 1,505,182 | |||||
Vesting of stock options for compensation | 3,502,350 | 1,643,352 | |||||
Deferred taxes | (444,230 | ) | (27,269,800 | ) | |||
Loss (gain) on cumulative foreign currency | 11,429 | (34,553 | ) | ||||
Bad debt expense (recovery) | 26,000 | (4,000 | ) | ||||
Amortization of loan origination costs | 34,342 | — | |||||
Revaluation of warrant liability | — | 545,614 | |||||
Changes in operating assets and liabilities: | |||||||
Accounts receivable | 5,862,051 | 3,098,088 | |||||
Prepaid expenses, other current assets and other assets | 1,610,514 | (2,300,347 | ) | ||||
Accounts payable and accrued liabilities | 161,914 | 1,136,350 | |||||
Deferred revenue | (54,560 | ) | 17,997 | ||||
Net cash provided by operating activities | 16,662,265 | 10,311,169 | |||||
Cash flows from investing activities: | |||||||
Purchase of property and equipment | (595,126 | ) | (494,744 | ) | |||
Acquisition of if(we), Inc., net of cash and restricted cash acquired | (65,802,792 | ) | — | ||||
Net cash used in investing activities | (66,397,918 | ) | (494,744 | ) | |||
Cash flows from financing activities: | |||||||
Proceeds from exercise of stock options | 2,778,176 | 3,134,604 | |||||
Proceeds from issuance of common stock | 42,995,371 | — | |||||
Proceeds from exercise of warrants | 2,396,250 | — | |||||
Payments of capital leases | (139,541 | ) | (214,585 | ) | |||
Proceeds from long-term debt | 15,000,000 | — | |||||
Payments for restricted stock awards withheld for taxes | (507,398 | ) | — | ||||
Payments on long-term debt | (1,875,000 | ) | — | ||||
Net cash provided by financing activities | 60,647,858 | 2,920,019 | |||||
Change in cash, cash equivalents, and restricted cash prior to effects of foreign currency exchange rate | 10,912,205 | 12,736,444 | |||||
Effect of foreign currency exchange rate | (11,429 | ) | 34,553 | ||||
Net increase in cash, cash equivalents, and restricted cash | 10,900,776 | 12,770,997 | |||||
Cash, cash equivalents, and restricted cash at beginning of period | 22,246,015 | 19,298,038 | |||||
Cash, cash equivalents, and restricted cash at end of period | $ | 33,146,791 | $ | 32,069,035 | |||
Supplemental disclosure of cash flow information: | |||||||
Cash paid for interest | $ | 140,911 | $ | 12,105 | |||
See notes to condensed consolidated financial statements.
6
Note 1- Description of Business, Basis of Presentation and Summary of Significant Accounting Policies
The Meet Group, Inc. (the “Company,” “The Meet Group,” “us” or “we”) is a fast-growing portfolio of mobile apps that brings together people around the world for new connections. Our mission is to meet the universal need for human connection. We operate location-based social networks for meeting new people on mobile platforms, including on iPhone, Android, iPad and other tablets, and on the web that facilitate interactions among users and encourage users to connect and chat with each other. Given consumer preferences to use more than a single mobile application, we are adopting a brand portfolio strategy, through which we offer products that collectively appeal to the broadest spectrum of consumers. We are consolidating the fragmented mobile meeting sector through strategic acquisitions, leveraging economies and innovation to drive growth. On October 3, 2016, we completed our acquisition of Skout, Inc. (“Skout”), and on April 3, 2017, we completed our acquisition of Ifwe Inc. (“if(we)”), both of which owned leading global mobile networks for meeting new people.
The Meet Group’s platforms monetize through advertising, in-app purchases, and paid subscriptions. The Company offers online marketing capabilities, which enable marketers to display their advertisements in different formats and in different locations. We offer significant scale to our advertising partners, with hundreds of millions of daily impressions across our active and growing global user base, and sophisticated data science for highly effective hyper-targeting. The Company works with its advertisers to maximize the effectiveness of their campaigns by optimizing advertisement formats and placement.
Just as Facebook has established itself as the social network of friends and family, and LinkedIn as the social network of colleagues and business professionals, The Meet Group is creating the social network not of the people you know but of the people you want to know. Nimble and fast-moving, already in more than 100 countries, we are challenging the dominant player in our space, Match Group. Our vision extends beyond dating. We focus on building quality products to satisfy the universal need for human connection among all people, everywhere-not just paying subscribers. We believe meeting new people is a basic human need, especially for users aged 18-34, when so many long-lasting relationships are made. We use advanced technology to engineer serendipitous connections among people who otherwise might never have met - a sort of digital coffeehouse where everyone belongs. Over the years, The Meet Group’s apps have originated untold numbers of chats, shares, good friends, dates, romantic relationships - even marriages.
We believe that we have significant growth opportunities as people increasingly use their mobile devices to discover the people around them. Given the importance of establishing connections within a user’s geographic proximity, we believe it is critical to establish a high density of users within the geographic regions we serve. As The Meet Group’s networks grow and the number of users in a location increases, we believe that users who are seeking to meet new people will incrementally benefit from the quantity of relevant connections.
Basis of Presentation
The Company’s unaudited condensed consolidated financial statements are prepared in accordance with accounting principles generally accepted in the U.S. (“GAAP”). The condensed consolidated financial statements include the accounts of all subsidiaries and affiliates in which the Company holds a controlling financial interest as of the date of the condensed consolidated financial statements. Normally, a controlling financial interest reflects ownership of a majority of the voting interests.
The condensed consolidated financial statements include the accounts of The Meet Group (formerly known as MeetMe) and its wholly-owned subsidiaries, Quepasa.com de Mexico, Quepasa Serviços em Solucoes de Publicidade E Tecnologia Ltda (inactive), MeetMe Online S/S Ltda, which was dissolved during the fourth quarter of 2016, Skout and if(we). All intercompany accounts and transactions have been eliminated in consolidation.
Unaudited Interim Financial Information
The unaudited condensed consolidated financial statements have been prepared by the Company and reflect all normal, recurring adjustments that, in the opinion of management, are necessary for a fair presentation of the interim financial information. The results of operations for the interim periods presented are not necessarily indicative of the results to be expected for any subsequent quarter or for the year ending December 31, 2017. Certain information and footnote disclosures normally included in financial statements prepared in accordance with GAAP have been condensed or omitted under the rules and regulations of the Securities and Exchange Commission (“SEC”). These unaudited condensed consolidated financial statements and notes included herein should be read in conjunction with the audited consolidated financial statements and notes included in the Company's Annual Report on Form 10-K for the year ended December 31, 2016, filed with the SEC on March 9, 2017.
7
Use of Estimates
The preparation of the Company’s condensed consolidated financial statements in conformity with GAAP requires the Company to make estimates and assumptions that affect the reported amounts of assets and liabilities and disclosure of contingent assets and liabilities at the date of the condensed consolidated financial statements and the reported amounts of revenues and expenses during the reporting period. Significant estimates and assumptions are required in the determination of revenue recognition, accounts receivable valuation, the fair value of financial instruments, the valuation of long-lived assets, valuation of deferred tax assets, income taxes, contingencies, goodwill and intangible assets, and stock-based compensation. Some of these judgments can be subjective and complex, and, consequently, actual results may differ from these estimates. The Company’s estimates often are based on complex judgments, probabilities and assumptions that it believes to be reasonable but that are inherently uncertain and unpredictable. For any given individual estimate or assumption made by the Company, there may also be other estimates or assumptions that are reasonable.
The Company regularly evaluates its estimates and assumptions using historical experience and other factors, including the economic environment. As future events and their effects cannot be determined with precision, the Company’s estimates and assumptions may prove to be incomplete or inaccurate, or unanticipated events and circumstances may occur that might cause it to change those estimates and assumptions. Market conditions, such as illiquid credit markets, volatile equity markets, dramatic fluctuations in foreign currency rates and economic downturn, can increase the uncertainty already inherent in its estimates and assumptions. The Company adjusts its estimates and assumptions when facts and circumstances indicate the need for change. Those changes generally will be reflected in the Company’s consolidated financial statements on a prospective basis unless they are required to be treated retrospectively under the relevant accounting standard. It is possible that other professionals, applying reasonable judgment to the same facts and circumstances, could develop and support a range of alternative estimated amounts. The Company is also subject to other risks and uncertainties that may cause actual results to differ from estimated amounts, such as changes in competition, litigation, legislation and regulations.
Revenue Recognition
The Company recognizes revenue when persuasive evidence of an arrangement exists, delivery has occurred or services have been rendered, the purchase price is fixed or determinable and collectability is reasonably assured. The Company earns revenue from the display of advertisements on its mobile apps and website, primarily based on a cost per thousand (“CPM”) model. The Company recognizes revenue in accordance with Accounting Standards Codification (“ASC”) 605, “Revenue Recognition,” and ASC 605-45 “Principal Agent Considerations” (together, the “ASC Guidance”). Revenue from advertising on the Company’s website and mobile apps is generally recognized on a net basis, since the majority of its advertising revenues come from advertising agencies. The guidance provides indicators for determining whether “gross” or “net” presentation is appropriate. While all indicators should be considered, the Company believes that whether it acted as a primary obligor in its agreements with advertising agencies is the strongest indicator of whether gross or net revenue reporting is appropriate.
During the six months ended June 30, 2017 and 2016, the Company had transactions with several partners that qualify for principal agent considerations. The Company recognizes revenue, net of amounts retained by third party entities, pursuant to revenue sharing agreements with advertising networks for advertising and with other partners for royalties on product sales. The Company considered two key factors when making its revenue recognition determinations: (1) whether the Company performed a service for a fee, similar to an agent or a broker; and (2) whether the Company was involved in the determination of product or service specifications. The Company focused on the substance of the agreements and determined that net presentation was representationally faithful to the substance, as well as the form, of the agreements. The form of the agreements was such that the Company provided services in exchange for a fee. In addition, the Company has no latitude in establishing price, and the advertising agencies were solely responsible for determining pricing with third party advertisers. The Company determined only the fee for providing its services to advertising agencies.
In instances in which the Company works directly with an advertiser, revenue is recognized on a gross basis. The Company is the primary obligor in arrangements made with direct advertisers, as there is no third party facilitating or managing the sales process. The Company is solely responsible for determining price, product or service specifications, and which advertisers to use. The Company assumes all credit risk in the sales arrangements made with direct advertisers.
During the six months ended June 30, 2017 and 2016, the Company’s revenue was generated from two principal sources: revenue earned from the sales of advertising on the Company’s mobile applications and website and revenue earned from in-app products.
8
Advertising Revenue
Advertising and custom sponsorship revenues consist primarily of advertising fees earned from the display of advertisements on the Company’s mobile applications and website. Revenue from advertising is generally recognized as advertisements are delivered. The Company recognizes advertising revenue from customers that are advertising networks on a net basis, while advertising revenues earned directly from advertisers are recognized on a gross basis. Approximately 76% and 86% of the Company’s revenue came from advertising during the six months ended June 30, 2017 and 2016, respectively.
In-App Purchases
Revenue is earned from in-app purchase products sold to our mobile application and website users. The Company offers in-app products such as Credits, Points and Gold. Users buy Credits, Points or Gold to purchase the Company’s virtual products. These products put users in the spotlight, helping users to get more attention from the community in order to meet more people faster. Revenue from these virtual products is recognized over time. Credits, Points or Gold can be purchased using iTunes and Google checkout on mobile applications. Platform users do not own the Credits, Points or Gold but have a limited right to use them on virtual products offered for sale on the Company’s platforms. Credits, Points and Gold are non-refundable, the Company may change the purchase price of them at any time, and the Company reserves the right to stop issuing Credits, Points or Gold in the future. The Company’s in-app products are not transferable, cannot be sold or exchanged outside our platform, are not redeemable for any sum of money, and can only be used on the Company’s platforms. In-app products are recorded in deferred revenue when purchased and recognized as revenue when: (i) the Credits, Points or Gold are used by the customer; or (ii) the Company determines the likelihood of the Credits, Points or Gold being redeemed by the customer is remote (breakage) and there is not a legal obligation to remit the unredeemed Credits, Points or Gold to the relevant jurisdiction. The determination of the breakage rate is based upon Company-specific historical redemption patterns. Breakage is recognized in revenue as the Credits and Gold are used on a pro rata basis over a three month period (life of the user) beginning at the date of the sale and are included in revenue in the consolidated statements of operations and comprehensive income. Breakage recognized during the six months ended June 30, 2017 and 2016 was $664,665 and $651,000, respectively. For “MeetMe+” and other subscription based products, the Company recognizes revenue over the term of the subscription.
The Company also earns revenue from advertisement products from currency engagement actions (i.e. sponsored engagement advertisements) by users on all of the Company’s platforms, including cost-per-action (“CPA”) currency incented promotions and sales on its proprietary cross-platform currency monetization product, “Social Theater.” The Company controls and develops the Social Theater product and CPA promotions and acts as a user’s principal in these transactions and recognizes the related revenue on a gross basis when collections are reasonably assured and upon delivery of the Credits to the user’s account. When a user performs an action, the user earns Credits and the Company earns product revenue from the advertiser.
Social Theater is a product that allows the Company to offer advertisers a way to leverage the third party platforms through guaranteed actions by their user bases. Social Theater is also hosted on the Company’s platform. Typical guaranteed actions available to advertisers are video views, fan page growth, quizzes and surveys. Social Theater revenue is recognized when persuasive evidence of an arrangement exists, the sales price is fixed or determinable, collectability is reasonably assured, and the service has been rendered. Social Theater prices are both fixed and determinable based on the contract with the advertiser. The user completes an action and the electronic record of the transaction triggers the revenue recognition. The collection of the Social Theater revenue is reasonably assured by contractual obligation and historical payment performance. The delivery of virtual currency from the hosting platform to a user evidences the completion of the action required by the customer that the service has been rendered for Social Theater revenue recognition.
Fair Value Measurements
The fair values of the Company’s financial instruments reflect the amounts that would be received to sell an asset or paid to transfer a liability in an orderly transaction between market participants at the measurement date (exit price).
The carrying amounts of the Company’s financial instruments of cash and cash equivalents, accounts receivable, accounts payable and accrued liabilities approximate fair value due to their short maturities. Certain common stock warrants are carried at fair value as disclosed in Note 3- Fair Value Measurements. The Company has evaluated the estimated fair value of financial instruments using available market information and management’s estimates. The use of different market assumptions and/or estimation methodologies could have a significant effect on the estimated fair value amounts.
In addition, the Company carries its contingent consideration liabilities related to acquisitions at fair value. In accordance with the three-tier fair value hierarchy, the Company determined the fair value of its contingent consideration liabilities using the income approach with assumed discount rates and payment probabilities. The income approach uses Level 3, or unobservable inputs as
9
defined under the accounting guidance for fair value measurements. At both June 30, 2017 and December 31, 2016, the Company’s contingent consideration liability had a fair value of $3.0 million. See Note 2- Acquisitions for more information regarding the Company’s contingent consideration liability. The Company also carries a term loan facility that was entered into as part of the acquisition of if(we). As of June 30, 2017, the Company had an outstanding balance of $13.1 million on its term loan facility. The outstanding balance as of June 30, 2017 approximates fair value due to the variable market interest rates and relatively short maturity associated with the Term Loan Facility. See Note 6- Long-Term Debt for more information regarding the Company’s credit facilities.
Foreign Currency
The functional currency of our foreign subsidiaries is the local currency. The financial statements of these subsidiaries are translated to U.S. dollars using period-end rates of exchange for assets and liabilities and average quarterly rates of exchange for revenues and expenses. Net gains and losses resulting from foreign exchange transactions are included in other income (expense). The Company’s foreign operations were substantially liquidated in the first quarter of 2015. Due to our current reporting metrics, providing revenues from users attributed to the U.S. and revenues from users attributed to all other countries is impracticable.
Net Income per Share
Basic net income per share is computed by dividing net income attributable to common stockholders by the weighted average number of common shares outstanding. Diluted net income per share is computed by dividing net income attributable to common stockholders by the weighted average number of common shares and common stock equivalents outstanding, calculated under the treasury stock method for options and warrants using the average market prices during the period.
The following table shows the computation of basic and diluted net income per share for the following:
Three Months Ended June 30, | Six Months Ended June 30, | ||||||||||||||
2017 | 2016 | 2017 | 2016 | ||||||||||||
Numerator: | |||||||||||||||
Net income | $ | 856,595 | $ | 29,618,389 | $ | 1,302,441 | $ | 31,973,286 | |||||||
Denominator: | |||||||||||||||
Weighted-average shares outstanding | 70,122,234 | 48,218,184 | 65,632,962 | 47,838,466 | |||||||||||
Effect of dilutive securities | 4,763,669 | 5,843,122 | 4,936,281 | 6,025,500 | |||||||||||
Weighted-average diluted shares | 74,885,903 | 54,061,306 | 70,569,243 | 53,863,966 | |||||||||||
Basic income per share | $ | 0.01 | $ | 0.61 | $ | 0.02 | $ | 0.67 | |||||||
Diluted income per share | $ | 0.01 | $ | 0.55 | $ | 0.02 | $ | 0.59 | |||||||
The following table summarizes the number of dilutive securities, which may dilute future earnings per share, outstanding for each of the periods presented, but not included in the calculation of diluted loss per share:
Three Months Ended June 30, | Six Months Ended June 30, | ||||||||||
2017 | 2016 | 2017 | 2016 | ||||||||
Stock options | 4,013,425 | 5,320,564 | 3,840,813 | 5,020,092 | |||||||
Warrants | — | 2,031,425 | — | 2,149,519 | |||||||
Total | 4,013,425 | 7,351,989 | 3,840,813 | 7,169,611 | |||||||
Significant Customers and Concentration of Credit Risk
Financial instruments that potentially subject the Company to significant concentrations of credit risk consist primarily of cash, cash equivalents, restricted cash, and accounts receivable. The Company invests its excess cash in high-quality, liquid money market funds maintained by major U.S. banks and financial institutions. The Company has not experienced any losses on its cash equivalents.
10
The Company performs ongoing credit evaluations of its customers and generally does not require collateral. The Company has no recent history of significant losses from uncollectible accounts. During the six months ended June 30, 2017 and 2016, three customers, all of which were advertising aggregators, which represent thousands of advertisers, comprised approximately 46% and 53% of total revenues, respectively. Three customers, all of which were advertising aggregators, comprised of approximately 46% and 49% of accounts receivable as of June 30, 2017 and December 31, 2016, respectively.
The Company does not expect its current or future credit risk exposure to have a significant impact on its operations, however, there can be no assurance that the Company’s business will not experience any adverse impact from credit risk in the future.
Recent Issued Accounting Standards
In May 2014, the Financial Accounting Standards Board (“FASB”) issued Accounting Standards Update No. 2014-09: Revenue from Contracts with Customers (Topic 606) (“ASU 2014-09”). This update outlines a single comprehensive model for entities to use in accounting for revenue arising from contracts with customers and supersedes most current revenue recognition guidance, including industry-specific guidance. The core principle of the revenue model is that “an entity recognizes revenue to depict the transfer of promised goods or services to customers in an amount that reflects the consideration to which the entity expects to be entitled in exchange for those goods or services.” This update also requires significantly expanded disclosures related to revenue recognition. In March 2016, the FASB issued Accounting Standards Update No. 2016-08: Principal versus Agent Considerations (Reporting Revenue Gross versus Net) (“ASU 2016-08”), amending the principal-versus-agent implementation guidance set forth in ASU 2014-09. Among other things, ASU 2016-08 clarifies that an entity should evaluate whether it is the principal or the agent for each specified good or service promised in a contract with a customer. In April 2016, the FASB issued Accounting Standards Update No. 2016-10: Identifying Performance Obligations and Licensing (“ASU 2016-10”), which amends certain aspects of the guidance set forth in the FASB’s new revenue standard related to identifying performance obligations and licensing implementation. In May 2016, the FASB issued Accounting Standards Update No. 2016-12: Narrow-Scope Improvements and Practical Expedients (“ASU 2016-12”), amending certain aspects of ASU 2014-09 to address implementation issues identified by the FASB’s transition resource group and clarify the new revenue standard’s core revenue recognition principles. In December 2016, the FASB issued Accounting Standards Update No. 2016-20: Technical Corrections and Improvements to Topic 606, Revenue from Contracts with Customers (“ASU 2016-20”), which clarified or corrected unintended application of certain aspects of the new revenue guidance. ASU 2014-09 will be effective for the Company in fiscal year 2018 following the issuance of Accounting Standards Update No. 2015-14: Deferral of the Effective Date in August 2015, which deferred the effective date of ASU 2014-09 by one year.
The Company is in the process of evaluating the qualitative and quantitative disclosure requirements of ASU 2014-09 to identify possible enhancements to the Company’s financial statements that will enable users to better understand the nature, amount, timing and uncertainty of revenues and cashflows arising from contracts with customers, including significant judgments, changes in judgments, and assets recognized from costs incurred to obtain or fulfill a contract. The Company expects the adoption of ASU 2014-09, as amended, to have an impact to its business processes, financial reporting disclosures, and internal controls over financial reporting (“ICFR”). As part of the assessment performed through the date of this filing, the Company has created an implementation working group, which includes internal and third-party resources.
As part of its implementation plan, the Company has developed an implementation project plan that allows the Company to properly and timely adopt the new revenue accounting standard on its effective date. The Company is in the process of assessing the appropriate changes to its business processes and controls to support revenue recognition and disclosures under the new standard. The Company plans to adopt the new standard using the modified retrospective method.
The project plan for the adoption of ASU 2014-09 includes a phased implementation project plan, an understanding of the new revenue accounting standard and its requirements, and an assessment of the Company’s revenue streams and contracts. The Company will continue to monitor any modifications, clarifications and interpretations issued by the FASB, which may impact its assessment of the standard.
Significant assessment and implementation matters to be addressed prior to adopting ASU 2014-09 include completing a review of customer contracts and related policies and procedures, determining the impact the new accounting standard will have on the Company’s financial statements and related disclosures, and updating, as needed, the Company’s business policies, processes, systems, and controls required to comply with ASU 2014-09 upon its effective date of January 1, 2018. The Company will update the implementation status related to the impact of ASU 2014-09 on the financial statements and related footnotes in the future quarterly and year-end disclosures.
11
Specific considerations made to date on the impact of adopting ASU 2014-09 includes:
• | Arrangements with Multiple Performance Obligations - ASU 2014-09 states that the transaction price for contracts with more than one performance obligation should be allocated to each performance obligation. This guidance may impact certain contracts the Company has with its customers, which include multiple performance obligations. |
• | Principal vs Agent Relationships - ASU 2014-09 modified some of the existing principal and agent considerations. This update may result in changes to gross vs net treatment of revenue and expenses; however, this update would not affect net income. |
• | Contract Costs - The Company is continuing to assess the impact of ASU 2014-09 on the costs to acquire and fulfill its customer contracts, including whether the Company can apply the practical expedient of expensing contract costs when incurred if the amortization period of the asset that would have been recognized is one year or less. Currently, the Company’s accounting policy is to expense contract costs as they are incurred. |
Upon completion of the Company’s implementation plan and evaluation of the remaining revenue contracts, the Company plans to adopt additional controls around ICFR and its business processes for any new revenue arrangements that the Company enters. The Company is on target to complete its assessment of ASU 2014-09 and its impact on the Company’s consolidated financial statements and related disclosures as of January 1, 2018.
In February 2016, the FASB issued ASU No. 2016-2, Leases (Topic 842). The new standard establishes a right-of-use (ROU) model that requires a lessee to record an ROU asset and a lease liability on the balance sheet for all leases with terms longer than 12 months. Leases will be classified as either finance or operating, with classification affecting the pattern of expense recognition in the income statement. ASU 2016-2 is effective for annual periods beginning after December 15, 2018, and annual and interim periods thereafter, with early adoption permitted. A modified retrospective transition approach is required for lessees for capital and operating leases existing at, or entered into after, the beginning of the earliest comparative period presented in the financial statements, with certain practical expedients available. The Company is currently evaluating the impact that the adoption of this new standard will have on its consolidated financial statements.
In August 2016, the FASB issued ASU No. 2016-15, Statement of Cash Flows (Topic 230): Classification of Certain Cash Receipts and Cash Payments, providing additional guidance on several cash flow classification issues, with the goal of the update to reduce the current and potential future diversity in practice. The amendments in this update are effective for fiscal years beginning after December 15, 2017, and interim periods within those fiscal years. The Company is currently evaluating the impact that the adoption of this new standard will have on its consolidated financial statements.
In November 2016, the FASB issued ASU No. 2016-18, Statement of Cash Flows (Topic 230): Restricted Cash, which amended the existing accounting standards for the statement of cash flows by requiring restricted cash to be included with cash and cash equivalents when reconciling the beginning-of-period and end-of-period total amounts shown on the statement of cash flows. ASU 2016-18 will be effective in fiscal years beginning after December 15, 2017, including interim periods within those fiscal years, and early adoption is permitted. The Company has early adopted this new standard beginning in the fourth quarter of 2016 and it has been applied retrospectively to all periods presented.
In January 2017, the FASB issued ASU No. 2017-01, Business Combinations (Topic 805) Clarifying the Definition of a Business, which clarifies the definition of a business with the objective of adding guidance to assist entities with evaluating whether transactions should be accounted for as acquisitions (or disposals) of assets or businesses. ASU 2017-01 will be effective in fiscal years beginning after December 15, 2017, including interim periods within those fiscal years, and early adoption is permitted. The adoption of this standard is not expected to have a material impact on the Company’s consolidated financial statements.
In January 2017, the FASB issued ASU No. 2017-04, Intangibles - Goodwill and Other (Topic 350): Simplifying the Accounting for Goodwill Impairment. ASU No. 2017-04 removes Step 2 of the goodwill impairment test, which requires a hypothetical purchase price allocation. A goodwill impairment will now be the amount by which a reporting unit’s carrying value exceeds its fair value, not to exceed the carrying amount of goodwill. ASU 2017-01 will be effective in fiscal years beginning after December 15, 2020, including interim periods within those fiscal years, and early adoption is permitted for interim or annual goodwill impairment tests performed on testing dates after January 1, 2017. The Company is currently evaluating the impact this standard will have on its consolidated financial statements.
In May 2017, the FASB issued ASU No. 2017-09, Compensation - Stock Compensation (Topic 718) Scope of Modification Accounting, which provides guidance about which changes to the terms or conditions of a share-based payment award require an entity to apply modification accounting. ASU 2017-09 will be effective in fiscal years beginning after December 15, 2017, including interim periods within those fiscal years, and early adoption is permitted. The adoption of this standard is not expected to have a material impact on the Company’s consolidated financial statements.
12
Note 2- Acquisitions
if(we)
On March 3, 2017, the Company, and its wholly-owned subsidiary, Two Sub One, Inc., a Delaware corporation, entered into a definitive agreement and plan of merger (the “Merger Agreement”) with if(we), a Delaware corporation and leading global mobile network for meeting new people, pursuant to which the Company agreed to acquire 100% of the outstanding shares of capital stock of if(we) for total consideration of $74.5 million in cash, subject to closing adjustments. The transaction closed on April 3, 2017. The Company does not expect goodwill to be deductible for tax purposes.
The Company funded the acquisition from cash on hand, and from a $15.0 million term credit facility from J.P. Morgan Chase Bank, N.A., pursuant to a Credit Agreement entered into on March 3, 2017. See Note 6- Long-Term Debt for further details.
At the closing of the if(we) acquisition, the Company granted options to purchase an aggregate of up to 75,000 shares of its common stock and restricted stock awards representing an aggregate of 717,500 shares of common stock to 83 former if(we) employees as an inducement material to becoming non-executive employees of the Company.
The acquisition-date fair value of the consideration transferred is as follows:
At April 3, 2017 | |||
Cash consideration (1) | $ | 60,000,000 | |
Net working capital adjustment | 14,467,379 | ||
Total estimated consideration | $ | 74,467,379 | |
(1) Cash consideration includes a $6.0 million escrow payment to be paid out 12 months from the date of the transaction.
The following is a purchase price allocation as of the April 3, 2017 acquisition date:
At April 3, 2017 | |||
Cash and cash equivalents | $ | 8,164,587 | |
Accounts receivable | 2,961,593 | ||
Prepaid expenses and other current assets | 5,588,308 | ||
Restricted cash | 500,000 | ||
Property and equipment | 1,476,010 | ||
Other assets | 394,037 | ||
Intangible assets | 23,830,000 | ||
Accounts payable | (1,632,306 | ) | |
Accrued expenses and other current liabilities | (783,096 | ) | |
Deferred revenue | (809,244 | ) | |
Deferred tax liability | (1,135,739 | ) | |
Net assets acquired | $ | 38,554,150 | |
Goodwill | 35,913,229 | ||
Total consideration | $ | 74,467,379 | |
13
The fair value of the if(we) trademarks were determined using an income approach, the fair value of software acquired, which represents the primary platform on which the if(we) apps operate, was determined using a cost approach and the fair value of customer relationships was determined using an excess earnings approach. These values are subject to change based on the final assessment of the deferred taxes acquired. The preliminary amounts assigned to the identifiable intangible assets are as follows:
Fair Value | |||
Trademarks | $ | 9,895,000 | |
Software | 13,205,000 | ||
Customer relationships | 730,000 | ||
Total identifiable intangible assets | $ | 23,830,000 | |
The operating results of if(we) for the period from April 3, 2017 to June 30, 2017, including revenues of $11.2 million and net loss of $0.9 million, have been included in the Company’s consolidated statements of operations and comprehensive income for the three and six months ended June 30, 2017. The Company incurred a total of $1.7 million in transaction costs in connection with the acquisition, which were included in acquisition and restructuring costs within the consolidated statement of operations and comprehensive income for the six months ended June 30, 2017.
The following pro forma information shows the results of the Company’s operations for the three and six months ended June 30, 2016 as if the if(we) acquisition had occurred on January 1, 2016. The pro forma information also includes the results of Skout as if the acquisition of Skout occurred on January 1, 2015 for comparability purposes. The pro forma information is presented for information purposes only and is not necessarily indicative of what would have occurred if the acquisition had been made as of that date.
Three Months Ended June 30, | Six Months Ended June 30, | ||||||||||||||
2017 | 2016 | 2017 | 2016 | ||||||||||||
Revenues | $ | 31,478,167 | $ | 33,892,589 | $ | 62,169,230 | $ | 64,135,130 | |||||||
Net income | $ | 989,468 | $ | 28,673,169 | $ | 621,700 | $ | 30,204,527 | |||||||
Basic earnings per share | $ | 0.01 | $ | 0.59 | $ | 0.01 | $ | 0.63 | |||||||
Diluted earnings per share | $ | 0.01 | $ | 0.53 | $ | 0.01 | $ | 0.56 | |||||||
Skout
On June 27, 2016, The Meet Group, and its wholly-owned subsidiaries, MeetMe Sub I, Inc., a Delaware corporation, and MeetMe Sub II, LLC, a Delaware limited liability corporation, (together, “The Meet Group”) entered into a merger agreement with Skout, a California corporation, pursuant to which The Meet Group agreed to acquire 100% of the issued and outstanding shares of common stock of Skout for estimated cash consideration of $30.3 million, net of cash acquired of $2.9 million, 5,222,017 shares of The Meet Group common stock, and $3.0 million in contingent consideration liability. The transaction closed October 3, 2016. The Company does not expect goodwill to be deductible for tax purposes.
The following is a summary of the consideration transferred:
At October 3, 2016 | |||
Cash consideration (1) | $ | 33,155,532 | |
Equity consideration | 32,376,505 | ||
Contingent consideration | 3,000,000 | ||
Total estimated consideration | $ | 68,532,037 | |
(1) Cash consideration includes a $2.9 million escrow payment to be paid out 18 months from the date of the transaction.
14
The following is the purchase price allocation as of the October 3, 2016 acquisition date:
At October 3, 2016 | |||
Cash and cash equivalents | $ | 2,851,338 | |
Accounts receivable | 4,146,927 | ||
Prepaid expenses and other current assets | 280,379 | ||
Restricted cash | 393,261 | ||
Property and equipment | 396,998 | ||
Deferred tax asset | 157,111 | ||
Intangible assets | 18,230,000 | ||
Accounts payable | (1,055,802 | ) | |
Accrued expenses and other current liabilities | (208,628 | ) | |
Deferred revenue | (189,066 | ) | |
Net assets acquired | $ | 25,002,518 | |
Goodwill | 43,529,519 | ||
Total consideration | $ | 68,532,037 | |
The fair value of the Skout trademark was determined using an income approach, the fair value of software acquired, which represents the primary platform on which the Skout apps operate, was determined using a cost approach and the fair value of customer relationships was determined using an excess earnings approach. The amounts assigned to the identifiable intangible assets are as follows:
Fair Value | |||
Trademark | $ | 7,155,000 | |
Software | 2,500,000 | ||
Customer relationships | 8,575,000 | ||
Total identifiable intangible assets | $ | 18,230,000 | |
The acquisition of Skout calls for contingent consideration of up to $1.5 million for each founder, $3.0 million in total, based on the Company achieving certain financial targets. The payment of the contingent consideration is due one year from closing. Based on the probability of achieving the financial targets, the Company has determined that the fair value of the contingent consideration at closing and at both June 30, 2017 and December 31, 2016 is $3.0 million.
The Company incurred a total of $2.5 million in transaction costs in connection with the acquisition, which were included in acquisition and restructuring costs within the consolidated statement of operations and comprehensive income (loss) for the year ended December 31, 2016.
Note 3-Fair Value Measurements
Accounting Standards Codification Topic 820, Fair Value Measurement (“ASC 820”), establishes a fair value hierarchy for instruments measured at fair value that distinguishes between assumptions based on market data (observable inputs) and the Company’s own assumptions (unobservable inputs). Observable inputs are inputs that market participants would use in pricing the asset or liability based on market data obtained from sources independent of the Company. Unobservable inputs are inputs that reflect the Company’s assumptions about the inputs that market participants would use in pricing the asset or liability, and are developed based on the best information available in the circumstances.
ASC 820 identifies fair value as the exchange price, or exit price, representing the amount that would be received to sell an asset or paid to transfer a liability in an orderly transaction between market participants. As a basis for considering market participant assumptions in fair value measurements, ASC 820 establishes a three-tier fair value hierarchy that distinguishes among the following:
Level 1-Valuations based on unadjusted quoted prices in active markets for identical assets or liabilities that the Company has the ability to access.
15
Level 2-Valuations based on quoted prices for similar assets or liabilities in active markets, quoted prices for identical or similar assets or liabilities in markets that are not active and models for which all significant inputs are observable, either directly or indirectly.
Level 3-Valuations based on inputs that are unobservable and significant to the overall fair value measurement.
To the extent that the valuation is based on models or inputs that are less observable or unobservable in the market, the determination of fair value requires more judgment. Accordingly, the degree of judgment exercised by the Company in determining fair value is greatest for instruments categorized in Level 3. A financial instrument’s level within the fair value hierarchy is based on the lowest level of any input that is significant to the fair value measurement.
Recurring Fair Value Measurements
Items measured at fair value on a recurring basis include money market mutual funds, restricted cash, warrants to purchase common stock, and contingent consideration. During the periods presented, the Company has not changed the manner in which it values assets and liabilities that are measured at fair value using Level 3 inputs. The following fair value hierarchy table presents information about each major category of the Company’s financial assets and liabilities measured at fair value on a recurring basis:
Quoted Prices in Active Markets for Identical Items (Level 1) | Significant Other Observable Inputs (Level 2) | Significant Unobservable Inputs (Level 3) | Total | ||||||||||||
June 30, 2017 | |||||||||||||||
Assets | |||||||||||||||
Money market | $ | 3,855,336 | $ | — | $ | — | $ | 3,855,336 | |||||||
Restricted cash | 894,057 | — | — | 894,057 | |||||||||||
Total assets | $ | 4,749,393 | $ | — | $ | — | $ | 4,749,393 | |||||||
Liabilities | |||||||||||||||
Contingent consideration | — | — | 3,000,000 | 3,000,000 | |||||||||||
Total liabilities | $ | — | $ | — | $ | 3,000,000 | $ | 3,000,000 | |||||||
December 31, 2016 | |||||||||||||||
Assets | |||||||||||||||
Money market | $ | 7,586,810 | $ | — | $ | — | $ | 7,586,810 | |||||||
Restricted cash | 393,484 | — | — | 393,484 | |||||||||||
Total assets | $ | 7,980,294 | $ | — | $ | — | $ | 7,980,294 | |||||||
Liabilities | |||||||||||||||
Contingent consideration | $ | — | — | 3,000,000 | 3,000,000 | ||||||||||
Total liabilities | $ | — | $ | — | $ | 3,000,000 | $ | 3,000,000 | |||||||
The following table sets forth a summary of changes in the fair value of the Company’s Common Stock warrant liability, which represents a recurring measurement that is classified within Level 3 of the fair value hierarchy, wherein fair value is estimated using significant unobservable inputs:
Contingent Consideration | |||
Balance as of December 31, 2016 | $ | 3,000,000 | |
Changes in estimated fair value | — | ||
Balance as of June 30, 2017 | $ | 3,000,000 | |
The Company recognizes transfers between levels of the fair value hierarchy as of the end of the reporting period. There were no transfers within the hierarchy during the six months ended June 30, 2017 and the year ended December 31, 2016.
16
The following table sets forth a summary of changes in the fair value of the Company’s Common Stock warrant liability, which represents a recurring measurement that was classified within Level 3 of the fair value hierarchy, wherein fair value is estimated using significant unobservable inputs. On June 30, 2016, Venture Lending & Leasing VI and VII provided notification of the surrender of their outstanding 341,838 liability classified warrants, which were net settled into common shares in the third quarter of 2016. As a result of the warrant exercise, no remeasurement of the warrant liability occurred subsequent to the exercise and no warrants were outstanding as of September 30, 2016.
Convertible Common Stock Warrant Liability | |||
Balance as of December 31, 2015 | $ | 1,035,137 | |
Changes in estimated fair value | 545,614 | ||
Balance as of June 30, 2016 | $ | 1,580,751 | |
The fair value of the warrants on the date of issuance and on each re-measurement date classified as liabilities is estimated using the Black-Scholes option pricing model using the following assumptions: contractual life according to the remaining terms of the warrants, no dividend yield, weighted average risk-free interest rate of 1.49% at June 30, 2016 and weighted average volatility of 83.64%. For this liability, the Company developed its own assumptions that do not have observable inputs or available market data to support the fair value. This method of valuation involves using inputs such as the fair value of the Company’s various classes of preferred stock, stock price volatility, the contractual term of the warrants, risk-free interest rates and dividend yields. Due to the nature of these inputs, the valuation of the warrants is considered a Level 3 measurement. The warrant liability was recorded in other liabilities on the Company’s consolidated balance sheets. The warrant liability is marked-to-market each reporting period with the change in fair value recorded on the statement of operations and comprehensive income until the warrants are exercised, expire or other facts and circumstances lead the warrant liability to be reclassified as an equity instrument.
Note 4 - Intangible Assets
Intangible assets consist of the following:
June 30, 2017 | December 31, 2016 | ||||||
Trademarks and domain names | $ | 22,909,494 | $ | 13,014,494 | |||
Customer relationships | 10,470,000 | 9,740,000 | |||||
Software | 17,430,000 | 4,225,000 | |||||
50,809,494 | 26,979,494 | ||||||
Less accumulated amortization | (13,573,236 | ) | (9,968,929 | ) | |||
Intangible assets - net | $ | 37,236,258 | $ | 17,010,565 | |||
Amortization expense was approximately $2.4 million and $0.4 million for the three months ended June 30, 2017 and 2016 and $3.6 million and $0.8 million for the six months ended June 30, 2017 and 2016, respectively. The weighted average amortizable life of the intangible assets was approximately 6.8 years as of June 30, 2017.
17
Annual future amortization expense for the Company’s intangible assets is as follows:
Year ending December 31, | Amortization Expense | ||
Remaining in 2017 | $ | 4,623,214 | |
2018 | 8,391,414 | ||
2019 | 6,946,377 | ||
2020 | 5,797,947 | ||
2021 | 4,964,280 | ||
Thereafter | 6,513,026 | ||
Total | $ | 37,236,258 | |
Note 5 - Property and Equipment
Property and equipment consist of the following:
June 30, 2017 | December 31, 2016 | ||||||
Servers, computer equipment and software | $ | 12,159,742 | $ | 10,273,823 | |||
Office furniture and equipment | 294,704 | 232,217 | |||||
Leasehold improvements | 565,853 | 443,123 | |||||
13,020,299 | 10,949,163 | ||||||
Less accumulated depreciation | (9,528,760 | ) | (8,483,053 | ) | |||
Property and equipment - net | $ | 3,491,539 | $ | 2,466,110 | |||
Property and equipment depreciation expense was approximately $0.6 million and $0.4 million for the three months ended June 30, 2017 and 2016 and $1.0 million and $0.7 million for the six months ended June 30, 2017 and 2016, respectively.
Note 6- Long-Term Debt
Credit Facilities
On March 3, 2017, in connection with the if(we) merger discussed in Note 2- Acquisitions (the “Merger”), the Company entered into a credit agreement (the “Credit Agreement”) with the several banks and other financial institutions party thereto (the “Lenders”) and JPMorgan Chase Bank, N.A., as administrative agent (the “Agent”). The Credit Agreement provides for a $15.0 million revolving credit facility (the “Revolving Credit Facility”) and a $15.0 million term loan facility (the “Term Loan Facility,” and together with the “Revolving Credit Facility,” the “Credit Facilities”).
The Company intends to use the proceeds under the Credit Facilities for general purposes, including the Merger. The Company will also use proceeds of the Revolving Credit Facility to finance working capital needs and for general corporate purposes. Amounts under the Revolving Credit Facility may be borrowed, repaid and re-borrowed from time to time until the maturity date of the Credit Agreement on March 3, 2019. The Term Loan Facility is subject to quarterly amortization of principal in an amount equal to $1,875,000 per quarter commencing June 30, 2017 and continuing through maturity. At the Company’s election, loans made under the Credit Facilities will bear interest at either (i) a base rate (“Base Rate”) plus an applicable margin or (ii) a London interbank offered rate (“LIBO Rate”) plus an applicable margin, subject to adjustment if an event of default under the Credit Agreement has occurred and is continuing. The Base Rate means the highest of (a) the Agent’s “prime rate,” (b) the federal funds effective rate plus 0.50% and (c) the LIBO Rate for an interest period of one month plus 1%. The Company’s present and future domestic subsidiaries (the “Guarantors”) will guarantee the obligations of the Company and its subsidiaries under the Credit Facilities. The obligations of the Company and its subsidiaries under the Credit Facilities are secured by all of the assets of the Company and the Guarantors, subject to certain exceptions and exclusions as set forth in the Credit Agreement and other loan documents.
On April 3, 2017, the Company drew down $15.0 million from its Term Loan Facility in connection with the Merger. As of June 30, 2017, the Company had an outstanding balance of $13.1 million on its Term Loan Facility. The weighted average interest rate at June 30, 2017 was 3.69%. Remaining unamortized fees and direct costs incurred for the Company’s Credit Facilities were $0.1 million. As of June 30, 2017, the Company did not have an outstanding balance on its Revolving Credit Facility.
18
Note 7- Commitments and Contingencies
Operating Leases
The Company leases its operating facilities in the U.S. under certain noncancelable operating leases that expire through 2022. These leases are renewable at the Company’s option.
Rent expense for the operating leases was approximately $1.7 million and $0.4 million for the three months ended June 30, 2017 and 2016 and $2.4 million and $0.8 million for the six months ended June 30, 2017 and 2016, respectively.
Capital Leases
The Company leases certain fixed assets under capital leases that expire in 2017. In 2012, the Company executed two noncancelable master lease agreements, one with Dell Financial Services and one with HP Financial Services. Both are for the purchase or lease of equipment for the Company’s data centers. Principal and interest are payable monthly at interest rates ranging from 4.5% to 8.0% per annum, rates varying based on the type of equipment purchased. The capital leases are secured by the leased equipment, and outstanding principal and interest are due monthly through October 2017. During the six months ended June 30, 2017, the Company did not enter into any new capital lease agreements.
A summary of minimum future rental payments required under capital and operating leases as of June 30, 2017 are as follows:
Capital Leases | Operating Leases | ||||||
Remaining in 2017 | $ | 82,512 | $ | 2,639,060 | |||
2018 | — | 3,959,618 | |||||
2019 | — | 1,827,943 | |||||
2020 | — | 432,758 | |||||
2021 | — | 445,741 | |||||
2022 | — | 112,253 | |||||
Total minimum lease payments | $ | 82,512 | $ | 9,417,373 | |||
Less: Amount representing interest | 751 | ||||||
Total present value of minimum payments | 81,761 | ||||||
Less: Current portion of such obligations | 81,761 | ||||||
Long-term capital lease obligations | $ | — | |||||
Litigation
From time to time, we are party to certain legal proceedings that arise in the ordinary course and are incidental to our business. We operate our business online, which is subject to extensive regulation by federal and state governments.
On April 30, 2015, plaintiff F. Stephen Allen served a complaint on the Company that he filed on April 23, 2015, in the United States District Court for the Northern District of Oklahoma accusing the Company of breach of contract for its alleged failure to maintain the effectiveness of a registration statement for warrant shares. The complaint sought damages of not less than $4 million. On December 22, 2015, the Company entered into a Settlement Agreement and Release of Claims (the “Settlement and Release of Claims”) with F. Stephen Allen, resolving all claims relating to F. Stephen Allen v. MeetMe, Inc., Cause No. 4:15-cv-210-GKF-TLW. Pursuant to the Settlement and Release of Claims, the Company (i) paid F. Stephen Allen $225,000, (ii) entered into a one-year consulting agreement in exchange for a grant of 50,000 stock options, (iii) modified the terms of his outstanding Series 2 and Series 3 warrants, to reduce the amount outstanding under the Series 2 by 50,000 and to extend the expiration date on both Series 2 and Series 3 by 15 months to June 21, 2017, prior to which all Series 2 and Series 3 warrants were exercised. On December 23, 2015, the Court dismissed the litigation with prejudice.
On September 29, 2015, the Company filed suit in the Court of Common Pleas of Philadelphia County, Pennsylvania, against Beanstock Media, Inc. (“Beanstock”) and Adaptive Medias, Inc. (“Adaptive”) for collection of approximately $10 million, in the aggregate, due under the Media Publisher Agreement (the “Web Agreement”) entered into on September 25, 2013 and the Advertising Agreement (the “Mobile Agreement”) entered into on December 23, 2014.
19
Pursuant to the Web Agreement, Beanstock had the exclusive right and obligation to fill all of the Company’s remnant desktop in-page display advertising inventory on www.meetme.com (the “Site”), excluding, (i) any inventory sold to a third party under an insertion order that was campaign or advertiser specific, (ii) any inventory the Company reserved in existing and future agreements with third parties for barter transactions and as additional consideration as part of larger business development transactions, and (iii) any inventory reserved for premium advertising for the Site. Pursuant to the Mobile Agreement, Beanstock had the right and obligation to fill substantially all of the Company’s advertising inventory on its MeetMe mobile app for iOS and Android, as well as the Site when accessed using a mobile device and as optimized for mobile devices (collectively, the “App”). The Mobile Agreement did not apply to interstitially placed advertisements, advertisements on versions of the App specific to the iPad and other Apple tablet devices, other mobile apps or in-app products or features on the App, including, without limitation, offer wall features and the Company’s Social Theater business.
On September 28, 2015, Adaptive filed suit in the Superior Court of California, County of Orange, against the Company, Beanstock, et al., alleging, in pertinent part, that the Company “aided and abetted” an individual who was an officer and director of Adaptive to breach his fiduciary duty to Adaptive with respect to Adaptive’s joining the Mobile Agreement. Adaptive’s complaint seeks from the Company $600,000 plus unspecified punitive damages. The Company believes Adaptive’s allegations against it are without merit, and intends to defend against them and to pursue its collection action against Beanstock and Adaptive vigorously. On January 20, 2016, the Company received notice from the United States Bankruptcy Court, District of Delaware, that a Chapter 7 bankruptcy case against Beanstock had been filed on October 7, 2015. Both of the state court actions have been stayed by the courts as a result of the bankruptcy filing against Beanstock.
Future events or circumstances, currently unknown to management, will determine whether the resolution of pending or threatened litigation or claims will ultimately have a material effect on our consolidated financial position, liquidity or results of operations in any future reporting periods.
Retirement Plan
The Company maintains the MeetMe, Inc. 401(k) Retirement Plan (the “Plan”), which is a savings and investment plan intended to be qualified under the Internal Revenue Code. The Plan covers the majority of the employees of the Company. In January 2014, the Company began providing company matching contributions to the plan, based on a participant’s contribution. The Company’s 401(k) match expense totaled $0.3 million and $0.2 million for the six months ended June 30, 2017 and 2016, respectively. The expense is included in sales and marketing, product development and content, and general and administrative expenses in the consolidated statements of operations and comprehensive income.
Note 8- Stockholder’s Equity
Preferred Stock
The total number of shares of preferred stock, $.001 par value, that the Company is authorized to issue is 5,000,000.
The Board of Directors may, without further action by the stockholders, issue a series of preferred stock and fix the rights and preferences of those shares, including the dividend rights, dividend rates, conversion rights, exchange rights, voting rights, terms of redemption, redemption price or prices, liquidation preferences, the number of shares constituting any series and the designation of such series.
On March 1, 2017, the Company filed with the Secretary of State of the State of Delaware a Certificate of Elimination of the 1,000,000 shares of Series A-1 Preferred Stock that effectuated the elimination of the Series A-1 Preferred Stock, which then resumed the status of authorized but unissued shares of preferred stock. As of June 30, 2017, there were no longer any Series A-1 shares authorized or issued and outstanding.
Common Stock
The total number of shares of common stock, $0.001 par value, that the Company is authorized to issue is 100,000,000.
In March 2017, the Company completed the underwritten public offering and sale of 9,200,000 shares (the “Shares”) of common stock at a price to the public of $5.00 per share. The net proceeds from the sale of the Shares, after deducting the underwriters’ discount and other offering expenses, were approximately $43.0 million.
20
The Offering was conducted pursuant to the Company’s shelf registration statement on Form S-3 (File No. 333-190535) filed with the SEC under the Securities Act of 1933, as amended (the “Securities Act”) and declared effective on April 18, 2014.
The Company issued shares of common stock of 2,060,964 and 4,693,918 related to exercises of stock options, 913,195 and 934,991 related to restricted stock awards and 675,000 and 1,763,340 related to the exercise of warrants during the six months ended June 30, 2017 and the year ended December 31, 2016, respectively. During the year ended December 31, 2016, 200,000 warrants expired. No warrants expired during the six months ended June 30, 2017.
On August 29, 2016, the Board of Directors authorized a $15 million share repurchase program (the “2016 Repurchase Program”). Repurchases under the 2016 Repurchase Program will be made in the open market or through privately negotiated transactions intended to comply with SEC Rule 10b-18, subject to market conditions, applicable legal requirements, and other relevant factors. The 2016 Repurchase Program does not obligate the Company to acquire any particular amount of common stock, and it may be suspended at any time at the Company’s discretion. During the year ended December 31, 2016, the Company repurchased 848,145 shares for an aggregate purchase price of $5.0 million. These shares were immediately retired. Unless extended by the Board of Directors, the 2016 Repurchase Program will terminate on August 29, 2017. The Company did not repurchase any shares during the six months ended June 30, 2017.
Stock-Based Compensation
The fair values of share-based payments are estimated on the date of grant using the Black-Scholes option pricing model, based on weighted average assumptions. Expected volatility is based on historical volatility of the Company’s common stock. The risk-free rate is based on the U.S. Treasury yield curve in effect over the expected term at the time of grant. Compensation expense is recognized on a straight-line basis over the requisite service period of the award. During 2017 and 2016, the Company continued to use the simplified method to determine the expected option term since the Company’s stock option exercise experience does not provide a reasonable basis upon which to estimate the expected option term.
The Company began granting restricted stock awards (“RSAs”) to its employees in April 2013. The cost of the RSAs is determined using the fair value of the Company’s common stock on the date of grant. Stock-based compensation expense for RSAs is amortized on a straight-line basis over the requisite service period. RSAs generally vest over a three-year period with 33% vesting at the end of one year and the remaining vesting annually thereafter.
The assumptions used in calculating the fair value of stock-based awards represent the Company’s best estimates, but these estimates involve inherent uncertainties and the application of management judgment. As a result, if factors change and the Company uses different assumptions, the Company’s stock-based compensation expense could be materially different in the future.
Stock-based compensation expense includes incremental stock-based compensation expense and is allocated on the consolidated statement of operations and comprehensive income as follows:
Three Months Ended June 30, | Six Months Ended June 30, | ||||||||||||||
2017 | 2016 | 2017 | 2016 | ||||||||||||
Sales and marketing | $ | 101,035 | $ | 95,295 | $ | 202,304 | $ | 155,732 | |||||||
Product development and content | 1,428,743 | 403,956 | 1,930,043 | 707,653 | |||||||||||
General and administrative | 838,414 | 416,321 | 1,370,003 | 779,967 | |||||||||||
Total stock-based compensation expense | $ | 2,368,192 | $ | 915,572 | $ | 3,502,350 | $ | 1,643,352 | |||||||
As of June 30, 2017, there was approximately $7.6 million of total unrecognized compensation cost relating to stock options, which is expected to be recognized over a period of approximately two years. As of June 30, 2017, the Company had approximately $12.2 million of unrecognized stock-based compensation expense related to RSAs, which will be recognized over the remaining weighted-average vesting period of approximately two years.
21
Stock Option Plans
Amended and Restated 2012 Omnibus Incentive Plan
On December 16, 2016, the Company’s stockholders approved the Amended and Restated 2012 Omnibus Incentive Plan (the “2012 Plan”), providing for the issuance of up to 10.5 million shares of the Company’s common stock, including approximately 2.1 million shares previously approved by the Company’s stockholders under the Company’s Amended and Restated 2006 Stock Incentive Plan (the “2006 Stock Plan”), less one share of common stock for every one share of common stock that was subject to an option or other award granted after December 31, 2011 under the 2006 Stock Plan, plus an additional number of shares of common stock equal to the number of shares previously granted under the 2006 Stock Plan that either terminate, expire, or are forfeited after December 31, 2011. As of June 30, 2017, there were approximately 2.0 million shares of common stock available for grant.
The Company recorded stock-based compensation expense related to options of approximately $0.7 million and $0.3 million for the three months ended June 30, 2017 and 2016, respectively, and $1.1 million and $0.6 million for the six months ended June 30, 2017 and 2016, respectively. A summary of stock option activity under the 2012 Plan during the six months ended June 30, 2017 is as follows:
Options | Number of Stock Options | Weighted- Average Exercise Price | Weighted Average Remaining Contractual Life | Aggregate Intrinsic Value | |||||||||
Outstanding at December 31, 2016 | 2,822,855 | $ | 2.42 | ||||||||||
Granted | 1,110,351 | 4.97 | |||||||||||
Exercised | (80,331 | ) | 2.13 | ||||||||||
Forfeited or expired | (44,966 | ) | 3.45 | ||||||||||
Outstanding at June 30, 2017 | 3,807,909 | $ | 3.16 | 8.3 | $ | 7,308,114 | |||||||
Exercisable at June 30, 2017 | 1,972,801 | $ | 2.32 | 7.4 | $ | 5,380,295 | |||||||
The total intrinsic values of options exercised were $0.2 million and $0.3 million during the six months ended June 30, 2017 and 2016, respectively.
The fair value of each stock option is estimated on the date of grant using the Black-Scholes option pricing model with the following weighted-average assumptions for the six months ended June 30, 2017 and 2016:
Six Months Ended June 30, | |||
2017 | 2016 | ||
Risk-free interest rate | 1.89% | 1.39% | |
Expected term (in years) | 6.0 | 6.0 | |
Expected dividend yield | — | — | |
Expected volatility | 83% | 84% | |
22
Restricted Stock Awards Under 2012 Omnibus Incentive Plan
The Company granted 1,304,271 RSAs during the six months ended June 30, 2017. Shares are forfeited if not vested within three years from the date of grant and vest in three equal annual increments. The Company recorded stock-based compensation expense related to RSAs of approximately $1.0 million and $0.6 million for the three months ended June 30, 2017 and 2016, respectively, and $1.6 million and $1.0 million for the six months ended June 30, 2017 and 2016, respectively. A summary of RSA activity under the 2012 Plan during the six months ended June 30, 2017 is as follows:
RSAs | Number of RSAs | Weighted-Average Stock Price | ||||
Outstanding at December 31, 2016 | 1,794,115 | $ | 2.46 | |||
Granted | 1,304,271 | 4.95 | ||||
Vested | (999,832 | ) | 2.34 | |||
Forfeited or expired | (93,450 | ) | 3.79 | |||
Outstanding and unvested at June 30, 2017 | 2,005,104 | $ | 4.07 | |||
2006 Stock Incentive Plan
On June 27, 2007, the Company’s stockholders approved the 2006 Stock Plan, providing for the issuance of up to 3,700,000 shares of common stock plus an additional number of shares of common stock equal to the number of shares previously granted under the 1998 Stock Option Plan that either terminate, expire, or lapse after the date of the Board of Directors’ approval of the 2006 Stock Plan.
A summary of stock option activity under the 2006 Stock Plan during the six months ended June 30, 2017 is as follows:
Options | Number of Stock Options | Weighted- Average Exercise Price | Weighted Average Remaining Contractual Life | Aggregate Intrinsic Value | |||||||||
Outstanding at December 31, 2016 | 3,041,686 | $ | 2.62 | ||||||||||
Granted | — | — | |||||||||||
Exercised | (1,664,177 | ) | 1.31 | ||||||||||
Forfeited or expired | (183,428 | ) | 4.94 | ||||||||||
Outstanding at June 30, 2017 | 1,194,081 | $ | 4.08 | 4.3 | $ | 1,260,386 | |||||||
Exercisable at June 30, 2017 | 1,149,902 | $ | 4.09 | 4.4 | $ | 1,200,744 | |||||||
The total intrinsic values of options exercised were $6.3 million and $6.1 million during the six months ended June 30, 2017 and 2016, respectively.
Amended and Restated 2016 Inducement Omnibus Incentive Plan
On October 3, 2016, in connection with the closing of the Skout acquisition, the Company’s Board of Directors adopted the 2016 Inducement Omnibus Incentive Plan in accordance with NASDAQ Listing Rule 5635(c)(4). At the closing of the Skout acquisition, the Company granted stock options to purchase an aggregate of up to 355,000 shares of its common stock to 25 former Skout employees as an inducement material to becoming non-executive employees of the Company. On February 27, 2017, the Company amended and restated the 2016 Inducement Omnibus Incentive Plan (as so amended and restated, the “2016 Stock Plan”) authorized an additional 2,000,000 shares of common stock under the 2016 Stock Plan. At the closing of the if(we) acquisition, the Company granted options to purchase an aggregate of up to 75,000 shares of its common stock and restricted stock awards representing an aggregate of 717,500 shares of common stock to 83 former if(we) employees as an inducement material to becoming non-executive employees of the Company.
23
Options under the 2016 Stock Plan
The Company recorded stock-based compensation expense related to options of approximately $0.2 million and $0.4 million for the three and six months ended June 30, 2017, respectively. A summary of stock option activity under the 2016 Stock Plan during the six months ended June 30, 2017 is as follows:
Options | Number of Stock Options | Weighted- Average Exercise Price | Weighted- Average Remaining Contractual Life | Aggregate Intrinsic Value | ||||||||||
Outstanding at December 31, 2016 | 310,000 | $ | 6.02 | |||||||||||
Granted | 575,000 | 4.95 | ||||||||||||
Exercised | — | — | ||||||||||||
Forfeited or expired | (67,500 | ) | 5.92 | |||||||||||
Outstanding at June 30, 2017 | 817,500 | $ | 5.27 | 9.6 | $ | 110,900 | ||||||||
Exercisable at June 30, 2017 | — | — | — | — | ||||||||||
The fair value of each stock option is estimated on the date of grant using the Black-Scholes option pricing model with the following weighted-average assumptions for the six months ended June 30, 2017:
Six Months Ended June 30, | |
2017 | |
Risk-free interest rate | 1.89% |
Expected term (in years) | 6.0 |
Expected dividend yield | — |
Expected volatility | 84% |
Restricted Stock Awards under the 2016 Stock Plan
The Company granted 1,007,750 RSAs during the six months ended June 30, 2017. Shares are forfeited if not vested within three years from the date of grant, and vest in three equal annual increments. The Company recorded stock-based compensation expense related to RSAs of approximately $0.4 million and $0.5 million for the three and six months ended June 30, 2017, respectively. A summary of RSA activity under the 2016 Stock Plan during the six months ended June 30, 2017 is as follows:
RSAs | Number of RSAs | Weighted-Average Stock Price | |||||
Outstanding at December 31, 2016 | — | $ | — | ||||
Granted | 1,007,750 | 5.47 | |||||
Vested | — | — | |||||
Forfeited or expired | (55,250 | ) | 5.74 | ||||
Outstanding and unvested at June 30, 2017 | 952,500 | $ | 5.45 | ||||
24
Non-Plan Options
The Board of Directors has approved and our stockholders have ratified the issuance of stock options outside of our stock incentive plans. A summary of Non-Plan option activity during the six months ended June 30, 2017 is as follows:
Options | Number of Stock Options | Weighted- Average Exercise Price | Weighted Average Remaining Contractual Life | Aggregate Intrinsic Value | ||||||||||
Outstanding at December 31, 2016 | 316,456 | $ | 1.34 | |||||||||||
Granted | — | — | ||||||||||||
Exercised | (316,456 | ) | 1.34 | |||||||||||
Forfeited or expired | — | — | ||||||||||||
Outstanding at June 30, 2017 | — | — | — | $ | — | |||||||||
The total intrinsic values of options exercised were $1.0 million and $0.4 million during the six months ended June 30, 2017 and 2016, respectively.
Note 9- Warrant Transactions
Below is a summary of the number of shares issuable upon exercise of outstanding warrants and the terms and accounting treatment for the outstanding warrants:
Warrants as of | Weighted-Average Exercise Price | Balance Sheet Classification as of | |||||||||||||
June 30, 2017 | December 31, 2016 | Expiration | June 30, 2017 | December 31, 2016 | |||||||||||
Allen, F. Stephen Series 3 | — | 425,000 | $ | 3.55 | 6/21/2017 | Equity | Equity | ||||||||
OTA LLC Series 2 | — | 250,000 | $ | 3.55 | 6/21/2017 | Equity | Equity | ||||||||
All warrants | — | 675,000 | |||||||||||||
In March 2006, the Company issued warrants to purchase 1,000,000 shares of common stock each at exercise prices of $4.00 and $7.00 as compensation for certain strategic initiatives. On February 19, 2010, the Company reduced the exercise price of the remaining 1,000,000 outstanding warrants to $3.55 per share. On December 22, 2015, in conjunction with a litigation settlement, the Company repurchased 50,000 Series 2 warrants and extended the warrant expiration date to June 21, 2017. The fair value of the warrant modification was determined by comparing the fair value of the modified warrant with the fair value of the unmodified warrant on the modification date.
In 2016, F. Stephen Allen exercised 275,000 warrants with an exercise price of $3.55 per share, with the Company issuing 275,000 shares of common stock. He sold 250,000 warrants to Warberg WF IV LP (“Warberg”), and as of December 31, 2016, Allen had 425,000 warrants remained outstanding. In March, April and May 2017, F. Stephen Allen exercised the remaining 425,000 warrants with an exercise price of $3.55 resulting in the Company issuing 425,000 shares of common stock.
In 2016, Warberg sold all of its 250,000 warrants to OTA LLC. In June 2017, OTA LLC exercised the remaining 250,000 warrants with an exercise price of $3.55 resulting in the Company issuing 250,000 shares of common stock.
25
A summary of warrant activity for the six months ended June 30, 2017 is as follows:
Warrants | Number of warrants | Weighted-Average Exercise Price | ||||
Outstanding at December 31, 2016 | 675,000 | $ | 3.55 | |||
Granted | — | — | ||||
Exercised | (675,000 | ) | $ | 3.55 | ||
Forfeited or expired | — | — | ||||
Outstanding and exercisable at June 30, 2017 | — | — | ||||
Note 10 - Income Taxes
As of June 30, 2017, the Company’s annual effective tax rate (ETR) from operations is 41.11%, which is higher than the previous year due to the release of the valuation allowance in 2016. Our effective tax rate is higher than the previous quarter due to an increase in permanent differences, mainly transaction costs, related to the recent acquisition of if(we).
The Company recorded a net income tax benefit of approximately $2.7 million and $27.2 million for the three months ended June 30, 2017 and 2016, respectively, and a benefit of $2.7 million and $27.1 million for the six months ended June 30, 2017 and 2016, respectively. The net income tax benefit recorded during the three and six months ended June 30, 2016, is primarily related to a release of the entire valuation allowance.
As of each reporting date, management considers new evidence, both positive and negative, that could affect its view of the future realization of deferred tax assets (primarily federal and state net operating losses (NOLs). In the second quarter of 2016, in part because the Company achieved three years of cumulative pretax income in the U.S. federal tax jurisdiction, management determined that there is sufficient positive evidence to conclude that it is more likely than not that net deferred tax assets of $33.6 million are realizable. As of June 30, 2017 and December 31, 2016, the Company did not record any valuation allowances related to deferred tax assets.
During the three and six months ended June 30, 2017 and 2016, the Company had no material changes in uncertain tax positions.
26
ITEM 2. MANAGEMENT’S DISCUSSION AND ANALYSIS OF FINANCIAL CONDITION AND RESULTS OF OPERATIONS.
Cautionary Note Regarding Forward-Looking Statements
Management’s Discussion and Analysis of Financial Condition and Results of Operations (“MD&A”) is set forth below. Certain statements in this report may be considered to be “forward-looking statements” as that term is defined in the U.S. Private Securities Litigation Reform Act of 1995. In particular, these forward-looking statements include, among others, statements about:
• | our expectations regarding user engagement patterns; |
• | our expectations regarding mobile usage by our users; |
• | the impact of increased mobile usage and Social Theater competition on revenues and financial results; |
• | the impact of seasonality on our operating results; |
• | our expectations relating to advertising and the effects of advertising and mobile monetization on our revenues; |
• | our expectations regarding our ability to manage and fill our advertising inventory internally; |
• | our plans regarding product development, international growth and personnel; |
• | our liquidity and expectations regarding uses of cash; |
• | our expectations regarding payments relating to cost reduction initiatives; |
• | our ability to successfully pursue collection actions; |
• | our expectations regarding the cost and outcome of our current and future litigation; |
• | the impact of new accounting policies; and |
• | our plans for capital expenditures for the remainder of the year ending December 31, 2017. |
All statements other than statements of historical facts contained in this report, including statements regarding our future financial position, liquidity, business strategy, plans and objectives of management for future operations, are forward-looking statements. The words “believe,” “may,” “estimate,” “continue,” “anticipate,” “intend,” “should,” “plan,” “could,” “target,” “potential,” “is likely,” “expect” and similar expressions, as they relate to us, are intended to identify forward-looking statements. We have based these forward-looking statements largely on our current expectations and projections about future events and financial trends that we believe may affect our financial condition, results of operations, business strategy and financial needs.
Important factors that could cause actual results to differ from those in the forward-looking statements include users’ willingness to try new product offerings and engage in our App upgrades and new features, the risk that unanticipated events affect the functionality of our App with popular mobile operating systems, any changes in such operating systems that degrade our App’s functionality and other unexpected issues which could adversely affect usage on mobile devices, the risk that the mobile advertising market will not grow, the ongoing existence of such demand and the willingness of our users to complete mobile offers or make pay for Credits, Points or Gold. Any forward-looking statement made by us in this report speaks only as of the date on which it is made. Factors or events that could cause our actual results to differ may emerge from time to time, and it is not possible for us to predict all of them. We undertake no obligation to publicly update any forward-looking statement, whether as a result of new information, future developments or otherwise, except as may be required by law.
You should read the following discussion in conjunction with our audited historical consolidated financial statements. MD&A contains forward-looking statements that reflect our plans, estimates, and beliefs. Our actual results could differ materially from those discussed in the forward-looking statements. Factors that could cause or contribute to these differences include those discussed elsewhere in “Risk Factors,” located at Part II, Item 1A of this report and in our Form 10-K for the year ended December 31, 2016. Additional risks that we do not presently know or that we currently believe are immaterial could materially and adversely affect any of our business, financial position, future results or prospects.
27
MD&A is provided as a supplement to and should be read in conjunction with our audited consolidated financial statements, and the MD&A included in our Annual Report on Form 10-K for the year ended December 31, 2016 (“Annual Report”), as well as our condensed consolidated financial statements and the accompanying notes included in this report.
Company Overview
The Meet Group is a fast-growing portfolio of mobile apps that brings together people around the world for new connections. Our mission is to meet the universal need for human connection. We operate location-based social networks for meeting new people on mobile platforms, including on iPhone, Android, iPad and other tablets, and on the web that facilitate interactions among users and encourage users to connect and chat with each other. Given consumer preferences to use more than a single mobile application, we are adopting a brand portfolio strategy, through which we offer products that collectively appeal to the broadest spectrum of consumers. We are consolidating the fragmented mobile meeting sector through strategic acquisitions, leveraging economies and innovation to drive growth. On October 3, 2016 we completed our acquisition of Skout, Inc. (“Skout”), and on April 3, 2017 we completed our acquisition of Ifwe Inc. (“if(we)”), both of which owned leading global mobile networks for meeting new people.
The Meet Group’s platforms monetize through advertising, in-app purchases, and paid subscriptions. The Company offers online marketing capabilities, which enable marketers to display their advertisements in different formats and in different locations. We offer significant scale to our advertising partners, with hundreds of millions of daily impressions across our active and growing global user base, and sophisticated data science for highly effective hyper-targeting. The Company works with its advertisers to maximize the effectiveness of their campaigns by optimizing advertisement formats and placement.
Just as Facebook has established itself as the social network of friends and family, and LinkedIn as the social network of colleagues and business professionals, The Meet Group is creating the social network not of the people you know but of the people you want to know. Nimble and fast-moving, already in more than 100 countries, we are challenging the dominant player in our space, Match Group. Our vision extends beyond dating. We focus on building quality products to satisfy the universal need for human connection among all people, everywhere-not just paying subscribers. We believe meeting new people is a basic human need, especially for users aged 18-34, when so many long-lasting relationships are made. We use advanced technology to engineer serendipitous connections among people who otherwise might never have met - a sort of digital coffeehouse where everyone belongs. Over the years, The Meet Group’s apps have originated untold numbers of chats, shares, good friends, dates, romantic relationships - even marriages.
We believe that we have significant growth opportunities as people increasingly use their mobile devices to discover the people around them. Given the importance of establishing connections within a user’s geographic proximity, we believe it is critical to establish a high density of users within the geographic regions we serve. As The Meet Group’s networks grow and the number of users in a location increases, we believe that users who are seeking to meet new people will incrementally benefit from the quantity of relevant connections.
Operating Metrics
We measure website and application activity in terms of monthly active users (“MAUs”) and daily active users (“DAUs”). We define MAU as a registered user of one of our platforms who has logged in and visited within the last month of measurement. We define DAU as a registered user of one of our platforms who has logged in and visited within the day of measurement. For the quarters ended June 30, 2017 and 2016, the total Company MAUs were approximately 13.87 million and 5.83 million, respectively, and total Company DAUs were approximately 3.43 million and 1.29 million, respectively.
Monthly Average for the Quarter Ended | |||||
June 30, | |||||
2017 | 2016 | ||||
MAU | 13,869,145 | 5,834,642 | |||
For the Quarter Ended | |||||
June 30, | |||||
2017 | 2016 | ||||
DAU | 3,432,355 | 1,291,146 | |||
28
Second Quarter of 2017 Highlights
• | Mobile revenue was $23.3 million in the second quarter of 2017, up 55% from $15.1 million in the second quarter of 2016. |
• | Net income for the second quarter of 2017 was $0.9 million. Adjusted EBITDA was $7.4 million for the second quarter of 2017. (See the important discussion about the presentation of non-GAAP financial measures, and reconciliation to the most directly comparable GAAP financial measures, below.) |
• | Cash and cash equivalents totaled $32.3 million at June 30, 2017. |
Trends in Our Metrics
In addition to MAUs and DAUs, we measure activity on the Company’s apps in terms of average revenue per user (“ARPU”) and average daily revenue per daily active user (“ARPDAU”). We define ARPU as the average quarterly revenue per MAU. We define ARPDAU as the average quarterly revenue per DAU. We define mobile MAU as a user who accessed our sites by one of our mobile applications for all platforms or by the mobile optimized version of our website for MeetMe and Skout, whether on a mobile phone or tablet during the month of measurement. We define a mobile DAU as a user who accessed our sites by one of our mobile applications for all platforms or by the mobile optimized version of our website for MeetMe and Skout, whether on a mobile phone or tablet during the day of measurement. Visits represent the number of times during the measurement period that users came to the website or mobile applications for distinct sessions. A page view is a page that a user views during a visit.
In the quarter ended June 30, 2017, the Company averaged 10.67 million mobile MAUs and 13.87 million total MAUs on average, as compared to 4.84 million mobile MAUs and 5.83 million total MAUs on average in the quarter ended June 30, 2016, a net increase of 5.83 million or 120% for mobile MAUs, and a net increase of 8.04 million or 138% for total Company MAUs. Mobile DAUs were 2.70 million for the quarter ended June 30, 2017, a 122% increase, from 1.22 million in the quarter ended June 30, 2016. For the quarter ended June 30, 2017, the Company averaged 3.43 million total DAUs, as compared to 1.29 million total DAUs on average for the quarter ended June 30, 2016, a net increase of approximately 2.14 million total DAUs, or 166%.
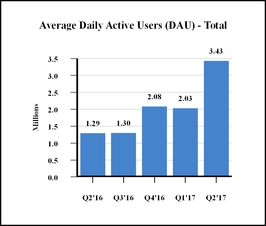
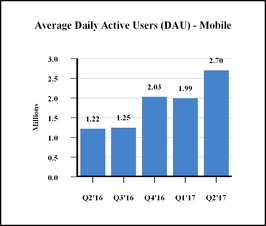
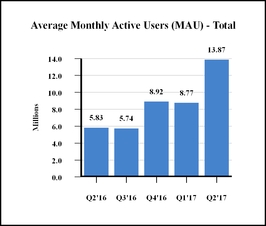
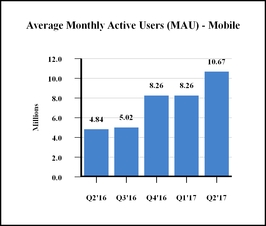
29
In the quarter ended June 30, 2017, the Company earned an average of $1.45 ARPU on the web and $2.19 ARPU in our mobile applications, as compared to $0.36 ARPU on the web and $3.11 in mobile ARPU for the quarter ended June 30, 2016. In the quarter ended June 30, 2017, the Company earned an average of $0.086 in web ARPDAU and $0.095 in mobile ARPDAU, as compared to $0.053 in web ARPDAU and $0.136 in mobile ARPDAU for the quarter ended June 30, 2016.
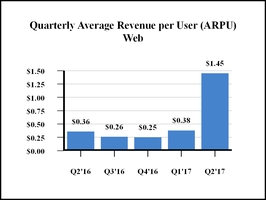
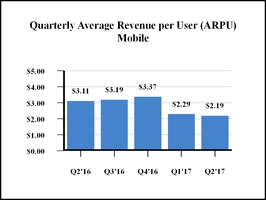
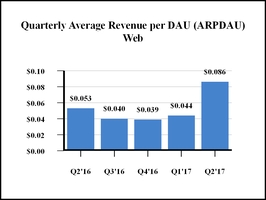
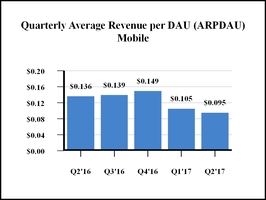
30
Factors Affecting Our Performance
We believe the following factors affect our performance:
• | Number of MAUs and DAUs: We believe our ability to grow web and mobile MAUs and DAUs affects our revenue and financial results by influencing the number of advertisements we are able to show, the value of those advertisements, and the volume of in-app purchases, as well as our expenses and capital expenditures. |
• | User Engagement: We believe changes in user engagement patterns affect our revenue and financial performance. Specifically, the number of visits and page views each MAU or DAU generates affects the number of advertisements we are able to display and therefore the rate at which we are able to monetize our active user base. We continue to create new features and enhance existing features to drive additional engagement. |
• | Advertising Rates: We believe our revenue and financial results are materially dependent on industry trends, and any changes to the revenue we earn per thousand advertising impressions (CPM) could affect our revenue and financial results. We expect to continue investing in new types of advertising and new placements, especially in our mobile applications. Additionally, we are prioritizing initiatives that generate revenue directly from users, including new in-app purchases products and a premium subscription product, in part to reduce our dependency on advertising revenue. |
• | User Geography: The geography of our users influences our revenue and financial results because we currently monetize users in distinct geographies at varying average rates. For example, ARPU in the U.S. and Canada is significantly higher than in Latin America. We plan to continue to invest in user growth across the world, including in geographies where current per user monetization rates are relatively lower than in the U.S. and Canada. |
• | New User Sources: The percentage of our new users that are acquired through inorganic, paid sources impacts our financial performance, specifically with regard to ARPU for web and mobile. Inorganically acquired users tend to have lower engagement rates, tend to generate fewer visits and ad impressions and to be less likely to make in-app purchases. When paid marketing campaigns are ongoing, our overall usage and traffic increases due to the influx of inorganically acquired users, but the rate at which we monetize the average active user overall declines as a result. |
• | Ad Inventory Management: Our revenue trends are affected by advertisement inventory management changes affecting the number, size, or prominence of advertisements we display. In general, more prominently displayed advertising units generate more revenue per impression. Our Social Theater campaign expenses are materially dependent on the percentage of Social Theater campaigns that run on MeetMe versus the percentage that run on other networks. We work to maximize the share of Social Theater campaigns that run on MeetMe and run campaigns on other networks only when necessary. |
• | Increased Social Theater Competition: A significant portion of the revenue generated by the Social Theater is derived from advertising campaigns, powered by Social Theater technology, that run on networks other than The Meet Group networks. A recent increase in competitors offering similar technology solutions, and in some cases their own cross-platform distribution networks, has made it more difficult to compete on price and win business. We expect this downward pressure on price to continue and impact our operating results in the future. |
• | Seasonality: Advertising spending is traditionally seasonal with a peak in the fourth quarter of each year. We believe that this seasonality in advertising spending affects our quarterly results, which generally reflect a growth in advertising revenue between the third and fourth quarters and a decline in advertising spending between the fourth and subsequent first and second quarters each year. Growth trends in web and mobile MAUs and DAUs affect our revenue and financial results by influencing the number of advertisements we are able to show, the value of those advertisements, the volume of payments transactions, as well as our expenses and capital expenditures. |
Growth trends in web and mobile MAUs and DAUs affect our revenue and financial results by influencing the number of advertisements we are able to show, the value of those advertisements, the volume of payments transactions, as well as our expenses and capital expenditures.
Changes in user engagement patterns from web to mobile and international diversification also affect our revenue and financial performance. We believe that overall engagement as measured by the percentage of users who create content (such as status posts, messages, or photos) or generate feedback increases as our user base grows. We continue to create new and improved features to drive social sharing and increase monetization. The launch of additional languages to the platform facilitates international user growth.
31
We believe our revenue trends are also affected by advertisement inventory management changes affecting the number, size, or prominence of the advertisements we display and traditional seasonality. Social Theater is a revenue product for the MeetMe platform and on third-party sites. Social Theater growth may be affected by large brand penetration, the ability to grow the advertiser base, and advertiser spending budgets.
Critical Accounting Policies and Estimates
Our critical accounting policies and estimates are described in Part II, Item 7, “Management’s Discussion and Analysis of Financial Condition and Results of Operations” of our Annual Report, filed with the SEC on March 9, 2017. We believe there have been no new critical accounting policies or material changes to our existing critical accounting policies and estimates during the six months ended June 30, 2017, compared to those discussed in our Annual Report.
Recent Accounting Pronouncements
For detailed information regarding recently issued accounting pronouncements and the expected impact on our financial statements, see Note 1- Description of Business, Basis of Presentation and Summary of Significant Accounting Policies in the accompanying notes to the condensed consolidated financial statements included in this Quarterly Report on Form 10-Q.
32
Results of Operations
Comparison of the three months ended June 30, 2017 and 2016
The following table sets forth our condensed consolidated statements of operations for the three months ended June 30, 2017 and 2016 that is used in the following discussions of our results of operations:
Three Months Ended June 30, | Change From Prior Year | |||||||||||||
2017 | 2016 | ($) | % | |||||||||||
Revenues | $ | 31,329,468 | $ | 16,388,991 | $ | 14,940,477 | 91.2 | % | ||||||
Operating costs and expenses: | ||||||||||||||
Sales and marketing | 4,599,842 | 3,226,344 | 1,373,498 | 42.6 | % | |||||||||
Product development and content | 16,526,905 | 6,214,062 | 10,312,843 | 166.0 | % | |||||||||
General and administrative | 5,160,799 | 1,867,590 | 3,293,209 | 176.3 | % | |||||||||
Depreciation and amortization | 2,965,175 | 753,918 | 2,211,257 | 293.3 | % | |||||||||
Acquisition and restructuring costs | 3,769,425 | 1,160,349 | 2,609,076 | 224.9 | % | |||||||||
Total operating costs and expenses | 33,022,146 | 13,222,263 | 19,799,883 | 149.7 | % | |||||||||
(Loss) income from operations | (1,692,678 | ) | 3,166,728 | (4,859,406 | ) | (153.5 | )% | |||||||
Other income (expense): | ||||||||||||||
Interest income | 1,400 | 6,447 | (5,047 | ) | (78.3 | )% | ||||||||
Interest expense | (175,254 | ) | (5,360 | ) | (169,894 | ) | (3,169.7 | )% | ||||||
Change in warrant liability | — | (787,391 | ) | 787,391 | 100.0 | % | ||||||||
(Loss) gain on foreign currency adjustment | (9,229 | ) | 18,201 | (27,430 | ) | (150.7 | )% | |||||||
Total other expense | (183,083 | ) | (768,103 | ) | 585,020 | 76.2 | % | |||||||
(Loss) income before income taxes | (1,875,761 | ) | 2,398,625 | (4,274,386 | ) | (178.2 | )% | |||||||
Benefit from income taxes | 2,732,356 | 27,219,764 | (24,487,408 | ) | (90.0 | )% | ||||||||
Net income | $ | 856,595 | $ | 29,618,389 | $ | (28,761,794 | ) | (97.1 | )% | |||||
Revenues
Our revenues were approximately $31.3 million for the three months ended June 30, 2017, an increase of $14.9 million or 91.2% compared to $16.4 million for the three months ended June 30, 2016. The increase in revenue is attributable to an $8.3 million increase in mobile revenue, a $6.1 million increase in web revenue, and a $0.5 million increase in cross-platform revenue. We believe the increase in mobile revenue is primarily due to increased mobile advertising impressions and increased in-app purchases, as a result of the Skout and if(we) acquisitions. The increased web revenue is primarily due to user generated revenue and subscription revenue from the if(we) acquisition.
Operating Costs and Expenses
Sales and Marketing: Sales and marketing expenses increased approximately $1.4 million, or 42.6%, to $4.6 million for the three months ended June 30, 2017 from $3.2 million for the three months ended June 30, 2016. The net increase in sales and marketing expenses, including the Skout and if(we) sales and marketing related expense, is due to increased advertising spend of approximately $1.0 million and increased employee expenses of approximately $0.3 million. The increase in employee expenses is primarily due to the Skout and if(we) acquisitions.
Product Development and Content: Product development and content expenses increased approximately $10.3 million, or 166.0%, to $16.5 million for the three months ended June 30, 2017 from $6.2 million for the three months ended June 30, 2016. The net increase in product development and content expense, including the Skout and if(we) product development related expense, is attributable to an increase of employee expenses of $4.5 million, data center and technical operations of $2.5 million, stock-based compensation of $1.0 million, mobile content cost of $0.8 million and Social Theater content costs of $0.5 million. The increase in employee expenses, data center and technical operations, stock-based compensation and mobile content costs is attributable to the Skout and if(we) acquisitions. The increase in Social Theater content costs is due to increased Social Theater revenue.
General and Administrative: General and administrative expenses increased $3.3 million or 176.3%, to $5.2 million for the three months ended June 30, 2017 from $1.9 million for the three months ended June 30, 2016. The net increase in general and
33
administrative expense, including the Skout and if(we) general and administrative related expense, is due to an increase of employee expenses of $0.9 million, stock-based compensation of $0.4 million, office related expenses of $0.3 million, and travel related costs of $0.2 million. These increases are primarily attributable to the Skout and if(we) acquisitions.
Comparison of Stock-Based Compensation and Other Costs and Expenses
Stock-Based Compensation
Stock-based compensation expense, included in the operating expense by category, increased approximately $1.5 million to $2.4 million for the three months ended June 30, 2017 from $0.9 million for the three months ended June 30, 2016. Stock-based compensation expense represented 7% of operating expenses for both the three months ended June 30, 2017 and 2016.
As of June 30, 2017, there was approximately $7.6 million and $12.2 million of unrecognized compensation cost related to stock options and unvested restricted stock awards, respectively, which is expected to be recognized over a period of approximately two years.
Three Months Ended June 30, | Change from Prior Year | ||||||||||
2017 | 2016 | ($) | |||||||||
Sales and marketing | $ | 101,035 | $ | 95,295 | $ | 5,740 | |||||
Product development and content | 1,428,743 | 403,956 | 1,024,787 | ||||||||
General and administrative | 838,414 | 416,321 | 422,093 | ||||||||
Total stock-based compensation expense | $ | 2,368,192 | $ | 915,572 | $ | 1,452,620 | |||||
Depreciation and Amortization Expense
Depreciation and amortization expense was $3.0 million and $0.8 million for the three months ended June 30, 2017 and 2016, respectively. The increase in depreciation and amortization expense is primarily attributable to the amortization of intangibles related to the Skout and if(we) acquisitions.
Acquisition and Restructuring Costs
Acquisition and restructuring costs were approximately $3.8 million and $1.2 million for the three months ended June 30, 2017 and 2016, respectively. Acquisition and restricting costs include the transaction costs, including legal and diligence costs, for the acquisition of if(we), the accrual of the exit cost of non-cancellable leases and employee exit and relocation costs. The Company paid approximately $0.9 million in transaction costs in connection with the acquisition of if(we) in the three months ended June 30, 2017.
Benefit from Income Taxes
Benefit from income taxes was $2.7 million and $27.2 million for the three months ended June 30, 2017 and 2016, respectively. Our effective tax rate from operations for the three months ended June 30, 2017 was higher than the effective tax rate for the three months ended June 30, 2016 due to the stock based compensation tax deductions in excess of book expense and an increase in permanent differences, mainly transaction costs, related to the recent acquisition of if(we). The net income tax benefit recorded during the three months ended June 30, 2016 primarily related to a reversal of the entire valuation allowance of $33.6 million.
34
Comparison of the six months ended June 30, 2017 and 2016
The following table sets forth our condensed consolidated statements of operations for the six months ended June 30, 2017 and 2016 that is used in the following discussions of our results of operations:
Six Months Ended June 30, | Change From Prior Year | |||||||||||||
2017 | 2016 | ($) | % | |||||||||||
Revenues | $ | 51,388,265 | $ | 29,710,662 | $ | 21,677,603 | 73.0 | % | ||||||
Operating costs and expenses: | ||||||||||||||
Sales and marketing | 9,705,350 | 5,547,767 | 4,157,583 | 74.9 | % | |||||||||
Product development and content | 24,984,399 | 11,922,162 | 13,062,237 | 109.6 | % | |||||||||
General and administrative | 8,023,226 | 4,215,758 | 3,807,468 | 90.3 | % | |||||||||
Depreciation and amortization | 4,650,014 | 1,505,182 | 3,144,832 | 208.9 | % | |||||||||
Acquisition and restructuring costs | 5,269,854 | 1,160,349 | 4,109,505 | 354.2 | % | |||||||||
Total operating costs and expenses | 52,632,843 | 24,351,218 | 28,281,625 | 116.1 | % | |||||||||
(Loss) income from operations | (1,244,578 | ) | 5,359,444 | (6,604,022 | ) | (123.2 | )% | |||||||
Other income (expense): | ||||||||||||||
Interest income | 3,970 | 11,562 | (7,592 | ) | (65.7 | )% | ||||||||
Interest expense | (177,586 | ) | (12,105 | ) | (165,481 | ) | 1,367.0 | % | ||||||
Change in warrant liability | — | (545,614 | ) | 545,614 | (100.0 | )% | ||||||||
(Loss) gain on foreign currency adjustment | (11,429 | ) | 34,553 | (45,982 | ) | (133.1 | )% | |||||||
Total other expense | (185,045 | ) | (511,604 | ) | 326,559 | (63.8 | )% | |||||||
(Loss) income before income taxes | (1,429,623 | ) | 4,847,840 | (6,277,463 | ) | (129.5 | )% | |||||||
Benefit from income taxes | 2,732,064 | 27,125,446 | (24,393,382 | ) | (89.9 | )% | ||||||||
Net income | $ | 1,302,441 | $ | 31,973,286 | $ | (30,670,845 | ) | (95.9 | )% | |||||
Revenues
Our revenues were approximately $51.4 million for the six months ended June 30, 2017, an increase of $21.7 million or 73.0% compared to $29.7 million for the six months ended June 30, 2016. The increase in revenue is attributable to a $15.3 million increase in mobile revenue, a $5.7 million increase in web revenue, and a $0.6 million increase in cross platform revenue. We believe the increase in mobile revenue is primarily due to increased mobile advertising impressions and increased in-app purchases resulting from the Skout and if(we) acquisitions, and the increased web revenue is primarily due to user generated revenue and subscription revenue from the if(we) acquisition.
Operating Costs and Expenses
Sales and Marketing: Sales and marketing expenses increased approximately $4.2 million, or 74.9%, to $9.7 million for the six months ended June 30, 2017 from $5.5 million for the six months ended June 30, 2016. The net increase in sales and marketing expenses, including the Skout and if(we) sales and marketing related expense, is due to increased advertising spend of approximately $3.6 million, and increased employee expenses of approximately $0.4 million. The increase in employee expenses is primarily due to the Skout and if(we) acquisitions.
Product Development and Content: Product development and content expenses increased approximately $13.1 million, or 109.6%, to $25.0 million for the six months ended June 30, 2017 from $11.9 million for the six months ended June 30, 2016. The net increase in product development and content expense, including the Skout and if(we) product development related expense, is attributable to an increase of employee expenses of $5.4 million, data center and technical operations of $3.3 million, stock-based compensation of $1.2 million, mobile content cost of $0.9 million, and Social Theater content costs of $0.7 million. The increase in employee expenses, data center and technical operations, stock-based compensation, and mobile content costs is attributable to the Skout and if(we) acquisitions. The increase in Social Theater content costs is due to increased Social Theater revenue.
General and Administrative: General and administrative expenses increased $3.8 million or 90.3%, to $8.0 million for the six months ended June 30, 2017 from $4.2 million for the six months ended June 30, 2016. The net increase in general and administrative expense, including the Skout and if(we) general and administrative related expense, is primarily due to an increase of employee expenses of $1.2 million, stock-based compensation of $0.6 million, office related expenses of $0.4 million, professional fees of
35
$0.4 million, business and franchise taxes of $0.4 million and travel related costs of $0.2 million. These increases are attributable primarily to the Skout and if(we) acquisitions.
Comparison of Stock-Based Compensation and Other Costs and Expenses
Stock-Based Compensation
Stock-based compensation expense, included in the operating expense by category, increased approximately $1.9 million to $3.5 million for the six months ended June 30, 2017 from $1.6 million for the six months ended June 30, 2016. Stock-based compensation expense represented 7% of operating expenses for both the six months ended June 30, 2017 and 2016.
As of June 30, 2017, there was approximately $7.6 million and $12.2 million of unrecognized compensation cost related to stock options and unvested restricted stock awards, respectively, which is expected to be recognized over a period of approximately two years.
Six Months Ended June 30, | Change from Prior Year | ||||||||||
2017 | 2016 | ($) | |||||||||
Sales and marketing | $ | 202,304 | $ | 155,732 | $ | 46,572 | |||||
Product development and content | 1,930,043 | 707,653 | 1,222,390 | ||||||||
General and administrative | 1,370,003 | 779,967 | 590,036 | ||||||||
Total stock-based compensation expense | $ | 3,502,350 | $ | 1,643,352 | $ | 1,858,998 | |||||
Depreciation and Amortization Expense
Depreciation and amortization expense was $4.7 million and $1.5 million for the six months ended June 30, 2017 and 2016, respectively. The increase in depreciation and amortization expense is primarily attributable to the amortization of intangibles related to the Skout and if(we) acquisitions.
Acquisition and Restructuring Costs
Acquisition and restructuring costs were approximately $5.3 million and $1.2 million for the six months ended June 30, 2017 and 2016, respectively. Acquisition and restricting costs include the transaction costs including legal and diligence costs for the acquisition of if(we), the accrual of the exit cost of non-cancellable leases and employee exit and relocation costs. The Company paid approximately $1.7 million in transaction costs in connection with the acquisition of if(we) in the six months ended June 30, 2017.
Benefit from Income Taxes
Benefit from income taxes was $2.7 million and $27.1 million for the six months ended June 30, 2017 and 2016, respectively. Our annual effective tax rate (“ETR”) for six months ended June 30, 2017 was 41.11%, which is higher than the effective tax rate for the six months ended June 30, 2016 due to the stock based compensation tax deductions in excess of book expense and an increase in permanent differences, mainly transaction costs, related to the recent acquisition of if(we). The ETR is also higher due to the release of the entire valuation allowance in 2016.
Liquidity and Capital Resources
Six Months Ended June 30, | |||||||
2017 | 2016 | ||||||
Net cash provided by operating activities | $ | 16,662,265 | $ | 10,311,169 | |||
Net cash used in investing activities | (66,397,918 | ) | (494,744 | ) | |||
Net cash provided by financing activities | 60,647,858 | 2,920,019 | |||||
$ | 10,912,205 | $ | 12,736,444 | ||||
36
Net cash provided by operations was approximately $16.7 million for the six months ended June 30, 2017 compared to approximately $10.3 million for the six months ended June 30, 2016.
For the six months ended June 30, 2017, net cash provided by operations consisted primarily of net income of approximately $1.3 million adjusted for certain non-cash expenses of approximately $4.7 million of depreciation and amortization expense and $3.5 million related to stock based compensation for the vesting of stock options. Additionally, changes in working capital increased the net cash provided by operations. These changes included decreases in accounts receivable of approximately $5.9 million resulting from collections and decreases of $1.6 million in prepaid expenses, and other current assets and other assets.
Net cash used in investing activities in the six months ended June 30, 2017 of was primarily due to the acquisition of if(we) of $65.8 million, net of cash and restricted cash acquired, as well as approximately $0.6 million due to capital expenditures for computer equipment to increase capacity and improve performance.
Net cash provided by financing activities in the six months ended June 30, 2017 of approximately $60.6 million was due to approximately $43.0 million of proceeds from a common stock offering, $15.0 million of proceeds from debt, $2.8 million from the exercise of stock options and $2.4 million from the exercise of warrants. These increases in cash were partially offset by $1.9 million payments of debt, $0.5 million of payments for restricted stock awards withheld for taxes and $0.1 million of capital lease payments.
June 30, 2017 | December 31, 2016 | ||||||
Cash and cash equivalents | $ | 32,252,734 | $ | 21,852,531 | |||
Total assets | $ | 278,274,133 | $ | 209,489,484 | |||
Percentage of total assets | 11.6 | % | 10.4 | % | |||
Our cash balances are kept liquid to support our growing infrastructure needs for operational expansion. The majority of our cash is concentrated in two large financial institutions.
As of June 30, 2017, we had positive working capital of approximately $33.3 million.
During the six months ended June 30, 2017, the Company did not enter into any additional capital leases. As of June 30, 2017, capital leases that were previously entered into had approximately $0.1 million in principal amount of capital lease indebtedness, all of which is due in the remainder of 2017.
We believe that with its current available cash, anticipated revenues and collections on its accounts receivables and its access to capital through various financing options, the Company will have sufficient funds to meet its anticipated cash needs for at least the next 12 months from the date of this filing.
We have budgeted capital expenditures of approximately $3.4 million for the remainder of 2017, which we believe will support our growth of domestic and international business through increased capacity, performance improvement and expanded content.
Off-Balance Sheet Arrangements
As of June 30, 2017, we did not have any relationships with unconsolidated entities or financial partners, such as entities often referred to as structured finance or special purpose entities, established for the purpose of facilitating off-balance sheet arrangements or other contractually narrow or limited purposes. As such, we are not materially exposed to any financing, liquidity, market or credit risk that could arise if we had engaged in such relationships.
37
Non-GAAP - Financial Measure
The following discussion and analysis includes both financial measures in accordance with GAAP, as well as adjusted EBITDA, which is a non-GAAP financial measure. Generally, a non-GAAP financial measure is a numerical measure of a company’s performance, financial position or cash flows that either excludes or includes amounts that are not normally included or excluded in the most directly comparable measure calculated and presented in accordance with GAAP. Non-GAAP financial measures should be viewed as supplemental to, and should not be considered as alternatives to, net income, operating income, and cash flow from operating activities, liquidity or any other financial measures. They may not be indicative of our historical operating results nor are they intended to be predictive of potential future results. Investors should not consider non-GAAP financial measures in isolation or as substitutes for performance measures calculated in accordance with GAAP.
We believe that both management and stockholders benefit from referring to adjusted EBITDA in planning, forecasting, and analyzing future periods. We use this non-GAAP financial measure in evaluating our financial and operational decision making and as a means to evaluate period-to-period comparison.
We define Adjusted EBITDA as earnings (or loss) from operations before interest expense, benefit or provision for income taxes, depreciation and amortization, stock-based compensation, changes in warrant obligations, nonrecurring acquisition, restructuring or other expenses, gain or loss on cumulative foreign currency translation adjustment, gains on sales of assets, bad debt expense outside the normal range, and goodwill and long-lived asset impairment charges, if any. We exclude stock-based compensation because it is non-cash in nature. We believe Adjusted EBITDA is an important measure of our operating performance because it allows management, investors, and analysts to evaluate and assess our core operating results from period to period after removing the impact of acquisition related costs, and other items of a non-operational nature that affect comparability. We recognize that Adjusted EBITDA has inherent limitations because of the excluded items.
We have included a reconciliation of our net income, which is the most comparable financial measure calculated in accordance with GAAP, to Adjusted EBITDA. We believe that providing this non-GAAP financial measure, together with the reconciliation from GAAP, helps investors make comparisons between us and other companies. In making any comparisons to other companies, investors need to be aware that companies use different non-GAAP measures to evaluate their financial performance. Investors should pay close attention to the specific definition being used and to the reconciliation between such measure and the corresponding GAAP measure provided by each company under applicable SEC rules.
The following table presents a reconciliation of net income, a GAAP financial measure, to Adjusted EBITDA:
Three Months Ended June 30, | Six Months Ended June 30, | ||||||||||||||
ADJUSTED EBITDA | 2017 | 2016 | 2017 | 2016 | |||||||||||
Net income | $ | 856,595 | $ | 29,618,389 | $ | 1,302,441 | $ | 31,973,286 | |||||||
Interest expense | 175,254 | 5,360 | 177,586 | 12,105 | |||||||||||
Change in warrant liability | — | 787,391 | — | 545,614 | |||||||||||
Benefit from income taxes | (2,732,356 | ) | (27,219,764 | ) | (2,732,064 | ) | (27,125,446 | ) | |||||||
Depreciation and amortization | 2,965,175 | 753,918 | 4,650,014 | 1,505,182 | |||||||||||
Stock-based compensation expense | 2,368,192 | 915,572 | 3,502,350 | 1,643,352 | |||||||||||
Acquisition and restructuring | 3,769,425 | 1,160,349 | 5,269,854 | 1,160,349 | |||||||||||
Loss (gain) on foreign currency adjustment | 9,229 | (18,201 | ) | 11,429 | (34,553 | ) | |||||||||
ADJUSTED EBITDA | $ | 7,411,514 | $ | 6,003,014 | $ | 12,181,610 | $ | 9,679,889 | |||||||
Item 3. QUANTITATIVE AND QUALITATIVE DISCLOSURES ABOUT MARKET RISK.
The primary objective of our investment activities is to preserve principal while at the same time maximizing yields without significantly increasing risk. Our cash balance as of June 30, 2017 was held in insured depository accounts, of which $30.0 million exceeded insurance limits.
38
Item 4. CONTROLS AND PROCEDURES
Evaluation of Disclosure Controls and Procedures.
With the participation of our Chief Executive Officer and Chief Financial Officer, we have evaluated the effectiveness of our disclosure controls and procedures (as such term is defined in Rules 13a-15(e) and 15d-15(e) under the Securities Exchange Act of 1934), as of the end of the period covered by this report. Based upon such evaluation, our Chief Executive Officer and Chief Financial Officer have concluded that our disclosure controls and procedures are effective as of the end of the period covered by this report.
Changes in Internal Controls Over Financial Reporting
There was no change in our internal control over financial reporting that occurred during the fiscal quarter ended June 30, 2017, noted during the evaluation of controls as of the end of the period covered by this report, that has materially affected, or is reasonably likely to materially affect, our internal control over financial reporting, except for the acquisition of if(we).
Limitations on the Effectiveness of Controls
A control system, no matter how well designed and operated, can provide only reasonable, not absolute, assurance that the control system’s objectives will be met. The Company’s management, including its Principal Executive Officer and its Principal Financial Officer, do not expect that the Company’s disclosure controls will prevent or detect all errors and all fraud. Further, the design of a control system must reflect the fact that there are resource constraints, and the benefits of controls must be considered relative to their costs. Because of the inherent limitations in all control systems, no evaluation of controls can provide absolute assurance that all control issues and instances of fraud, if any, within the Company have been detected. These inherent limitations include the realities that judgments in decision-making can be faulty, and that breakdowns can occur because of simple error or mistake. Controls can also be circumvented by the individual acts of some persons, by collusion of two or more people, or by management override of the controls. The design of any system of controls is based in part upon certain assumptions about the likelihood of future events, and there can be no assurance that any design will succeed in achieving its stated goals under all potential future conditions. Over time, controls may become inadequate because of changes in conditions or deterioration in the degree of compliance with associated policies or procedures. Because of the inherent limitations in a cost-effective control system, misstatements due to error or fraud may occur and not be detected.
39
PART II. OTHER INFORMATION
Item 1. Legal Proceedings
From time to time, we are party to certain legal proceedings that arise in the ordinary course and are incidental to our business. There are currently no such pending proceedings to which we are a party that our management believes will have a material adverse effect on the Company’s consolidated financial position or results of operations. However, future events or circumstances, currently unknown to management, will determine whether the resolution of pending or threatened litigation or claims will ultimately have a material effect on our consolidated financial position, liquidity or results of operations in any future reporting periods. See Note 7- Commitments and Contingencies to the unaudited condensed consolidated financial statements contained in this report for information on specific matters.
Item 1A. Risk Factors
Our Annual Report on Form 10-K for the year ended December 31, 2016 filed with the SEC on March 9, 2017 and our Quarterly Report on Form 10-Q for the quarter ended March 31, 2017 filed with the SEC on May 10, 2017 include detailed discussions of our risk factors under the headings “Part I, Item 1A. Risk Factors” and “Part II, Item 1A. Risk Factors” respectively. You should carefully consider the risk factors discussed in our Annual Report on Form 10-K and Quarterly Report on Form 10-Q, as well as the other information in this report, which could materially harm our business, financial condition, results of operations, or the value of our common shares
Item 2. Unregistered Sales of Equity Securities and Use of Proceeds
Not applicable.
Item 3. Defaults upon Senior Securities
Not applicable.
Item 4. Mine Safety Disclosures.
Not applicable.
Item 5. Other Information
Not applicable.
40
Item 6. EXHIBITS
Filed or Furnished Herewith | ||||||||||
Incorporated by Reference | ||||||||||
Exhibit No. | Exhibit Description | Form | Date | Number | ||||||
31.1 | Certification of Principal Executive Officer (Section 302) | Filed | ||||||||
31.2 | Certification of Principal Financial Officer (Section 302) | Filed | ||||||||
32.1 | Certification of Principal Executive Officer (Section 906) | Furnished* | ||||||||
32.2 | Certification of Principal Financial Officer (Section 906) | Furnished* | ||||||||
101.INS | XBRL Instance Document | ** | ||||||||
101.SCH | XBRL Taxonomy Extension Schema Document | ** | ||||||||
101.CAL | XBRL Taxonomy Extension Calculation Linkbase Document | ** | ||||||||
101.DEF | XBRL Taxonomy Extension Definition Linkbase Document | ** | ||||||||
101.LAB | XBRL Taxonomy Extension Label Linkbase Document | ** | ||||||||
101.PRE | XBRL Taxonomy Extension Presentation Linkbase Document | ** | ||||||||
* This exhibit is being furnished rather than filed and shall not be deemed incorporated by reference into any filing, in accordance with Item 601 of Regulation S-K.
** Attached as Exhibit 101 to this report are the Company’s financial statements for the quarter ended June 30, 2017 formatted in XBRL (eXtensible Business Reporting Language). The XBRL-related information in Exhibit 101 in this report shall not be deemed “filed” or a part of a registration statement or prospectus for purposes of Sections 11 or 12 of the Securities Act of 1933, and is not filed for purposes of Section 18 of the Securities Exchange Act of 1934, or otherwise subject to the liabilities of those sections.
41
SIGNATURES
Pursuant to the requirements of the Securities Exchange Act of 1934, the registrant has duly caused this report to be signed on its behalf by the undersigned hereunto duly authorized.
THE MEET GROUP, INC. | ||
August 4, 2017 | By: | /s/Geoffrey Cook |
Geoffrey Cook | ||
Chief Executive Officer | ||
(Principal Executive Officer) | ||
August 4, 2017 | By: | /s/ David Clark |
David Clark | ||
Chief Financial Officer | ||
(Principal Financial Officer) | ||
42