Attached files
| file | filename |
|---|---|
| 8-K - 8-K - Q2 2017 EARNINGS CALL TRANSCRIPT AND SLIDES - MOSAIC CO | a8-kcy17xq2earningscalltra.htm |
| EX-99.1 - EXHIBIT 99.1 - 2017 Q2 EARNINGS CALL TRANSCRIPT - MOSAIC CO | a2q2017earningstranscripte.htm |

Presenters:
Date:
Earnings Conference Call – Second Quarter 2017
August 1, 2017
Joc O’Rourke, President and Chief Executive Officer
Rich Mack, Executive Vice President and Chief Financial Officer
Laura Gagnon, Vice President Investor Relations
The Mosaic Company

MOSAIC CONFIDENTIAL
Forward Looking Statements
Forward-Looking Statements
This document contains forward-looking statements within the meaning of the Private Securities Litigation Reform Act of 1995. Such statements include, but are not limited to, statements about our
proposed acquisition of the global phosphate and potash operations of Vale S.A. (“Vale”) conducted through Vale Fertilizantes S.A. (the “Transaction”) and the anticipated benefits and synergies of the
proposed Transaction, other proposed or pending future transactions or strategic plans and other statements about future financial and operating results. Such statements are based upon the current
beliefs and expectations of The Mosaic Company’s management and are subject to significant risks and uncertainties. These risks and uncertainties include but are not limited to risks and uncertainties
arising from the possibility that the closing of the proposed Transaction may be delayed or may not occur, including delays or risks arising from any inability to obtain governmental approvals of the
Transaction on the proposed terms and schedule, any inability of Vale to achieve certain other specified regulatory and operational milestones, and the ability to satisfy any of the other closing conditions;
our ability to secure financing, or financing on satisfactory terms and in amounts sufficient to fund the cash portion of the purchase price without the need for additional funds from other liquidity sources;
difficulties with realization of the benefits of the proposed Transaction, including the risks that the acquired business may not be integrated successfully or that the anticipated synergies or cost or capital
expenditure savings from the Transaction may not be fully realized or may take longer to realize than expected, including because of political and economic instability in Brazil or changes in government
policy in Brazil; the predictability and volatility of, and customer expectations about, agriculture, fertilizer, raw material, energy and transportation markets that are subject to competitive and other pressures
and economic and credit market conditions; the level of inventories in the distribution channels for crop nutrients; the effect of future product innovations or development of new technologies on demand for
our products; changes in foreign currency and exchange rates; international trade risks and other risks associated with Mosaic’s international operations and those of joint ventures in which Mosaic
participates, including the performance of the Wa’ad Al Shamal Phosphate Company (also known as MWSPC) and the entity operating the Miski Mayo mine, the risk that protests against natural resource
companies in Peru extend to or impact the Miski Mayo mine, the ability of MWSPC to obtain additional planned funding in acceptable amounts and upon acceptable terms, the timely development and
commencement of operations of production facilities in the Kingdom of Saudi Arabia, the future success of current plans for MWSPC and any future changes in those plans; difficulties with realization of the
benefits of our long term natural gas based pricing ammonia supply agreement with CF Industries, Inc., including the risk that the cost savings initially anticipated from the agreement may not be fully
realized over its term or that the price of natural gas or ammonia during the term are at levels at which the pricing is disadvantageous to Mosaic; customer defaults; the effects of Mosaic’s decisions to exit
business operations or locations; changes in government policy; changes in environmental and other governmental regulation, including expansion of the types and extent of water resources regulated
under federal law, carbon taxes or other greenhouse gas regulation, implementation of numeric water quality standards for the discharge of nutrients into Florida waterways or efforts to reduce the flow of
excess nutrients into the Mississippi River basin, the Gulf of Mexico or elsewhere; further developments in judicial or administrative proceedings, or complaints that Mosaic’s operations are adversely
impacting nearby farms, business operations or properties; difficulties or delays in receiving, increased costs of or challenges to necessary governmental permits or approvals or increased financial
assurance requirements; resolution of global tax audit activity; the effectiveness of Mosaic’s processes for managing its strategic priorities; adverse weather conditions affecting operations in Central
Florida, the Mississippi River basin, the Gulf Coast of the United States or Canada, and including potential hurricanes, excess heat, cold, snow, rainfall or drought; actual costs of various items differing
from management’s current estimates, including, among others, asset retirement, environmental remediation, reclamation or other environmental regulation, Canadian resources taxes and royalties, or the
costs of the MWSPC, its existing or future funding and Mosaic’s commitments in support of such funding; reduction of Mosaic’s available cash and liquidity, and increased leverage, due to its use of cash
and/or available debt capacity to fund financial assurance requirements and strategic investments; brine inflows at Mosaic’s Esterhazy, Saskatchewan, potash mine or other potash shaft mines; other
accidents and disruptions involving Mosaic’s operations, including potential mine fires, floods, explosions, seismic events, sinkholes or releases of hazardous or volatile chemicals; and risks associated with
cyber security, including reputational loss, as well as other risks and uncertainties reported from time to time in The Mosaic Company’s reports filed with the Securities and Exchange Commission. Actual
results may differ from those set forth in the forward-looking statements.
2

MOSAIC CONFIDENTIAL
Executive Summary
3
Visible Cost and
Capital Controls
Vale Fertilizantes
Integration Planning
On Track
Gradual Recovery in
Potash and
Phosphate Markets
Managing the
Business to
Maximize Long Term
Opportunity

MOSAIC CONFIDENTIAL
Focused on Items in Our Control
4
▪ Ahead of schedule on meaningful cost reduction program:
• Q2’17 MOP cash production costs of $77, including $14 of cash brine management expenses*
• Q2’17 SG&A at $71 million, down sequentially and year over year
Cost
Reduction
Capital
Expenditures
Capital
Philosophy
▪ Additional $50 million reduction in CAPEX for 2018 and beyond:
• Maintaining mechanical integrity and asset reliability
• Continued strong safety track record
▪ Unchanged capital priorities:
• Focus on debt pay down post Vale Fertilizantes transaction
• Committed to investment grade credit ratings
1
2
3
*Potash cash production costs shown approximate costs capitalized on the balance sheet.

MOSAIC CONFIDENTIAL
Financial Results Review
5

MOSAIC CONFIDENTIAL
Phosphates Results and Guidance
6
GuidanceSecond Quarter 2017 Results
Volumes
Price
Margin
2.3M 2.6M2.6M
$320 $340$336
High Single Digits
8%
Phosphates Q3 2017
Q3 Sales Volumes 2.2 to 2.5 million tonnes
Q3 DAP Selling Price $310 to $330 per tonne
Q3 Gross Margin Rate 7 to 9 percent
Q3 Operating Rate Mid 80 percent
Full Year Sales Volumes 9.5 to 10 million tonnes
Global Shipments 67 to 68 million tonnes
Guidance Range
Actuals

MOSAIC CONFIDENTIAL
CF Ammonia Contract Update
7

MOSAIC CONFIDENTIAL
China Phosphate Exports: Higher Level of Uncertainty
8
4
5
6
7
8
9
10
11
12
10 11 12 13 14 15 16 17E
Million Tonnes
China DAP/MAP/TSP Exports
Actual High Forecast Low ForecastSource: China Customs, Mosaic
• Exports up YTD
• Continue to Expect
a Decline in 2017

MOSAIC CONFIDENTIAL
Potash Results and Guidance
9
Potash Q3 2017
Q3 Sales Volumes 1.9 to 2.2 million tonnes
Q3 MOP Selling Price $165 to $180 per tonne
Q3 Gross Margin Rate 15 to 18 percent
Q3 Operating Rate Low 80 percent*
Full Year Sales Volumes 8.1 to 8.6 million tonnes
Global Shipments 62 to 63 million tonnes
GuidanceSecond Quarter 2017 Results
Volumes
Price
Margin
2.2M 2.3M
Guidance Range
Actuals
2.0M
$170 $185$179
23%
*Operating rate guidance reflects lower operational capacity at the Colonsay mine.
~20%

MOSAIC CONFIDENTIAL
International Distribution Results and Guidance
10
GuidanceSecond Quarter 2017 Results
Volumes
Margin/Tonne
1.4M 1.7M
~$20 $24
International Distribution Q3 2017
Q3 Sales Volumes 2.3 to 2.6 million tonnes
Q3 Gross Margin per Tonne Low $20*
Full Year Sales Volumes 6.75 to 7.25 million tonnes
Guidance Range
Actuals
1.6M
*Based on the current BRL / USD exchange rate.

MOSAIC CONFIDENTIAL
Other Full-Year Guidance
11
Consolidated Full-Year 2017
Total SG&A $295 to $310 million
Capital Expenditures $800 million to $850 million
Effective Tax Rate Zero to Slightly Negative
Potash 2017
Full Year Canadian Resources Taxes $90 to $110 million
Full Year Brine Management Costs $150 to $160 million

MOSAIC CONFIDENTIAL
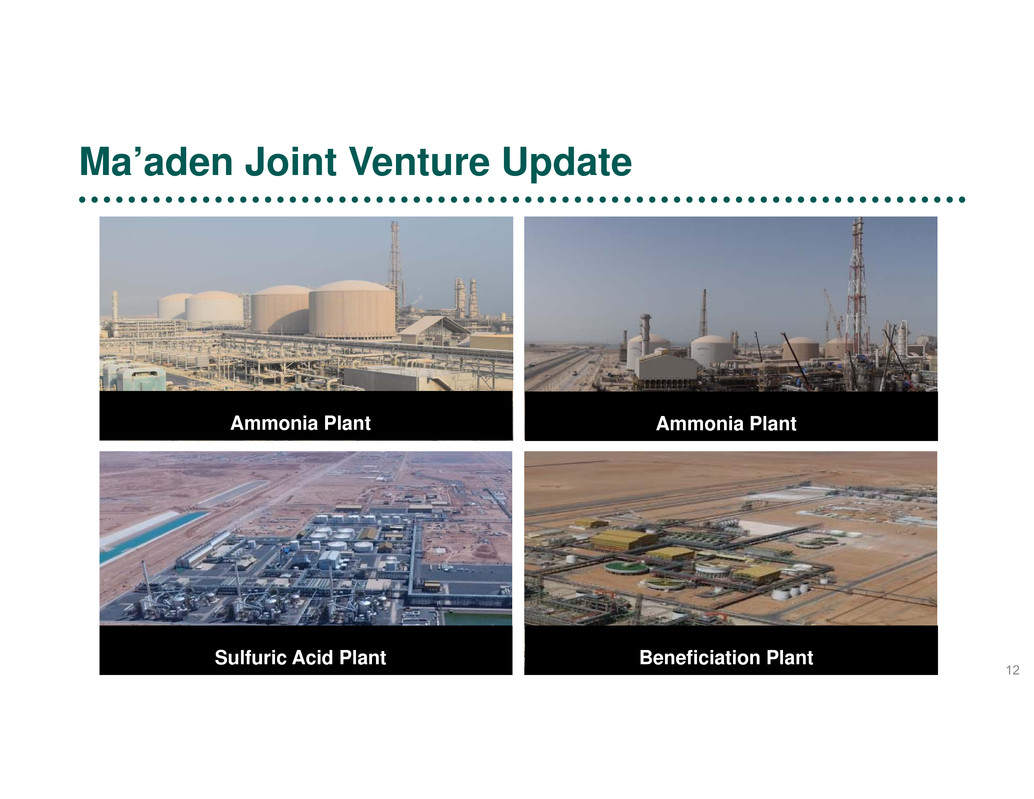
Ma’aden Joint Venture Update
12
Ammonia Plant Ammonia Plant
Sulfuric Acid Plant Beneficiation Plant

MOSAIC CONFIDENTIAL
Closing Remarks and Appendix
13

MOSAIC CONFIDENTIAL
Global Potash and Phosphate Shipments
14
62.8
25
30
35
40
45
50
55
60
65
70
00 01 02 03 04 05 06 07 08 09 10 11 12 13 14 15 16 17E 18F
Global Potash ShipmentsMillion Tonnes KCl
Source: Company Reports, IFA, CRU and Mosaic
63.5 - 65.5
67.5
25
30
35
40
45
50
55
60
65
70
75
00 01 02 03 04 05 06 07 08 09 10 11 12 13 14 15 16 17E 18F
Global Phosphate ShipmentsMillion Tonnes
DAP/MAP/NPS/TSP
Source: Company Reports, IFA, CRU and Mosaic
68 - 70
Expect Record P & K Shipments in 2018

MOSAIC CONFIDENTIAL
Raw Material Cost Detail
15
Ammonia
($/Tonne)
Second
Quarter 2017 Percent
Realized in COGS $373
Average Purchase Price $308
Realized in COGS $90
Average Purchase Price $70
Sulfur
($/Tonne)
Phosphate
Rock
(realized in COGS)
(‘000 tonnes)
U.S. mined rock 4,126 92%
Purchased Miski Mayo Rock 268 6%
Other Purchased Rock 93 2%
Total 4,487 100%
Average cost / tonne consumed rock $58

MOSAIC CONFIDENTIAL
Earnings Sensitivity to Key Drivers(a)
16
(a) These factors do not change in isolation; actual results could vary from the above estimates
(b) Assumes no change to KMAG pricing
2017 Q2
Actual Change
2017 Q2
Margin %
Actual
% Impact on
Segment
Margin
Pre-Tax
Impact
Quarterly
EPS Impact
Marketing
MOP Price ($/tonne)(b) $179 $50 23% 23% $110 $0.33
Potash Volume
(thousand tonnes) 2,191 500 23% 11% $49 $0.15
DAP Price ($/tonne) $336 $50 8% 13% $129 $0.39
Phosphate Volume
(thousand tonnes) 2,582 500 8% 3% $31 $0.09
Raw Materials
Sulfur ($/lt) $90 $50 8% 5% $52 $0.16
Ammonia ($/tonne) $373 $50 8% 3% $30 $0.09

MOSAIC CONFIDENTIAL
Phosphate Raw Material Trends
17
0
50
100
150
200
250
300
350
400
450
500
Q3
2015
Q4
2015
Q1
2016
Q2
2016
Q3
2016
Q4
2016
Q1
2017
Q2
2017
Q3
2017F
Realized Costs Market Prices
0
25
50
75
100
125
150
175
Sulfur
(long
ton)(p)
Q3
2015
Q4
2015
Q1
2016
Q2
2016
Q3
2016
Q4
2016
Q1
2017
Q2
2017
Q3
2017F
Realized Costs Market Prices
Ammonia Sulfur
($/tonne) ($/tonne)
1. Market ammonia prices are average prices based upon Tampa C&F as reported by Fertecon
2. Market sulfur prices are average prices based upon Tampa C&F as reported by Green Markets
3. Realized raw material costs include:
~$20/tonne of transportation, transformation and storage costs for sulfur
~$35/tonne of transportation and storage costs for ammonia
1 2

MOSAIC CONFIDENTIAL
Global Potash Shipment Forecasts by Region (August 1, 2017)
18
Muriate of Potash
Million Tonnes (KCl) 2015 2016 2017E
Low
2018F
High
2018F Comments
China 16.4 14.0 15.6 15.8 16.0
Shipments are projected to recover to 15.6 mmt in 2017 (7.5 mmt production plus 8.1 mmt net
imports). After spiking to 9.2 mmt in 2015, imports plunged to 6.5 mmt in 2016. Despite farm
program uncertainties, changes in crop mix are unlikely to impact on-farm K use in 2018.
India 4.1 3.9 4.4 4.4 4.6
Shipments are forecast to increase to 4.4 mmt in CY 2017 and to 4.5 mmt in 2018. Despite a lower
2017/18 subsidy and 5% GST, a good monsoon, higher minimum support prices for key crops, a
relatively strong rupee, and moderate K prices underpin improving demand prospects.
Indonesia+Malaysia 4.6 4.7 4.8 4.8 5.0
Shipments continue to trend upward driven by normal rainfall this year, lower and more stable K
prices, increases in palm oil production, and moderate palm oil prices.
Other Asia 4.4 4.5 4.6 4.7 4.9
Bangladesh, Thailand, and Vietnam account for most of the projected increase. Demand is buoyed
by good weather, favorable policies, and stronger crop prices (e.g. recent rice prices).
W. Europe 4.8 4.8 4.6 4.5 4.6
Shipments are expected to drop slightly this year and again in 2018 as a result of elevated channel
inventories and the current drought in southern parts of the region.
E. Europe+FSU 4.7 4.9 4.9 5.0 5.2
Shipments here are on the rise despite less favorable weather this year. Moderate crop prices
combined with weak currencies continue to bolster the agricultural output and K demand.
Brazil 8.8 9.2 9.7 10.0 10.4
Shipments were flat but imports were up 18% during the FH of 2017 due to farmers holding back
grain sales and deferring K purchases. Shipments are expected to pick up during the SH and hit our
9.7 mmt forecast. Demand drivers continue to look positive despite a stronger real.
Other L. America 2.6 2.9 2.6 2.5 2.7
Shipments are projected to drop this year following the import surge and channel inventory build last
year. Imports are projected to remain stable in 2018.
N. America 8.8 9.4 9.2 9.2 9.4
Shipments jumped in CY 2016 as a result of outstanding 2015/16 spring shipments and record
2016/17 fall shipments. On-farm potash use is projected to remain about flat despite changes in crop
mix with shipments also staying stable at 9.2-9.3 in CY 2017 and 2018.
Other 2.5 2.4 2.6 2.6 2.7 Africa is expected to account for much of the projected gain in shipments in 2017 and 2018.
Total 61.7 60.7 62.8 63.5 65.5
Shipments are forecast to increase to 62.8 mmt in 2017, up 3.5% or 2.1 mmt from last year. The “Big
Six” consuming regions led by the big rebound in China account for all of the projected increase. Our
point estimate for 2018 is 64.5 mmt, a gain of 2.7% or 1.7 mmt.

MOSAIC CONFIDENTIAL
Global Phosphate Shipment Forecasts by Region (August 1, 2017)
19
DAP / MAP /
NPS* / TSP
(Million Tonnes) 2015 2016 2017F
Low
2018F
High
2018F Comments
China 19.8 18.4 18.1 18.1 18.3
Shipments are expected to stabilize at a little over 18 mmt in 2017, with a strong domestic pull expected this
fall with domestic prices lower year-over-year, and despite the uncertainties surrounding farm support
programs. For 2018, we expect little change to demand.
India 9.2 9.2 9.5 9.5 9.7
Despite the slow start for shipments through the first five months of the year (down by ~250,000 tonnes), we
have raised our expectations for full-year 2017 on the basis of depleted channel stocks to begin Kharif,
strong farmer demand with a normal monsoon and expectations for continued momentum for the upcoming
Rabi season. The downward revision to the new GST to 5% is also expected to provide a boost. We project
this positive momentum to continue in 2018, though with implementation of the Direct Benefit Scheme a
potential wild-card.
Other
Asia/Oceania 9.1 8.8 9.4 9.5 9.8
Our 2017 forecast is unchanged, showing a sharp +6% recovery in shipments, driven by strong import
demand across the region. Assuming normal weather, we expect demand to grow at a more moderate ~2%
in 2018.
Europe
and FSU 4.8 5.2 5.2 5.2 5.4
Our 2017 forecast is unchanged. After a lackluster spring season in the EU, dry conditions should provide
ample opportunity for some catch-up in the fall season, while a wheat price recovery should also provide a
small boost to demand prospects. Modest growth is projected in 2018, as we are projecting a temporary
slowdown in Russian demand growth.
Brazil 6.9 7.8 8.4 8.7 9.0
We continue to call for record-busting shipments in 2017, though we have pulled back our volume forecast
slightly due to the slower than expected first half for shipments that has seen volume for all phosphates rise
by just 1% y-o-y. However, YTD imports of DAP/MAP/TSP are up by over half a million tonnes. Farm
economics remain good despite the relative strength of the real and the slow pace of selling this year’s
record-shattering harvest. We anticipate growth to continue in 2018, with shipments rising by a more
moderate ~400,000t y-o-y or 4.5%.
Other Latin
America 2.8 3.5 3.6 3.7 4.0
We have left our forecast for 2017 little-changed, calling for demand to be flat or slightly higher. YTD
shipments in Argentina remain in line with last year’s elevated levels (when they doubled y-o-y).
Expectations for 2018 show a pick-up in the pace of demand growth, with good farmer economics persisting,
particularly in Argentina where soybean export tariffs are to be lowered.
North America 8.9 9.3 9.5 9.4 9.6
The weather-challenged 2017 spring season was about average, but we believe it ended with very low
channel stocks. Summer fill interest has been above average and we now project an uptick in shipments in
2017. Our 2018 forecast has shipments flat on OK farm economics.
Other 3.8 3.8 3.9 3.9 4.2
Our forecast for 2017 is little-changed. Remarkable demand growth (albeit from a low base) continues to
spread across Africa, and there is likely further upside to our 2018 forecast because of it, though limited
demand growth prospects in the Middle East continue to act as a drag.
Total 65.2 66.0 67.5 68.0 70.0
Our shipment forecast for 2017 remains at 67-68 million tonnes, and our preliminary forecast for 2018 is in
the middle of our 68-70 mmt range.
