Attached files
| file | filename |
|---|---|
| EX-99.1 - EX-99.1 - IES Holdings, Inc. | d437898dex991.htm |
| 8-K - FORM 8-K - IES Holdings, Inc. | d437898d8k.htm |
Exhibit 99.2

IES Holdings, Inc. Third Quarter 2017 Update August 4, 2017
2 Disclosures Forward-Looking Statements Certain statements in this document may be deemed “forward-looking statements” within the meaning of Section 27A of the Securities Act of 1933 and Section 21E of the Securities Exchange Act of 1934, all of which are based upon various estimates and assumptions that the Company believes to be reasonable as of the date hereof. In some cases, you can identify forward-looking statements by terminology such as “may,” “will,” “could,” “should,” “expect,” “plan,” “project,” “intend,” “anticipate,” “believe,” “seek,” “estimate,” “predict,” “potential,” “pursue,” “target,” “continue,” the negative of such terms or other comparable terminology. These statements involve risks and uncertainties that could cause the Company’s actual future outcomes to differ materially from those set forth in such statements. Such risks and uncertainties include, but are not limited to, the ability of our controlling shareholder to take action not aligned with other shareholders; the possibility that certain tax benefits of our net operating losses may be restricted or reduced in a change in ownership or a change in the federal tax rate; the potential recognition of valuation allowances on net deferred tax assets; the inability to carry out plans and strategies as expected, including our inability to identify and complete acquisitions that meet our investment criteria in furtherance of our corporate strategy; competition in the industries in which we operate, both from third parties and former employees, which could result in the loss of one or more customers or lead to lower margins on new projects; fluctuations in operating activity due to downturns in levels of construction, seasonality and differing regional economic conditions; and our ability to successfully manage projects, as well as other risk factors discussed in this document, in the Company’s annual report on Form 10-K for the year ended September 30, 2016 and in the Company’s other reports on file with the SEC. You should understand that such risk factors could cause future outcomes to differ materially from those experienced previously or those expressed in such forward-looking statements. The Company undertakes no obligation to publicly update or revise any information, including information concerning its controlling shareholder, net operating losses, borrowing availability, or cash position, or any forward-looking statements to reflect events or circumstances that may arise after the date of this document. Forward-looking statements are provided in this document pursuant to the safe harbor established under the Private Securities Litigation Reform Act of 1995 and should be evaluated in the context of the estimates, assumptions, uncertainties, and risks described herein. Non-GAAP Financial Measures and Other Adjustments This document includes adjusted net income attributable to IES and, in the non-GAAP reconciliation table included herein, adjusted net income before taxes, both of which are financial measures not calculated in accordance with generally accepted accounting principles in the U.S. (“GAAP”). Management believes that these measures provide useful information to our investors by distinguishing certain noncash events such as our valuation allowances release, and that these measures, when reconciled to net income attributable to IES, which is the most directly comparable GAAP measure, help our investors to better identify underlying trends in the operations of our business and facilitate easier comparisons of our financial performance with prior and future periods and to our peers. Non-GAAP financial measures should not be considered in isolation from, or as a substitute for, financial information calculated in accordance with GAAP. Investors are encouraged to review the reconciliation of these non-GAAP measures to their most directly comparable GAAP financial measures. A reconciliation of these non-GAAP financial measures to GAAP results has been provided in the financial tables included in this document. General information about IES Holdings, Inc. can be found at http://www.ies-co.com under “Investors.” For further details on the Company’s financial results, please refer to the Company’s annual report on Form 10-K for the fiscal year ended September 30, 2016, any amendments thereto, and the Company’s other reports on file with the SEC. The Company’s annual report on Form 10-K, quarterly reports on Form 10-Q and current reports on Form 8-K, as well as any amendments to those reports, are available free of charge through the Company’s website as soon as reasonably practicable after they are filed with, or furnished to, the SEC.
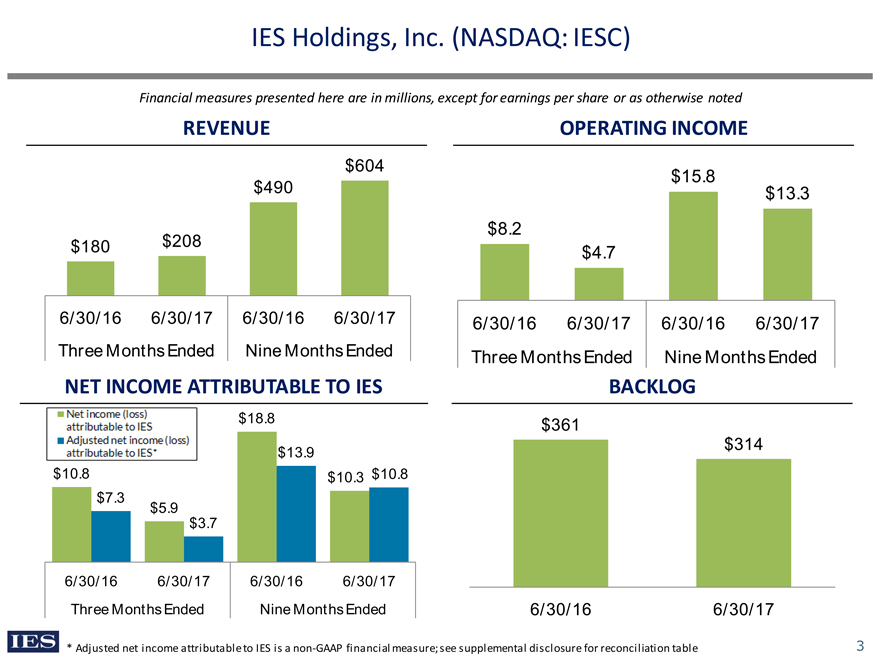
IES Holdings, Inc. (NASDAQ: IESC) Financial measures presented here are in millions, except for earnings per share or as otherwise noted REVENUE OPERATING INCOME 6/30/17 6/30/17 6/30/16 6/30/17 Three Months Ended Nine Months Ended 6/30/16 6/30/17 Three Months Ended 6/30/16 6/30/17 Nine Months Ended NET INCOME ATTRIBUTABLE TO IES BACKLOG Net income (loss) attributable to IES Adjusted net income (loss) attributable to IES 6/30/16 6/30/17 Three Months Ended 6/30/16 6/30/17 Nine Months Ended 3 $10.8 $5.9 $18.8 $10.3 $7.3 $3.7 $13.9 $10.8 6/30/16 6/30/17 6/30/16 * Adjusted net income attributable to IES is a non-GAAP financial measure; see supplemental disclosure for reconciliation table
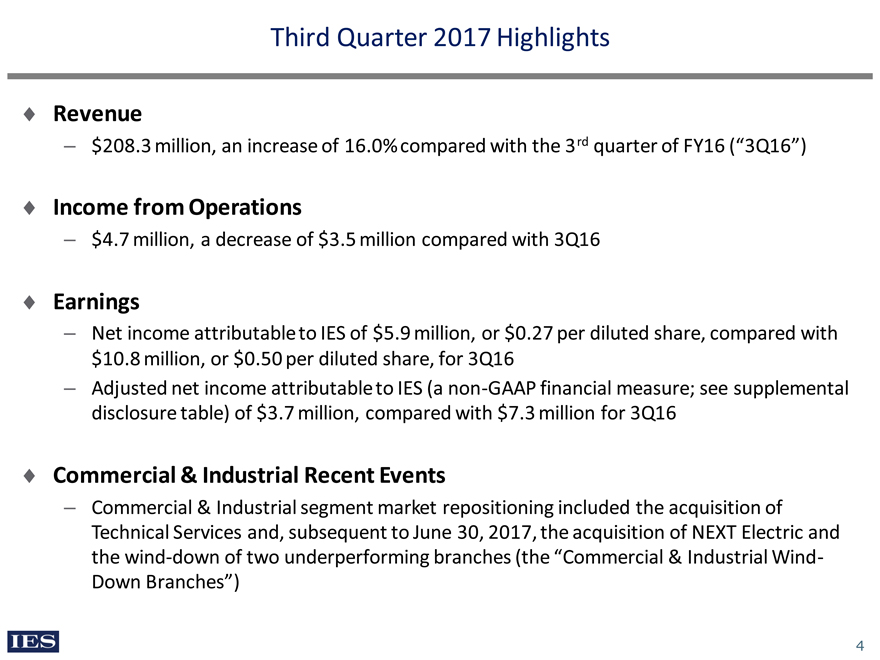
4 Third Quarter 2017 Highlights Revenue –$208.3 million, an increase of 16.0% compared with the 3rd quarter of FY16 (“3Q16”) Income from Operations –$4.7 million, a decrease of $3.5 million compared with 3Q16 Earnings –Net income attributable to IES of $5.9 million, or $0.27 per diluted share, compared with $10.8 million, or $0.50 per diluted share, for 3Q16 –Adjusted net income attributable to IES (a non-GAAP financial measure; see supplemental disclosure table) of $3.7 million, compared with $7.3 million for 3Q16 Commercial & Industrial Recent Events –Commercial & Industrial segment market repositioning included the acquisition of Technical Services and, subsequent to June 30, 2017, the acquisition of NEXT Electric and the wind-down of two underperforming branches (the “Commercial & Industrial Wind-Down Branches”)
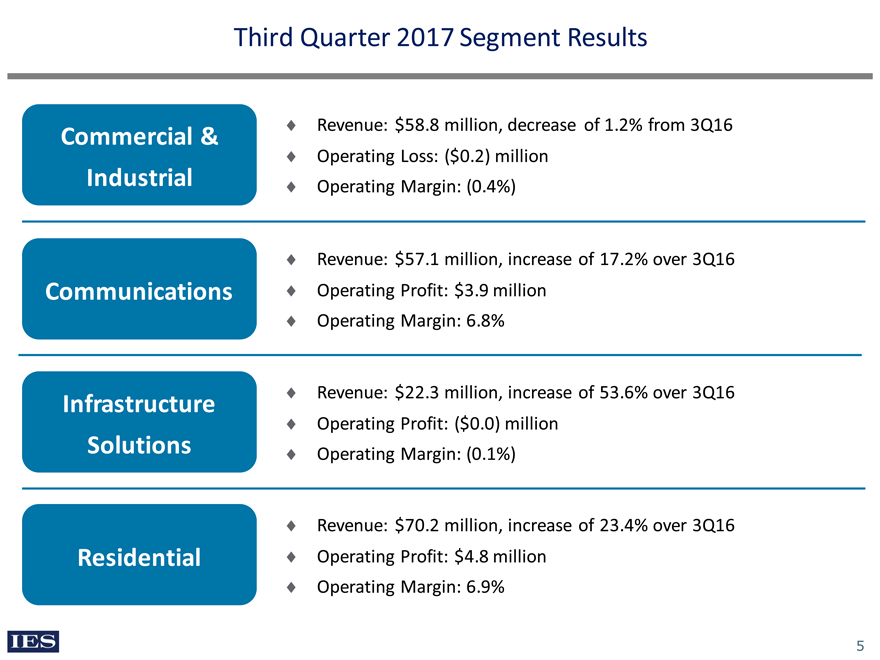
5 Third Quarter 2017 Segment Results Commercial & Industrial Communications Infrastructure Solutions Residential Revenue: $58.8 million, decrease of 1.2% from 3Q16 Operating Loss: ($0.2) million Operating Margin: (0.4%) Revenue: $57.1 million, increase of 17.2% over 3Q16 Operating Profit: $3.9 million Operating Margin: 6.8% Revenue: $22.3 million, increase of 53.6% over 3Q16 Operating Profit: ($0.0) million Operating Margin: (0.1%) Revenue: $70.2 million, increase of 23.4% over 3Q16 Operating Profit: $4.8 million Operating Margin: 6.9%
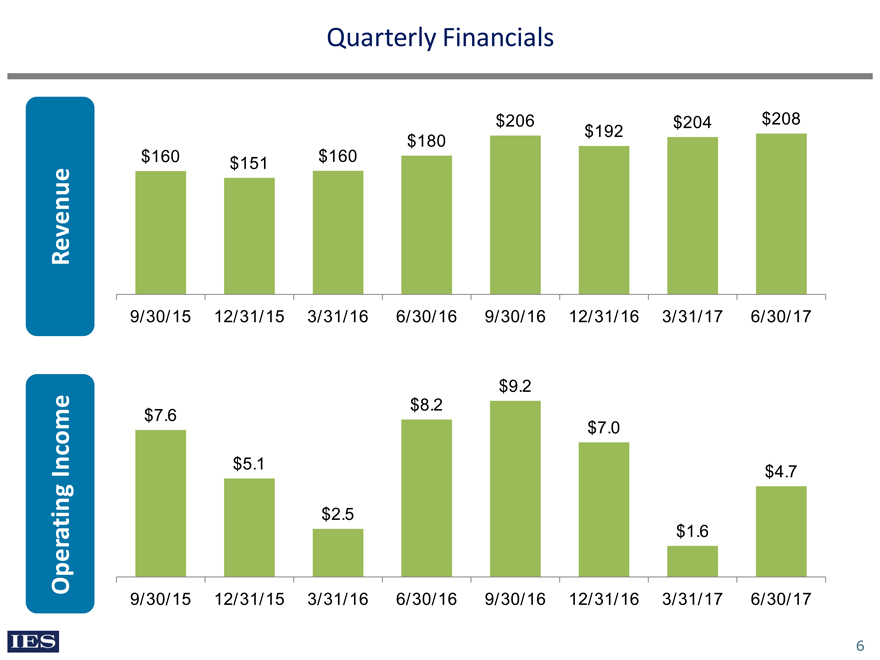
6 Quarterly Financials Revenue Operating Income $160 $151 $160 $180 $206 $192 $204 $208 9/30/15 12/31/15 3/31/16 6/30/16 9/30/16 12/31/16 3/31/17 6/30/17 $7.6 $5.1 $2.5 $8.2 $9.2 $7.0 $1.6 $4.7 9/30/15 12/31/15 3/31/16 6/30/16 9/30/16 12/31/16 3/31/17 6/30/17
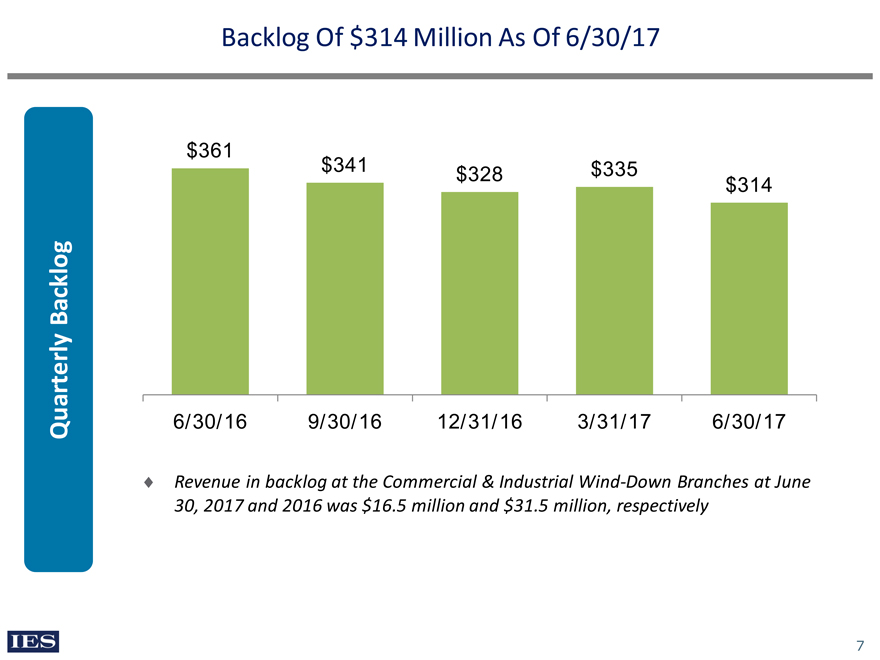
7 Backlog Of $314 Million As Of 6/30/17 Quarterly Backlog $361 $341 $328 $335 $314 6/30/16 9/30/16 12/31/16 3/31/17 6/30/17 Revenue in backlog at the Commercial & Industrial Wind-Down Branches at June 30, 2017 and 2016 was $16.5 million and $31.5 million, respectively
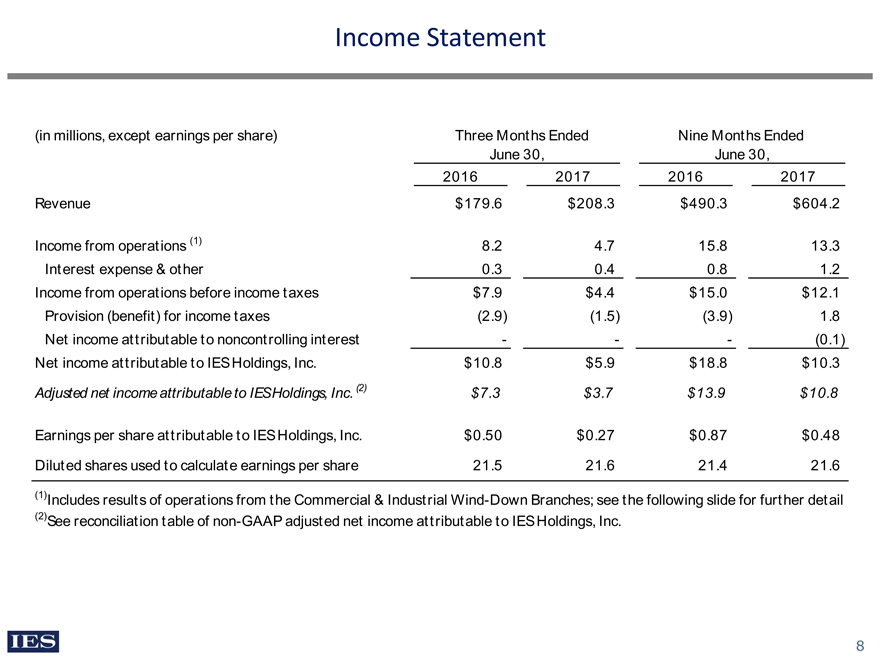
8 Income Statement (in millions, except earnings per share)Three Months Ended Nine Months Ended June 30,June 30,2016 2017 2016 2017 Revenue $179.6 $208.3 $490.3 $604.2 Income from operations (1)8.2 4.7 15.8 13.3 Interest expense & other0.30.40.81.2 Income from operations before income taxes$7.9$4.4$15.0$12.1Provision (benefit) for income taxes(2.9)(1.5)(3.9)1.8Net income attributable to noncontrolling interest---(0.1)Net income attributable to IES Holdings, Inc.$10.8$5.9$18.8$10.3Adjusted net income attributable to IES Holdings, Inc.(2)$7.3$3.7$13.9$10.8Earnings per share attributable to IES Holdings, Inc.$0.50$0.27$0.87$0.48Diluted shares used to calculate earnings per share21.521.621.421.6(1)Includes results of operations from the Commercial & Industrial Wind-Down Branches; see the following slide for further detail(2)See reconciliation table of non-GAAP adjusted net income attributable to IES Holdings, Inc.
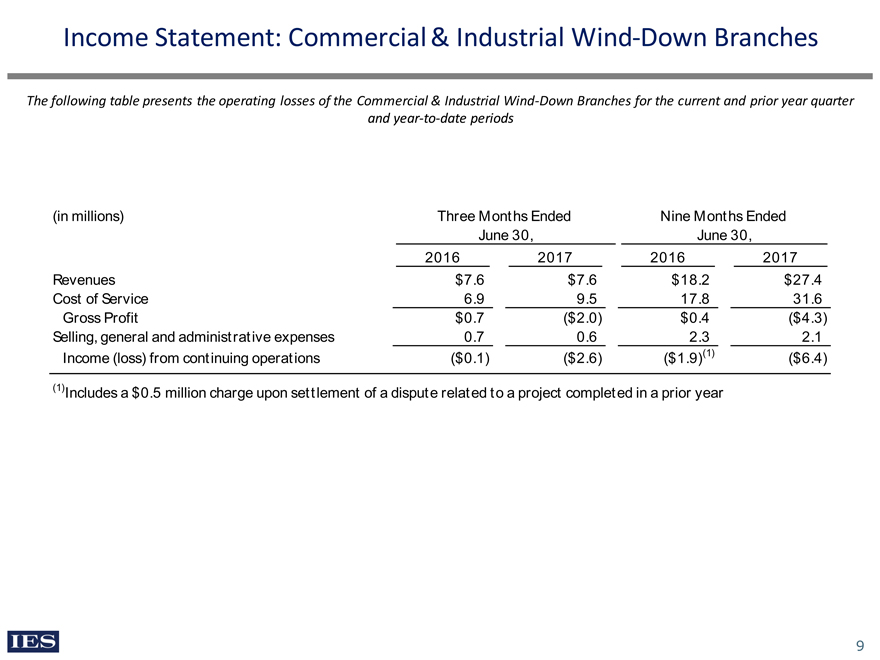
9 Income Statement: Commercial & Industrial Wind-Down Branches The following table presents the operating losses of the Commercial & Industrial Wind-Down Branches for the current and prior year quarter and year-to-date periods (in millions)Three Months Ended Nine Months Ended June 30,June 30,2016201720162017Revenues$7.6$7.6$18.2$27.4Cost of Service6.9 9.5 17.8 31.6 Gross Profit$0.7($2.0)$0.4($4.3)Selling, general and administrative expenses0.7 0.6 2.3 2.1 Income (loss) from continuing operations($0.1)($2.6)($1.9)(1)($6.4)(1)Includes a $0.5 million charge upon settlement of a dispute related to a project completed in a prior year
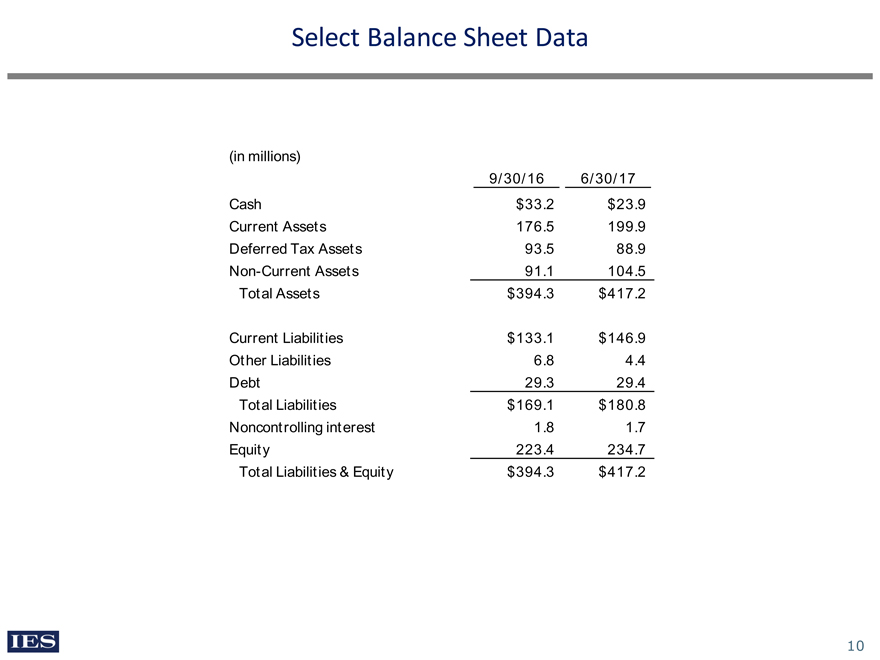
10 Select Balance Sheet Data (in millions) 9/30/166/30/17 Cash $33.2 $23.9 Current Assets 176.5 199.9 Deferred Tax Assets 93.5 88.9Non-Current Assets91.1104.5Total Assets $394.3$417.2 Current Liabilities$133.1$146.9Other Liabilities6.84.4Debt29.329.4Total Liabilities$169.1$180.8 Noncontrolling interest1.8 1.7Equity223.4234.7 Total Liabilities & Equity$394.3$417.2
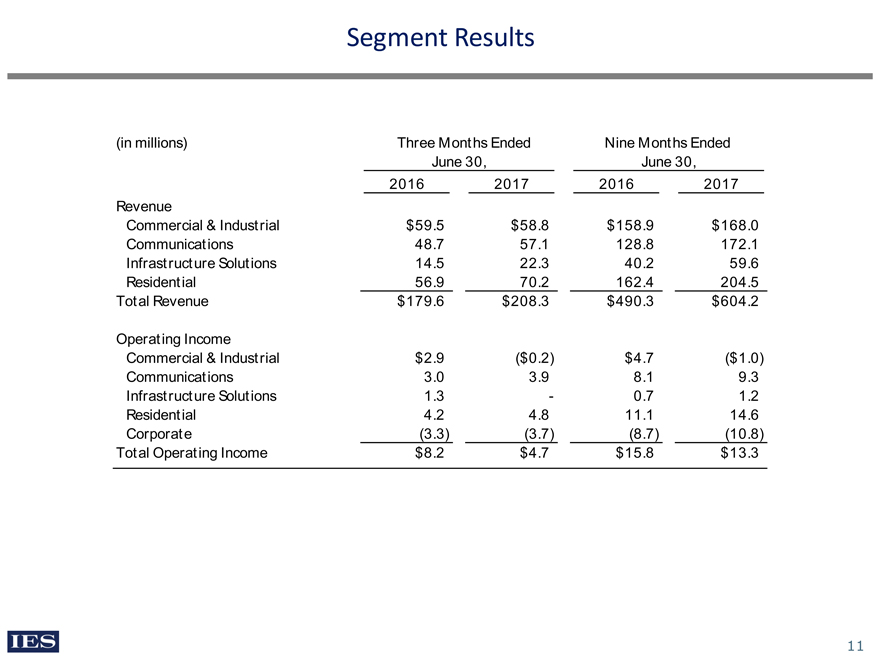
11 Segment Results (in millions)Three Months Ended Nine Months Ended June 30,June 30,2016201720162017RevenueCommercial & Industrial$59.5$58.8$158.9$168.0Communications48.7 57.1 128.8 172.1 Infrastructure Solutions14.5 22.3 40.2 59.6 Residential56.9 70.2 162.4 204.5 Total Revenue$179.6$208.3$490.3$604.2Operating Income Commercial & Industrial$2.9($0.2)$4.7($1.0)Communications3.0 3.9 8.1 9.3 Infrastructure Solutions1.3 -0.7 1.2 Residential4.2 4.8 11.1 14.6 Corporate(3.3) (3.7) (8.7) (10.8) Total Operating Income$8.2$4.7$15.8$13.3
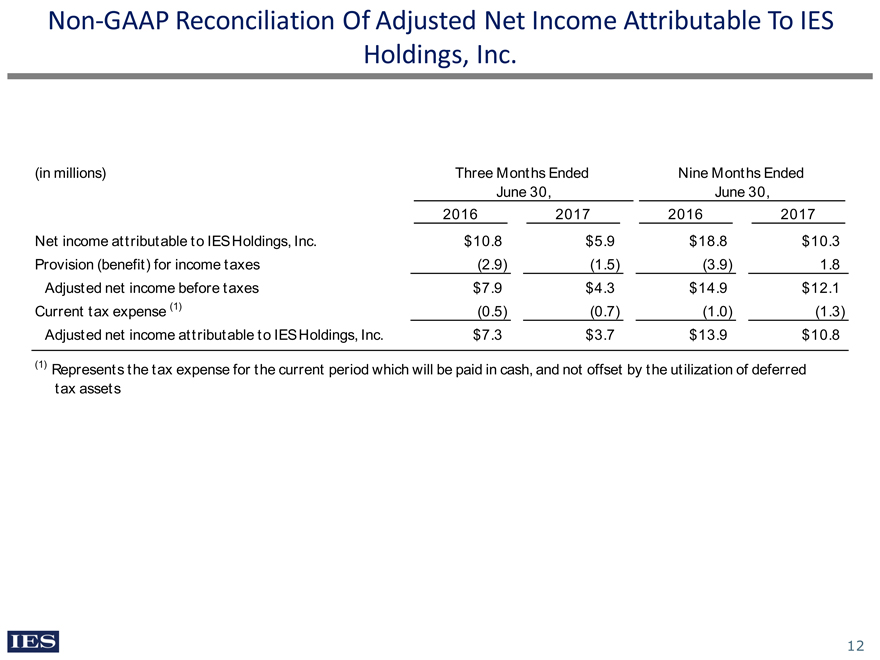
Non-GAAP Reconciliation Of Adjusted Net Income Attributable To IES Holdings, Inc. (in millions)Three Months Ended Nine Months Ended June 30,June 30,2016 2017 2016 2017 Net income attributable to IES Holdings, Inc. $10.8 $5.9$18.8 $10.3 Provision (benefit) for income taxes (2.9) (1.5) (3.9) 1.8 Adjusted net income before taxes $7.9 $4.3 $14.9 $12.1Current tax expense (1) (0.5) (0.7) (1.0) (1.3) Adjusted net income attributable to IES Holdings, Inc. $7.3 $3.7 $13.9 $10.8(1) Represents the tax expense for the current period which will be paid in cash, and not offset by the utilization of deferred tax assets
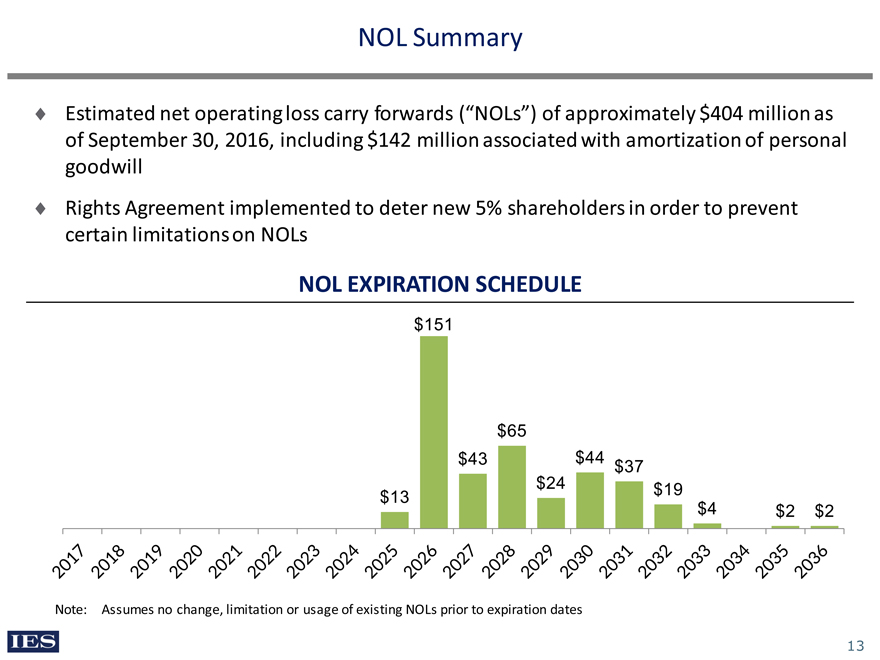
NOL Summary Estimated net operating loss carry forwards (“NOLs”) of approximately $404 million as of September 30, 2016, including $142 million associated with amortization of personal goodwill Rights Agreement implemented to deter new 5% shareholders in order to prevent certain limitations on NOLs NOL EXPIRATION SCHEDULE $151 $13 $43 $65 $24 $44 $37 $19 $4 $2 $2 2017 2018 2019 2020 2021 2022 2023 2024 2025 2026 2027 2028 2029 2030 2031 2032 2033 2034 2035 2036 Note: Assumes no change, limitation or usage of existing NOLs prior to expiration dates