Attached files
| file | filename |
|---|---|
| EX-99.1 - Q2 2017 EARNINGS RELEASE - CINCINNATI BELL INC | earningsreleaseq22017.htm |
| 8-K - CINCINNATI BELL INC. 8-K - CINCINNATI BELL INC | a8-kearningsreleaseshellq2.htm |

Cincinnati Bell
Second Quarter 2017 Results
August 4, 2017

Safe Harbor
This presentation may contain “forward-looking” statements, as defined in federal securities laws including the Private Securities Litigation Reform Act of 1995, which are based on our current
expectations, estimates, forecasts and projections. Statements that are not historical facts, including statements about the beliefs, expectations and future plans and strategies of the Company, are
forward-looking statements. Actual results may differ materially from those expressed in any forward-looking statements. The following important factors, among other things, could cause or
contribute to actual results being materially and adversely different from those described or implied by such forward-looking statements including, but not limited to: those discussed in this
presentation; we operate in highly competitive industries, and customers may not continue to purchase products or services, which would result in reduced revenue and loss of market share; we
may be unable to grow our revenues and cash flows despite the initiatives we have implemented; failure to anticipate the need for and introduce new products and services or to compete with new
technologies may compromise our success in the telecommunications industry; our access lines, which generate a significant portion of our cash flows and profits, are decreasing in number and if we
continue to experience access line losses similar to the past several years, our revenues, earnings and cash flows from operations may be adversely impacted; our failure to meet performance
standards under our agreements could result in customers terminating their relationships with us or customers being entitled to receive financial compensation, which would lead to reduced
revenues and/or increased costs; we generate a substantial portion of our revenue by serving a limited geographic area; a large customer accounts for a significant portion of our revenues and
accounts receivable and the loss or significant reduction in business from this customer would cause operating revenues to decline and could negatively impact profitability and cash flows;
maintaining our telecommunications networks requires significant capital expenditures, and our inability or failure to maintain our telecommunications networks could have a material impact on our
market share and ability to generate revenue; increases in broadband usage may cause network capacity limitations, resulting in service disruptions or reduced capacity for customers; we may be
liable for material that content providers distribute on our networks; cyber attacks or other breaches of network or other information technology security could have an adverse effect on our
business; natural disasters, terrorists acts or acts of war could cause damage to our infrastructure and result in significant disruptions to our operations; the regulation of our businesses by federal
and state authorities may, among other things, place us at a competitive disadvantage, restrict our ability to price our products and services and threaten our operating licenses; we depend on a
number of third party providers, and the loss of, or problems with, one or more of these providers may impede our growth or cause us to lose customers; a failure of back-office information
technology systems could adversely affect our results of operations and financial condition; if we fail to extend or renegotiate our collective bargaining agreements with our labor union when they
expire or if our unionized employees were to engage in a strike or other work stoppage, our business and operating results could be materially harmed; the loss of any of the senior management
team or attrition among key sales associates could adversely affect our business, financial condition, results of operations and cash flows; our debt could limit our ability to fund operations, raise
additional capital, and fulfill our obligations, which, in turn, would have a material adverse effect on our businesses and prospects generally; our indebtedness imposes significant restrictions on us;
we depend on our loans and credit facilities to provide for our short-term financing requirements in excess of amounts generated by operations, and the availability of those funds may be reduced or
limited; the servicing of our indebtedness is dependent on our ability to generate cash, which could be impacted by many factors beyond our control; we depend on the receipt of dividends or other
intercompany transfers from our subsidiaries and investments; the trading price of our common shares may be volatile, and the value of an investment in our common shares may decline; the
uncertain economic environment, including uncertainty in the U.S. and world securities markets, could impact our business and financial condition; our future cash flows could be adversely affected
if it is unable to fully realize our deferred tax assets; adverse changes in the value of assets or obligations associated with our employee benefit plans could negatively impact shareowners’ deficit and
liquidity; third parties may claim that we are infringing upon their intellectual property, and we could suffer significant litigation or licensing expenses or be prevented from selling products; third
parties may infringe upon our intellectual property, and we may expend significant resources enforcing our rights or suffer competitive injury; we could be subject to a significant amount of litigation,
which could require us to pay significant damages or settlements; we could incur significant costs resulting from complying with, or potential violations of, environmental, health and human safety
laws; the timing and likelihood of completion of our proposed mergers with Hawaiian Telcom and OnX, including the timing, receipt and terms and conditions of any required governmental and
regulatory approvals for the proposed transactions that could reduce anticipated benefits or cause the parties to abandon the transactions; the possibility that Hawaiian Telcom’s stockholders may
not approve the proposed merger; the possibility that competing offers or acquisition proposals for Hawaiian Telcom will be made; the occurrence of any event, change or other circumstance that
could give rise to the termination of the proposed transactions; the possibility that the expected synergies and value creation from the proposed transactions will not be realized or will not be
realized within the expected time period; the risk that the businesses of the Company and Hawaiian Telcom and OnX will not be integrated successfully; disruption from the proposed transactions
making it more difficult to maintain business and operational relationships; the risk that unexpected costs will be incurred; and the possibility that the proposed transactions do not close, including
due to the failure to satisfy the closing conditions and the other risks and uncertainties detailed in our filings, including our Form 10-K, with the SEC as well as Hawaiian Telcom’s filings, including its
Form 10-K, with the SEC.
These forward-looking statements are based on information, plans and estimates as of the date hereof and there may be other factors that may cause our actual results to differ materially from
these forward-looking statements. We assume no obligation to update the information contained in this presentation except as required by applicable law.
2

Non-GAAP Financial Measures
This presentation contains information about adjusted earnings before interest, taxes, depreciation and
amortization (Adjusted EBITDA), Adjusted EBITDA margin, net debt and free cash flow. These are non-GAAP
financial measures used by Cincinnati Bell management when evaluating results of operations and cash flow.
Management believes these measures also provide users of the financial statements with additional and useful
comparisons of current results of operations and cash flows with past and future periods. Non-GAAP financial
measures should not be construed as being more important than comparable GAAP measures. Detailed
reconciliations of Adjusted EBITDA, net debt and free cash flow (including the Company’s definition of these
terms) to comparable GAAP financial measures can be found in the earnings release on our website at
www.cincinnatibell.com within the Investor Relations section.
3

Call Participants
Page 4
Leigh Fox
President and CEO, Cincinnati Bell
Andy Kaiser
CFO, Cincinnati Bell
4

Page 5
Second Quarter 2017 Highlights
Strategic Revenue
with breakdown
for 2 segments
Adj EBITDA with
breakdown for 2
segments
5
Strategic Revenue
$171M
+9% y/y
Fioptics
Revenue of
$77M
+24% y/y
556,700
addresses
+16% y/y
Cloud Services
Revenue of
$12M
+7% y/y
Adjusted EBITDA
($ in millions)
$192 $201
$110 $96
-$3 -$3
2Q16 2Q17
Entertainment & Communications IT & Hardware Eliminations
Total Revenue
($ in millions)
$74 $72
$7 $10
-$4 -$6
Entertainment & Communications IT & Hardware Corporate
2Q17 2Q16
$76
$299 $294 $77
Key Financial Metrics

• 2016 Revenue: $2,193M(3)
• 2016 EBITDA: $471M(4)
• Margin: 21%
• Hawaii’s fiber-centric technology
leader providing voice, video,
broadband, data center and cloud
solutions
Source: Company Filings
6
Transaction
Size
Business
Description
Key
Financial
Statistics
• Provides technology services and
solutions to enterprise customers
in the U.S., Canada and the U.K.
“New Cincinnati Bell”
• Two distinct but complementary
$1B+ business: a fiber network
and cloud integrator, with clear
pathway for growth
• 2016 Revenue: $393M
• 2016 EBITDA: $116M(1)
• Margin: 30%
• FYE 4/30/17 Revenue: $614M
• FYE 4/30/17 EBITDA: $29M(2)
• Margin: 5%
1. CY2016 EBITDA of HCOM represents net income plus interest expense (net of interest income and other), income taxes, depreciation and amortization, gain on sale of property, non-cash stock and other performance-based
compensation, System Metrics earn-out, pension settlement loss, severance costs and is adjusted for certain non-recurring items.
2. FYE 4/30/2017 EBITDA of OnX represents as net income before income taxes plus share-based compensation, depreciation and amortization, finance costs,
foreign exchange loss, net restructuring and other charges and management fee.
3. Calculated as CY2016 revenue of CBB of $1,186M plus CY2016 revenue of HCOM plus FYE2017 revenue of OnX.
4. Calculated as CY2016 EBITDA of CBB of $305M plus CY2016 EBITDA of HCOM plus FYE2017 EBITDA of OnX plus run-rate synergies of $21M.
Expected Close
Expected
Cost Synergies*
~50% ~50% Network IT Services
(Pro Forma Revenue Mix)
• H2 2018 • Q4 2017
• Network: ~$11M annually • IT Services: ~$10M annually • Combined: ~$21M annually
Page 6
• $650M including existing net debt
• 60% cash and 40% stock
• $201M in cash
*To be realized within two years post-close, and excluding potential revenue synergies from cross-selling opportunities
Second Quarter 2017 Highlights
Combinations with Hawaiian Telcom and OnX
Page 7
Entertainment & Communications
7
Strategic Revenue
with breakdown
for 2 segments
Segment Revenue Elements
Segment Results
Strategic Revenue
Highlights
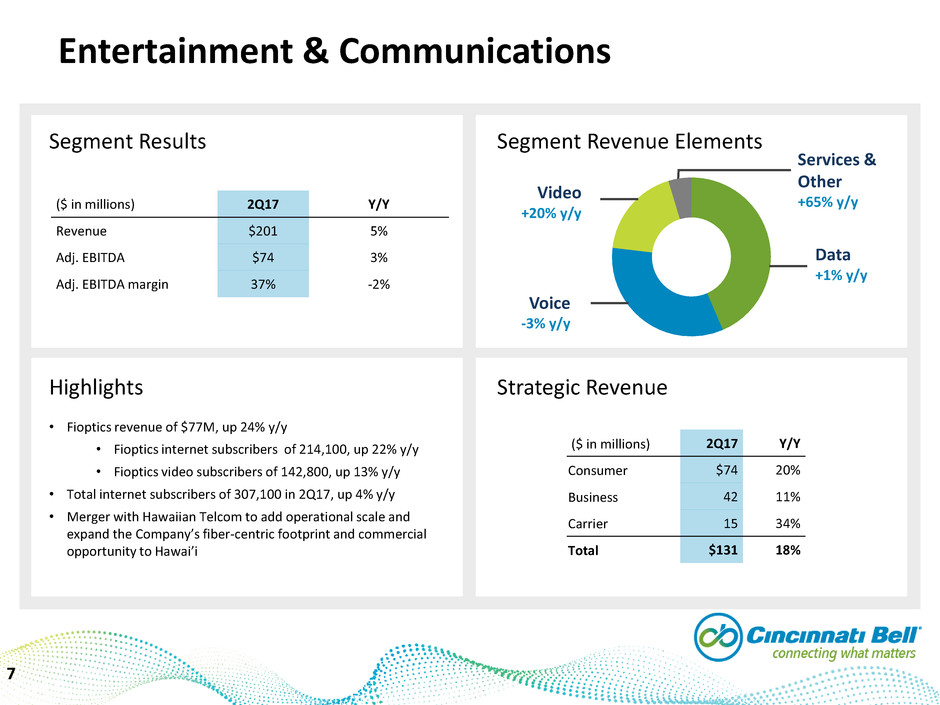
• Fioptics revenue of $77M, up 24% y/y
• Fioptics internet subscribers of 214,100, up 22% y/y
• Fioptics video subscribers of 142,800, up 13% y/y
• Total internet subscribers of 307,100 in 2Q17, up 4% y/y
• Merger with Hawaiian Telcom to add operational scale and
expand the Company’s fiber-centric footprint and commercial
opportunity to Hawai’i
($ in millions) 2Q17 Y/Y
Consumer $74 20%
Business 42 11%
Carrier 15 34%
Total $131 18%
($ in millions) 2Q17 Y/Y
Revenue $201 5%
Adj. EBITDA $74 3%
Adj. EBITDA margin 37% -2%
Data
+1% y/y
Voice
-3% y/y
Services &
Other
+65% y/y
Video
+20% y/y
Page 8
Fioptics Update
8
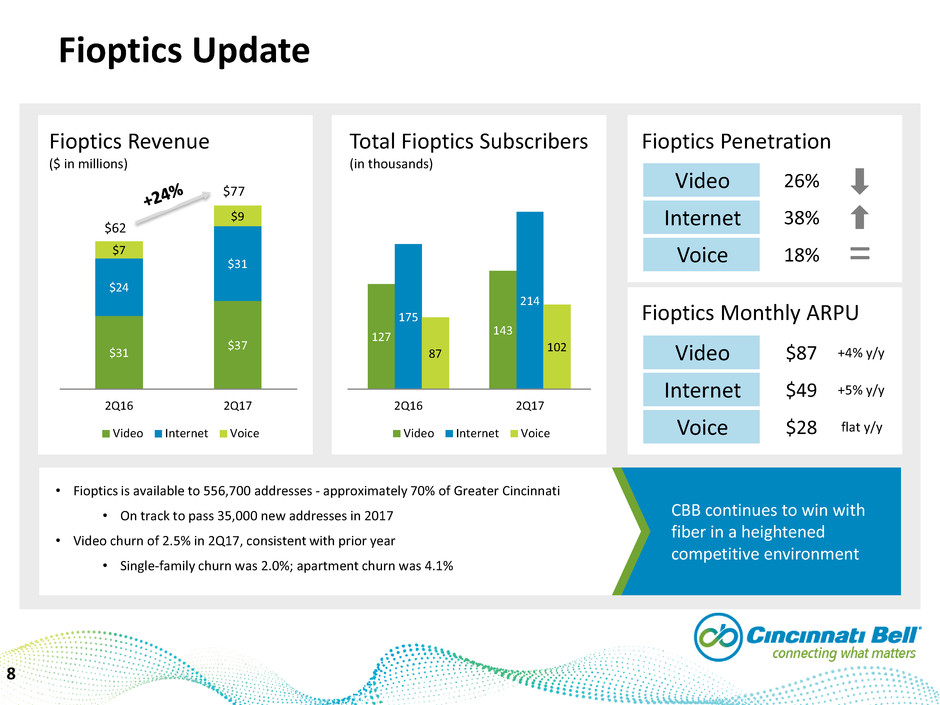
Fioptics Revenue
($ in millions)
Total Fioptics Subscribers
(in thousands)
Fioptics Penetration
Video
Internet
Voice
26%
38%
18%
Fioptics Monthly ARPU
Video
Internet
Voice
$87
$49
$28
+4% y/y
+5% y/y
flat y/y
$31
$37
$24
$31
$7
$9
2Q16 2Q17
Video Internet Voice
$62
$77
127
143
175
214
87 102
2Q16 2Q17
Video Internet Voice
CBB continues to win with
fiber in a heightened
competitive environment
• Fioptics is available to 556,700 addresses - approximately 70% of Greater Cincinnati
• On track to pass 35,000 new addresses in 2017
• Video churn of 2.5% in 2Q17, consistent with prior year
• Single-family churn was 2.0%; apartment churn was 4.1%
=

$32 $26
$61 $74
2Q16 2Q17
Legacy Strategic Integration
Page 9
Entertainment & Communications
9
Consumer Market
$14 $14
$12
$10
$5
2Q16 2Q17
Legacy Strategic One-time Fiber Build Project
Business Market
Carrier Market
$94
• Fioptics revenue growth
continues to more than offset
legacy declines
• Ongoing transition of customers
from copper network to strategic
fiber-based products continues
• Positive contribution from one-time
fiber build project completed in 2Q17
• On-going FCC switched access rate
reductions
• National carriers increased focus on
reducing costs
1. Entertainment & Communications Consumer Integration revenue totaled $1M 2Q16
2. Entertainment & Communications Business Integration revenue was less than $1M in 2Q16 and 2Q17
$34 $30
$38 $42
2Q16 2Q17
Legacy Strategic Integration
$72 $72
(1) (2)
($ in millions)
=
$29
$26
$100

Page 10
IT Services & Hardware
10
Strategic Revenue
with breakdown
for 2 segments
Adj EBITDA with
breakdown for 2
segments
Segment Results
Strategic Revenue
($ in millions) 2Q17 Y/Y
Professional Services $18 -20%
Management and Monitoring 5 -35%
Unified Communications 7 1%
Cloud Services 12 7%
Total $42 -13%
Highlights
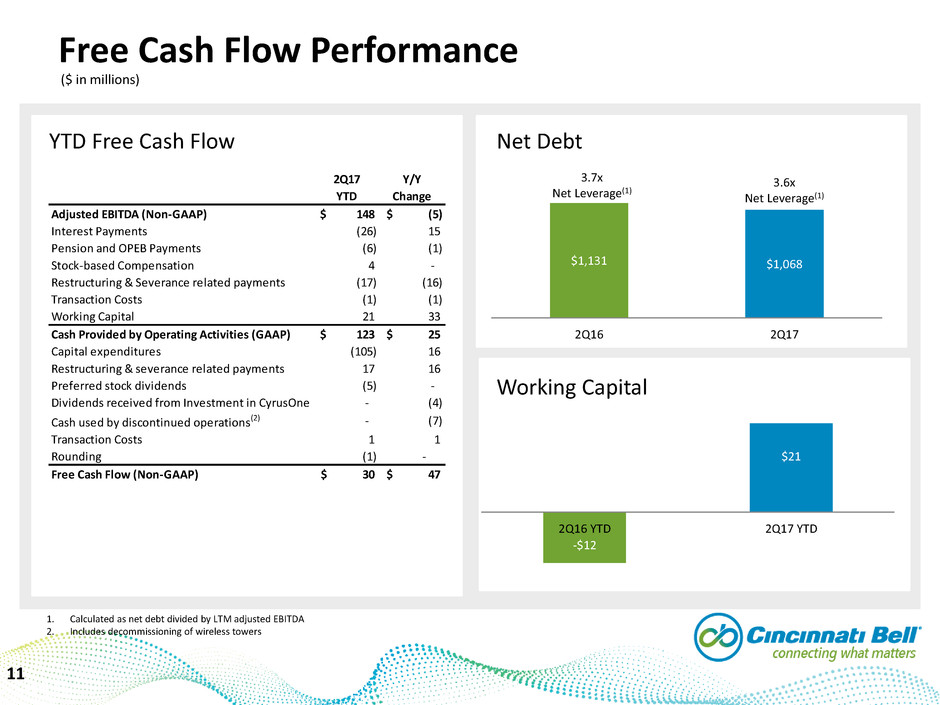
• Cloud Services revenue of $12 million, up 7% y/y
• Revenue decreased due to a decline in Telecom & IT hardware
sales and increased insourcing of IT services in the Company’s
market
• Positive contribution from the SunTel Services acquisition,
expanding CBTS' presence into the Michigan market
• Acquisition of OnX Enterprise Solutions to expand the Company’s
product offering, and provide greater geographic and customer
diversification
($ in millions) 2Q17 Y/Y
Revenue $96 -13%
Adj. EBITDA $7 -35%
Adj. EBITDA margin 7% -25%
Segment Revenue Elements
Professional Services
-14% y/y
Management &
Monitoring
-35% y/y
Unified Communications
+9% y/y
Cloud Services
+7% y/y
Telecom & IT
Hardware
-17% y/y
Page 11
Free Cash Flow Performance
11
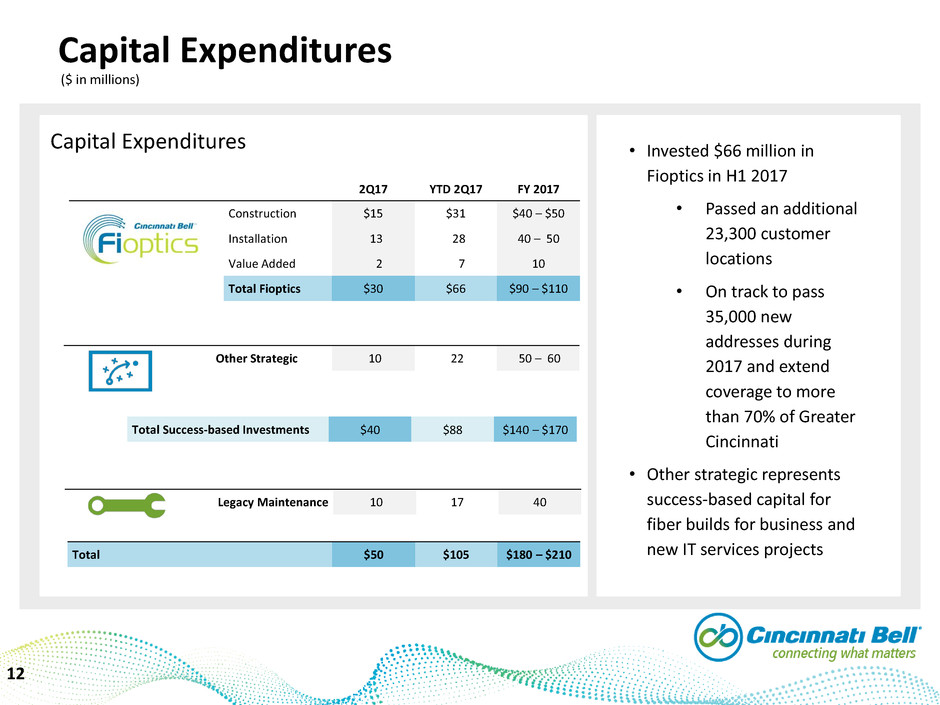
YTD Free Cash Flow
Net Debt
Working Capital
1. Calculated as net debt divided by LTM adjusted EBITDA
2. Includes decommissioning of wireless towers
$1,131 $1,068
2Q16 2Q17
($ in millions)
3.7x
Net Leverage(1)
3.6x
Net Leverage(1)
2Q17 Y/Y
YTD Change
Adjusted EBITDA (Non-GAAP) $ 148 $ (5)
Interest Payments (26) 15
Pension and OPEB Payments (6) (1)
Stock-based Compensation 4 -
Restructuring & Severance related payments (17) (16)
Transaction Costs (1) (1)
Working Capital 21 33
Cash Provided by Operating Activities (GAAP) $ 123 $ 25
Capital expenditures (105) 16
Restructuring & severance related payments 17 16
Preferred stock dividends (5) -
Dividends received from Investment in CyrusOne - (4)
Cash used by discontinued operations(2) - (7)
Transaction Costs 1 1
Rounding (1) -
Free Cash Flow (N n-GAAP) $ 30 $ 47
-$12
$21
2Q16 YTD 2Q17 YTD
Page 12
Capital Expenditures
12
Capital Expenditures
Total $50 $105 $180 – $210
• Invested $66 million in
Fioptics in H1 2017
• Passed an additional
23,300 customer
locations
• On track to pass
35,000 new
addresses during
2017 and extend
coverage to more
than 70% of Greater
Cincinnati
• Other strategic represents
success-based capital for
fiber builds for business and
new IT services projects
2Q17 YTD 2Q17 FY 2017
Construction $15 $31 $40 – $50
Installation 13 28 40 – 50
Value Added 2 7 10
Total Fioptics $30 $66 $90 – $110
Other Strategic 10 22 50 – 60
Total Success-based Investments $40 $88 $140 – $170
Legacy Maintenance 10 17 40
($ in millions)

Page 13
2017 Outlook
13
Reaffirms 2017 Guidance
Revenue $1.2B
Adjusted EBITDA $295M*
• Reaffirms 2017 financial guidance, provided on
February 15, 2017
• This guidance does not include any contribution
from pending mergers
* Plus or minus 2 percent
Selected 2017 Free Cash Flow Items
Capital Expenditures $180 - $210M
Interest payments ~$70M
Pension and OPEB payments ~ $14M

10%
20%
30%
40%
50%
60%
Year 1 Year 2 Year 3 Year 4
Fiber to the Home
Penetration
FHSI Penetration Rates
Video Penetration
Page 14
Summary
Refining Cincinnati Bell’s strategy
Entertainment &
Communications
IT Services & Hardware
1
Focus on investing
where we are
winning
• Fioptics revenue
growth of 24% y/y in
2Q17
• Cloud Services revenue
growth of 7% y/y in 2Q17
3 How we win • Continued investment in fiber
• Additional IT services
customers provides cloud
growth potential through
scale and distribution
4
Significant market
opportunity
• Growth driven by IoT
and 5G infrastructure
spend
• 89% of organizations are
willing to pay a premium for
cloud implementation and
management services
14
2 Why we win
• The more fiber, the
greater the market
penetration
• IT services business,
combined with our network
provides a platform for
cloud migration services

Page 15
Q&A

Page 16
Appendix

Page 17
17
Consolidated Results
($ in millions, except per share amounts)
2017 2016
Revenue 294.0$ 299.2$
Costs and expenses
Cost of services and products 165.4 170.8
Selling, general and administrative 55.4 56.2
Depreciation and amortization 47.0 44.8
Restructuring and severance related charges 3.6 —
Other 1.7 —
Operating income 20.9 27.4
Interest expense 18.1 19.9
Loss on extinguishment of debt, net — 5.2
Gain on sale of Investment in CyrusOne — (118.6)
Other income, net (0.6) (1.1)
Income before income taxes 3.4 122.0
Income tax expense 1.3 44.4
Net income 2.1 77.6
Preferred stock dividends 2.6 2.6
Net (loss) income applicable to common shareowners (0.5)$ 75.0$
Basic net (loss) earnings per common share (0.01)$ 1.79$
Dilu ed net (loss) earnings per common share (0.01)$ 1.78$
Weighted average common shares outstanding (in millions)
– Basic 42.2 42.0
– Diluted 42.2 42.1
June 30,
Three Months Ended

Page 18
18
Consolidated Results
($ in millions, except per share amounts)
2017 2016
Revenue 572.2$ 588.1$
Costs and expenses
Cost of services and products 320.2 333.5
Selling, general and administrative 112.1 109.4
Depreciation and amortization 92.8 88.2
Restructuring and severance related charges 29.2 —
Other 2.3 —
Operating income 15.6 57.0
Interest expense 36.1 40.2
Loss on extinguishment of debt, net — 2.8
Gain on sale of Investment in CyrusOne (117.7) (118.6)
Other income, net (1.0) (1.1)
Income before income taxes 98.2 133.7
Income tax expense 35.7 49.1
Net income 62.5 84.6
Preferred stock dividends 5.2 5.2
Net income applicable to common shareowners 57.3$ 79.4$
Basic net earnings per common share 1.36$ 1.89$
Diluted net earnings per common share 1.35$ 1.89$
Weighted average common shares outstanding (in millions)
– Basic 42.1 42.0
– Diluted 42.3 42.1
Six Months Ended
June 30,

Page 19
19
Strategic Legacy Integration
Data
Fioptics Internet
DSL (1) (> 10 meg)
Ethernet
Private Line
MPLS (2)
SONET (3)
Dedicated Internet Access
Wavelength
Audio Conferencing
DSL (< 10 meg)
DS0 (5), DS1, DS3
TDM (6)
Voice Fioptics Voice
VoIP (4)
Traditional Voice
Long Distance
Switched Access
Digital Trunking
Video Fioptics Video
Services and Other Wiring Projects Advertising Directory
Assistance
Maintenance
Information Services
Wireless Handsets and
Accessories
(1) Digital Subscriber Line
(2) Multi-Protocol Label Switching
(3) Synchronous Optical Network
(4) Voice of Internet Protocol
(5) Digital Signal
(6) Time Division Multiplexing
Revenue Classifications – Entertainment and Communications

Page 20
20
Strategic Integration
Professional Services
Consulting
Staff Augmentation
Installation
Unified Communications Voice Monitoring
Managed IP Telephony Solutions
Maintenance
Cloud Services Virtual Data Centers
Storage
Backup
Monitoring and Management Network Monitoring/Management
Security
Telecom & IT Hardware Hardware
Software Licenses
Revenue Classifications – IT Services and Hardware

Page 21
21
Revenue – Strategic, Legacy and Integration
($ in millions)
Entertainment and
Communications
IT Services and
Hardware Total Eliminations Total
Strategic
Data 66.2$ $ —
Voice 21.5 —
Video 37.2 —
Services and other 6.4 —
Professional services — 18.4
Management and monitoring — 5.1
Unified communications — 7.4
Cloud services — 11.6
Total Strategic 131.3 42.5 173.8 (2.3) 171.5
Legacy
Data 21.5$ $ —
Voice 45.6 —
Services and other 2.6 —
Total Legacy 69.7 - 69.7 (0.3) 69.4
Integration
Services and other 0.4$ $ —
Professional services — 5.1
Unified communications — 3.6
Telecom and IT hardware — 44.8
Total Integration 0.4 53.5 53.9 (0.8) 53.1
201.4$ 96.0$ 297.4$ (3.4)$ 294.0$
Eliminations (0.5) (2.9) (3.4)
Total Revenue 200.9$ 93.1$ 294.0$
2Q17
Page 22
22
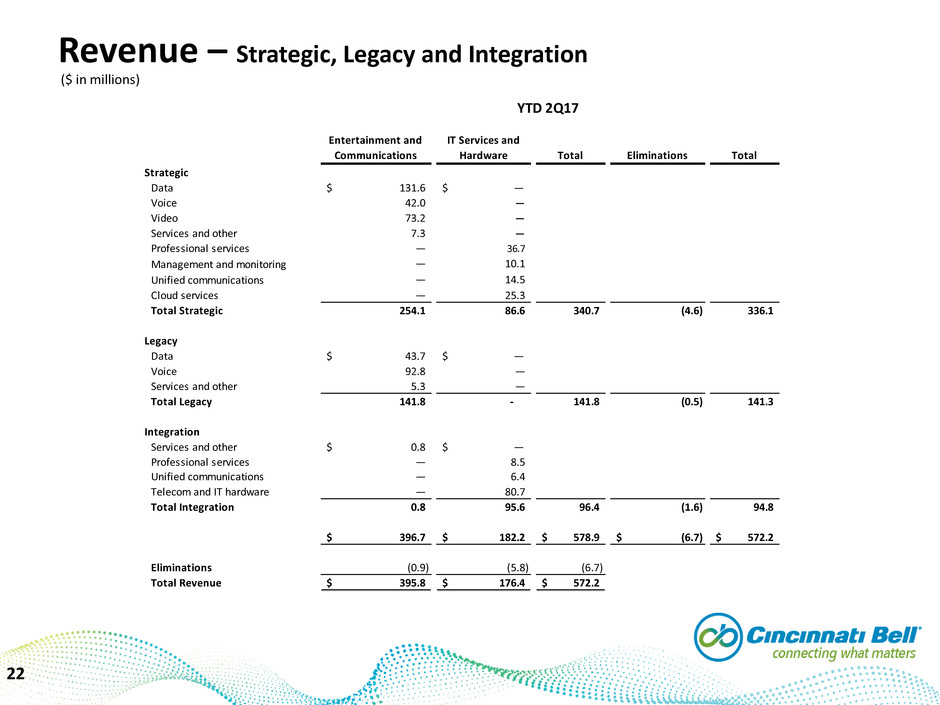
Revenue – Strategic, Legacy and Integration
($ in millions)
Entertainment and
Communications
IT Services and
Hardware Total Eliminations Total
Strategic
Data 131.6$ $ —
Voice 42.0 —
Video 73.2 —
Services and other 7.3 —
Professional services — 36.7
Management and monitoring — 10.1
Unified communications — 14.5
Cloud services — 25.3
Total Strategic 254.1 86.6 340.7 (4.6) 336.1
Legacy
Data 43.7$ $ —
Voice 92.8 —
Services and other 5.3 —
Total Legacy 141.8 - 141.8 (0.5) 141.3
Integration
Services and other 0.8$ $ —
Professional services — 8.5
Unified communications — 6.4
Telecom and IT hardware — 80.7
Total Integration 0.8 95.6 96.4 (1.6) 94.8
396.7$ 182.2$ 578.9$ (6.7)$ 572.2$
Eliminations (0.9) (5.8) (6.7)
Total Revenue 395.8$ 176.4$ 572.2$
YTD 2Q17
Page 23
23
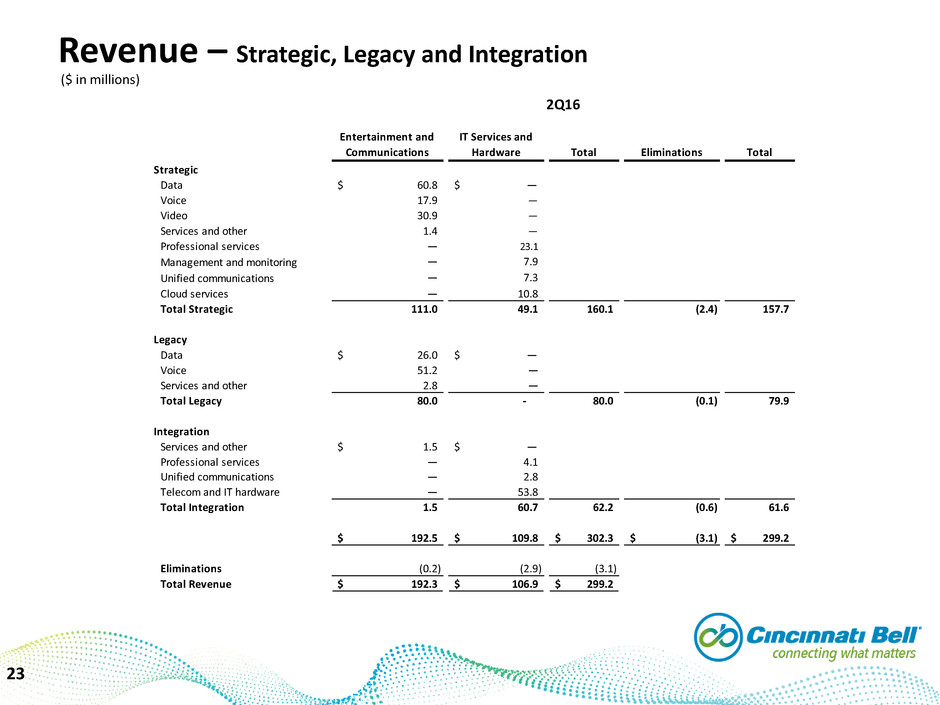
Revenue – Strategic, Legacy and Integration
($ in millions)
Entertainment and
Communications
IT Services and
Hardware Total Eliminations Total
Strategic
Data 60.8$ $ —
Voice 17.9 —
Video 30.9 —
Services and other 1.4 —
Professional services — 23.1
Management and monitoring — 7.9
Unified communications — 7.3
Cloud services — 10.8
Total Strategic 111.0 49.1 160.1 (2.4) 157.7
Legacy
Data 26.0$ $ —
Voice 51.2 —
Services and other 2.8 —
Total Legacy 80.0 - 80.0 (0.1) 79.9
Integration
Services and other 1.5$ $ —
Professional services — 4.1
Unified communications — 2.8
Telecom and IT hardware — 53.8
Total Integration 1.5 60.7 62.2 (0.6) 61.6
192.5$ 109.8$ 302.3$ (3.1)$ 299.2$
Eliminations (0.2) (2.9) (3.1)
Total Revenue 192.3$ 106.9$ 299.2$
2Q16
Page 24
24
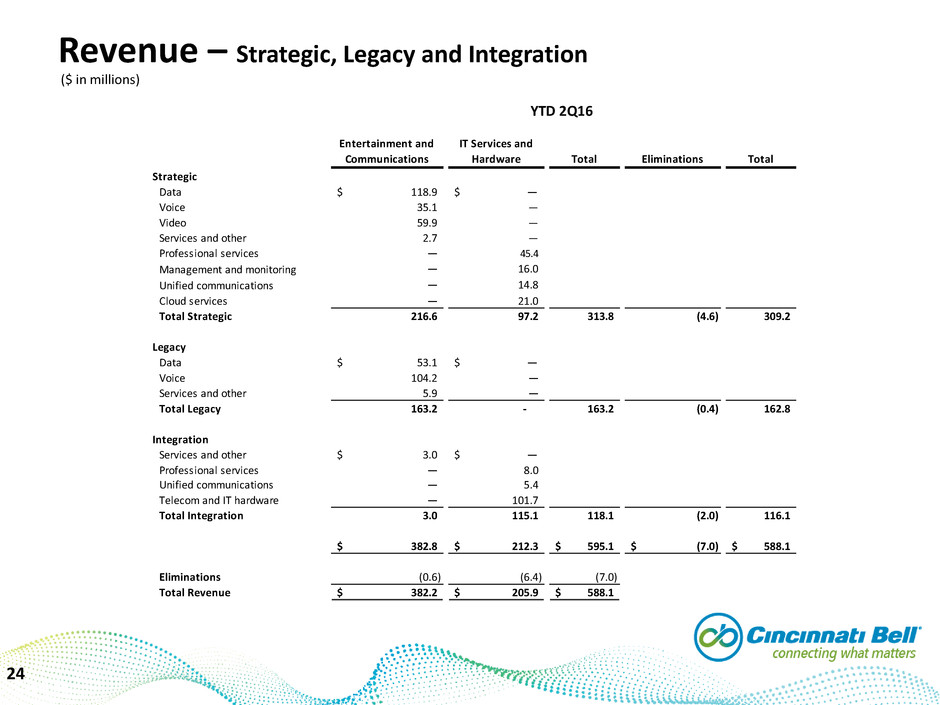
Revenue – Strategic, Legacy and Integration
($ in millions)
Entertainment and
Communications
IT Services and
Hardware Total Eliminations Total
Strategic
Data 118.9$ $ —
Voice 35.1 —
Video 59.9 —
Services and other 2.7 —
Professional services — 45.4
Management and monitoring — 16.0
Unified communications — 14.8
Cloud services — 21.0
Total Strategic 216.6 97.2 313.8 (4.6) 309.2
Legacy
Data 53.1$ $ —
Voice 104.2 —
Services and other 5.9 —
Total Legacy 163.2 - 163.2 (0.4) 162.8
Integration
Services and other 3.0$ $ —
Professional services — 8.0
Unified communications — 5.4
Telecom and IT hardware — 101.7
Total Integration 3.0 115.1 118.1 (2.0) 116.1
382.8$ 212.3$ 595.1$ (7.0)$ 588.1$
Eliminations (0.6) (6.4) (7.0)
Total Revenue 382.2$ 205.9$ 588.1$
YTD 2Q16
