Attached files
| file | filename |
|---|---|
| EX-99.1 - EX-99.1 - Ready Capital Corp | ex-99d1.htm |
| 8-K - 8-K - Ready Capital Corp | f8-k.htm |
Exhibit 99.2
|
|
Supplemental Financial Data Second Quarter 2017 |
|
|
Disclaimer This presentation contains statements that constitute "forward-looking statements," as such term is defined in Section 27A of the Securities Act of 1933, as amended, and Section 21E of the Securities Exchange Act of 1934, as amended, and such statements are intended to be covered by the safe harbor provided by the same. These statements are based on management's current expectations and beliefs and are subject to a number of trends and uncertainties that could cause actual results to differ materially from those described in the forward-looking statements; Sutherland Asset Management Corporation (the "Company") can give no assurance that its expectations will be attained. Factors that could cause actual results to differ materially from the Company's expectations include those set forth in the Risk Factors section of the most recent Annual Report on Form 10-K filed with the SEC and other reports filed by the Company with the SEC, copies of which are available on the SEC's website, www.sec.gov. The Company undertakes no obligation to update these statements for revisions or changes after the date of this release, except as required by law. This presentation includes certain non-GAAP financial measures, including Core Earnings. These non-GAAP financial measures should be considered only as supplemental to, and not as superior to, financial measures in accordance with GAAP. Please refer to Appendix A for the most recent GAAP information. This presentation also contains market statistics and industry data which are subject to uncertainty and are not necessarily reflective of market conditions. These have been derived from third party sources and have not been independently verified by the Company or its affiliates. All material presented is compiled from sources believed to be reliable and current, but accuracy cannot be guaranteed. All data is as of June 30, 2017, unless otherwise noted. 1 |
|
|
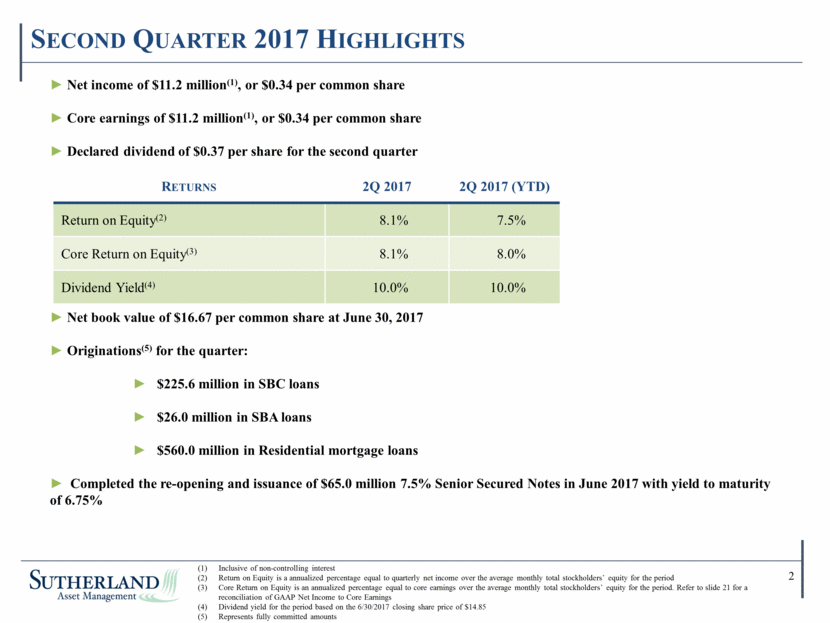
Second Quarter 2017 Highlights ► Net income of $11.2 million(1), or $0.34 per common share ► Core earnings of $11.2 million(1), or $0.34 per common share ► Declared dividend of $0.37 per share for the second quarter ► Net book value of $16.67 per common share at June 30, 2017 ► Originations(5) for the quarter: ► $225.6 million in SBC loans ► $26.0 million in SBA loans ► $560.0 million in Residential mortgage loans ► Completed the re-opening and issuance of $65.0 million 7.5% Senior Secured Notes in June 2017 with yield to maturity of 6.75% Returns 2Q 2017 2Q 2017 (YTD) Return on Equity(2) 8.1% 7.5% Core Return on Equity(3) 8.1% 8.0% Dividend Yield(4) 10.0% 10.0% Inclusive of non-controlling interest Return on Equity is a annualized percentage equal to quarterly net income over the average monthly total stockholders’ equity for the period Core Return on Equity is an annualized percentage equal to core earnings over the average monthly total stockholders’ equity for the period. Refer to slide 21 for a reconciliation of GAAP Net Income to Core Earnings Dividend yield for the period based on the 6/30/2017 closing share price of $14.85 Represents fully committed amounts 2 |
|
|
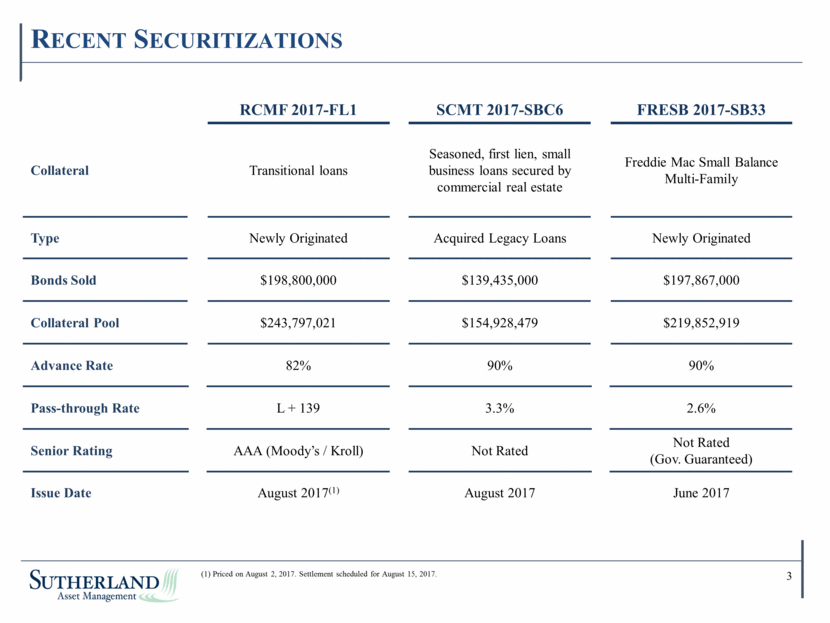
Recent Securitizations 3 RCMF 2017-FL1 SCMT 2017-SBC6 FRESB 2017-SB33 Collateral Transitional loans Seasoned, first lien, small business loans secured by commercial real estate Freddie Mac Small Balance Multi-Family Type Newly Originated Acquired Legacy Loans Newly Originated Bonds Sold $198,800,000 $139,435,000 $197,867,000 Collateral Pool $243,797,021 $154,928,479 $219,852,919 Advance Rate 82% 90% 90% Pass-through Rate L + 139 3.3% 2.6% Senior Rating AAA (Moody’s / Kroll) Not Rated Not Rated (Gov. Guaranteed) Issue Date August 2017(1) August 2017 June 2017 (1) Priced on August 2, 2017. Settlement scheduled for August 15, 2017. |
|
|
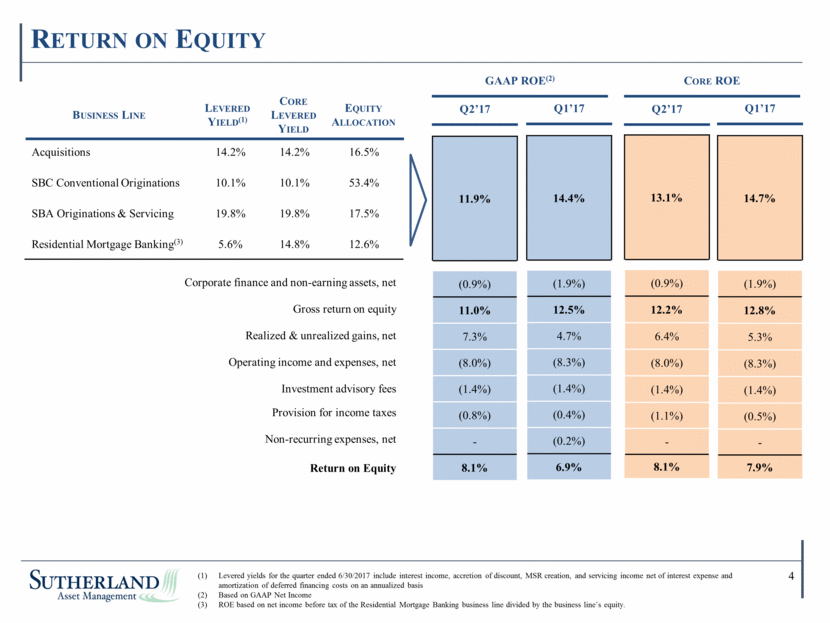
Return on Equity Acquisitions 14.2% 14.2% 16.5% SBC Conventional Originations 10.1% 10.1% 53.4% SBA Originations & Servicing 19.8% 19.8% 17.5% Residential Mortgage Banking(3) 5.6% 14.8% 12.6% Corporate finance and non-earning assets, net Gross return on equity Realized & unrealized gains, net Operating income and expenses, net Investment advisory fees Provision for income taxes Non-recurring expenses, net Return on Equity 11.9% (0.9%) 11.0% 7.3% (8.0%) (1.4%) (0.8%) - 8.1% 4 Levered yields for the quarter ended 6/30/2017 include interest income, accretion of discount, MSR creation, and servicing income net of interest expense and amortization of deferred financing costs on an annualized basis Based on GAAP Net Income ROE based on net income before tax of the Residential Mortgage Banking business line divided by the business line’s equity. Business Line Levered Yield(1) Core Levered Yield Equity Allocation 13.1% (0.9%) 12.2% 6.4% (8.0%) (1.4%) (1.1%) - 8.1% Q2’17 14.4% (1.9%) 12.5% 4.7% (8.3%) (1.4%) (0.4%) (0.2%) 6.9% Q1’17 GAAP ROE(2) Q2’17 Q1’17 14.7% (1.9%) 12.8% 5.3% (8.3%) (1.4%) (0.5%) - 7.9% Core ROE |
|
|
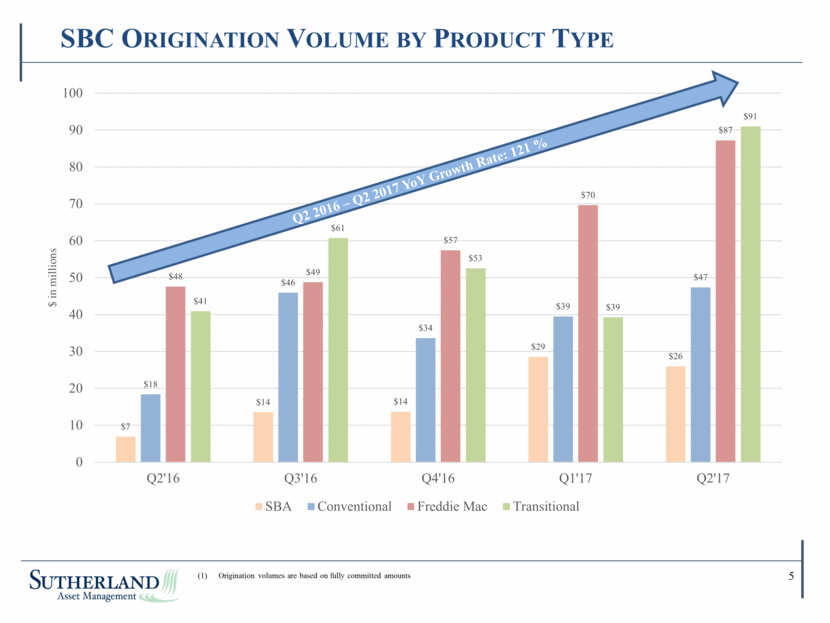
L SBC Origination Volume by Product Type 5 Q2 2016 – Q2 2017 YoY Growth Rate: 121 % Origination volumes are based on fully committed amounts |
|
|
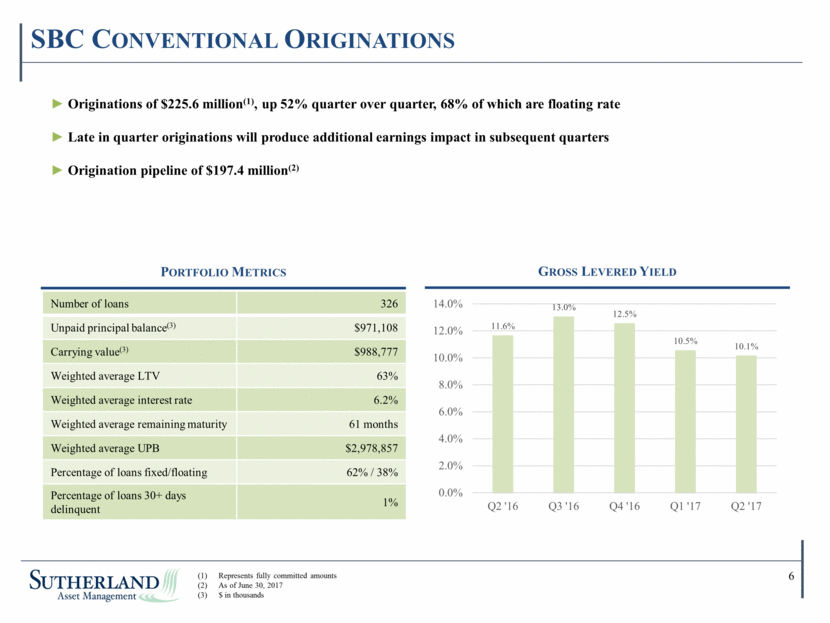
SBC Conventional Originations ► Originations of $225.6 million(1), up 52% quarter over quarter, 68% of which are floating rate ► Late in quarter originations will produce additional earnings impact in subsequent quarters ► Origination pipeline of $197.4 million(2) Number of loans 326 Unpaid principal balance(3) $971,108 Carrying value(3) $988,777 Weighted average LTV 63% Weighted average interest rate 6.2% Weighted average remaining maturity 61 months Weighted average UPB $2,978,857 Percentage of loans fixed/floating 62% / 38% Percentage of loans 30+ days delinquent 1% Portfolio Metrics Gross Levered Yield 6 Represents fully committed amounts As of June 30, 2017 $ in thousands 11.6% 13.0% 12.5% 10.5% 10.1% 0.0% 2.0% 4.0% 6.0% 8.0% 10.0% 12.0% 14.0% Q2 '16 Q3 '16 Q4 '16 Q1 '17 Q2 '17 |
|
|
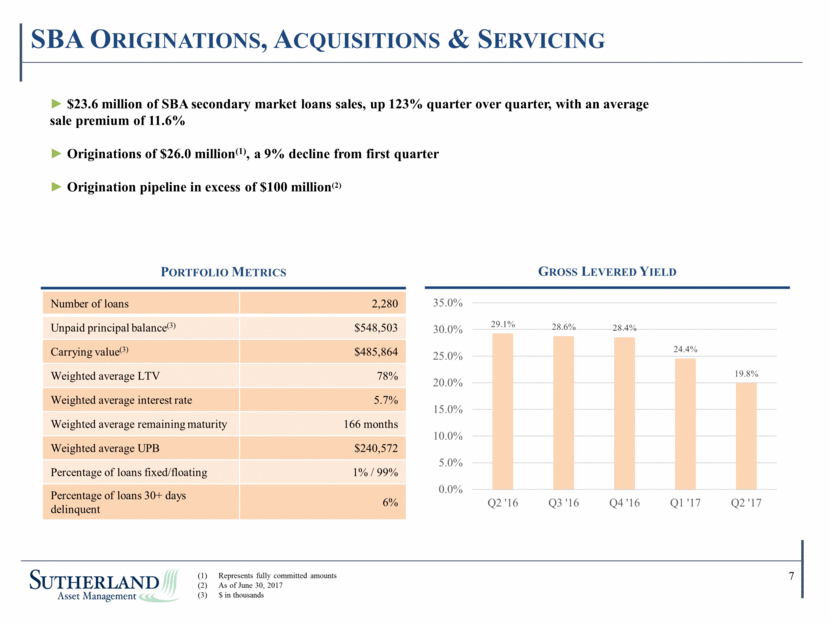
SBA Originations, Acquisitions & Servicing Number of loans 2,280 Unpaid principal balance(3) $548,503 Carrying value(3) $485,864 Weighted average LTV 78% Weighted average interest rate 5.7% Weighted average remaining maturity 166 months Weighted average UPB $240,572 Percentage of loans fixed/floating 1% / 99% Percentage of loans 30+ days delinquent 6% Gross Levered Yield Portfolio Metrics ► $23.6 million of SBA secondary market loans sales, up 123% quarter over quarter, with an average sale premium of 11.6% ► Originations of $26.0 million(1), a 9% decline from first quarter ► Origination pipeline in excess of $100 million(2) 7 Represents fully committed amounts As of June 30, 2017 $ in thousands 29.1% 28.6% 28.4% 24.4% 19.8% 0.0% 5.0% 10.0% 15.0% 20.0% 25.0% 30.0% 35.0% Q2 '16 Q3 '16 Q4 '16 Q1 '17 Q2 '17 |
|
|
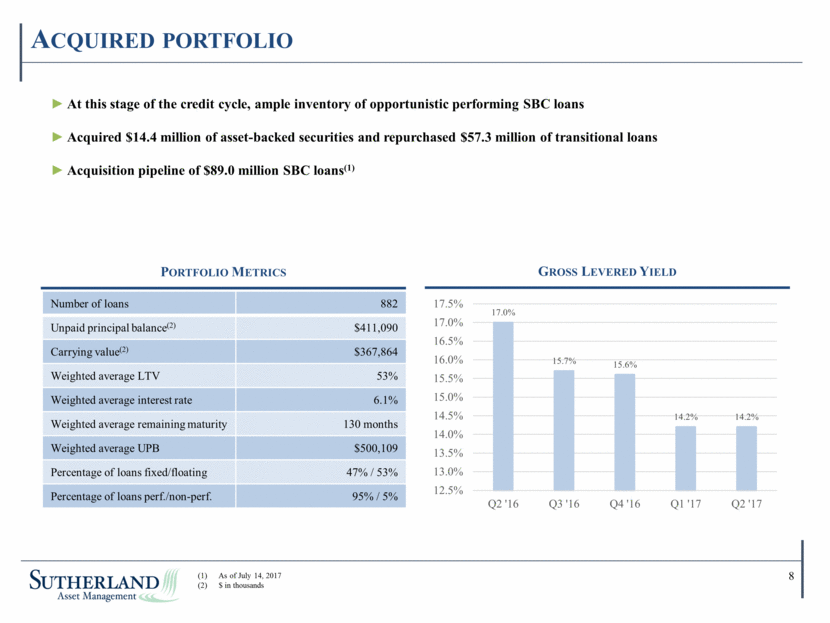
Acquired portfolio ► At this stage of the credit cycle, ample inventory of opportunistic performing SBC loans ► Acquired $14.4 million of asset-backed securities and repurchased $57.3 million of transitional loans ► Acquisition pipeline of $89.0 million SBC loans(1) Number of loans 882 Unpaid principal balance(2) $411,090 Carrying value(2) $367,864 Weighted average LTV 53% Weighted average interest rate 6.1% Weighted average remaining maturity 130 months Weighted average UPB $500,109 Percentage of loans fixed/floating 47% / 53% Percentage of loans perf./non-perf. 95% / 5% Portfolio Metrics Gross Levered Yield 8 As of July 14, 2017 $ in thousands 17.0% 15.7% 15.6% 14.2% 14.2% 12.5% 13.0% 13.5% 14.0% 14.5% 15.0% 15.5% 16.0% 16.5% 17.0% 17.5% Q2 '16 Q3 '16 Q4 '16 Q1 '17 Q2 '17 |
|
|
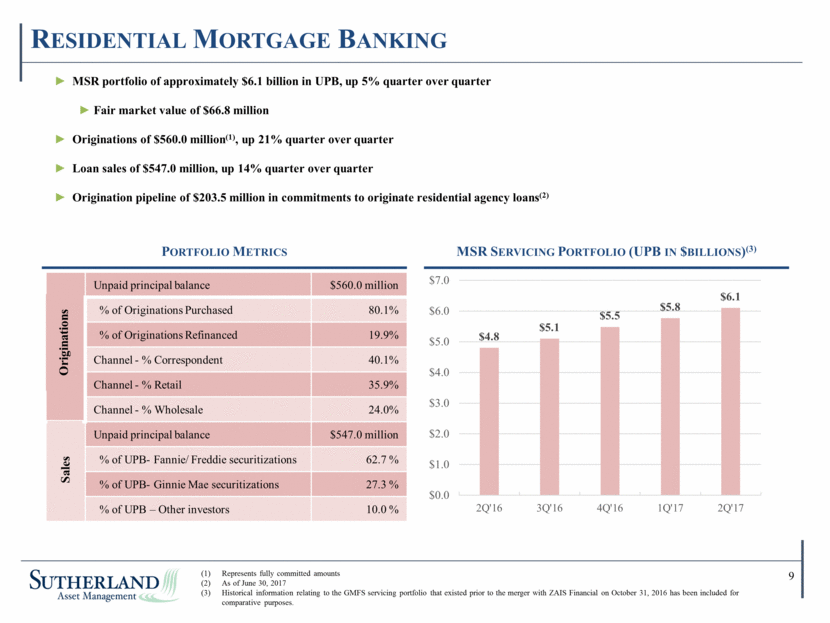
Residential Mortgage Banking Unpaid principal balance $560.0 million % of Originations Purchased 80.1% % of Originations Refinanced 19.9% Channel - % Correspondent 40.1% Channel - % Retail 35.9% Channel - % Wholesale 24.0% Unpaid principal balance $547.0 million % of UPB- Fannie/ Freddie securitizations 62.7 % % of UPB- Ginnie Mae securitizations 27.3 % % of UPB – Other investors 10.0 % MSR Servicing Portfolio (UPB in $billions)(3) Portfolio Metrics ► MSR portfolio of approximately $6.1 billion in UPB, up 5% quarter over quarter ► Fair market value of $66.8 million ► Originations of $560.0 million(1), up 21% quarter over quarter ► Loan sales of $547.0 million, up 14% quarter over quarter ► Origination pipeline of $203.5 million in commitments to originate residential agency loans(2) 9 Represents fully committed amounts As of June 30, 2017 Historical information relating to the GMFS servicing portfolio that existed prior to the merger with ZAIS Financial on October 31, 2016 has been included for comparative purposes. Originations Sales $4.8 $5.1 $5.5 $5.8 $6.1 $0.0 $1.0 $2.0 $3.0 $4.0 $5.0 $6.0 $7.0 2Q'16 3Q'16 4Q'16 1Q'17 2Q'17 |
|
|
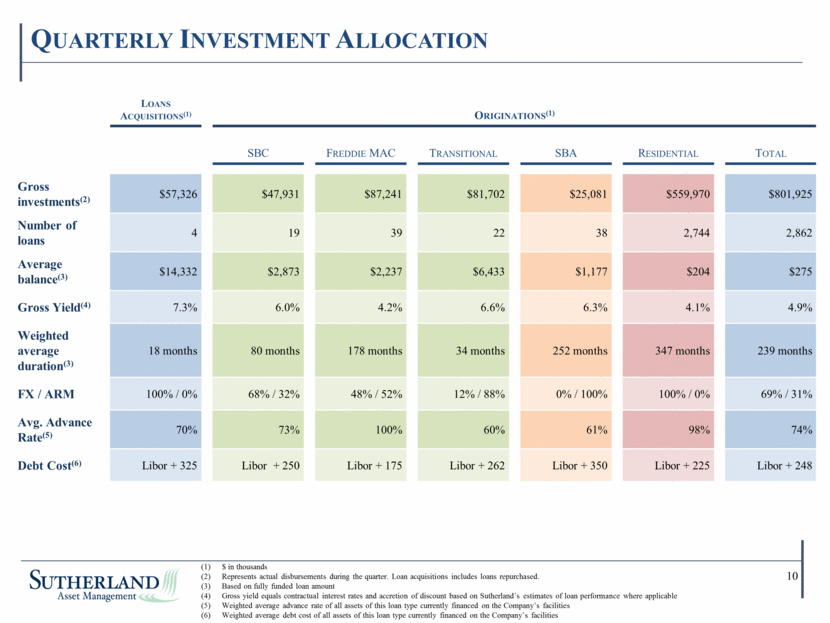
Quarterly Investment Allocation Loans Acquisitions(1) Originations(1) SBC Freddie MAC Transitional SBA Residential Total Gross investments(2) $57,326 $47,931 $87,241 $81,702 $25,081 $559,970 $801,925 Number of loans 4 19 39 22 38 2,744 2,862 Average balance(3) $14,332 $2,873 $2,237 $6,433 $1,177 $204 $275 Gross Yield(4) 7.3% 6.0% 4.2% 6.6% 6.3% 4.1% 4.9% Weighted average duration(3) 18 months 80 months 178 months 34 months 252 months 347 months 239 months FX / ARM 100% / 0% 68% / 32% 48% / 52% 12% / 88% 0% / 100% 100% / 0% 69% / 31% Avg. Advance Rate(5) 70% 73% 100% 60% 61% 98% 74% Debt Cost(6) Libor + 325 Libor + 250 Libor + 175 Libor + 262 Libor + 350 Libor + 225 Libor + 248 $ in thousands Represents actual disbursements during the quarter. Loan acquisitions includes loans repurchased. Based on fully funded loan amount Gross yield equals contractual interest rates and accretion of discount based on Sutherland’s estimates of loan performance where applicable Weighted average advance rate of all assets of this loan type currently financed on the Company’s facilities Weighted average debt cost of all assets of this loan type currently financed on the Company’s facilities 10 |
|
|
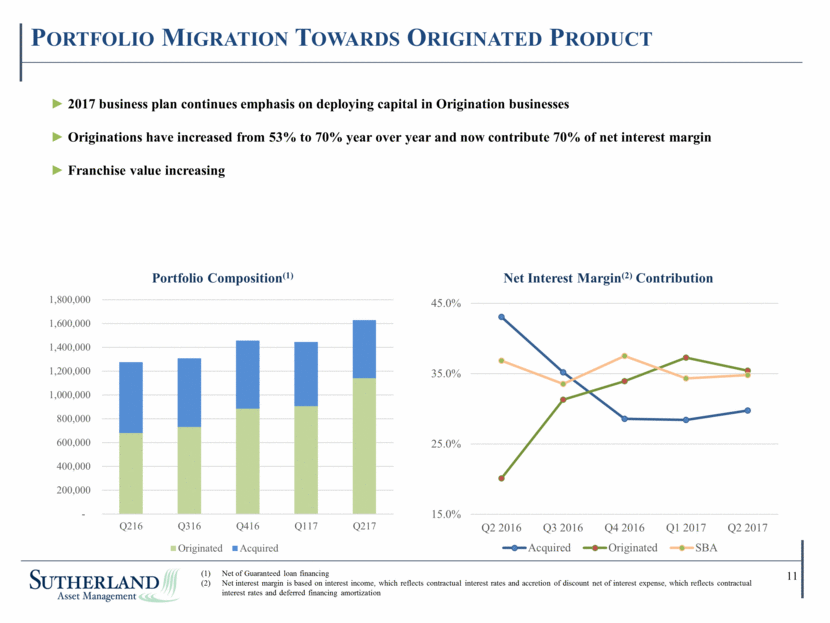
Portfolio Migration Towards Originated Product 11 Net of Guaranteed loan financing Net interest margin is based on interest income, which reflects contractual interest rates and accretion of discount net of interest expense, which reflects contractual interest rates and deferred financing amortization ► 2017 business plan continues emphasis on deploying capital in Origination businesses ► Originations have increased from 53% to 70% year over year and now contribute 70% of net interest margin ► Franchise value increasing 15.0% 25.0% 35.0% 45.0% Q2 2016 Q3 2016 Q4 2016 Q1 2017 Q2 2017 Net Interest Margin (2) Contribution Acquired Originated SBA - 200,000 400,000 600,000 800,000 1,000,000 1,200,000 1,400,000 1,600,000 1,800,000 Q216 Q316 Q416 Q117 Q217 Portfolio Composition (1) Originated Acquired |
|
|
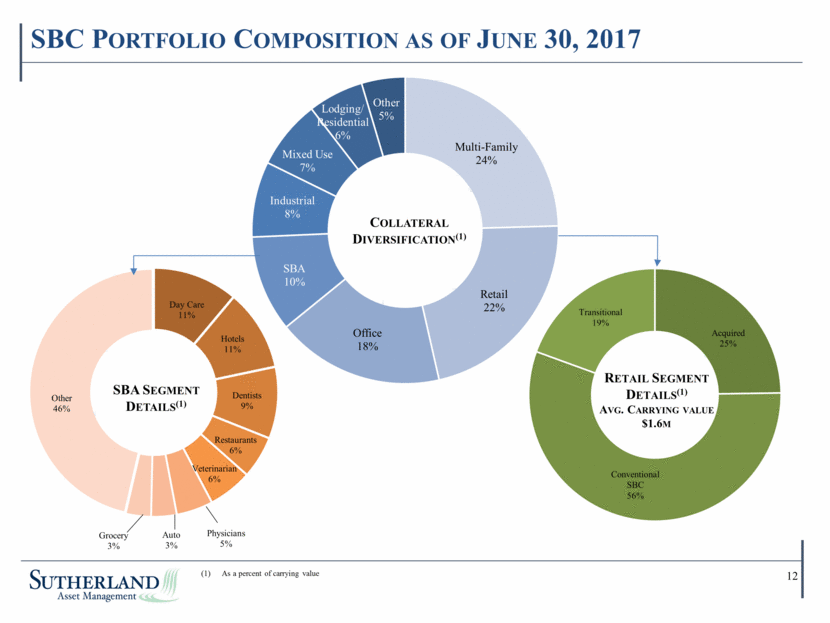
SBC Portfolio Composition as of June 30, 2017 Collateral Diversification(1) SBA Segment Details(1) 12 As a percent of carrying value Multi - Family 24% Retail 22% Office 18% SBA 10% Industrial 8% Mixed Use 7% Lodging/ Residential 6% Other 5% Acquired 25% Conventional SBC 56% Transitional 19% R ETAIL S EGMENT D ETAILS (1) A VG . C ARRYING VALUE $1.6 M Day Care 11% Hotels 11% Dentists 9% Restaurants 6% Veterinarian 6% Physicians 5% Auto 3% Grocery 3% Other 46% |
|
|
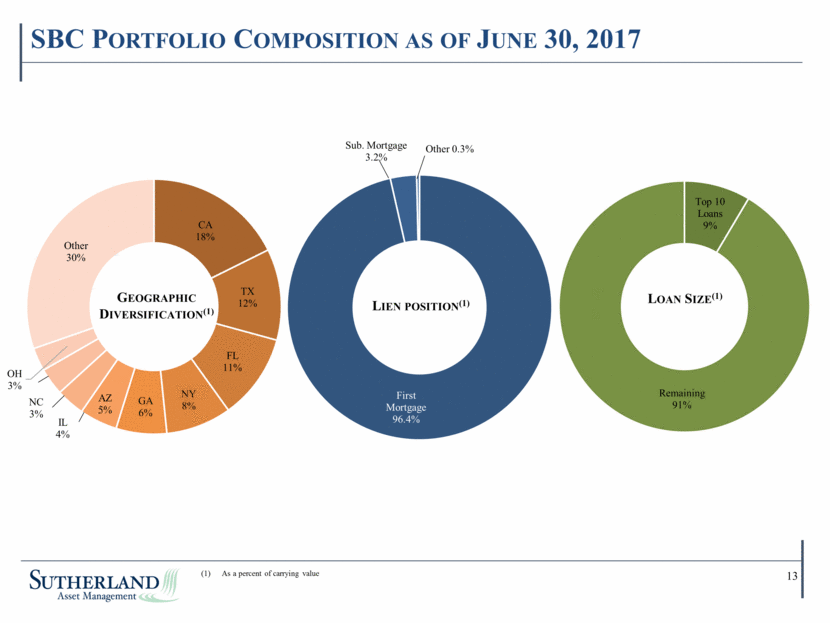
SBC Portfolio Composition as of June 30, 2017 Lien position(1) Loan Size(1) 13 As a percent of carrying value First Mortgage 96.4% Sub. Mortgage 3.2% Other 0.3% Top 10 Loans 9% Remaining 91% CA 18% TX 12% FL 11% NY 8% GA 6% AZ 5% IL 4% NC 3% OH 3% Other 30% G EOGRAPHIC D IVERSIFICATION (1) |
|
|
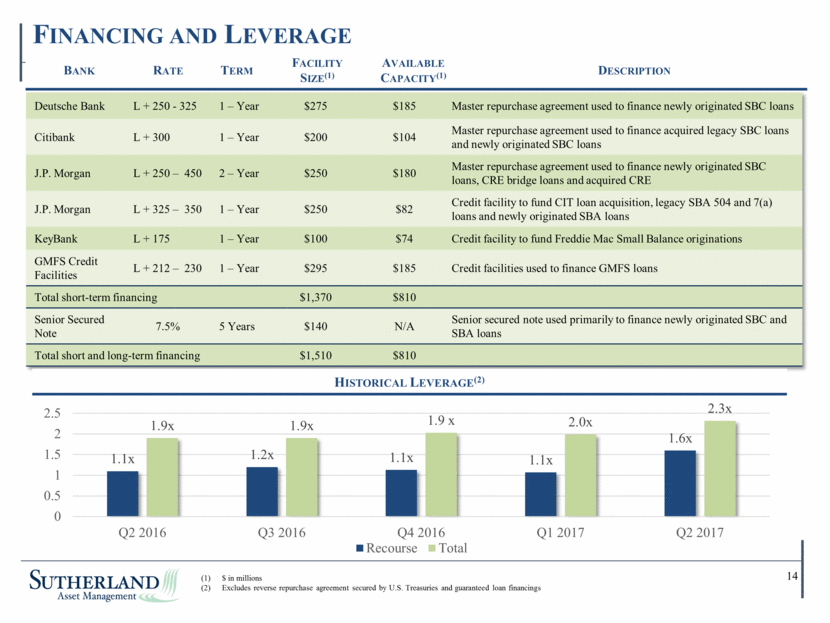
Financing and Leverage Deutsche Bank L + 250 - 325 1 – Year $275 $185 Master repurchase agreement used to finance newly originated SBC loans Citibank L + 300 1 – Year $200 $104 Master repurchase agreement used to finance acquired legacy SBC loans and newly originated SBC loans J.P. Morgan L + 250 – 450 2 – Year $250 $180 Master repurchase agreement used to finance newly originated SBC loans, CRE bridge loans and acquired CRE J.P. Morgan L + 325 – 350 1 – Year $250 $82 Credit facility to fund CIT loan acquisition, legacy SBA 504 and 7(a) loans and newly originated SBA loans KeyBank L + 175 1 – Year $100 $74 Credit facility to fund Freddie Mac Small Balance originations GMFS Credit Facilities L + 212 – 230 1 – Year $295 $185 Credit facilities used to finance GMFS loans Total short-term financing $1,370 $810 Senior Secured Note 7.5% 5 Years $140 N/A Senior secured note used primarily to finance newly originated SBC and SBA loans Total short and long-term financing $1,510 $810 Bank Rate Term Facility Size(1) Available Capacity(1) Description Historical Leverage(2) 14 $ in millions Excludes reverse repurchase agreement secured by U.S. Treasuries and guaranteed loan financings 1.1x 1.2x 1.1x 1.1x 1.6x 1.9x 1.9x 1.9 x 2.0x 2.3x 0 0.5 1 1.5 2 2.5 Q2 2016 Q3 2016 Q4 2016 Q1 2017 Q2 2017 Recourse Total |
|
|
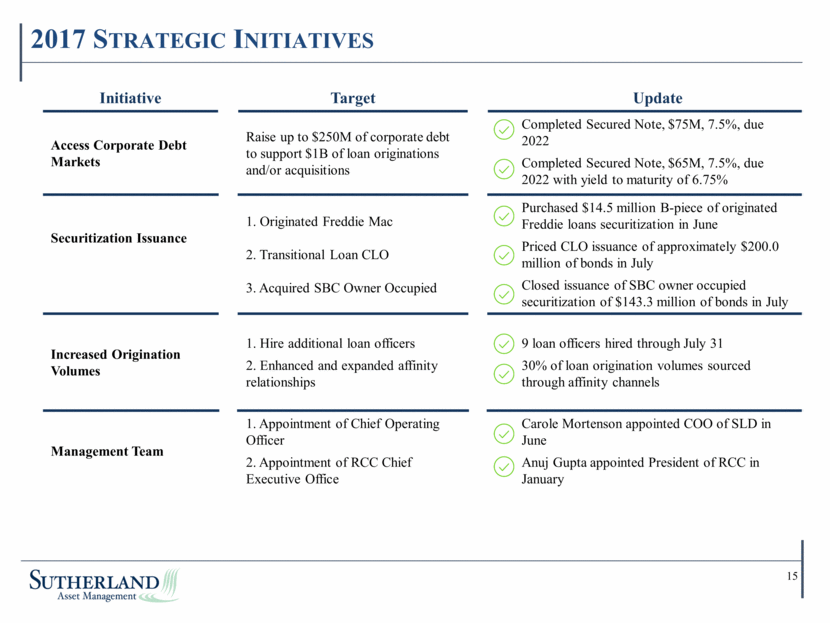
2017 Strategic Initiatives 15 Initiative Target Update Access Corporate Debt Markets Raise up to $250M of corporate debt to support $1B of loan originations and/or acquisitions Completed Secured Note, $75M, 7.5%, due 2022 Completed Secured Note, $65M, 7.5%, due 2022 with yield to maturity of 6.75% Securitization Issuance 1. Originated Freddie Mac 2. Transitional Loan CLO 3. Acquired SBC Owner Occupied Purchased $14.5 million B-piece of originated Freddie loans securitization in June Priced CLO issuance of approximately $200.0 million of bonds in July Closed issuance of SBC owner occupied securitization of $143.3 million of bonds in July Increased Origination Volumes 1. Hire additional loan officers 2. Enhanced and expanded affinity relationships 9 loan officers hired through July 31 30% of loan origination volumes sourced through affinity channels Management Team 1. Appointment of Chief Operating Officer 2. Appointment of RCC Chief Executive Office Carole Mortenson appointed COO of SLD in June Anuj Gupta appointed President of RCC in January |
|
|
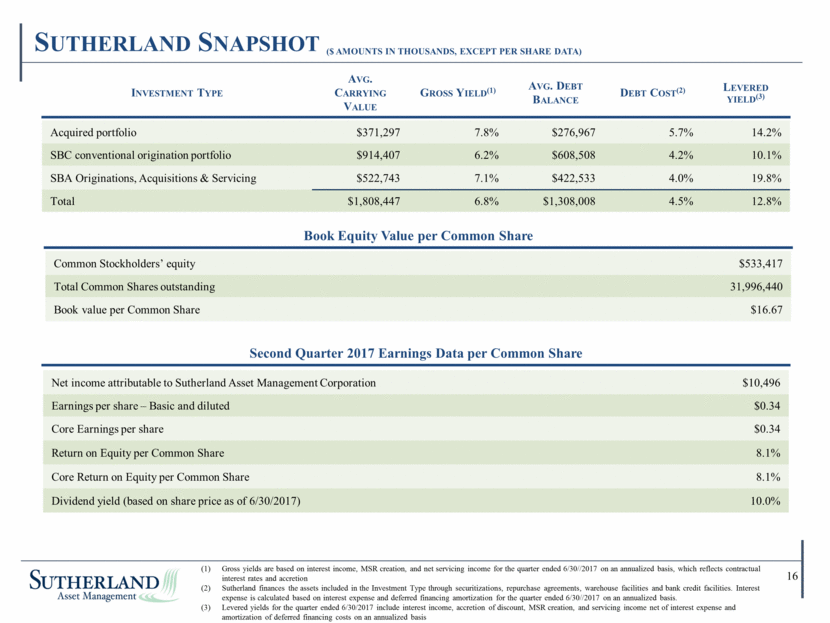
Sutherland Snapshot ($ amounts in thousands, except per share data) Acquired portfolio $371,297 7.8% $276,967 5.7% 14.2% SBC conventional origination portfolio $914,407 6.2% $608,508 4.2% 10.1% SBA Originations, Acquisitions & Servicing $522,743 7.1% $422,533 4.0% 19.8% Total $1,808,447 6.8% $1,308,008 4.5% 12.8% Investment Type Avg. Carrying Value Gross Yield(1) Avg. Debt Balance Debt Cost(2) Levered yield(3) Book Equity Value per Common Share Second Quarter 2017 Earnings Data per Common Share 16 Gross yields are based on interest income, MSR creation, and net servicing income for the quarter ended 6/30//2017 on an annualized basis, which reflects contractual interest rates and accretion Sutherland finances the assets included in the Investment Type through securitizations, repurchase agreements, warehouse facilities and bank credit facilities. Interest expense is calculated based on interest expense and deferred financing amortization for the quarter ended 6/30//2017 on an annualized basis. Levered yields for the quarter ended 6/30/2017 include interest income, accretion of discount, MSR creation, and servicing income net of interest expense and amortization of deferred financing costs on an annualized basis Common Stockholders’ equity $533,417 Total Common Shares outstanding 31,996,440 Book value per Common Share $16.67 Net income attributable to Sutherland Asset Management Corporation $10,496 Earnings per share – Basic and diluted $0.34 Core Earnings per share $0.34 Return on Equity per Common Share 8.1% Core Return on Equity per Common Share 8.1% Dividend yield (based on share price as of 6/30/2017) 10.0% |
|
|
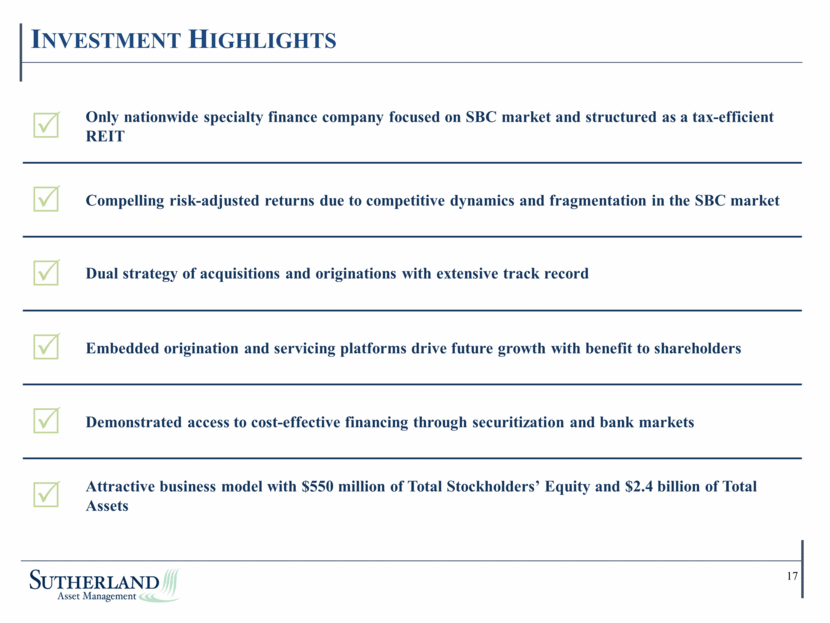
Investment Highlights 17 Only nationwide specialty finance company focused on SBC market and structured as a tax-efficient REIT Compelling risk-adjusted returns due to competitive dynamics and fragmentation in the SBC market Dual strategy of acquisitions and originations with extensive track record Embedded origination and servicing platforms drive future growth with benefit to shareholders Demonstrated access to cost-effective financing through securitization and bank markets Attractive business model with $550 million of Total Stockholders’ Equity and $2.4 billion of Total Assets |
|
|
Appendix |
|
|
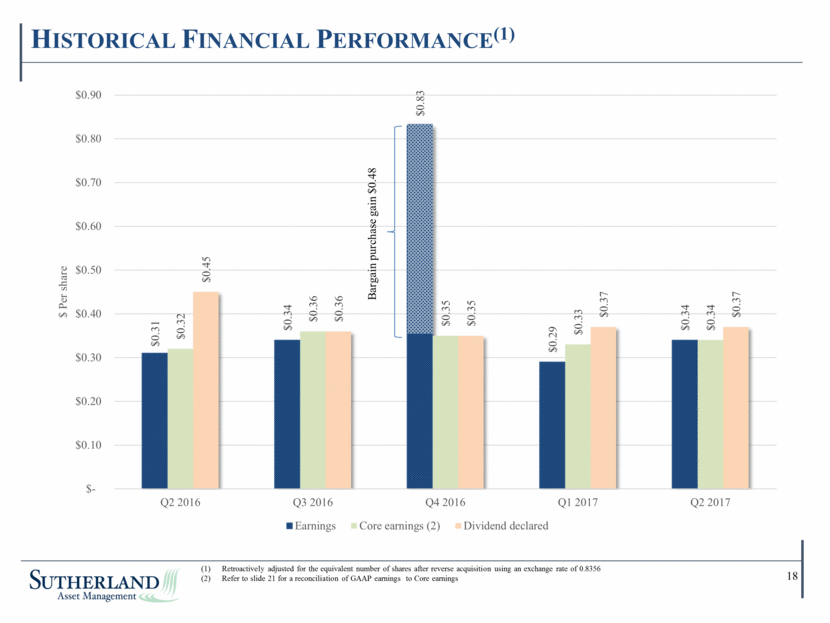
Historical Financial Performance(1) 18 Retroactively adjusted for the equivalent number of shares after reverse acquisition using an exchange rate of 0.8356 Refer to slide 21 for a reconciliation of GAAP earnings to Core earnings $0.31 $0.34 $0.83 $0.29 $0.34 $0.32 $0.36 $0.35 $0.33 $0.34 $0.45 $0.36 $0.35 $0.37 $0.37 $- $0.10 $0.20 $0.30 $0.40 $0.50 $0.60 $0.70 $0.80 $0.90 Q2 2016 Q3 2016 Q4 2016 Q1 2017 Q2 2017 $ Per share Earnings Core earnings (2) Dividend declared Bargain purchase gain $0.48 |
|
|
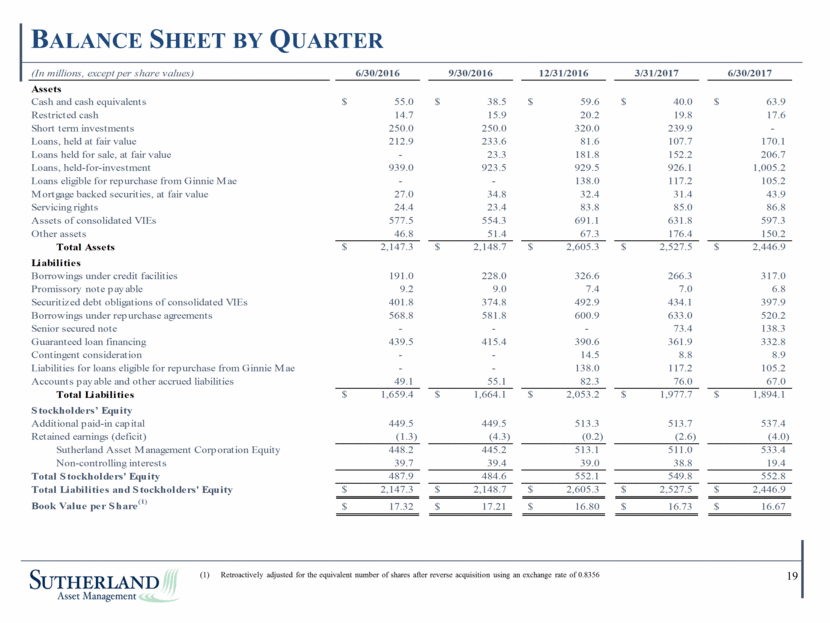
Balance Sheet by Quarter 19 Retroactively adjusted for the equivalent number of shares after reverse acquisition using an exchange rate of 0.8356 (In millions, except per share values) 6/30/2016 9/30/2016 12/31/2016 3/31/2017 6/30/2017 Assets Cash and cash equivalents 55.0 $ 38.5 $ 59.6 $ 40.0 $ 63.9 $ Restricted cash 14.7 15.9 20.2 19.8 17.6 Short term investments 250.0 250.0 320.0 239.9 - Loans, held at fair value 212.9 233.6 81.6 107.7 170.1 Loans held for sale, at fair value - 23.3 181.8 152.2 206.7 Loans, held-for-investment 939.0 923.5 929.5 926.1 1,005.2 Loans eligible for repurchase from Ginnie Mae - - 138.0 117.2 105.2 Mortgage backed securities, at fair value 27.0 34.8 32.4 31.4 43.9 Servicing rights 24.4 23.4 83.8 85.0 86.8 Assets of consolidated VIEs 577.5 554.3 691.1 631.8 597.3 Other assets 46.8 51.4 67.3 176.4 150.2 Total Assets 2,147.3 $ 2,148.7 $ 2,605.3 $ 2,527.5 $ 2,446.9 $ Liabilities Borrowings under credit facilities 191.0 228.0 326.6 266.3 317.0 Promissory note payable 9.2 9.0 7.4 7.0 6.8 Securitized debt obligations of consolidated VIEs 401.8 374.8 492.9 434.1 397.9 Borrowings under repurchase agreements 568.8 581.8 600.9 633.0 520.2 Senior secured note - - - 73.4 138.3 Guaranteed loan financing 439.5 415.4 390.6 361.9 332.8 Contingent consideration - - 14.5 8.8 8.9 Liabilities for loans eligible for repurchase from Ginnie Mae - - 138.0 117.2 105.2 Accounts payable and other accrued liabilities 49.1 55.1 82.3 76.0 67.0 Total Liabilities 1,659.4 $ 1,664.1 $ 2,053.2 $ 1,977.7 $ 1,894.1 $ Stockholders’ Equity Additional paid-in capital 449.5 449.5 513.3 513.7 537.4 Retained earnings (deficit) (1.3) (4.3) (0.2) (2.6) (4.0) Sutherland Asset Management Corporation Equity 448.2 445.2 513.1 511.0 533.4 Non-controlling interests 39.7 39.4 39.0 38.8 19.4 Total Stockholders' Equity 487.9 484.6 552.1 549.8 552.8 Total Liabilities and Stockholders' Equity 2,147.3 $ 2,148.7 $ 2,605.3 $ 2,527.5 $ 2,446.9 $ Book Value per Share (1) 17.32 $ 17.21 $ 16.80 $ 16.73 $ 16.67 $ |
|
|
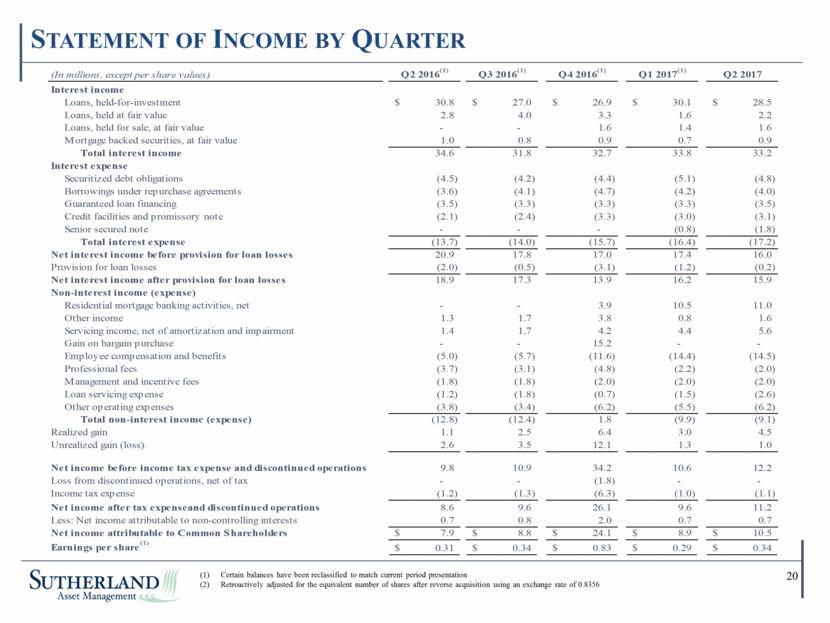
Statement of Income by Quarter 20 Certain balances have been reclassified to match current period presentation Retroactively adjusted for the equivalent number of shares after reverse acquisition using an exchange rate of 0.8356 (In millions, except per share values) Q2 2016 (1) Q3 2016 (1) Q4 2016 (1) Q1 2017 (1) Q2 2017 Interest income Loans, held-for-investment 30.8 $ 27.0 $ 26.9 $ 30.1 $ 28.5 $ Loans, held at fair value 2.8 4.0 3.3 1.6 2.2 Loans, held for sale, at fair value - - 1.6 1.4 1.6 Mortgage backed securities, at fair value 1.0 0.8 0.9 0.7 0.9 Total interest income 34.6 31.8 32.7 33.8 33.2 Interest expense Securitized debt obligations (4.5) (4.2) (4.4) (5.1) (4.8) Borrowings under repurchase agreements (3.6) (4.1) (4.7) (4.2) (4.0) Guaranteed loan financing (3.5) (3.3) (3.3) (3.3) (3.5) Credit facilities and promissory note (2.1) (2.4) (3.3) (3.0) (3.1) Senior secured note - - - (0.8) (1.8) Total interest expense (13.7) (14.0) (15.7) (16.4) (17.2) Net interest income before provision for loan losses 20.9 17.8 17.0 17.4 16.0 Provision for loan losses (2.0) (0.5) (3.1) (1.2) (0.2) Net interest income after provision for loan losses 18.9 17.3 13.9 16.2 15.9 Non-interest income (expense) Residential mortgage banking activities, net - - 3.9 10.5 11.0 Other income 1.3 1.7 3.8 0.8 1.6 Servicing income, net of amortization and impairment 1.4 1.7 4.2 4.4 5.6 Gain on bargain purchase - - 15.2 - - Employee compensation and benefits (5.0) (5.7) (11.6) (14.4) (14.5) Professional fees (3.7) (3.1) (4.8) (2.2) (2.0) Management and incentive fees (1.8) (1.8) (2.0) (2.0) (2.0) Loan servicing expense (1.2) (1.8) (0.7) (1.5) (2.6) Other operating expenses (3.8) (3.4) (6.2) (5.5) (6.2) Total non-interest income (expense) (12.8) (12.4) 1.8 (9.9) (9.1) Realized gain 1.1 2.5 6.4 3.0 4.5 Unrealized gain (loss) 2.6 3.5 12.1 1.3 1.0 Net income before income tax expense and discontinued operations 9.8 10.9 34.2 10.6 12.2 Loss from discontinued operations, net of tax - - (1.8) - - Income tax expense (1.2) (1.3) (6.3) (1.0) (1.1) Net income after tax expenseand discontinued operations 8.6 9.6 26.1 9.6 11.2 Less: Net income attributable to non-controlling interests 0.7 0.8 2.0 0.7 0.7 Net income attributable to Common Shareholders 7.9 $ 8.8 $ 24.1 $ 8.9 $ 10.5 $ Earnings per share (1) 0.31 $ 0.34 $ 0.83 $ 0.29 $ 0.34 $ |
|
|
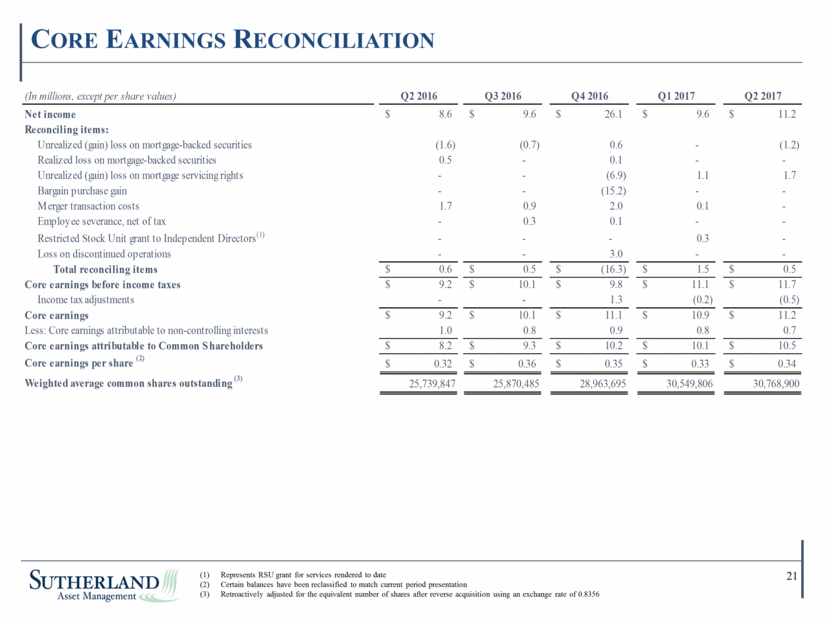
Core Earnings Reconciliation 21 Represents RSU grant for services rendered to date Certain balances have been reclassified to match current period presentation Retroactively adjusted for the equivalent number of shares after reverse acquisition using an exchange rate of 0.8356 (In millions, except per share values) Q2 2016 Q3 2016 Q4 2016 Q1 2017 Q2 2017 Net income 8.6 $ 9.6 $ 26.1 $ 9.6 $ 11.2 $ Reconciling items: Unrealized (gain) loss on mortgage-backed securities (1.6) (0.7) 0.6 - (1.2) Realized loss on mortgage-backed securities 0.5 - 0.1 - - Unrealized (gain) loss on mortgage servicing rights - - (6.9) 1.1 1.7 Bargain purchase gain - - (15.2) - - Merger transaction costs 1.7 0.9 2.0 0.1 - Employee severance, net of tax - 0.3 0.1 - - Restricted Stock Unit grant to Independent Directors (1) - - - 0.3 - Loss on discontinued operations - - 3.0 - - Total reconciling items 0.6 $ 0.5 $ (16.3) $ 1.5 $ 0.5 $ Core earnings before income taxes 9.2 $ 10.1 $ 9.8 $ 11.1 $ 11.7 $ Income tax adjustments - - 1.3 (0.2) (0.5) Core earnings 9.2 $ 10.1 $ 11.1 $ 10.9 $ 11.2 $ Less: Core earnings attributable to non-controlling interests 1.0 0.8 0.9 0.8 0.7 Core earnings attributable to Common Shareholders 8.2 $ 9.3 $ 10.2 $ 10.1 $ 10.5 $ Core earnings per share (2) 0.32 $ 0.36 $ 0.35 $ 0.33 $ 0.34 $ Weighted average common shares outstanding (3) 25,739,847 25,870,485 28,963,695 30,549,806 30,768,900 |
|
|
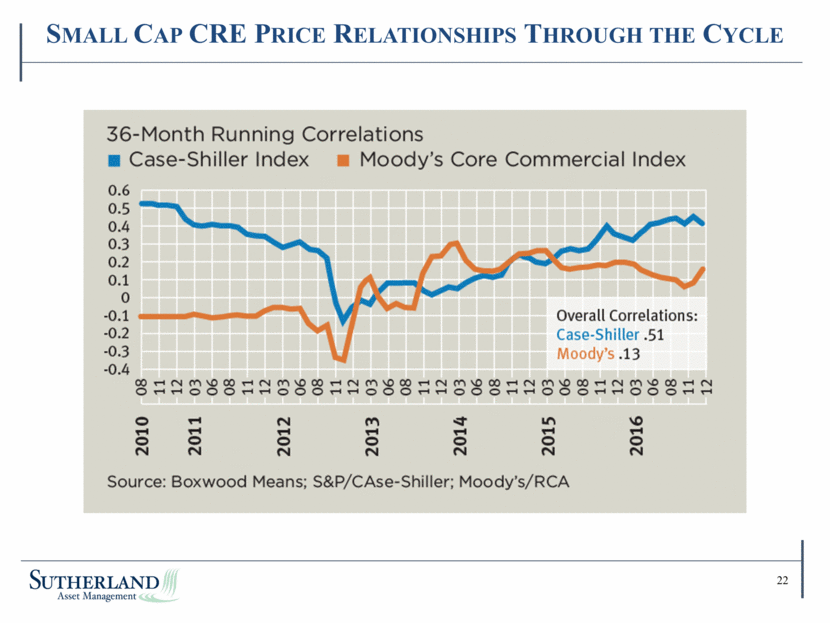
Small cap cre price relationships through the cycle 36-month running correlations case-shiller index moody’s core commercial index 0.6 0.5 0.4 0.3 0.2 0.1 0 -0.1 -0.2 -0.3 -0.4 08 11 12 03 06 08 11 12 03 06 08 11 12 03 06 08 11 12 03 06 08 11 12 03 06 08 11 12 03 06 08 11 12 2010 2011 2012 2013 2014 2015 2016 overall correlations: case-shiller .51 moody’s .13 source: boxwood means; s&p/case-shiller; moody’s/rca |

