Attached files
| file | filename |
|---|---|
| EX-99.1 - EX-99.1 - Simply, Inc. | ifon-ex991_7.htm |
| EX-23.1 - EX-23.1 - Simply, Inc. | ifon-ex231_293.htm |
| 8-K - 8-K - Simply, Inc. | ifon-8k_20170802.htm |
Exhibit 99.2

COOLTECH HOLDING CORP
Condensed Consolidated Combined Interim Financial Statements
For the three and six-month periods ended June 30, 2017 and 2016
(Expressed in US dollars)
1
CONDENSED CONSOLIDATED COMBINED INTERIM STATEMENTS OF FINANCIAL POSITION
(Expressed in US dollars)
|
|
|
As at |
|
|
As at |
|
||
|
|
|
June 30, 2017 |
|
|
December 31, 2016 |
|
||
|
|
Note |
(Unaudited) |
|
|
(Audited) |
|
||
|
|
|
|
|
|
|
|
|
|
|
|
|
$ |
|
|
$ |
|
||
|
ASSETS |
|
|
|
|
|
|
|
|
|
CURRENT |
|
|
|
|
|
|
|
|
|
Cash |
|
|
110,966 |
|
|
|
735,594 |
|
|
Accounts receivable |
3 |
|
3,961,752 |
|
|
|
5,069,086 |
|
|
Other receivables |
|
|
1,971 |
|
|
|
- |
|
|
Inventory |
|
|
632,698 |
|
|
|
327,266 |
|
|
Due from related parties |
5 |
|
4,010,380 |
|
|
|
733,439 |
|
|
Total current assets |
|
|
8,717,767 |
|
|
|
6,865,385 |
|
|
|
|
|
|
|
|
|
|
|
|
Equipment (net) |
4 |
|
166,163 |
|
|
|
193,819 |
|
|
Total assets |
|
|
8,883,930 |
|
|
|
7,059,204 |
|
|
|
|
|
|
|
|
|
|
|
|
LIABILITIES |
|
|
|
|
|
|
|
|
|
CURRENT |
|
|
|
|
|
|
|
|
|
Accounts payable and accrued liabilities |
|
|
5,413,532 |
|
|
|
6,706,744 |
|
|
Notes payable |
7 |
|
2,186,591 |
|
|
|
1,861,898 |
|
|
Interest payable |
|
|
22,167 |
|
|
|
- |
|
|
Line of credit |
6 |
|
500,000 |
|
|
|
500,000 |
|
|
Total current liabilities |
|
|
8,122,290 |
|
|
|
9,068,642 |
|
|
|
|
|
|
|
|
|
|
|
|
Notes payable |
7 |
|
- |
|
|
|
545,082 |
|
|
Total liabilities |
|
|
8,122,290 |
|
|
|
9,613,724 |
|
|
|
|
|
|
|
|
|
|
|
|
SHAREHOLDERS' DEFICIENCY |
|
|
|
|
|
|
|
|
|
|
|
|
|
|
|
|
|
|
|
Common stock, par value $0.0001, 250,000,000 shares authorized, 4,605,775 issued and outstanding (December 31, 2016 - 2,330,553) |
8 |
|
461 |
|
|
|
233 |
|
|
Series A preferred stock, par value of $0.0001, 50,000,000 shares authorized, 4,408,410 issued and outstanding. |
8 |
|
441 |
|
|
|
441 |
|
|
Additional paid-in capital |
|
|
4,641,082 |
|
|
|
- |
|
|
Accumulated deficit |
|
|
(3,880,344 |
) |
|
|
(2,551,116 |
) |
|
Total shareholders' equity (deficit) |
|
|
761,640 |
|
|
|
(2,550,442 |
) |
|
|
|
|
|
|
|
|
|
|
|
Non-controlling interest in consolidated subsidiary |
|
|
- |
|
|
|
(4,078 |
) |
|
|
|
|
|
|
|
|
|
|
|
Total liabilities and shareholders' equity (deficit) |
|
|
8,883,930 |
|
|
|
7,059,204 |
|
The accompanying notes are an integral part of these unaudited condensed consolidated combined interim financial statements.
2
CONDENSED CONSOLIDATED COMBINED INTERIM STATEMENTS OF LOSS AND COMPREHENSIVE LOSS
FOR THE THREE AND SIX MONTH PERIODS ENDED JUNE 30, 2017 AND 2016 (UNAUDITED)
(Expressed in US dollars)
|
|
|
For the Three Months Ended June 30, 2017 |
|
For the Three Months Ended June 30, 2016 |
|
For the Six Months Ended June 30, 2017 |
|
For the Six Months Ended June 30, 2016 |
|
||||
|
|
|
|
|
|
|
|
|
|
|
|
|
|
|
|
|
|
$ |
|
$ |
|
$ |
|
$ |
|
||||
|
REVENUE |
|
|
|
|
|
|
|
|
|
|
|
|
|
|
Sale of products |
|
|
8,009,137 |
|
|
4,136,620 |
|
|
12,574,991 |
|
|
7,775,248 |
|
|
Sale of services |
|
|
16,570 |
|
|
- |
|
|
17,026 |
|
|
7,000 |
|
|
Discounts (given) received |
|
|
(13,999 |
) |
|
13,871 |
|
|
(18,712 |
) |
|
23,384 |
|
|
NET REVENUE |
|
|
8,011,708 |
|
|
4,150,491 |
|
|
12,573,305 |
|
|
7,805,632 |
|
|
|
|
|
|
|
|
|
|
|
|
|
|
|
|
|
Cost of goods sold |
|
|
7,842,630 |
|
|
3,950,243 |
|
|
12,273,067 |
|
|
7,433,454 |
|
|
Cost of services |
|
|
20,507 |
|
|
11,923 |
|
|
30,649 |
|
|
25,510 |
|
|
|
|
|
7,863,137 |
|
|
3,962,166 |
|
|
12,303,716 |
|
|
7,458,964 |
|
|
|
|
|
|
|
|
|
|
|
|
|
|
|
|
|
GROSS PROFIT |
|
|
148,571 |
|
|
188,325 |
|
|
269,589 |
|
|
346,668 |
|
|
|
|
|
|
|
|
|
|
|
|
|
|
|
|
|
OPERATING EXPENSES |
|
|
|
|
|
|
|
|
|
|
|
|
|
|
Management compensation |
|
|
273,000 |
|
|
- |
|
|
528,000 |
|
|
120,000 |
|
|
General and administrative |
|
|
319,088 |
|
|
34,408 |
|
|
417,418 |
|
|
77,986 |
|
|
Professional fees |
|
|
62,867 |
|
|
11,065 |
|
|
201,835 |
|
|
24,315 |
|
|
Marketing |
|
|
31,287 |
|
|
61,092 |
|
|
83,488 |
|
|
84,688 |
|
|
Sales commissions |
|
|
29,728 |
|
|
73,460 |
|
|
93,139 |
|
|
143,932 |
|
|
Selling |
|
|
25,598 |
|
|
35,495 |
|
|
48,491 |
|
|
62,026 |
|
|
Depreciation |
|
|
16,087 |
|
|
593 |
|
|
30,655 |
|
|
1,032 |
|
|
Finance expense |
|
|
51,358 |
|
|
46,202 |
|
|
185,639 |
|
|
86,376 |
|
|
TOTAL OPERATING EXPENSES |
|
|
(809,013 |
) |
|
(262,315 |
) |
|
(1,588,665 |
) |
|
(600,356 |
) |
|
|
|
|
|
|
|
|
|
|
|
|
|
|
|
|
Other income (expense) |
11 |
|
386,567 |
|
|
(35 |
) |
|
386,567 |
|
|
(35 |
) |
|
Fair value adjustment on promissory notes |
|
|
- |
|
|
- |
|
|
(396,719 |
) |
|
- |
|
|
Gain on settlement of debt |
|
|
- |
|
|
- |
|
|
- |
|
|
90,656 |
|
|
NET LOSS AND COMPREHENSIVE LOSS |
|
|
(273,875 |
) |
|
(74,025 |
) |
|
(1,329,228 |
) |
|
(163,067 |
) |
|
|
|
|
|
|
|
|
|
|
|
|
|
|
|
|
Net loss per share |
|
|
|
|
|
|
|
|
|
|
|
|
|
|
Basic and diluted |
|
|
(0.12 |
) |
|
(0.06 |
) |
|
(0.45 |
) |
|
(0.13 |
) |
|
|
|
|
|
|
|
|
|
|
|
|
|
|
|
|
Weighted average shares outstanding |
|
|
2,330,553 |
|
|
1,300,000 |
|
|
2,951,012 |
|
|
1,300,000 |
|
The accompanying notes are an integral part of these unaudited condensed consolidated combined interim financial statements.
3
COOLTECH HOLDING CORP.
CONDENSED CONSOLIDATED COMBINED INTERIM STATEMENTS OF CHANGES IN SHAREHOLDERS’ EQUITY (DEFICIT)
FOR THE SIX MONTH PERIODS ENDED JUNE 30, 2017 AND 2016 (UNAUDITED)
(Expressed in US dollars)
|
|
Common Stock |
|
Series A Preferred stock |
|
|
|
|
|
|
|
|
|
|
||||||||
|
|
Number of shares |
|
Amount |
|
Number of shares |
|
Amount |
|
Additional paid-in capital |
|
Deficit |
|
Total |
|
|||||||
|
|
|
|
|
$ |
|
|
|
|
$ |
|
$ |
|
$ |
|
$ |
|
|||||
|
Balance, December 31, 2015 |
|
1,300,000 |
|
|
130 |
|
|
4,408,410 |
|
|
441 |
|
|
194,721 |
|
|
(131,566 |
) |
|
63,726 |
|
|
Distributions |
|
- |
|
|
- |
|
|
- |
|
|
- |
|
|
- |
|
|
(240,000 |
) |
|
(240,000 |
) |
|
Comprehensive loss for the period |
|
- |
|
|
- |
|
|
- |
|
|
- |
|
|
- |
|
|
(347,446 |
) |
|
(347,446 |
) |
|
Balance, June 30, 2016 |
|
1,300,000 |
|
|
130 |
|
|
4,408,410 |
|
|
441 |
|
|
194,721 |
|
|
(719,012 |
) |
|
(523,720 |
) |
|
Distributions |
|
- |
|
|
- |
|
|
- |
|
|
- |
|
|
- |
|
|
(145,959 |
) |
|
(145,959 |
) |
|
Effect of the reverse acquisition (note 12) |
|
1,030,553 |
|
|
103 |
|
|
- |
|
|
- |
|
|
(1,478,747 |
) |
|
- |
|
|
(1,478,644 |
) |
|
Reclassification of negative additional paid-in capital |
|
- |
|
|
- |
|
|
- |
|
|
- |
|
|
1,284,026 |
|
|
(1,284,026 |
) |
|
- |
|
|
Comprehensive loss for the period |
|
- |
|
|
- |
|
|
- |
|
|
- |
|
|
- |
|
|
(402,119 |
) |
|
(402,119 |
) |
|
Balance, December 31, 2016 |
|
2,330,553 |
|
|
233 |
|
|
4,408,410 |
|
|
441 |
|
|
- |
|
|
(2,551,116 |
) |
|
(2,550,442 |
) |
|
Shares issed on private placement |
|
2,275,222 |
|
|
228 |
|
|
- |
|
|
- |
|
|
4,641,082 |
|
|
- |
|
|
4,641,310 |
|
|
Comprehensive loss for the period |
|
- |
|
|
- |
|
|
- |
|
|
- |
|
|
- |
|
|
(1,329,228 |
) |
|
(1,329,228 |
) |
|
Balance, June 30, 2017 |
|
4,605,775 |
|
|
461 |
|
|
4,408,410 |
|
|
441 |
|
|
4,641,082 |
|
|
(3,880,344 |
) |
|
761,640 |
|
The accompanying notes are an integral part of these unaudited condensed consolidated combined interim financial statements.
4
COOLTECH HOLDING CORP.
CONDENSED CONSOLIDATED COMBINED INTERIM STATEMENTS OF CASH FLOWS
FOR THE SIX MONTH PERIODS ENDED JUNE 30, 2017 AND 2016 (UNAUDITED)
(Expressed in US dollars)
|
|
|
2017 |
|
2016 |
|
||
|
|
|
$ |
|
$ |
|
||
|
OPERATING ACTIVITIES |
|
|
|
|
|
|
|
|
Net loss |
|
(1,329,228 |
) |
|
(163,067 |
) |
|
|
Items not affecting cash: |
|
|
|
|
|
|
|
|
Depreciation |
|
30,655 |
|
|
1,032 |
|
|
|
Accretion expense |
|
|
130,393 |
|
|
- |
|
|
Fair value adjustment on promissory notes |
|
|
396,719 |
|
|
- |
|
|
Interest on related party loans |
|
|
- |
|
|
890 |
|
|
Gain on settlement of loans payable |
|
|
- |
|
|
(90,656 |
) |
|
Gain on disposition on non-controlling interests |
|
|
4,078 |
|
|
- |
|
|
|
|
|
(767,383 |
) |
|
(251,801 |
) |
|
Changes in non-cash working capital items: |
|
|
|
|
|
|
|
|
Accounts receivable and other receivables |
|
1,105,363 |
|
|
(325,193 |
) |
|
|
Inventory |
|
(305,432 |
) |
|
126,676 |
|
|
|
Accounts payable and other payables |
|
(1,271,045 |
) |
|
493,077 |
|
|
|
Cash flows from (used in) operating activities |
|
(1,238,497 |
) |
|
42,759 |
|
|
|
FINANCING ACTIVITIES |
|
|
|
|
|
|
|
|
Advances from (to) related parties |
|
|
(3,276,942 |
) |
|
20,157 |
|
|
Advances from line of credit |
|
|
- |
|
|
500,000 |
|
|
Distributions to members, prior to reverse acquisition |
|
- |
|
|
(240,000 |
) |
|
|
Payment of notes payable |
|
|
(747,500 |
) |
|
(500,000 |
) |
|
Issuance of common shares, net of offering costs |
|
|
4,641,310 |
|
|
- |
|
|
Cash flows from (used in) financing activities |
|
616,868 |
|
|
(219,843 |
) |
|
|
INVESTING ACTIVITIES |
|
|
|
|
|
|
|
|
Purchase of equipment |
|
(2,999 |
) |
|
(5,005 |
) |
|
|
Cash flows used in investing activities |
|
(2,999 |
) |
|
(5,005 |
) |
|
|
Change in cash during the period |
|
(624,628 |
) |
|
(182,089 |
) |
|
|
Cash, beginning of period |
|
735,594 |
|
|
564,516 |
|
|
|
Cash, end of period |
|
|
110,966 |
|
|
382,427 |
|
The accompanying notes are an integral part of these unaudited condensed consolidated combined interim financial statements.
5
NOTE 1 – NATURE OF OPERATIONS
Cooltech Holding Corp. (“Cooltech” or the “Company” was incorporated in October 2016 under the laws of the State of Nevada. The Company is an acquirer and operator of business in the consumer electronics industry. References to the Company refer to the Company and its subsidiary Icon Networks LLC. The principal address of the Company´s business is 108-48 NW 25th Street, in Miami, Florida.
On December 15, 2016. Pursuant to a Share Exchange Agreement between Cooltech, as a standalone company and Icon Network LLC (“Icon”), Cooltech issued 1,300,000 common shares and 4,408,410 Series A preferred stock and promissory notes with an aggregate face value of $2,047,500 (the “Transaction”). The promissory notes are only repayable upon the closing of certain subsequent financing transactions (note 7). Each preferred share is convertible at the option of the holder, into one of the common stock of the Company. As a result of the Transaction, Icon Networks LLC is now fully-owned subsidiary of Cooltech Holding Corp.
For accounting purposes, the Transaction was treated as a reverse acquisition with icon being the accounting acquirer. Therefore, the Company’s historical financial statements reflect those of Icon. Prior to the reverse acquisition, Cooltech was a shell company with no business operations.
After closing the Transaction there were 2,330,553 shares of common stock outstanding, of which 1,300,000 were held by former members of Icon Networks LLC.
NOTE 2 – SUMMARY OF SIGNIFICANT ACCOUNTING POLICIES
|
(a) |
Unaudited condensed consolidated combined interim financial statements |
These unaudited condensed consolidated combined interim financial statements have been prepared on the same basis as the annual audited financial statements and should be read in conjunction with those annual audited financial statements for the year ended December 31, 2016. In the opinion of management, these unaudited condensed consolidated interim financial statements reflect adjustments, necessary to present fairly the Company’s financial position, results of operations and cash flows for the periods shown. The results of operations for such periods are not necessarily indicative of the results expected for a full year or for any future period.
|
(b) |
Use of estimates |
The preparation of these condensed consolidated combined interim financial statements under US GAAP requires the Company to make estimates and assumptions that affect the reported amounts of assets and liabilities, as well as contingent assets and liabilities as of the dates of the condensed consolidated combined interim balance sheets and the reported amounts of revenue and expenses during the reporting period.
These estimates and assumptions include impairment of equity investments, valuation of preferred shares and promissory notes, and accruals contained within trade and other payables.
Actual results could differ from these estimates and assumptions.
|
(c) |
Business combinations |
The Company accounts for business combinations in accordance with ASC 805, Business Combinations (“ASC 805”), ASC 805 requires that transaction costs, such as broker fees, transfer taxes, legal, accounting, valuation, and other professional and consulting fees, related to acquisitions be expensed as incurred. Upon acquisition of a business, the Company allocates the purchase price of the business based upon the fair value of the net assets acquired.
6
NOTE 2 – SUMMARY OF SIGNIFICANT ACCOUNTING POLICIES (CONTINUED)
|
(d) |
Inventory |
Inventory is stated at the lower of cost or net realizable value. Costs are computed based on the weighted average cost method. Inventory is comprised or finished goods only. Finished goods include products purchased for resale, including costs related to freight and delivery, net of discounts. The reserve for inventory as at June 30, 2017 is $49,795 (December 31, 2016 - $36,463). The net realizable value is estimated using an inventory aging schedule.
Any write-down to net realizable value is recognized as an expense in the period in which the write-downs occurs.
|
(e) |
Loss per share |
Basic net loss per share is computed by dividing net loss by the weighted average number of shares of common stock outstanding during the period. Diluted earnings per share is computed using the weighted average number of common shares and, if dilutive, potential common shares outstanding during the period. Potential common shares consist of the incremental common shares issuable upon the exercise of stock options and warrants (using the treasury stock method). The computation of basic net loss per share for the three and six-month periods ended June 30, 2017 and 2016 excludes potentially dilutive securities. The computations of net loss per share for each period presented is the same for both basic and fully diluted.
|
(f) |
Newly adopted and recently issued accounting pronouncements |
In August 2016, the FASB issued ASU 2016-15, “Statement of Cash Flows: Classification of Certain Cash Receipts and Cash Payments”. This ASU provides eight targeted changes to how cash receipts and cash payments are presented and classified in the statement of cash flows. ASU 2016-15 is effective for the fiscal year commencing after December 15, 2017. The Company is still assessing the impact that the adoption of ASU 2016-15 will have on the consolidated statement of cash flows.
In January 2017, the FASB issued ASU 2017-01, “Business Combinations: Clarifying the definition of a Business” which amends the current definition of a business. Under ASU 2017-01, to be considered a business, an acquisition would have to include an input and a substantive process that together significantly contributes to the ability to create outputs. ASU 2017-01 further states that when substantially all of the fair value of gross assets acquitted is concentrated in a single asset (or a group of similar assets), the assets acquired would not represent a business. The new guidance also narrows the definition of the term “outputs” to be consistent with how it is described in Topic 606, Revenue from Contracts with Customers. The changes to the definition of a business will likely result in more acquisitions being accounted for as asset acquisitions. ASU 2017-01 is effective for acquisitions commencing on or after June 30, 2019, with early adoption permitted. Adoption of this guidance will be applied prospectively on or after the effective date.
In January 2017, the FASB issued ASU 2017-04, “Intangibles – Goodwill and Other” ASU 2017-04 simplifies the accounting for goodwill impairment by eliminating Step 2 of the current goodwill impairment test, which required a hypothetical purchase price allocation. Goodwill impairment will now be the amount by which the reporting unit’s carrying value exceeds its fair value, limited to the carrying value of the goodwill. ASU 2017-04 is effective for financial statements issued for fiscal years, and interim periods beginning after December 15, 2019.
7
NOTE 3 – ACCOUNTS RECEIVABLE
During the six-month periods ended June 30, 2017 and 2016, the Company had factoring agreements with financial institutions to sell its accounts receivable under non-recourse terms. These transactions were treated as a sale and have been accounted for as a reduction in accounts receivable because the agreements transfer effective control over and risk related to the receivables to the buyers. Thus, cash proceeds from these arrangements are reflected as operating activities, including the change of accounts receivable in the consolidated combined statement of cash flows each year. The Company does not service any factored accounts after the factoring has occurred. The Company does not have any servicing assets or liabilities. The Company utilizes factoring arrangements as an integral part of its financing for working capital.
The cost of factoring such accounts receivable, is reflected in the accompanying condensed consolidated combined interim statements of income loss and comprehensive loss as a finance expense. The costs of factoring such accounts receivable for the three-month and six-month periods ended June 30, 2017 were $11,620 and $15,727 respectively (2016 - $18,072 and $24,315). Any change in the availability of these factoring arrangements could have a material adverse effect on the Company’s financial condition.
As at June 30, 2017, the Company had an allowance for doubtful accounts of $61,444 (December 31, 2016 - $17,778).
NOTE 4 - EQUIPMENT
Equipment consisted of the following as at June 30, 2017 and December 31, 2016:
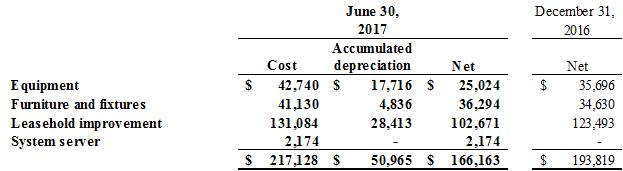
June 30, 2017 Accumulated depreciation Equipment Furniture and fixtures Leasehold improvement System server Cost $42,740 41,130 131,084 2,174 $217,128 $17,716 4,836 28,413 - $50,965 Net $25,024 36,294 102,671 2,174 $166,163 December 31, 2016 Net $35,696 34,630 123,493 - $193,819
NOTE 5 – DUE FROM RELATED PARITES
During the six-month period ended June 30, 2017, the Company advanced funds to non-arm’s length parties, which were measured at the exchange amount. These amounts are due on demand and non-interest bearing. As at June 30, 2017 and December 31, 2016, the Company had the following amounts owing from related parties:

Stamax Corp. OneClick International LLC OneClick License LLC OneClick International LLC Partners Total June 30, 2017 $154,377 2,987,744 24,609 843,650 $4,010,380 December 31, 2016 $164,050 569,389 - - $733,439
8
NOTE 6 – LINE OF CREDIT
In April 2016, the Company obtained a revolving credit facility of $500,000 to finance accounts receivable. The outstanding balances under the credit facility bear interest at the floating WSJ prime rate plus 1%, with a floor of 4.5%, payable monthly in arrears. A first priority security interest lien on all assets of Icon Networks LLC was pledged to the lender, an international financial institution. This liability is guaranteed personally by the CEO and the EVP, Sales and Marketing of the Company. There is also a provision in the loan agreement that prohibits any transaction that would constitute a change in control of Icon Networks LLC. The Company obtained a waiver from the lender as part of completing its reverse acquisition (note 13). Further, the lender has agreed to waive priority to any payment of outstanding loans of the Company prior to the full repayment of the credit facility. As at June 30, 2017, the amount drawn on the credit facility was $500,000 (December 31, 2016 - $500,000)
NOTE 7 – NOTES PAYABLE
Notes payable consisted of the following as at June 30, 2017 and December 31, 2016:
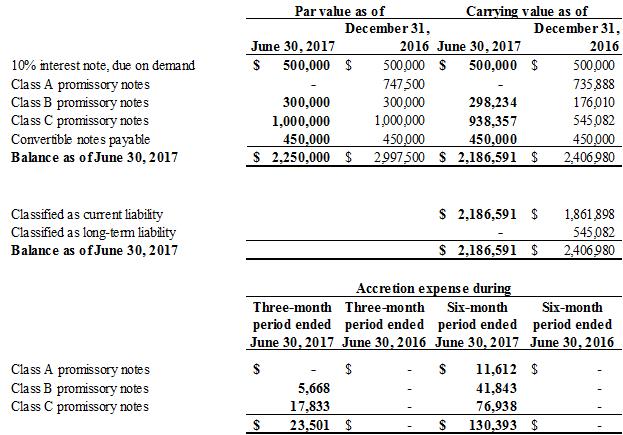
Par value as of December 31, 2016 Carrying value as of December 31, 2016 June 30, 2017 June 30, 2017 10% interest note, due on demand Class A promissory notes Class B promissory notes Class C promissory notes Convertible notes payable Balance as of June 30, 2017 Classified as current liability Classified as long-term liability Balance as of June 30, 2017 Class A promissory notes Class B promissory notes Class C promissory notes $500,000 - 300,000 1,000,000 450,000 $2,250,000 $500,000 747,500 300,000 1,000,000 450,000 $2,997,500 $500,000 - 298,234 938,357 450,000 $2,186,591 $2,186,591 - $2,186,591 $500,000 735,888 176,010 545,082 450,000 $2,406,980 $1,861,898 545,082 $2,406,980 Accretion expense during Three-month period ended June 30 2017 Three-month period ended June30 2016 Six-month period ended June30 2017 Six-month period ended June 30 2016 $- 5,668 17,833 $23,501 $- - - $- $11,612 41,843 76,938 $130,393 $- - - $-
10% interest note, due on demand
During 2015, the Company issued promissory notes of $500,000, with interest payable on the first of each month at a rate of 10% per annum, and a maturity date of April 30, 2016. This loan was amended on May 1, 2016 to be due on demand. For the three and six-month periods ended June 30, 2017, the Company incurred total interest related to this loan in the amounts of $12,500 and $25,000 respectively (2016 - $12,500 and $25,000).
9
NOTE 7 – NOTES PAYABLE (CONTINUED)
Vendor take-back notes
During 2016, the Company issued Class A, B, and C promissory notes as part of a reverse acquisition (note 13). The Class A promissory notes were paid on April 2017. The Class B promissory notes are non-interest bearing, and payable upon the closing of an initial public offering of the Company’s common stock or any reverse merger or similar combination with a publicly traded company in conjunction with a financing transaction (collectively referred to as an “IPO”). The Class C promissory notes are non-interest bearing, and payable on the earlier of (i) the one year anniversary of the closing of an IPO and (ii) the closing of a post-IPO financing transaction in which the Company receives gross proceeds of at least $10,000,000.
Fair values for promissory notes are calculated using the discounted cash flow method, which applies a probability of each note becoming payable at its expected maturity date, and discounts the face value of the note over its maturity. The results from these measurements are classified as Level 3 in the fair value hierarchy. The key Level 3 inputs used by management to determine the fair value are the discount rate, yield-to-maturity, expected maturity, and probability of triggering repayment at each expected maturity. The following assumptions were used for valuation of Class B and Class C promissory notes as at June 30, 2017:

Discount rate Class B promissory notes Class C promissory notes Yield-to- maturity Expected maturity (years) Probability of triggering repayment Classified as current liability Classified as long-term liability 8.00% 8.00% 8.00% 8.00% 0.08 0.83 100% 100% 298,234 938,357 - -
For the three and six-month periods ended June 30, 2017, the Company recognized a loss on the fair value adjustment of the promissory notes in the amount of $Nil and $396,719 respectively (2016 - $Nil and $Nil).
On December 22, 2016, the Company issued $450,000 of notes payable bearing interest at 8% per annum, maturing on the earlier of June 22, 2017 and the closing of a financing in which the Company receives gross proceeds of at least $2,000,000 (a “Qualified Financing”). These notes are convertible at the issuance price upon a Qualified Financing, at the holder’s option, into common shares of the Company.
The Company is in the process of negotiating an extension on the convertible notes. As of June 30, 2017, the Company is in default with respect to the repayment of the convertible notes.
10
NOTE 8 – SHARE CAPITAL AND OTHER EQUITY INSTRUMENTS
Private Placement
During the six-month period ended June 30, 2017, the Company completed a private placement of 2,275,222 shares of its common stock at a price of $2.50 per share for gross proceeds of $5,688,055 and net proceeds of $4,641,310. The Company also issued broker warrants to purchase 227,522 shares of common stock at a price of $2.50 per share, which expire three years from the date of issuance.
Warrants
The broker warrants mentioned above were granted during the six-month period but remained unissued as of June 30, 2017.
NOTE 9 – RELATED PARTY TRANSACTIONS
During the six-month period ended June 30, 2017, the Company was engaged in non-arm’s length transactions, which were in the normal course of business and were measured at the exchange amount. Transactions included sales of products, purchases of inventory as well as general expenses, reimbursements and sales commissions incurred from related parties.
During the six-month period ended June 30, 2017, the Company engaged in transactions with the following related parties:
Nirvana Corp. - This entity is controlled by a family member of the CEO of the Company, and conducts business as a reseller of consumer electronic products.
Fibatir Trade SA and GBC Trading Corp. - Both companies are owned by a family of which certain members hold a 50% interest in Xpro Global LLC and 100% of DBA Trading Corp. These entities were related parties prior to December 15, 2016, the closing of the reverse acquisition (note 13).
Juan Pablo Montoya - Prior to closing the reverse acquisition on December 15, 2016, this individual was a 33% owner of Icon Networks LLC.
Carlos Felipe Rezk – Prior to closing the reverse acquisition on December 15, 2016, this individual was the CEO of Icon Networks LLC and Xpro Global LLC, and is currently the part of the Company’s management.
Stamax Corp. – This entity is controlled by certain members of management, and is a retailer of consumer electronic products.
OneClick International LLC – This entity is controlled by certain members of management, and is a retailer of consumer electronic products.
OneClick License LLC – This entity is controlled by certain members of management, and is a retailer of consumer electronic products.
OneClick International LLC Partners – This is entity is owned by common management and owners of the Company.
11
NOTE 9 – RELATED PARTY TRANSACTIONS (CONTINUED)
OneClick Accessories LLC – This entity is controlled by a family member of the CEO of the Company, and conducts business as a reseller of accessories with the OneClick brand.
Caerus, LLC – This entity is controlled by an individual who was a 33% owner of Icon Networks LLC, prior to the reverse acquisition on December 15, 2016 (note 13).
ICFR LLC – This entity is controlled by individual who is currently the part of the Company’s management.
Bliss Investments Group, LLC – This entity is controlled by individual who is currently the part of the Company’s management.
DBA Trading Corp. – This entity operated part of the Company’s business and was a related party until December 15, 2016, the closing date of the reverse acquisition (note 13).
There are no long-term arrangements with any of the related parties. Pricing and other material payment terms are determined on a case by case basis. The terms are not materially different than the terms being negotiated with unaffiliated third parties. During the three and six-month periods ended June 30, 2017 and 2016, the Company sold products and services to related parties as follows:
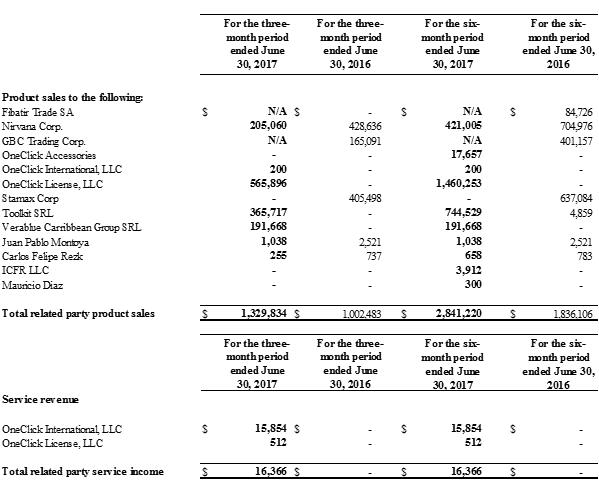
For the three-month period ended June 30, 2017 For the three-month period ended June 30, 2016 For the six-month period ended June 30, 2017 For the six-month period ended June 30, 2016 Product sales to the following: Fibatir Trade SA Nirvana Corp. GBC Trading Corp. OneClick Accessories OneClick International, LLC OneClick License, LLC Stamax Corp Toolkit SRL Verablue Carribbean Group SRL Juan Pablo Montoya Carlos Felipe Rezk ICFR LLC Mauricio Diaz Total related party product sales $N/A 205,060 N/A - 200 564,896 - 365,717 191,668 1,038 255 - - $1,329,834 $- 428,636 165,091- - - 405,498 - - 2,521 737 - - $1,002,483 $N/A 421,005 N/A 17,657 200 1,460,253 - 744,529 191,668 1,038 658 3,912 300 $2,841,220 $84,726 704,976 401,157 - - - 637,084 4,859 - 2,521 783 - - $1,836,106 For the three-month period ended June 30, 2017 For the three-month period ended June 30, 2016 For the six-month period ended June 30, 2017 For the six-month period ended June 30, 2016 Service revenue OneClick International, LLC OneClick License, LLC Total related party service income $15,854 512 $16,366 $- - $- $15,854 512 $16,366 $- - $-
Note: Subsequent to the reverse acquisition (note 13), the entities with entries marked as “N/A” became arm’s length parties.
12
NOTE 9 – RELATED PARTY TRANSACTIONS (CONTINUED)
During the three and six-month periods ended June 30, 2017 and 2016, the Company recovered expenses from related parties as follows:

For the three-month period ended June 30, 2017 For the three-month period ended June 30, 2016 For the six-month period ended June 30, 2017 For the six-month period ended June 30, 2016 Expenses reimbursement from the following: Stamax Corp. - expense recovery Total related party service income $- $- $- $- $9,672 $9,672 $- $-
During the three and six-month periods ended June 30, 2017 and 2016, the Company purchased inventory for resale from related parties as follows:

For the three-month period ended June 30, 2017 For the three-month period ended June 30, 2016 For the six-month period ended June 30, 2017 For the six-month period ended June 30, 2016 Purchases from the following: Nirvana Corp. OneClick Accessories OneClick International LLC OneClick License LLC GBC Trading Corp. Stamax Corp. Total related party product purchases $1,440 37,425 613,290 87,649 N/A - $739,804 $- - - - 59,278 1,456,494 $1,515,772 $5,760 37,425 613,290 743,453 N/A 9,020 $1,408,948 $27,000 - - - 392,458 1,456,494 $1,875,952
Note: Subsequent to the reverse acquisition (note 13), the entities with entries marked as “N/A” became arm’s length parties.
13
NOTE 9 – RELATED PARTY TRANSACTIONS (CONTINUED)
As at June 30, 2017 and December 31, 2016, the Company had the following balances with related parties:
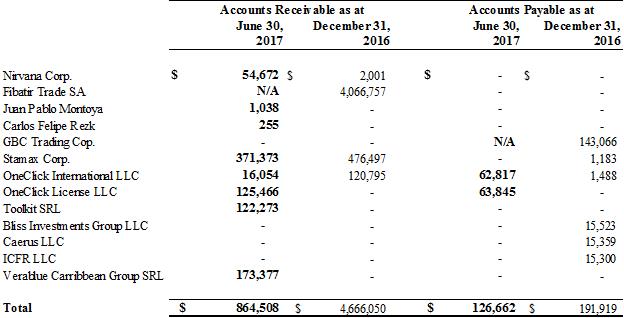
Accounts Receivable as at June 30, 2017 December 31, 2016 Accounts Payable as at June 30, 2017 December 31, 2016 Nirvana Corp. Fibatir Trade SA Juan Pablo Montoya Carlos Felipe Rezk GBC Trading Cop. Stamax Corp. OneClick International LLC OneClick License LLC Toolkit SRL Bliss Investments Group LLC Caerus LLC ICFR LLC Verablue Carribbean Group SRL Total $54,672 N/A 1,038 255 - 371,373 16,054 125,466 122,273 - - - 173,377 $864,508 $2,001 4,066,757 - - - 476,497 120,795 - - - - - - $4,666,050 $- - - - N/A - 62,817 63,845 - - - - - $126,662 $- - - - 143,066 1,183 1,488 - - 15,523 15,359 15,300 - $191,919
Note: Subsequent to the reverse acquisition (note 13), the entities with entries marked as “N/A” became arm’s length parties.
NOTE 10 – NON-MONETARY TRANSACTIONS
As part of its normal operations, the Company exchanges inventory products and services with other distributors. These non-monetary transactions are recognized as revenue and purchases and measured at their fair market value.
The following were the total amount of non-monetary transactions during the six-month period ended June 30, 2016:

For the three-month period ended June 30, 2016 For the six-month period ended June 30, 2016 ICON Networks LLC DBA Trading Corp. Total non-monetary transactions $110,743 - $110,743 115,863 81,874 $197,737
For the three and six-month periods ended June 30, 2017, the Company did not have any non-monetary transactions.
14
NOTE 11 – OTHER INCOME
The Company received a release of payable letter from iON America LLC to release the Company’s payable balance in the amount of $386,567 corresponding to a price protection agreement for $321,567 along with $65,000 for marketing services. This amount is included in other income.
NOTE 12 – COMMITMENTS AND CONTINGENCIES
In the ordinary course of conducting its business, the Company may periodically be a defendant in various legal proceedings. Any estimated loss contingencies in excess of amounts covered by business liability insurance are included in accrued expenses. The Company determines the amount of the loss contingency based on the amount of exposure and an analysis of the likelihood that the Company will incur a loss. It is the best judgment of management that neither the financial position nor results of operations of the Company will be materially affected by the final outcome of any legal proceedings. During the six-month period ended June 30, 2017, the Company was not involved in legal proceedings and hence has not accrued any losses.
Effective October 2016, the Company entered into a lease agreement for its head office in Miami, Florida. The base rent commitment for the remainder of the lease is as follows:
2017 $ 92,357
2018 $ 126,836
2019 $ 108,326
NOTE 13 – REVERSE ACQUISITION
On December 15, 2016, the Company completed a reverse acquisition whereby it purchased 100% of the membership interests (the “Membership Interests”) of Icon Networks LLC from the members of Icon pursuant to a share exchange agreement (the “SEA”). The Company issued 1,300,000 common shares and 4,408,410 Series A preferred stock and promissory notes with an aggregate face value of $2,047,500 (note 7). As a result of this transaction, Icon Networks LLC is now a fully-owned subsidiary of Cooltech Holding Corp.
As the former Icon members ended up owning the majority of the Company, Icon is deemed to be the accounting acquirer. As Cooltech Holding Corp. was the accounting acquiree, the net liabilities acquired are reflected in the statement of equity.
15
NOTE 13 – REVERSE ACQUISITION (CONTINUED)
A breakdown of the net liabilities acquired is as follows:
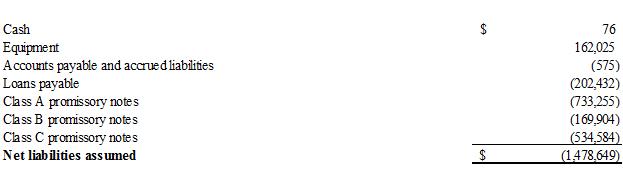
Cash Equipment Accounts payable and accrued liabilities Loans payable Class A promissory notes Class B promissory notes Class C promissory notes Net liabilities assumed $76 162,025 (575) (202,432) (733,255) (169,904) (534,584) $(1,478,649)
Put and call options and subsequent amendment
At any time after nine months from the closing date, if the Company (i) has not closed on an IPO in which it has received gross proceeds of at least $10,000,000 and (ii) the vendors of Icon who were the founding members have not received $1,047,500, in aggregate (the “Put/Call Exercise Period”), the Members who received preferred shares (the “Preferred Members”) of the Company may exercise their right to return all preferred shares to the Company for cancellation and require the Company to return all Membership Interests to all Members. Those Members who received common shares of the Company may require the Company, to return the Membership Interests to the Members in consideration for the return of the Company’s shares of preferred and common stock issued as part of this transaction. On January 30, 2017, the Company and the Members mutually agreed to amend the SEA such that (i) the put and call features would terminate immediately upon the repayment of the Class A Notes in full, and (ii) upon exercise of either the put or call option, the Class A, B and C promissory notes issued pursuant to this transaction would be cancelled and Cooltech shall have no further obligation under those promissory notes.
NOTE 14 – SUBSEQUENT EVENTS
InfoSonics Corporation (IFON) and Cooltech Holding Corp. announced on July 26, 2017 that the Companies have entered into a definitive merger agreement under which InfoSonics will acquire Cooltech. Upon closing of the merger transaction, Cooltech will become a wholly-owned subsidiary of InfoSonics in exchange of 62.5 million shares of InfoSonics common stock. The merger has been unanimously approved by the Special Committee of InfoSonics’ Board of Directors, and is subject to approval by the Company’s stockholders and a number of customary closing conditions. The merger transaction is expected to close in the fourth quarter of fiscal 2017.
16