Attached files
| file | filename |
|---|---|
| EX-99.2 - EXHIBIT 99.2 - Forest City Realty Trust, Inc. | fcrtex992erq2-2017.htm |
| 8-K - 8-K - Forest City Realty Trust, Inc. | a8kforsupppackq2-2017.htm |
Exhibit 99.1

Supplemental Package
For the Quarter Ended June 30, 2017
Forest City Realty Trust, Inc. and Subsidiaries - Supplemental Package
Second Quarter 2017
Index
Corporate Description | |
Selected Financial Information | |
Consolidated Balance Sheets | |
Consolidated Statements of Operations | |
Net Asset Value Components | |
Supplemental Operating Information | |
Occupancy Data | |
Retail Sales Data | |
Leasing Summary | |
Comparable Net Operating Income (NOI) | |
NOI Detail | |
Comparable NOI Margins | |
NOI by Product Type | |
NOI by Core Market | |
Reconciliation of Earnings (Loss) Before Income Taxes to NOI | |
Net Earnings | |
Interest Expense and Capital Expenditures | |
Reconciliation of Net Earnings to FFO | |
Reconciliation of FFO to Operating FFO | |
Reconciliation of NOI to Operating FFO | |
Reconciliation of Net Earnings to EBITDA | |
Operating FFO Bridges | |
Historical Trends | |
Development Pipeline | |
Supplemental Financial Information | |
Common Stock Data/Financial Covenants | |
Nonrecourse Debt Maturities Table | |
Appendix | |
This supplemental package, together with other statements and information publicly disseminated by us, contains “forward-looking statements” within the meaning of Section 27A of the Securities Act of 1933, as amended, and Section 21E of the Securities Exchange Act of 1934, as amended. Such statements reflect management’s current views with respect to financial results related to future events and are based on assumptions and expectations that may not be realized and are inherently subject to risks and uncertainties, many of which cannot be predicted with accuracy and some of which might not even be anticipated. Future events and actual results, financial or otherwise, may differ, perhaps materially, from the results discussed in the forward-looking statements. Risk factors discussed in Item 1A of our Form 10-K for the year ended December 31, 2016 and other factors that might cause differences, some of which could be material, include, but are not limited to, our ability to carry out future transactions and strategic investments, as well as the acquisition related costs, unanticipated difficulties realizing expected benefits expected when entering into a transaction, our ability to qualify or to remain qualified as a REIT, our ability to satisfy REIT distribution requirements, the impact of issuing equity, debt or both, and selling assets to satisfy our future distributions required as a REIT or to fund capital expenditures, future growth and expansion initiatives, the impact of the amount and timing of any future distributions, the impact from complying with REIT qualification requirements limiting our flexibility or causing us to forego otherwise attractive opportunities beyond rental real estate operations, the impact of complying with the REIT requirements related to hedging, our lack of experience operating as a REIT, legislative, administrative, regulatory or other actions affecting REITs, including positions taken by the Internal Revenue Service, the possibility that our Board of Directors will unilaterally revoke our REIT election, the possibility that the anticipated benefits of qualifying as a REIT will not be realized, or will not be realized within the expected time period, the impact of current lending and capital market conditions on our liquidity, our ability to finance or refinance projects or repay our debt, the impact of the slow economic recovery on the ownership, development and management of our commercial real estate portfolio, general real estate investment and development risks, litigation risks, vacancies in our properties, risks associated with developing and managing properties in partnership with others, competition, our ability to renew leases or re-lease spaces as leases expire, illiquidity of real estate investments, our ability to identify and transact on chosen strategic alternatives for a portion of our retail portfolio, bankruptcy or defaults of tenants, anchor store consolidations or closings, the impact of terrorist acts and other armed conflicts, our substantial debt leverage and the ability to obtain and service debt, the impact of restrictions imposed by our revolving credit facility, term loan and senior debt, exposure to hedging agreements, the level and volatility of interest rates, the continued availability of tax-exempt government financing, our ability to receive payment on the notes receivable issued by Onexim in connection with their purchase of our interests in the Barclays Center and the Nets, the impact of credit rating downgrades, effects of uninsured or underinsured losses, effects of a downgrade or failure of our insurance carriers, environmental liabilities, competing interests of our directors and executive officers, the ability to recruit and retain key personnel, risks associated with the sale of tax credits, downturns in the housing market, the ability to maintain effective internal controls, compliance with governmental regulations, increased legislative and regulatory scrutiny of the financial services industry, changes in federal, state or local tax laws and international trade agreements, volatility in the market price of our publicly traded securities, inflation risks, cybersecurity risks, cyber incidents, shareholder activism efforts, conflicts of interest, risks related to our organizational structure including operating through our Operating Partnership and our UPREIT structure, as well as other risks listed from time to time in our SEC filings, including but not limited to, our annual and quarterly reports. We have no obligation to revise or update any forward-looking statements, other than as imposed by law, as a result of future events or new information. Readers are cautioned not to place undue reliance on such forward-looking statements.
1
Forest City Realty Trust, Inc. and Subsidiaries
Supplemental Financial and Operating Information
Corporate Description
We principally engage in the operation, development, management and acquisition of office, apartment and retail real estate and land throughout the United States. We have approximately $8.2 billion of consolidated assets in 20 states and the District of Columbia at June 30, 2017. Our core markets include Boston, Chicago, Dallas, Denver, Los Angeles, Philadelphia and the greater metropolitan areas of New York City, San Francisco and Washington D.C. We have regional offices in Boston, Dallas, Denver, Los Angeles, New York City, San Francisco, Washington, D.C. and our corporate headquarters in Cleveland, Ohio.
Segments
Real Estate Operations represents the performance of our core rental real estate portfolio and is comprised of the following reportable operating segments:
• | Office - owns, acquires and operates office and life science buildings. |
• | Apartments - owns, acquires and operates upscale and middle-market apartments, adaptive re-use developments and subsidized senior housing. |
• | Retail - owns, acquires and operates amenity retail within our mixed-use projects, regional malls and specialty/urban retail centers . |
The remaining reportable operating segments consist of the following:
• | Development - develops and constructs office and life science buildings, apartments, condominiums, amenity retail, regional malls, specialty/urban retail centers and mixed-use projects. The Development segment includes recently opened operating properties prior to stabilization and the horizontal development and sale of land to residential, commercial and industrial customers primarily at our Stapleton project in Denver, Colorado. |
• | Corporate - provides executive oversight to the company and various support services for Operations, Development and Corporate employees. |
• | Other - owned and operated several non-core investments, including the Barclays Center, a sports and entertainment arena located in Brooklyn, New York (“Arena”) (sold in January 2016), our equity method investment in the Brooklyn Nets (the “Nets”) (sold in January 2016), and military housing operations (sold in February 2016). |
Segment Transfers
The Development segment includes projects in development and projects under construction along with recently opened operating properties prior to stabilization. Projects will be reported in their applicable operating segment (Office, Apartments or Retail) beginning on January 1 of the year following stabilization. Therefore, the Development segment will continue to report results from recently opened properties until the year-end following initial stabilization. We generally define stabilized properties as achieving 92% or greater occupancy or having been open and operating for one or two years, depending on the size of the project. Once a stabilized property is transferred to the applicable Operations segment on January 1, it will be considered “comparable” beginning on the following January 1.
Segment Reclassifications
We recently completed an internal reorganization and began presenting new reportable operating segments during the three months ended September 30, 2016. The prior period has been recast to conform to the current period presentation.
Concurrent with our internal reorganization, certain functions previously performed within our old business unit structure were centralized into our corporate segment. We analyzed the allocation methodology of these new corporate functions and our historic corporate functions and how it relates to support services provided to our new segments within our new organizational structure. As a result of this analysis, certain expenses previously recorded in the old business units and reported on the property operating and management expenses financial statement line item are recorded in the corporate segment and included in the corporate general and administrative expense financial statement line item. To conform to the current year presentation, $800,000 and $2,260,000 have been reclassed from property operating and management expenses to corporate general and administrative expenses for the three and six months ended June 30, 2016, respectively.
Company Operations
We believe that we are organized in a manner enabling us to qualify, and intend to operate in a manner allowing us to continue to qualify, as a REIT for federal income tax purposes. As such, we intend to elect REIT status for our taxable year ended December 31, 2016, upon filing the 2016 Form 1120-REIT with the Internal Revenue Service on or before October 15, 2017.
We hold substantially all of our assets, and conduct substantially all of our business, through the Operating Partnership. We are the sole general partner of the Operating Partnership and, as of June 30, 2017, we directly or indirectly own all of the limited partnership interests in the Operating Partnership.
2
Forest City Realty Trust, Inc. and Subsidiaries
Supplemental Financial and Operating Information
We hold and operate certain of our assets through one or more taxable REIT subsidiaries (“TRSs”). A TRS is a subsidiary of a REIT subject to applicable corporate income tax. Our use of TRSs enables us to continue to engage in certain businesses while complying with REIT qualification requirements and allows us to retain income generated by these businesses for reinvestment without the requirement of distributing those earnings. The primary businesses held in TRSs include 461 Dean Street, an apartment building in Brooklyn, New York, South Bay Galleria and Antelope Valley Mall, regional malls in Redondo Beach, California and Palmdale, California, respectively, Pacific Park Brooklyn project, land development operations, Barclays Center arena (sold in January 2016), the Nets (sold in January 2016) and military housing operations (sold in February 2016). In the future, we may elect to reorganize and transfer certain assets or operations from our TRSs to other subsidiaries, including qualified REIT subsidiaries.
Supplemental Financial and Operating Information
We recommend this supplemental package be read in conjunction with our Form 10-Q for the three and six months ended June 30, 2017. This supplemental package contains consolidated financial statements prepared in accordance with generally accepted accounting principles (“GAAP”). We also present certain financial information at total company ownership because we believe this information is useful to financial statement users as this method reflects the manner in which we operate our business. We believe financial information and other operating metrics at total company ownership including net asset value (“NAV”) components, net operating income (“NOI”), comparable NOI, comparable NOI margins, Funds From Operations (“FFO”), Operating FFO, Earnings Before Interest, Taxes, Depreciation and Amortization (“EBITDA”), Adjusted EBITDA and Net Debt to Adjusted EBITDA are necessary to understand our business and operating results, along with net earnings and other GAAP measures. Our financial statement users can use these non-GAAP measures as supplementary information to evaluate our business. Our non-GAAP measures or information shown at total company ownership are not intended to be performance measures that should be regarded as alternatives to, or more meaningful than, our GAAP measures.
This supplemental package also contains financial information of entities consolidated under GAAP (“Fully Consolidated Entities”), financial information on our partners’ share of entities consolidated under GAAP (“Noncontrolling Interest”) and financial information on our share of entities accounted for using the equity method of accounting (“Company Share of Unconsolidated Entities”). We believe disclosing financial information on Fully Consolidated Entities, Noncontrolling Interest and Company Share of Unconsolidated Entities is essential to allow our financial statement users the ability to arrive at our total company ownership of all of our real estate investments, whether or not we “control” the investment under GAAP.
Financial information related to Fully Consolidated Entities, Noncontrolling Interest and Company Share of Unconsolidated Entities is included in the Appendix section of this supplemental package.
Supplemental Operating Information
The operating information contained in this document includes: occupancy data, retail sales data, leasing summaries, comparable NOI, comparable NOI margins, NOI by product type and core market, reconciliation of earnings (loss) before income taxes to NOI, reconciliation of net earnings to FFO, reconciliation of FFO to Operating FFO, reconciliation of NOI to Operating FFO, reconciliation of net earnings to EBITDA, Operating FFO bridges, historical trends and our development pipeline. We believe this information gives interested parties a better understanding and more information about our operating performance. The term “comparable,” which is used throughout this document, is generally defined as including stabilized properties open and operated in the three and six months ended June 30, 2017 and 2016. We believe occupancy data, retail sales data, leasing spreads on office and retail properties, and other rental rate information on multi-family properties represent meaningful operating statistics about us.
Consolidation Method
In line with industry practice, we have a number of investments in which our economic ownership is less than 100% as a means of procuring opportunities and sharing risk. Under GAAP, the full consolidation method is used to report assets and liabilities at 100% if deemed to be under our control or if we are deemed to be the primary beneficiary of the variable interest entity (“VIE”), even if our ownership is not 100%.
Net Asset Value Components
We disclose components of our business relevant to calculate NAV, a non-GAAP measure. There is no directly comparable GAAP financial measure to NAV. We consider NAV to be a useful supplemental measure which assists both management and investors to estimate the fair value of our Company. The calculation of NAV involves significant estimates and can be calculated using various methods. Each individual investor must determine the specific methodology, assumptions and estimates to use to arrive at an estimated NAV of the Company. NAV components are shown at our total company ownership. We believe disclosing the components at total company ownership is essential to estimate NAV, as they represent our estimated proportionate amount of assets and liabilities the Company is entitled to.
The components of NAV do not consider the potential changes in rental and fee income streams or development platform. The components include non-GAAP financial measures, such as NOI, and information related to our rental properties business at the
3
Forest City Realty Trust, Inc. and Subsidiaries
Supplemental Financial and Operating Information
Company’s share. Although these measures are not presented in accordance with GAAP, investors can use these non-GAAP measures as supplementary information to evaluate our business.
FFO
FFO, a non-GAAP measure, along with net earnings, provides additional information about our core operations. While property dispositions, acquisitions or other factors impact net earnings in the short-term, we believe FFO presents a consistent view of the overall financial performance of our business from period-to-period since the core of our business is the recurring operations of our portfolio of real estate assets. Management believes that the exclusion from FFO of gains and losses from the sale of operating real estate assets allows investors and analysts to readily identify the operating results of the Company’s core assets and assists in comparing those operating results between periods. Implicit in historical cost accounting for real estate assets in accordance with GAAP is the assumption that the value of real estate assets diminishes ratably over time. Since real estate values have historically risen or fallen with market conditions, many real estate investors and analysts have considered presentations of operating results for real estate companies using historical cost accounting alone to be insufficient. Because FFO excludes depreciation and amortization of real estate assets and impairment of depreciable real estate, management believes that FFO, along with the required GAAP presentations, provides another measurement of the Company’s performance relative to its competitors and an additional basis on which to make decisions involving operating, financing and investing activities than the required GAAP presentations alone would provide.
The majority of our peers in the publicly traded real estate industry report operations using FFO as defined by the National Association of Real Estate Investment Trusts (“NAREIT”). FFO is defined by NAREIT as net earnings excluding the following items at our ownership: i) gain (loss) on full or partial disposition of rental properties, divisions and other investments (net of tax); ii) non-cash charges for real estate depreciation and amortization; iii) impairment of depreciable real estate (net of tax); and iv) cumulative or retrospective effect of change in accounting principle (net of tax).
Operating FFO
In addition to reporting FFO, we report Operating FFO, a non-GAAP measure, as an additional measure of our operating performance. We believe it is appropriate to adjust FFO for significant items driven by transactional activity and factors relating to the financial and real estate markets, rather than factors specific to the on-going operating performance of our properties. We use Operating FFO as an indicator of continuing operating results in planning and executing our business strategy. Operating FFO should not be considered to be an alternative to net earnings computed under GAAP as an indicator of our operating performance and may not be directly comparable to similarly-titled measures reported by other companies.
We define Operating FFO as FFO adjusted to exclude: i) impairment of non-depreciable real estate; ii) write-offs of abandoned development projects and demolition costs; iii) income recognized on state and federal historic and other tax credits; iv) gains or losses from extinguishment of debt; v) change in fair market value of nondesignated hedges; vi) gains or losses on change in control of interests; vii) the adjustment to recognize rental revenues and rental expense using the straight-line method; viii) participation payments to ground lessors on refinancing of our properties; ix) other transactional items; x) the Nets pre-tax FFO; and xi) income taxes on FFO.
EBITDA
EBITDA, a non-GAAP measure, is defined as net earnings excluding the following items at our company share: i) non-cash charges for depreciation and amortization; ii) interest expense; iii) amortization of mortgage procurement costs; and iv) income taxes. EBITDA may not be directly comparable to similarly-titled measures reported by other companies. We use EBITDA as the starting point in order to calculate Adjusted EBITDA as described below.
Adjusted EBITDA
We define Adjusted EBITDA, a non-GAAP measure, as EBITDA adjusted to exclude: i) impairment of real estate; ii) gains or losses from extinguishment of debt; iii) gain (loss) on full or partial disposition of rental properties, development projects and other investments; iv) gains or losses on change in control of interests; v) other transactional items, including organizational transformation and termination benefits; and vi) the Nets pre-tax EBITDA. We believe EBITDA, Adjusted EBITDA and net debt to Adjusted EBITDA provide additional information in evaluating our credit and ability to service our debt obligations. Adjusted EBITDA is used by the chief operating decision maker and management to assess operating performance and resource allocations by segment and on a consolidated basis. Management believes Adjusted EBITDA gives the investment community a further understanding of the Company’s operating results, including the impact of general and administrative expenses and acquisition-related expenses, before the impact of investing and financing transactions and facilitates comparisons with competitors. However, Adjusted EBITDA should not be viewed as an alternative measure of the Company’s operating performance since it excludes financing costs as well as depreciation and amortization costs which are significant economic costs that could materially impact the Company’s results of operations and liquidity. Other REITs may use different methodologies for calculating Adjusted EBITDA and, accordingly, the Company’s Adjusted EBITDA may not be comparable to other REITs.
4
Forest City Realty Trust, Inc. and Subsidiaries
Supplemental Financial and Operating Information
Net Debt to Adjusted EBITDA
Net Debt to Adjusted EBITDA, a non-GAAP measure, is defined as total debt, net at our company share (total debt includes outstanding borrowings on our revolving credit facility, our term loan facility, convertible senior debt, net, nonrecourse mortgages and notes payable, net) less cash and equivalents, at our company share, divided by Adjusted EBITDA. Net Debt to Adjusted EBITDA is a supplemental measure derived from non-GAAP financial measures that the Company uses to evaluate its capital structure and the magnitude of its debt against its operating performance. The Company believes that investors use versions of this ratio in a similar manner. The Company’s method of calculating the ratio may be different from methods used by other REITs and, accordingly, may not be comparable to other REITs.
NOI
NOI, a non-GAAP measure, reflects our share of the core operations of our rental real estate portfolio, prior to any financing activity. NOI is defined as revenues less operating expenses at our ownership within our Office, Apartments, Retail, and Development segments, except for revenues and cost of sales associated with sales of land held in these segments. The activities of our Corporate and Other segments do not involve the operations of our rental property portfolio and therefore are not included in NOI.
We believe NOI provides important information about our core operations and, along with earnings before income taxes, is necessary to understand our business and operating results. Because NOI excludes general and administrative expenses, interest expense, depreciation and amortization, revenues and cost of sales associated with sales of land, other non-property income and losses, and gains and losses from property dispositions, it provides a performance measure that, when compared year over year, reflects the revenues and expenses directly associated with owning and operating office, apartment and retail real estate and the impact to operations from trends in occupancy rates, rental rates, and operating costs, providing a perspective on operations not immediately apparent from net income. We use NOI to evaluate our operating performance on a portfolio basis since NOI allows us to evaluate the impact that factors such as occupancy levels, lease structure, rental rates, and tenant mix have on our financial results. Investors can use NOI as supplementary information to evaluate our business. In addition, management believes NOI provides useful information to the investment community about our financial and operating performance when compared to other REITs since NOI is generally recognized as a standard measure of performance in the real estate industry. NOI is not intended to be a performance measure that should be regarded as an alternative to, or more meaningful than, our GAAP measures, and may not be directly comparable to similarly-titled measures reported by other companies.
Comparable NOI
We use comparable NOI, a non-GAAP measure, as a metric to evaluate the performance of our office, apartment and retail properties. This measure provides a same-store comparison of operating results of all stabilized properties that are open and operating in all periods presented. Non-capitalizable development costs and unallocated management and service company overhead, net of service fee revenues, are not directly attributable to an individual operating property and are considered non-comparable NOI. In addition, certain income and expense items at the property level, such as lease termination income, real estate tax assessments or rebates, certain litigation expenses incurred and any related legal settlements and NOI impacts of changes in ownership percentages, are excluded from comparable NOI. Other properties and activities such as Arena, federally assisted housing, military housing, straight-line rent adjustments and participation payments as a result of refinancing transactions are not evaluated on a comparable basis and the NOI from these properties and activities is considered non-comparable NOI.
Comparable NOI is an operating statistic defined as NOI from stabilized properties operated in all periods presented. We believe comparable NOI is useful because it measures the performance of the same properties on a period-to-period basis and is used to assess operating performance and resource allocation of the operating properties. While property dispositions, acquisitions or other factors impact net earnings in the short term, we believe comparable NOI presents a consistent view of the overall performance of our operating portfolio from period to period. A reconciliation of earnings (loss) before income taxes, the most comparable financial measure calculated in accordance with GAAP, to NOI, a reconciliation of NOI to earnings (loss) before income taxes for each operating segment and a reconciliation from NOI to comparable NOI are included in this supplemental package.
Comparable NOI margin information is an operating statistic derived from comparable NOI as a percentage of revenues associated with comparable NOI. We believe comparable NOI margins are useful in evaluating revenue enhancements and expense management on our comparable properties while also assessing the execution of our business strategies.
5
Forest City Realty Trust, Inc. and Subsidiaries
Supplemental Financial and Operating Information
Corporate Headquarters
Forest City Realty Trust, Inc.
Terminal Tower
50 Public Square, Suite 1100
Cleveland, Ohio 44113
Annual Report on Form 10-K
A copy of the Annual Report on Form 10-K as filed with the Securities and Exchange Commission (“SEC”) for the year ended December 31, 2016, can be found on our website under SEC Filings or may be obtained without charge upon written request to:
Jeffrey B. Linton
Senior Vice President - Corporate Communication
JeffLinton@forestcity.net
Website
www.forestcity.net
The information contained on this website is not incorporated herein by reference and does not constitute a part of this supplemental package.
Investor Relations
Michael E. Lonsway
Executive Vice President - Planning
MikeLonsway@forestcity.net
Investor Presentations
We periodically post updated investor presentations on the Investors page of our website at www.forestcity.net. It is possible the periodic updates may include information deemed to be material. Therefore, we encourage investors, the media, and other interested parties to review the Investors page of our website at www.forestcity.net for the most recent investor presentation.
Transfer Agent and Registrar
Wells Fargo
Shareowner Services
P.O. Box 64854
St. Paul, MN 55164-9440
(800) 468-9716
www.shareowneronline.com
NYSE Listings
FCEA - Class A Common Stock ($.01 par value)
Dividend Reinvestment and Stock Purchase Plan
We offer our shareholders the opportunity to purchase additional shares of common stock through the Forest City Realty Trust, Inc. Dividend Reinvestment and Stock Purchase Plan (the “Plan”). You may obtain a copy of the Plan prospectus and an enrollment card by contacting Wells Fargo Shareowner Services at (800) 468-9716 or by visiting www.shareowneronline.com.
6
Forest City Realty Trust, Inc. and Subsidiaries
Selected Financial Information
Consolidated Balance Sheets – (Unaudited)
June 30, 2017 | December 31, 2016 | |||||
(in thousands) | ||||||
Assets | ||||||
Real Estate | ||||||
Completed rental properties | ||||||
Office | $ | 3,520,419 | $ | 3,603,480 | ||
Apartments | 2,607,336 | 2,586,720 | ||||
Retail | 290,583 | 288,582 | ||||
Total Operations | 6,418,338 | 6,478,782 | ||||
Recently-Opened Properties/Redevelopment | 832,246 | 622,939 | ||||
Corporate | 10,990 | 10,626 | ||||
Total completed rental properties | 7,261,574 | 7,112,347 | ||||
Projects under construction | ||||||
Office | 133,823 | 110,526 | ||||
Apartments | 297,055 | 399,332 | ||||
Retail | 9,103 | 6,457 | ||||
Total projects under construction | 439,981 | 516,315 | ||||
Projects under development | ||||||
Operating properties | 1,485 | 1,637 | ||||
Office | 109,040 | 103,598 | ||||
Apartments | 98,125 | 113,430 | ||||
Retail | — | — | ||||
Total projects under development | 208,650 | 218,665 | ||||
Total projects under construction and development | 648,631 | 734,980 | ||||
Land inventory | 73,555 | 68,238 | ||||
Total Real Estate | 7,983,760 | 7,915,565 | ||||
Less accumulated depreciation | (1,506,397 | ) | (1,442,006 | ) | ||
Real Estate, net | 6,477,363 | 6,473,559 | ||||
Cash and equivalents | 172,339 | 174,619 | ||||
Restricted cash | 143,237 | 149,300 | ||||
Accounts receivable, net | 210,215 | 208,563 | ||||
Notes receivable | 418,230 | 383,163 | ||||
Investments in and advances to unconsolidated entities | 543,167 | 564,779 | ||||
Lease procurement costs, net | 62,627 | 66,065 | ||||
Prepaid expenses and other deferred costs, net | 76,036 | 73,987 | ||||
Intangible assets, net | 118,095 | 134,562 | ||||
Total Assets | $ | 8,221,309 | $ | 8,228,597 | ||
7
Forest City Realty Trust, Inc. and Subsidiaries
Selected Financial Information
Consolidated Balance Sheets – (Unaudited)
June 30, 2017 | December 31, 2016 | |||||
(in thousands) | ||||||
Liabilities and Equity | ||||||
Liabilities | ||||||
Nonrecourse mortgage debt and notes payable, net | ||||||
Completed rental properties | ||||||
Office | $ | 1,092,909 | $ | 1,152,425 | ||
Apartments | 1,401,624 | 1,396,088 | ||||
Retail | 139,124 | 141,160 | ||||
Total Operations | 2,633,657 | 2,689,673 | ||||
Recently-Opened Properties/Redevelopment | 353,690 | 292,083 | ||||
Total completed rental properties | 2,987,347 | 2,981,756 | ||||
Projects under construction | ||||||
Office | 57,379 | 37,660 | ||||
Apartments | 82,938 | 69,996 | ||||
Retail | — | — | ||||
Total projects under construction | 140,317 | 107,656 | ||||
Projects under development | ||||||
Operating properties | — | — | ||||
Office | — | — | ||||
Apartments | 30,616 | 31,421 | ||||
Retail | — | — | ||||
Total projects under development | 30,616 | 31,421 | ||||
Total projects under construction and development | 170,933 | 139,077 | ||||
Land inventory | — | — | ||||
Nonrecourse mortgage debt and notes payable, net | 3,158,280 | 3,120,833 | ||||
Revolving credit facility | — | — | ||||
Term loan, net | 333,468 | 333,268 | ||||
Convertible senior debt, net | 112,410 | 112,181 | ||||
Construction payables | 105,354 | 137,738 | ||||
Operating accounts payable and accrued expenses | 531,730 | 562,784 | ||||
Accrued derivative liability | 19,721 | 26,202 | ||||
Total Accounts payable, accrued expenses and other liabilities | 656,805 | 726,724 | ||||
Cash distributions and losses in excess of investments in unconsolidated entities | 123,807 | 150,592 | ||||
Total Liabilities | 4,384,770 | 4,443,598 | ||||
Equity | ||||||
Stockholders’ Equity | ||||||
Stockholders’ equity before accumulated other comprehensive loss | 3,368,054 | 3,298,248 | ||||
Accumulated other comprehensive loss | (11,867 | ) | (14,410 | ) | ||
Total Stockholders’ Equity | 3,356,187 | 3,283,838 | ||||
Noncontrolling interest | 480,352 | 501,161 | ||||
Total Equity | 3,836,539 | 3,784,999 | ||||
Total Liabilities and Equity | $ | 8,221,309 | $ | 8,228,597 | ||
8
Forest City Realty Trust, Inc. and Subsidiaries
Selected Financial Information
Consolidated Statements of Operations – (Unaudited)
Three Months Ended June 30, | Six Months Ended June 30, | ||||||||||||
2017 | 2016 | 2017 | 2016 | ||||||||||
(in thousands) | |||||||||||||
Revenues | |||||||||||||
Rental | $ | 165,964 | $ | 162,546 | $ | 328,413 | $ | 325,729 | |||||
Tenant recoveries | 28,132 | 28,644 | 54,064 | 60,234 | |||||||||
Service and management fees | 11,363 | 12,511 | 21,490 | 21,193 | |||||||||
Parking and other | 13,221 | 14,041 | 24,959 | 29,398 | |||||||||
Arena | — | — | — | — | |||||||||
Land sales | 17,762 | 8,221 | 23,522 | 12,154 | |||||||||
Subsidized Senior Housing | — | — | — | — | |||||||||
Military Housing | — | — | — | 3,518 | |||||||||
Total revenues | 236,442 | 225,963 | 452,448 | 452,226 | |||||||||
Expenses | |||||||||||||
Property operating and management | 78,158 | 81,435 | 156,951 | 171,355 | |||||||||
Real estate taxes | 21,357 | 21,600 | 42,557 | 46,066 | |||||||||
Ground rent | 3,766 | 3,447 | 7,654 | 7,086 | |||||||||
Arena operating | — | — | — | — | |||||||||
Cost of land sales | 7,694 | 1,702 | 9,695 | 2,042 | |||||||||
Subsidized Senior Housing operating | — | — | — | — | |||||||||
Military Housing operating | — | — | — | 2,730 | |||||||||
Corporate general and administrative | 14,018 | 16,750 | 29,601 | 33,862 | |||||||||
Organizational transformation and termination benefits | 6,863 | 5,681 | 11,388 | 14,401 | |||||||||
131,856 | 130,615 | 257,846 | 277,542 | ||||||||||
Depreciation and amortization | 65,747 | 62,418 | 129,302 | 125,629 | |||||||||
Write-offs of abandoned development projects and demolition costs | 1,596 | — | 1,596 | — | |||||||||
Impairment of real estate | — | 2,100 | — | 14,564 | |||||||||
Total expenses | 199,199 | 195,133 | 388,744 | 417,735 | |||||||||
Operating Income | 37,243 | 30,830 | 63,704 | 34,491 | |||||||||
Interest and other income | 9,896 | 11,031 | 20,168 | 20,685 | |||||||||
Net gain on disposition of interest in unconsolidated entities | — | — | — | — | |||||||||
Interest expense | (28,901 | ) | (32,435 | ) | (56,876 | ) | (67,070 | ) | |||||
Amortization of mortgage procurement costs | (1,507 | ) | (1,416 | ) | (2,729 | ) | (3,081 | ) | |||||
Loss on extinguishment of debt | — | — | (2,843 | ) | (29,084 | ) | |||||||
Earnings (loss) before income taxes and earnings from unconsolidated entities | 16,731 | 8,010 | 21,424 | (44,059 | ) | ||||||||
Equity in earnings | 6,261 | 8,551 | 15,539 | 19,087 | |||||||||
Net gain on disposition of interest in unconsolidated entities | 35,253 | 12,613 | 52,954 | 12,613 | |||||||||
41,514 | 21,164 | 68,493 | 31,700 | ||||||||||
Earnings (loss) before income taxes | 58,245 | 29,174 | 89,917 | (12,359 | ) | ||||||||
Income tax expense (benefit) of taxable REIT subsidiaries | |||||||||||||
Current | 4,462 | 327 | 4,513 | 1,249 | |||||||||
Deferred | — | (135 | ) | — | 393 | ||||||||
4,462 | 192 | 4,513 | 1,642 | ||||||||||
Earnings (loss) before gain on disposal of real estate | 53,783 | 28,982 | 85,404 | (14,001 | ) | ||||||||
Net gain (loss) on disposition of interest in development project | — | — | (113 | ) | 136,117 | ||||||||
Net gain (loss) on disposition of full or partial interests in rental properties, net of tax | 4,526 | (623 | ) | 13,829 | 89,018 | ||||||||
Earnings from continuing operations | 58,309 | 28,359 | 99,120 | 211,134 | |||||||||
Discontinued operations, net of tax | |||||||||||||
Operating loss from rental properties | — | — | — | (1,126 | ) | ||||||||
Gain on disposition of disposal group | — | — | — | 64,553 | |||||||||
Equity in earnings (loss) | — | — | — | (822 | ) | ||||||||
— | — | — | 62,605 | ||||||||||
Net earnings | 58,309 | 28,359 | 99,120 | 273,739 | |||||||||
Noncontrolling interests, gross of tax | |||||||||||||
Earnings from continuing operations attributable to noncontrolling interests | (1,556 | ) | (1,760 | ) | (1,450 | ) | (3,881 | ) | |||||
Loss from discontinued operations attributable to noncontrolling interests | — | — | — | 776 | |||||||||
(1,556 | ) | (1,760 | ) | (1,450 | ) | (3,105 | ) | ||||||
Net earnings attributable to Forest City Realty Trust, Inc. | $ | 56,753 | $ | 26,599 | $ | 97,670 | $ | 270,634 | |||||
9
(THIS PAGE INTENTIONALLY LEFT BLANK)
10
Forest City Realty Trust, Inc. and Subsidiaries
Selected Financial Information
Net Asset Value Components – June 30, 2017
Completed Rental Properties - Operations | ||||||||||||||||||||
Q2 2017 | Net Stabilized | Stabilized | Annualized | Nonrecourse | ||||||||||||||||
(Dollars in millions) | NOI (1) | Adjustments (2) | NOI | Stabilized NOI (3) | Debt, net (4) | |||||||||||||||
Operations | A | B | =A+B | |||||||||||||||||
Office Real Estate | ||||||||||||||||||||
Life Science | ||||||||||||||||||||
Cambridge | $ | 21.9 | $ | (1.7 | ) | $ | 20.2 | $ | 80.8 | $ | (505.1 | ) | ||||||||
Other Life Science | 3.7 | (0.1 | ) | 3.6 | 14.4 | (101.4 | ) | |||||||||||||
New York | ||||||||||||||||||||
Manhattan | 14.6 | (0.7 | ) | 13.9 | 55.6 | — | ||||||||||||||
Brooklyn | 24.7 | — | 24.7 | 98.8 | (408.0 | ) | ||||||||||||||
Other Office | 7.2 | — | — | 7.2 | 28.8 | (217.1 | ) | |||||||||||||
Subtotal Office | $ | 72.1 | $ | (2.5 | ) | $ | 69.6 | $ | 278.4 | $ | (1,231.6 | ) | ||||||||
Apartment Real Estate | ||||||||||||||||||||
Apartments, Core Markets | $ | 35.7 | — | $ | — | $ | 35.7 | $ | 142.8 | $ | (1,376.1 | ) | ||||||||
Apartments, Non-Core Markets | 11.9 | — | 11.9 | 47.6 | (327.9 | ) | ||||||||||||||
Subtotal Apartment Product Type | $ | 47.6 | $ | — | $ | 47.6 | $ | 190.4 | $ | (1,704.0 | ) | |||||||||
Federally Assisted Housing (5) | 4.0 | (2.3 | ) | 1.7 | 6.8 | (67.3 | ) | |||||||||||||
Subtotal Apartments | $ | 51.6 | $ | (2.3 | ) | $ | 49.3 | $ | 197.2 | $ | (1,771.3 | ) | ||||||||
Retail Real Estate | ||||||||||||||||||||
Regional Malls | $ | 26.3 | $ | (2.1 | ) | $ | 24.2 | $ | 96.8 | $ | (930.5 | ) | ||||||||
Specialty Retail Centers | 12.7 | — | 0.1 | 12.8 | 51.2 | (472.2 | ) | |||||||||||||
Subtotal Retail | $ | 39.0 | $ | (2.0 | ) | $ | 37.0 | $ | 148.0 | $ | (1,402.7 | ) | ||||||||
Subtotal | $ | 162.7 | $ | (6.8 | ) | $ | 155.9 | $ | 623.6 | $ | (4,405.6 | ) | ||||||||
Straight-line rent adjustments | 3.8 | — | 3.8 | 15.2 | — | |||||||||||||||
Other Operations | (1.5 | ) | — | (1.5 | ) | (6.0 | ) | — | ||||||||||||
Total Operations | $ | 165.0 | $ | (6.8 | ) | $ | 158.2 | $ | 632.8 | $ | (4,405.6 | ) | ||||||||
Development | ||||||||||||||||||||
Recently-Opened Properties/Redevelopment | $ | 0.7 | $ | 5.7 | $ | 6.4 | $ | 25.6 | $ | (129.8 | ) | |||||||||
Straight-line rent adjustments | 0.1 | — | 0.1 | 0.4 | — | |||||||||||||||
Other Development | (7.1 | ) | — | — | (7.1 | ) | (28.4 | ) | — | |||||||||||
Total Development | $ | (6.3 | ) | $ | 5.7 | $ | (0.6 | ) | $ | (2.4 | ) | $ | (129.8 | ) | ||||||
Book Value (4) | ||||||||||||||||||||
Projects under construction (6) | $ | 519.8 | $ | (211.7 | ) | |||||||||||||||
Projects under development | $ | 283.5 | $ | (187.4 | ) | |||||||||||||||
Land inventory: | ||||||||||||||||||||
Stapleton | $ | 49.6 | $ | — | ||||||||||||||||
Commercial Outlots | $ | 19.7 | $ | — | ||||||||||||||||
Other Tangible Assets | ||||||||||||||||||||
Cash and equivalents | $ | 223.1 | ||||||||||||||||||
Restricted cash | $ | 227.0 | ||||||||||||||||||
Accounts receivable, net (7) | $ | 257.1 | ||||||||||||||||||
Notes receivable | $ | 446.2 | ||||||||||||||||||
Net investments and advances to unconsolidated entities | $ | 41.7 | ||||||||||||||||||
Prepaid expenses and other deferred costs, net | $ | 87.9 | ||||||||||||||||||
Recourse Debt and Other Liabilities | ||||||||||||||||||||
Revolving credit facility | $ | — | ||||||||||||||||||
Term loan, net | $ | (333.5 | ) | |||||||||||||||||
Convertible senior debt, net | $ | (112.4 | ) | |||||||||||||||||
Less: convertible debt | $ | 112.4 | ||||||||||||||||||
Construction payables | $ | (110.1 | ) | |||||||||||||||||
Operating accounts payable and accrued expenses (8) | $ | (657.9 | ) | |||||||||||||||||
Share Data (in millions) | ||||||||||||||||||||
Diluted weighted average number of shares for the three months ended June 30, 2017 | 268.8 | |||||||||||||||||||
11
Forest City Realty Trust, Inc. and Subsidiaries
Selected Financial Information
Net Asset Value Components – June 30, 2017 (continued)
(1) | Q2 2017 Earnings Before Income Taxes is reconciled to NOI for the three months ended June 30, 2017 in the Supplemental Operating Information section of this supplemental package. |
(2) | The net stabilized adjustments column represents adjustments assumed to arrive at an estimated annualized stabilized NOI. We include stabilization adjustments to the Q2 2017 NOI as follows: |
a) | We have removed Q2 2017 lease termination income from our Cambridge Life Science and Manhattan office portfolios. |
b) | Due to quarterly fluctuations of NOI as a result of distribution restrictions from our limited-distribution federally assisted housing properties, we have included a stabilization adjustment to the Q2 2017 NOI to arrive at our estimate of stabilized NOI. Our estimate of stabilized NOI is based on the 2016 annual NOI of $6.8 million, which excludes NOI related to 22 properties in this portfolio sold during the six months ended June 30, 2017. |
c) | Partial period NOI for recently sold properties has been removed in the Operations Segments. |
d) | Due to the planned transfer of Boulevard Mall (Regional Malls) to the lender in a deed-in-lieu transaction during 2017, we have removed NOI and nonrecourse debt, net, related to this property. |
e) | For recently-opened properties currently in initial lease-up periods included in the Development Segment, NOI is reflected at 5% of the company ownership cost. This assumption does not reflect our anticipated NOI, but rather is used in order to establish a hypothetical basis for an estimated valuation of leased-up properties. The following properties are currently in their initial lease-up periods: |
Cost at 100% | Cost at Company Share | Lease Commitment % as of | |||||
Property | July 23, 2017 | ||||||
(in millions) | |||||||
Office: | |||||||
1812 Ashland Ave (Life Science) | $ | 61.2 | $ | 61.2 | 75% | ||
Total Office | $ | 61.2 | $ | 61.2 | |||
Apartments: | |||||||
535 Carlton (Core Market) | $ | 168.1 | $ | 41.7 | 36% | ||
Eliot on 4th (Core Market) | $ | 143.7 | $ | 44.2 | 39% | ||
NorthxNorthwest (Core Market) | $ | 115.0 | $ | 33.5 | 24% | ||
461 Dean Street (Core Market) | $ | 195.6 | $ | 195.6 | 77% | ||
The Bixby (Core Market) | $ | 59.2 | $ | 11.8 | 99% | ||
Blossom Plaza (Core Market) | $ | 100.6 | $ | 29.9 | 95% | ||
The Yards - Arris (Core Market) | $ | 143.2 | $ | 42.9 | 94% | ||
Total Apartments | $ | 925.4 | $ | 399.6 | |||
Grand Total | $ | 986.6 | $ | 460.8 | |||
NOI attributable to Kapolei Lofts, an apartment community on land in which we lease, is not included in NOI from lease-up properties. We consolidate the land lessor, who is entitled to a preferred return that currently exceeds anticipated operating cash flow of the project, and therefore, this project is reflected at 0% for company-share purposes. In accordance with the waterfall provisions of the distribution Agreement, we expect to share in the net proceeds upon a sale of the project, which is not currently reflected on the NAV component schedule.
f) | Due to the redevelopment of Ballston Quarter (Development Segment; Recently-Opened Properties/Redevelopment), we have included a stabilization adjustment to the Q2 2017 NOI to arrive at $2.6 million, our estimate of annualized stabilized NOI prior to the commencement of our current redevelopment. |
The net stabilized adjustments are not comparable to any GAAP measure and therefore do not have a reconciliation to the nearest comparable GAAP measure.
(3) | Company ownership annualized stabilized NOI is calculated by taking the Q2 2017 stabilized NOI times a multiple of four. |
(4) | Amounts represent the company’s share of each respective balance sheet line item as of June 30, 2017 and may be calculated using the financial information contained in the Appendix of this supplemental package. Due to the planned transfer of Boulevard Mall to the lender, we have removed nonrecourse debt, net, of $91.1 million related to this property. |
(5) | Represents the remaining 25 federally assisted housing apartment communities. We recently signed a master purchase and sale agreement to dispose of this portfolio and expect to receive net proceeds of approximately $65 million. As of June 30, 2017, 22 properties have closed, representing $53.5 million in net proceeds. |
(6) | We have removed $23.0 million of assets from projects under construction, which represents the costs on the balance sheet associated with the ongoing redevelopment of Ballston Quarter. NOI for this is stabilized under Recently-Opened Properties/Redevelopment. |
(7) | Includes $149.9 million of straight-line rent receivable (net of $9.1 million of allowance for doubtful accounts). |
(8) | Includes $62.2 million of straight-line rent payable. |
12
Forest City Realty Trust, Inc. and Subsidiaries
Selected Financial Information
Net Asset Value Components - Stabilized NOI - Q1 2017 vs. Q2 2017
The following represents the quarterly change in stabilized NOI used to estimate NAV, as a result of recent property openings and sales, as well as other portfolio changes. GAAP reconciliations for the beginning period can be found in prior supplemental packages furnished with the SEC and are available on our website at www.forestcity.net.
Net Asset Value Components - Stabilized NOI | |||||||||||||||||||
Stabilized Adjustments | |||||||||||||||||||
Q1 2017 | Property | Property | Portfolio | Q2 2017 | |||||||||||||||
(Dollars in millions) | Stabilized NOI | Openings | Sales | NOI Changes | Stabilized NOI | ||||||||||||||
Operations | |||||||||||||||||||
Office Real Estate | |||||||||||||||||||
Life Science | |||||||||||||||||||
Cambridge | $ | 20.1 | $ | — | $ | — | $ | 0.1 | $ | 20.2 | |||||||||
Other Life Science | 3.6 | — | — | — | 3.6 | ||||||||||||||
New York | |||||||||||||||||||
Manhattan | 14.1 | — | — | (0.2 | ) | 13.9 | |||||||||||||
Brooklyn | 23.4 | — | — | 1.3 | 24.7 | ||||||||||||||
Other Office | 7.0 | — | — | 0.2 | 7.2 | ||||||||||||||
Subtotal Office | $ | 68.2 | $ | — | $ | — | $ | 1.4 | $ | 69.6 | |||||||||
Apartment Real Estate | |||||||||||||||||||
Apartments, Core Markets | $ | 34.4 | $ | — | $ | — | $ | 1.3 | $ | 35.7 | |||||||||
Apartments, Non-Core Markets | 11.0 | — | — | 0.9 | 11.9 | ||||||||||||||
Subtotal Apartment Product Type | $ | 45.4 | $ | — | $ | — | $ | 2.2 | $ | 47.6 | |||||||||
Federally Assisted Housing (5) | 3.9 | — | (2.2 | ) | — | 1.7 | |||||||||||||
Subtotal Apartments | $ | 49.3 | $ | — | $ | (2.2 | ) | $ | 2.2 | $ | 49.3 | ||||||||
Retail Real Estate | |||||||||||||||||||
Regional Malls | $ | 25.7 | $ | — | $ | — | $ | (1.5 | ) | $ | 24.2 | ||||||||
Specialty Retail Centers | 12.3 | — | 0.1 | 0.4 | 12.8 | ||||||||||||||
Subtotal Retail | $ | 38.0 | $ | — | $ | 0.1 | $ | (1.1 | ) | $ | 37.0 | ||||||||
Subtotal | $ | 155.5 | $ | — | $ | (2.1 | ) | $ | 2.5 | $ | 155.9 | ||||||||
Straight-line rent adjustments | 2.8 | — | — | 1.0 | 3.8 | ||||||||||||||
Other Operations | (0.4 | ) | — | — | (1.1 | ) | (1.5 | ) | |||||||||||
Total Operations | $ | 157.9 | $ | — | $ | (2.1 | ) | $ | 2.4 | $ | 158.2 | ||||||||
Development Pipeline | |||||||||||||||||||
Development | |||||||||||||||||||
Recently-Opened Properties/Redevelopment | $ | 6.3 | $ | — | $ | — | $ | 0.1 | $ | 6.4 | |||||||||
Straight-line rent adjustments | 0.1 | — | — | — | 0.1 | ||||||||||||||
Other Development | (6.9 | ) | — | — | (0.2 | ) | (7.1 | ) | |||||||||||
Total Development | $ | (0.5 | ) | $ | — | $ | — | $ | (0.1 | ) | $ | (0.6 | ) | ||||||
Grand Total | $ | 157.4 | $ | — | $ | (2.1 | ) | $ | 2.3 | $ | 157.6 | ||||||||
13
(THIS PAGE INTENTIONALLY LEFT BLANK)
14
Forest City Realty Trust, Inc. and Subsidiaries
Supplemental Operating Information
Occupancy Data
Office and retail segment occupancy data represents leased occupancy at the end of the quarter. Leased occupancy percentage is calculated by dividing the sum of the total tenant occupied space under the lease and vacant space under the lease by gross leasable area (“GLA”). Occupancy data includes leases with original terms of one year or less.
Leased Occupancy | ||
As of June 30, | ||
Office | 2017 | 2016 |
Comparable | 97.0% | 97.8% |
Total | 94.5% | 95.4% |
Retail | ||
Comparable | 93.5% | 94.2% |
Total | 93.4% | 94.3% |
Apartment segment occupancy data represents economic occupancy, which is calculated by dividing the period-to-date gross potential rent less vacancy by gross potential rent. Apartment occupancy data excludes limited-distribution subsidized senior housing units.
Economic Occupancy | ||
Six Months Ended June 30, | ||
Apartments | 2017 | 2016 |
Comparable | 94.1% | 94.5% |
Total | 94.1% | 94.5% |
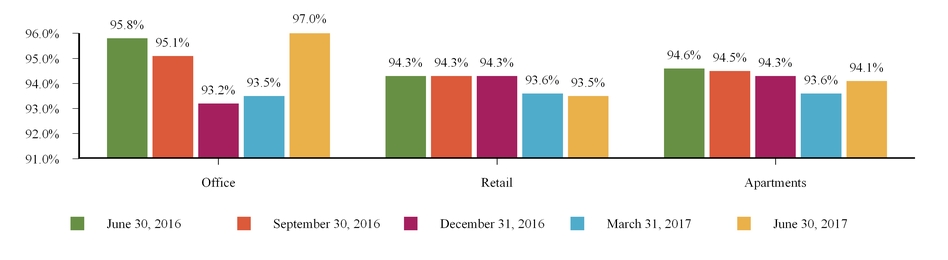
The graph below provides comparable leased and economic occupancy data as reported in previous quarters. Prior period amounts may differ from above since the properties qualifying as comparable change from period to period.
Comparable Occupancy Percentage Trend
15
Forest City Realty Trust, Inc. and Subsidiaries
Supplemental Operating Information
Retail Sales Data
The following provides retail sales data for small shop inline tenants at our regional malls. We believe this data allows investors to better understand the productivity of our small shop inline tenants.
The graph below represents regional mall sales for tenants that were open and operating for the duration of each rolling 12-month period presented. Those tenants that have begun and/or ceased operations in the rolling 12-month periods shown are not included.
FCE Regional Mall Sales per Square Foot (1) (2)
Rolling 12-month basis for periods presented
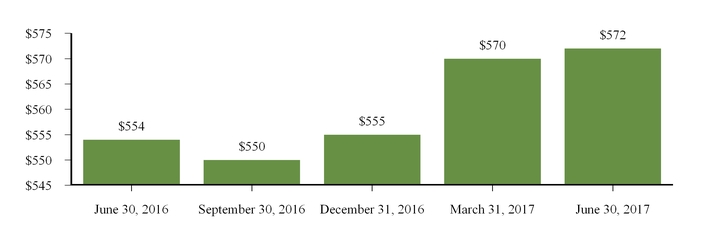
(1) | All sales data is derived from schedules provided by our tenants and is not subject to the same internal control and verification procedures applied to other data supplied in this supplemental package. |
(2) | The increase for the rolling 12-months ended March 31, 2017 over the prior periods is primarily due to the exclusion of sales data at Boulevard Mall, which is planned to transfer to the lender in a deed-in-lieu transaction during 2017. With the comparable exclusion of Boulevard Mall sales data, sales per square foot for the rolling 12-months ended June 30, 2016, September 30, 2016 and December 31, 2016 would have been $566, $561 and $567, respectively. |
16
Forest City Realty Trust, Inc. and Subsidiaries
Supplemental Operating Information
Leasing Summary
Office Buildings
The following table represents those new leases and GLA signed on the same space in which there was a former tenant and existing tenant renewals along with all other new leases signed within the rolling 12-month period.
Same-Space Leases | Other New Leases | ||||||||||||||||||||||
Quarter | Number of Leases Signed | GLA Signed | Contractual Rent Per SF (1) | Expired Rent Per SF (1) | Cash Basis % Change over Prior Rent | Number of Leases Signed | GLA Signed | Contractual Rent Per SF (1) | Total GLA Signed | ||||||||||||||
Q3 2016 | 9 | 79,348 | $ | 28.02 | $ | 26.52 | 5.7 | % | 5 | 8,227 | $ | 22.71 | 87,575 | ||||||||||
Q4 2016 | 12 | 88,740 | $ | 20.36 | $ | 21.46 | (5.1 | )% | 3 | 3,549 | $ | 25.27 | 92,289 | ||||||||||
Q1 2017 | 15 | 148,260 | $ | 62.17 | $ | 51.85 | 19.9 | % | 5 | 13,128 | $ | 25.04 | 161,388 | ||||||||||
Q2 2017 | 20 | 290,759 | $ | 64.60 | $ | 57.69 | 12.0 | % | 5 | 27,326 | $ | 42.07 | 318,085 | ||||||||||
Total | 56 | 607,107 | $ | 52.76 | $ | 46.89 | 12.5 | % | 18 | 52,230 | $ | 33.60 | 659,337 | ||||||||||
Retail Centers
The following tables represent those new leases and GLA signed and rent per square foot (“SF”) on the same space in which there was a former tenant and existing tenant renewals.
Regional Malls
Quarter | Number of Leases Signed | GLA Signed | Contractual Rent Per SF (1) | Expired Rent Per SF (1) | Cash Basis % Change over Prior Rent | ||||||||||||
Q3 2016 | 26 | 79,205 | $ | 63.15 | $ | 56.31 | 12.1 | % | |||||||||
Q4 2016 | 14 | 53,130 | $ | 153.75 | $ | 137.47 | 11.8 | % | |||||||||
Q1 2017 | 12 | 36,475 | $ | 140.81 | $ | 110.97 | 26.9 | % | |||||||||
Q2 2017 | 22 | 70,685 | $ | 69.77 | $ | 58.09 | 20.1 | % | |||||||||
Total | 74 | 239,495 | $ | 97.03 | $ | 83.16 | 16.7 | % | |||||||||
Specialty Retail Centers
Quarter | Number of Leases Signed | GLA Signed | Contractual Rent Per SF (1) | Expired Rent Per SF (1) | Cash Basis % Change over Prior Rent | ||||||||||||
Q3 2016 | 2 | 5,131 | $ | 82.06 | $ | 78.17 | 5.0 | % | |||||||||
Q4 2016 | — | — | $ | — | $ | — | 0.0 | % | |||||||||
Q1 2017 | — | — | $ | — | $ | — | 0.0 | % | |||||||||
Q2 2017 | 1 | 7,463 | $ | 45.00 | $ | 58.52 | (23.1 | )% | |||||||||
Total | 3 | 12,594 | $ | 60.10 | $ | 66.53 | (9.7 | )% | |||||||||
(1) | Office and Retail contractual rent per square foot includes base rent and fixed additional charges for common area maintenance and real estate taxes as of rental commencement. Retail contractual rent per square foot also includes fixed additional marketing/promotional charges. For all expiring leases, contractual rent per square foot includes any applicable escalations. |
17
Forest City Realty Trust, Inc. and Subsidiaries
Supplemental Operating Information
Apartment Communities
The following tables present leasing information of our apartment communities. Prior period amounts may differ from data as reported in previous quarters since the properties that qualify as comparable change from period to period.
Quarterly Comparison
Monthly Average Apartment Rental Rates (2) | Economic Apartment Occupancy | |||||||||||||||||
Comparable Apartment | Leasable Units | Three Months Ended June 30, | Three Months Ended June 30, | |||||||||||||||
Communities (1) | at Company % (3) | 2017 | 2016 | % Change | 2017 | 2016 | % Change | |||||||||||
Core Markets | 8,812 | $ | 2,021 | $ | 1,999 | 1.1 | % | 95.0 | % | 95.3 | % | (0.3 | )% | |||||
Non-Core Markets | 7,954 | $ | 999 | $ | 979 | 2.0 | % | 93.5 | % | 93.4 | % | 0.1 | % | |||||
Total Comparable Apartments | 16,766 | $ | 1,536 | $ | 1,514 | 1.5 | % | 94.6 | % | 94.7 | % | (0.1 | )% | |||||
Year-to-Date Comparison
Monthly Average Apartment Rental Rates (2) | Economic Apartment Occupancy | |||||||||||||||||
Comparable Apartment | Leasable Units | Six Months Ended June 30, | Six Months Ended June 30, | |||||||||||||||
Communities (1) | at Company % (3) | 2017 | 2016 | % Change | 2017 | 2016 | % Change | |||||||||||
Core Markets | 8,812 | $ | 2,015 | $ | 1,992 | 1.2 | % | 94.7 | % | 95.2 | % | (0.5 | )% | |||||
Non-Core Markets | 7,954 | $ | 997 | $ | 976 | 2.2 | % | 92.6 | % | 92.7 | % | (0.1 | )% | |||||
Total Comparable Apartments | 16,766 | $ | 1,531 | $ | 1,509 | 1.5 | % | 94.1 | % | 94.5 | % | (0.4 | )% | |||||
Sequential Comparison
Monthly Average Apartment Rental Rates (2) | Economic Apartment Occupancy | |||||||||||||||||
Three Months Ended | Three Months Ended | |||||||||||||||||
Comparable Apartment | Leasable Units | June 30, | March 31, | June 30, | March 31, | |||||||||||||
Communities (1) | at Company % (3) | 2017 | 2017 | % Change | 2017 | 2017 | % Change | |||||||||||
Core Markets | 8,812 | $ | 2,021 | $ | 2,008 | 0.6 | % | 95.0 | % | 94.4 | % | 0.6 | % | |||||
Non-Core Markets | 7,954 | $ | 999 | $ | 994 | 0.5 | % | 93.5 | % | 91.7 | % | 1.8 | % | |||||
Total Comparable Apartments | 16,766 | $ | 1,536 | $ | 1,526 | 0.7 | % | 94.6 | % | 93.6 | % | 1.0 | % | |||||
(1) | Includes stabilized apartment communities completely opened and operated in the periods presented. These apartment communities include units leased at affordable apartment rates which provide a discount from average market rental rates. For the three months ended June 30, 2017, 15.1% of leasable units in core markets and 4.9% of leasable units in non-core markets were affordable housing units. Excludes limited-distribution federally assisted housing units. |
(2) | Represents gross potential rent less concessions. |
(3) | Leasable units represent our share of comparable leasable units at the apartment community. |
18
(THIS PAGE INTENTIONALLY LEFT BLANK)
19
Forest City Realty Trust, Inc. and Subsidiaries
Supplemental Operating Information
Comparable NOI
Three Months Ended | Six Months Ended | ||||
June 30, 2017 | June 30, 2017 | ||||
Office | 1.4 | % | 0.5 | % | |
Apartments | 2.3 | % | 1.1 | % | |
Retail | (1.0 | )% | (1.2 | )% | |
Total | 1.1 | % | 0.3 | % | |
The tables below provide the percentage change of Comparable NOI as reported in previous quarters. GAAP reconciliations for previous periods can be found in prior supplemental packages furnished to the SEC and are available on our website at www.forestcity.net.
Quarterly Historical Trends | |||||||||||||||
Three Months Ended | |||||||||||||||
June 30, 2017 | March 31, 2017 | December 31, 2016 | September 30, 2016 | June 30, 2016 | |||||||||||
Office | 1.4 | % | (1.4 | )% | (0.4 | )% | (0.4 | )% | 6.4 | % | |||||
Apartments | 2.3 | % | (0.3 | )% | 1.1 | % | 1.8 | % | 3.0 | % | |||||
Retail | (1.0 | )% | (1.2 | )% | (2.9 | )% | 1.6 | % | 2.7 | % | |||||
Total | 1.1 | % | (1.0 | )% | (0.7 | )% | 0.8 | % | 4.3 | % | |||||
Annual Historical Trends | ||||||||||||
Years Ended | 11 Months Ended | |||||||||||
December 31, 2016 | December 31, 2015 | December 31, 2014 | December 31, 2013 | |||||||||
Office | 3.6 | % | 4.9 | % | 6.6 | % | (6.4 | )% | ||||
Apartments | 3.3 | % | 4.7 | % | 4.3 | % | 4.7 | % | ||||
Retail | 2.6 | % | 5.1 | % | 2.6 | % | 3.6 | % | ||||
Total | 3.2 | % | 4.9 | % | 4.8 | % | (0.2 | )% | ||||
The table below provides comparable NOI margins for our Operations segments. Properties included in prior periods may differ from the current year since properties qualifying as comparable change from period to period.
Year-to-Date and Annual Historical Trends - Margins on Comparable NOI | ||||||||||||
Six Months Ended | Years Ended | |||||||||||
June 30, 2017 | December 31, 2016 | December 31, 2015 | December 31, 2014 | |||||||||
Office Segment | ||||||||||||
Life Science | 68.5 | % | 60.1 | % | 58.7 | % | 58.5 | % | ||||
New York | ||||||||||||
Manhattan | 74.1 | % | 73.5 | % | 72.1 | % | 73.2 | % | ||||
Brooklyn | 53.1 | % | 53.0 | % | 51.4 | % | 50.5 | % | ||||
Other Office | 58.8 | % | 55.6 | % | 53.8 | % | 53.4 | % | ||||
Total Office Segment | 61.8 | % | 59.0 | % | 57.3 | % | 57.1 | % | ||||
Apartment Segment | ||||||||||||
Core Markets | 62.2 | % | 61.6 | % | 60.8 | % | 60.7 | % | ||||
Non-Core Markets | 50.0 | % | 48.9 | % | 46.3 | % | 47.0 | % | ||||
Total Apartment Segment | 58.6 | % | 57.8 | % | 56.7 | % | 56.7 | % | ||||
Retail Segment | ||||||||||||
Regional Malls | 59.4 | % | 60.2 | % | 58.5 | % | 61.1 | % | ||||
Specialty Retail Centers | 62.1 | % | 58.7 | % | 48.7 | % | 47.8 | % | ||||
Total Retail Segment | 60.3 | % | 59.7 | % | 55.0 | % | 55.6 | % | ||||
Total | 60.4 | % | 58.9 | % | 56.4 | % | 56.6 | % | ||||
20
Forest City Realty Trust, Inc. and Subsidiaries
Supplemental Operating Information
NOI (Non-GAAP) Detail (in thousands)
Three Months Ended June 30, | Six Months Ended June 30, | ||||||||||||||||
2017 | 2016 | % Change | 2017 | 2016 | % Change | ||||||||||||
Office Segment | |||||||||||||||||
Comparable NOI | 66,089 | 65,175 | 1.4 | % | 130,903 | 130,226 | 0.5 | % | |||||||||
Non-Comparable NOI | 6,043 | 5,015 | 11,175 | 9,903 | |||||||||||||
Office Product Type NOI | 72,132 | 70,190 | 142,078 | 140,129 | |||||||||||||
Other NOI (1) | 3,222 | 2,392 | 6,676 | 1,871 | |||||||||||||
Total Office Segment | 75,354 | 72,582 | 148,754 | 142,000 | |||||||||||||
Apartment Segment | |||||||||||||||||
Comparable NOI | 47,485 | 46,425 | 2.3 | % | 92,853 | 91,867 | 1.1 | % | |||||||||
Non-Comparable NOI | 87 | (183 | ) | 123 | (1,311 | ) | |||||||||||
Apartment Product Type NOI | 47,572 | 46,242 | 92,976 | 90,556 | |||||||||||||
Federally Assisted Housing | 3,996 | 4,791 | 8,281 | 10,339 | |||||||||||||
Other NOI (1) | (1,165 | ) | 877 | (1,897 | ) | (3,324 | ) | ||||||||||
Total Apartment Segment | 50,403 | 51,910 | 99,360 | 97,571 | |||||||||||||
Retail Segment | |||||||||||||||||
Comparable NOI | 36,577 | 36,930 | (1.0 | )% | 74,347 | 75,237 | (1.2 | )% | |||||||||
Non-Comparable NOI | 2,354 | 3,449 | 3,947 | 7,587 | |||||||||||||
Retail Product Type NOI | 38,931 | 40,379 | 78,294 | 82,824 | |||||||||||||
Other NOI (1) | 267 | 1,054 | (71 | ) | 2,064 | ||||||||||||
Total Retail Segment | 39,198 | 41,433 | 78,223 | 84,888 | |||||||||||||
Operations | |||||||||||||||||
Comparable NOI | 150,151 | 148,530 | 1.1 | % | 298,103 | 297,330 | 0.3 | % | |||||||||
Non-Comparable NOI (2) | 8,484 | 8,281 | 15,245 | 16,179 | |||||||||||||
Product Type NOI | 158,635 | 156,811 | 313,348 | 313,509 | |||||||||||||
Federally Assisted Housing | 3,996 | 4,791 | 8,281 | 10,339 | |||||||||||||
Other NOI (1): | |||||||||||||||||
Straight-line rent adjustments | 3,845 | 3,131 | 6,643 | 4,979 | |||||||||||||
Other Operations | (1,521 | ) | 1,192 | (1,935 | ) | (4,368 | ) | ||||||||||
2,324 | 4,323 | 4,708 | 611 | ||||||||||||||
Total Operations | 164,955 | 165,925 | 326,337 | 324,459 | |||||||||||||
Development Segment | |||||||||||||||||
Recently-Opened Properties/Redevelopment | 744 | 625 | (508 | ) | 1,254 | ||||||||||||
Other Development (3) | (6,982 | ) | (8,302 | ) | (13,859 | ) | (19,605 | ) | |||||||||
Total Development Segment | (6,238 | ) | (7,677 | ) | (14,367 | ) | (18,351 | ) | |||||||||
Other Segment | — | — | — | 2,502 | |||||||||||||
Grand Total | $ | 158,717 | $ | 158,248 | $ | 311,970 | $ | 308,610 | |||||||||
(1) | Includes straight-line rent adjustments, participation payments as a result of refinancing transactions on our properties and management and service company overhead, net of service fee revenues. |
(2) | Non-comparable NOI includes lease termination income of $3,461 and $5,601 for the three and six months ended June 30, 2017, compared with $379 and $713 for the three and six months ended June 30, 2016. |
(3) | Includes straight-line adjustments, non-capitalizable development overhead and other costs on our development projects. |
21
Forest City Realty Trust, Inc. and Subsidiaries
Supplemental Operating Information
Summary of Corporate General and Administrative and Other NOI (in thousands)
Three Months Ended June 30, | Six Months Ended June 30, | ||||||||||||||||||
2017 | 2016 | Change | 2017 | 2016 | Change | ||||||||||||||
Corporate General and Administrative | $ | (14,018 | ) | $ | (16,750 | ) | $ | 2,732 | $ | (29,601 | ) | $ | (33,862 | ) | $ | 4,261 | |||
Other Operations NOI | (1,521 | ) | 1,192 | (2,713 | ) | (1,935 | ) | (4,368 | ) | 2,433 | |||||||||
Other Development NOI | (6,982 | ) | (8,302 | ) | 1,320 | (13,859 | ) | (19,605 | ) | 5,746 | |||||||||
Total | $ | (22,521 | ) | $ | (23,860 | ) | $ | 1,339 | $ | (45,395 | ) | $ | (57,835 | ) | $ | 12,440 | |||
Year-to-Date and Annual Historical Trends
GAAP reconciliations for previous periods can be found in prior supplemental packages furnished to the SEC and are available on our website at www.forestcity.net.
Six Months Ended | Years Ended | |||||||||
June 30, 2017 | December 31, 2016 (1) | December 31, 2015 | ||||||||
(in thousands) | (in thousands) | |||||||||
Corporate General and Administrative | $ | (29,601 | ) | $ | (62,683 | ) | $ | (51,974 | ) | |
Other Operations NOI | (1,935 | ) | (629 | ) | (18,051 | ) | ||||
Other Development NOI | (13,859 | ) | (28,676 | ) | (41,499 | ) | ||||
Total | $ | (45,395 | ) | $ | (91,988 | ) | $ | (111,524 | ) | |
(1) | Includes development fee income of $6,500, primarily due to the achievement of certain milestones on the redevelopment project at Ballston Quarter. Exclusive of these development fees, total Corporate General and Administrative and Other NOI would have been $98,488 for the year ended December 31, 2016. |
22
Forest City Realty Trust, Inc. and Subsidiaries
Supplemental Operating Information
Comparable NOI Margin Bridges
To further explain our comparable NOI margins, we have included the following supplemental information relative to our Office and Apartment segment results for the six months ended June 30, 2017, which provides an additional operating metric which can be used to evaluate our NOI margins.
Office Segment
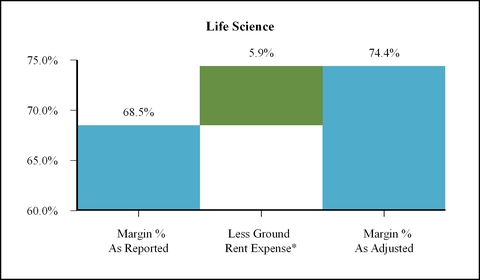
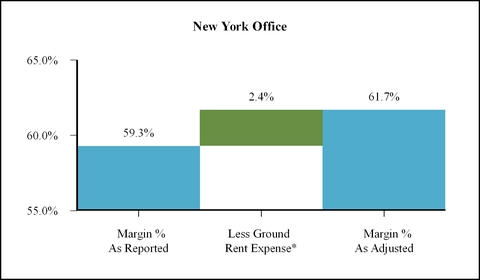
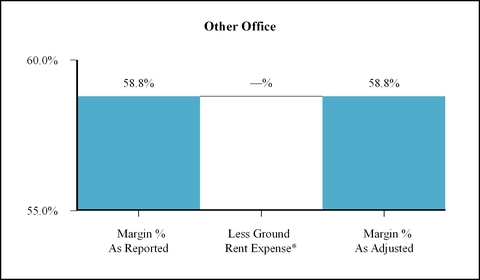
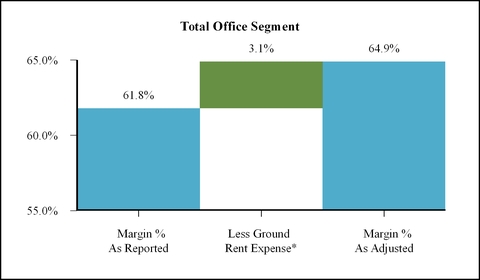
* Due to the size and nature of this expense, we have made an adjustment to remove ground rent expense on our comparable office properties.
23
Forest City Realty Trust, Inc. and Subsidiaries
Supplemental Operating Information
Comparable NOI Margin Bridges (continued)
Apartment Segment
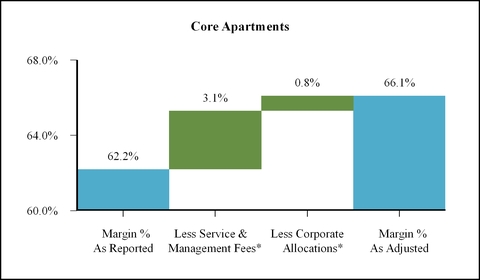
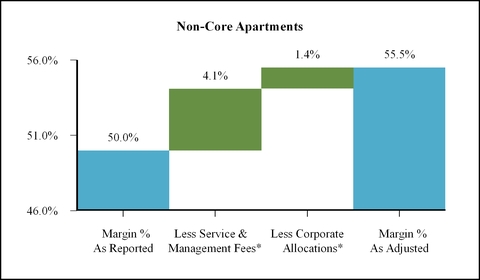
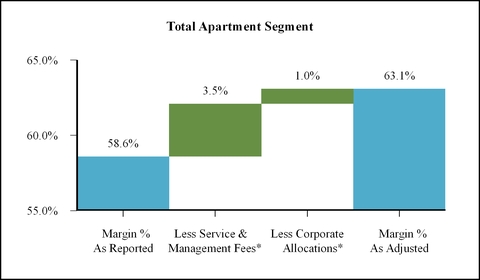
* The follow adjustments have been made exclude:
(1) | Comparable property-level service and management fee expense. |
(2) | Operating expense allocations from the Corporate segment. |
24
Forest City Realty Trust, Inc. and Subsidiaries
Supplemental Operating Information
Corporate General and Administrative Expenses
The following bridge illustrates Corporate Segment general and administrative expenses as a percentage of total revenues at the company’s share for the six months ended June 30, 2017.
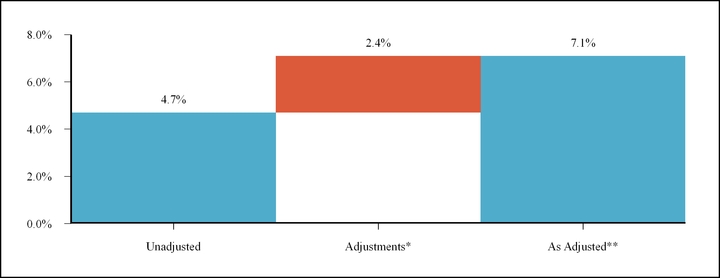
* | Adjustments include Apartment segment service and management fees of $5.4 million and corporate allocations of $1.6 million, respectively, which were removed from the Apartment segment comparable NOI margin bridges shown previously in this supplemental package. Additionally, $8.6 million of remaining unallocated Apartment segment service and management company expense (reflected in Apartment segment “other NOI” in the NOI Detail section of this supplemental package) is included in these adjustments. |
** | Expected range with margin enhancements is 5.75% - 6.50% by year-end 2018. |
25
(THIS PAGE INTENTIONALLY LEFT BLANK)
26
Forest City Realty Trust, Inc. and Subsidiaries
Supplemental Operating Information
NOI by Product Type
(dollars in thousands)
Six Months Ended June 30, 2017 | Six Months Ended June 30, 2016 | |
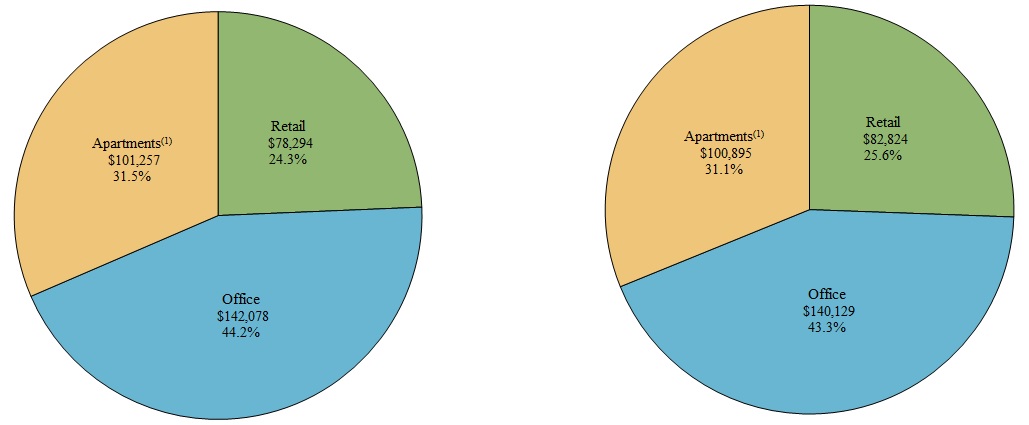
NOI by Product Type in Operations | $ | 321,629 | NOI by Product Type in Operations | $ | 323,848 | |||
Other NOI (2): | Other NOI (2): | |||||||
Straight-line rent adjustments | 6,643 | Straight-line rent adjustments | 4,979 | |||||
Other Operations | (1,935 | ) | Other Operations | (4,368 | ) | |||
4,708 | 611 | |||||||
Recently-Opened Properties/Redevelopment | (508 | ) | Recently-Opened Properties/Redevelopment | 1,254 | ||||
Development Segment (3) | (13,859 | ) | Development Segment (3) | (19,605 | ) | |||
Other Segment | — | Other Segment | 2,502 | |||||
Grand Total NOI | $ | 311,970 | Grand Total NOI | $ | 308,610 | |||
(1) | Includes limited-distribution federally assisted housing. |
(2) | Includes straight-line rent adjustments, participation payments as a result of refinancing transactions on our properties and management and service company overhead, net of service fee revenues. |
(3) | Includes straight-line adjustments, non-capitalizable development overhead and other costs on our development projects. |
27
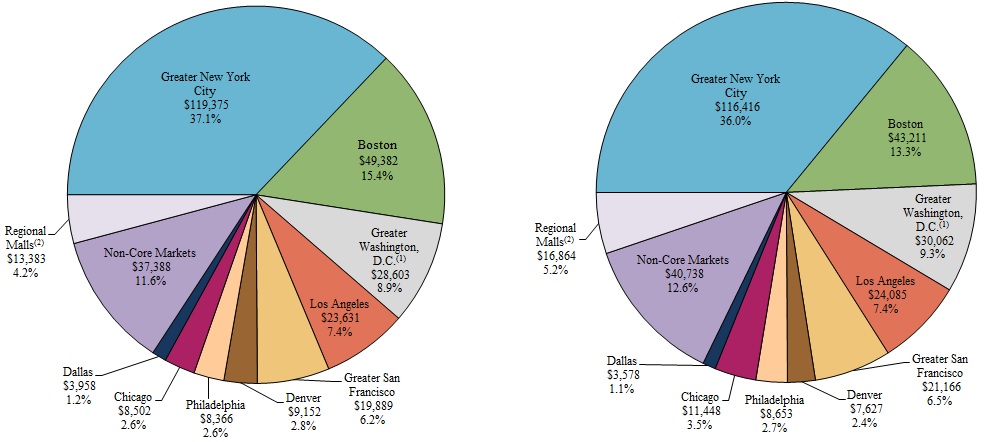
Forest City Realty Trust, Inc. and Subsidiaries
Supplemental Operating Information
NOI by Core Market
(dollars in thousands)
Six Months Ended June 30, 2017 | Six Months Ended June 30, 2016 | |
NOI by Market in Operations | $ | 321,629 | NOI by Market in Operations | $ | 323,848 | |||
Other NOI (3): | Other NOI (3): | |||||||
Straight-line rent adjustments | 6,643 | Straight-line rent adjustments | 4,979 | |||||
Other Operations | (1,935 | ) | Other Operations | (4,368 | ) | |||
4,708 | 611 | |||||||
Recently-Opened Properties/Redevelopment | (508 | ) | Recently-Opened Properties/Redevelopment | 1,254 | ||||
Development Segment (4) | (13,859 | ) | Development Segment (4) | (19,605 | ) | |||
Other Segment | — | Other Segment | 2,502 | |||||
Grand Total NOI | $ | 311,970 | Grand Total NOI | $ | 308,610 | |||
(1) | Includes Richmond, Virginia. |
(2) | Represents Regional Malls located in Non-Core Markets. Regional Malls located in Core Markets are included in their applicable Core Markets. |
(3) | Includes straight-line rent adjustments, participation payments as a result of refinancing transactions on our properties and management and service company overhead, net of service fee revenues. |
(4) | Includes straight-line adjustments, non-capitalizable development overhead and other costs on our development projects. |
28
Forest City Realty Trust, Inc. and Subsidiaries
Supplemental Operating Information
Reconciliation of Earnings (Loss) Before Income Taxes (GAAP) to Net Operating Income (non-GAAP) (in thousands):
Three Months Ended June 30, | Six Months Ended June 30, | ||||||||||||
2017 | 2016 | 2017 | 2016 | ||||||||||
Earnings (loss) before income taxes (GAAP) | $ | 58,245 | $ | 29,174 | $ | 89,917 | $ | (12,359 | ) | ||||
Earnings from unconsolidated entities | (41,514 | ) | (21,164 | ) | (68,493 | ) | (31,700 | ) | |||||
Earnings (loss) before income taxes and earnings from unconsolidated entities | 16,731 | 8,010 | 21,424 | (44,059 | ) | ||||||||
Land sales | (17,762 | ) | (8,221 | ) | (23,522 | ) | (12,154 | ) | |||||
Cost of land sales | 7,694 | 1,702 | 9,695 | 2,042 | |||||||||
Other land development revenues | (1,862 | ) | (2,228 | ) | (2,967 | ) | (4,144 | ) | |||||
Other land development expenses | 2,034 | 2,397 | 4,598 | 4,745 | |||||||||
Corporate general and administrative expenses | 14,018 | 16,750 | 29,601 | 33,862 | |||||||||
Organizational transformation and termination benefits | 6,863 | 5,681 | 11,388 | 14,401 | |||||||||
Depreciation and amortization | 65,747 | 62,418 | 129,302 | 125,629 | |||||||||
Write-offs of abandoned development projects and demolition costs | 1,596 | — | 1,596 | — | |||||||||
Impairment of real estate | — | 2,100 | — | 14,564 | |||||||||
Interest and other income | (9,896 | ) | (11,031 | ) | (20,168 | ) | (20,685 | ) | |||||
Interest expense | 28,901 | 32,435 | 56,876 | 67,070 | |||||||||
Amortization of mortgage procurement costs | 1,507 | 1,416 | 2,729 | 3,081 | |||||||||
Loss on extinguishment of debt | — | — | 2,843 | 29,084 | |||||||||
NOI related to unconsolidated entities (1) | 53,629 | 56,253 | 108,729 | 111,498 | |||||||||
NOI related to noncontrolling interest (2) | (10,483 | ) | (9,434 | ) | (20,154 | ) | (17,522 | ) | |||||
NOI related to discontinued operations (3) | — | — | — | 1,198 | |||||||||
Net Operating Income (Non-GAAP) | $ | 158,717 | $ | 158,248 | $ | 311,970 | $ | 308,610 | |||||
(1) NOI related to unconsolidated entities: | |||||||||||||
Equity in earnings (GAAP) | $ | 6,261 | $ | 8,551 | $ | 15,539 | $ | 19,087 | |||||
Exclude non-NOI activity from unconsolidated entities: | |||||||||||||
Land and non-rental activity, net | (443 | ) | (1,730 | ) | (1,579 | ) | (2,671 | ) | |||||
Interest and other income | (451 | ) | (390 | ) | (1,976 | ) | (755 | ) | |||||
Write offs of abandoned development projects and demolition costs | 396 | — | 747 | — | |||||||||
Depreciation and amortization | 23,938 | 23,469 | 47,027 | 45,143 | |||||||||
Interest expense and extinguishment of debt | 23,928 | 26,353 | 48,971 | 50,694 | |||||||||
NOI related to unconsolidated entities | $ | 53,629 | $ | 56,253 | $ | 108,729 | $ | 111,498 | |||||
(2) NOI related to noncontrolling interest: | |||||||||||||
Earnings from continuing operations attributable to noncontrolling interests (GAAP) | $ | (1,556 | ) | $ | (1,760 | ) | $ | (1,450 | ) | $ | (3,881 | ) | |
Exclude non-NOI activity from noncontrolling interests: | |||||||||||||
Land and non-rental activity, net | 1,132 | 713 | 1,378 | 1,062 | |||||||||
Interest and other income | 448 | 392 | 972 | 769 | |||||||||
Depreciation and amortization | (7,194 | ) | (5,730 | ) | (14,177 | ) | (10,249 | ) | |||||
Interest expense and extinguishment of debt | (3,970 | ) | (3,049 | ) | (7,534 | ) | (5,038 | ) | |||||
Gain (loss) on disposition of full or partial interests in rental properties and interest in unconsolidated entities | 657 | — | 657 | (185 | ) | ||||||||
NOI related to noncontrolling interest | $ | (10,483 | ) | $ | (9,434 | ) | $ | (20,154 | ) | $ | (17,522 | ) | |
(3) NOI related to discontinued operations: | |||||||||||||
Operating loss from discontinued operations, net of tax (GAAP) | $ | — | $ | — | $ | — | $ | (1,126 | ) | ||||
Less loss from discontinued operations attributable to noncontrolling interests | — | — | — | 776 | |||||||||
Exclude non-NOI activity from discontinued operations (net of noncontrolling interest): | |||||||||||||
Depreciation and amortization | — | — | — | 56 | |||||||||
Interest expense | — | — | — | 1,738 | |||||||||
Income tax benefit | — | — | — | (246 | ) | ||||||||
NOI related to discontinued operations | $ | — | $ | — | $ | — | $ | 1,198 | |||||
29
Forest City Realty Trust, Inc. and Subsidiaries
Supplemental Operating Information
Net Earnings Attributable to Forest City Realty Trust, Inc.
Net earnings attributable to Forest City Realty Trust, Inc. for the three months ended June 30, 2017 was $56,753,000 versus net earnings of $26,599,000 for the three months ended June 30, 2016. The variance to the prior year period is primarily attributable to the following fluctuations, which are pre-tax, include unconsolidated investment activity and are net of noncontrolling interests:
Asset Dispositions - $24,691,000
• | $27,324,000 related to increased gains on disposition of full or partial interest in rental properties and unconsolidated investments in 2017 compared to 2016; |
• | $(5,949,000) related to a combined fluctuation in revenues and operating expenses at properties in which we disposed of our full or partial interest during 2017 and 2016; and |
• | $3,316,000 related to increased land sales in 2017 compared with 2016, primarily at our Stapleton project. |
Financing Transactions - $6,880,000
• | $10,180,000 primarily related to a decrease in interest expense on nonrecourse mortgage debt due to the payoff of the $640,000,000 nonrecourse mortgage debt for the New York Times building in Q4 2016 partially offset by interest expense incurred on the Term Loan which we borrowed in full in November 2016 to payoff the mortgage debt on the New York Times; |
• | $(5,101,000) related to an increase in interest expense in 2017 compared with 2016 due to decreased capitalized interest on projects under construction and development as we decreased our construction pipeline; |
• | $954,000 related to the change in fair market value of certain derivatives not qualifying for hedge accounting between the comparable periods, which was marked to market through interest expense; and |
• | $847,000 related to decreased losses on extinguishment of debt compared with 2016. |
Operations - $6,960,000
• | $6,126,000 related to a combined fluctuation in revenues and operating expenses in our comparable portfolio in 2017 compared to 2016; |
• | $2,016,000 related to a combined fluctuation in revenues and operating expenses for operations and development properties in lease-up or recently stabilized but not comparable and other non-comparable properties at June 30, 2017; and |
• | $(1,182,000) related to higher organizational transformation and termination benefits in 2017 compared with 2016. |
Non-Cash Transactions - $(2,439,000)
• | $(2,457,000) related to an increase in depreciation and amortization expense in 2017 compared with 2016 primarily attributable to new property openings in 2016 and 2017 offset by the sale of full or partial interest in rental properties in 2016; |
• | $2,100,000 related to decreased impairment of real estate in 2017 compared to 2016; and |
• | $(1,992,000) related to increased write-offs of abandoned development projects and demolition costs in 2017 compared with 2016. |
Income Taxes
• | $(4,462,000) primarily due to increased state income tax expense related to gains on asset dispositions. |
30
Forest City Realty Trust, Inc. and Subsidiaries
Supplemental Operating Information
Net earnings attributable to Forest City Realty Trust, Inc. for the six months ended June 30, 2017 was $97,670,000 versus net earnings of $270,634,000 for the six months ended June 30, 2016. The variance to the prior year period is primarily attributable to the following fluctuations, which are pre-tax, include unconsolidated investment activity and are net of noncontrolling interests:
Asset Dispositions - $(327,619,000)
• | $(181,677,000) related to decreased gains on disposition of full or partial interest in rental properties and unconsolidated investments in 2017 compared to 2016; |
• | $(136,687,000) related to the net gain on disposition of the development site 625 Fulton Avenue in 2016; |
• | $(12,843,000) related to a combined fluctuation in revenues and operating expenses at properties in which we disposed of our full or partial interest during 2017 and 2016; and |
• | $3,588,000 related to increased land sales in 2017 compared with 2016, primarily at our Stapleton project. |
Financing Transactions - $42,392,000
• | $25,465,000 related to decreased losses on extinguishment of debt compared with 2016 primarily due to separate, privately negotiated exchange transactions involving a portion of our Senior Notes due 2016, 2018 and 2020 in 2016; |
• | $24,471,000 primarily related to decreases in interest expense on nonrecourse mortgage debt due to the payoff of the $640,000,000 nonrecourse mortgage debt for the New York Times building in Q4 2016 and on corporate debt due to separate, privately negotiated exchange transactions involving certain of our Senior Notes due 2016, 2018 and 2020 in 2016. The decreases were offset by interest expense incurred on the Term Loan which we borrowed in full in November 2016 to payoff the mortgage debt on the New York Times; |
• | $(11,600,000) related to an increase in interest expense in 2017 compared with 2016 due to decreased capitalized interest on projects under construction and development as we decreased our construction pipeline; and |
• | $4,056,000 related to the change in fair market value of certain derivatives not qualifying for hedge accounting between the comparable periods, which was marked to market through interest expense. |
Operations - $22,842,000
• | $10,806,000 primarily related to lower corporate general and administrative expenses and decreased costs in our operations and development management and service entities; |
• | $7,573,000 related to a combined fluctuation in revenues and operating expenses in our comparable portfolio in 2017 compared to 2016; |
• | $3,013,000 related to lower organizational transformation and termination benefits in 2017 compared with 2016; and |
• | $1,450,000 related to a combined fluctuation in revenues and operating expenses for operations and development properties in lease-up or recently stabilized but not comparable and other non-comparable properties at June 30, 2017. |
Non-Cash Transactions - $10,304,000
• | $14,564,000 related to decreased impairment of real estate in 2017 compared to 2016; |
• | $(2,343,000) related to increased write-offs of abandoned development projects and demolition costs in 2017 compared with 2016; and |
• | $(1,917,000) related to to an increase in depreciation and amortization expense in 2017 compared with 2016 primarily attributable to new property openings in 2016 and 2017 offset by the sale of full or partial interest in rental properties in 2016. |
Income Taxes
• | $78,309,000 due to decreased income tax expense primarily due to gains on sale of assets owned by our TRS in 2016. The tax expense in 2016 is primarily non-cash as it largely relates to the utilization of the deferred tax asset to offset the taxable gain on the various sales. |
31
Forest City Realty Trust, Inc. and Subsidiaries
Supplemental Operating Information
The interest expense and capital expenditure information shown below is for all of our consolidated investments. See the appendix for further information on noncontrolling interest share of these items plus our share of our unconsolidated investments’ interest expense and capital expenditures.
Interest Expense – The following table summarizes interest incurred, capitalized and paid on all forms of debt.
Three Months Ended June 30, | Six Months Ended June 30, | ||||||||||||
2017 | 2016 | 2017 | 2016 | ||||||||||
(in thousands) | |||||||||||||
Amortization and mark-to-market adjustments of derivative instruments | $ | 203 | $ | 1,135 | $ | (827 | ) | $ | 3,201 | ||||
Interest incurred | 35,195 | 41,326 | 68,951 | 85,164 | |||||||||
Interest capitalized | (6,497 | ) | (10,026 | ) | (11,248 | ) | (21,295 | ) | |||||
Net interest expense | $ | 28,901 | $ | 32,435 | $ | 56,876 | $ | 67,070 | |||||
Capital Expenditures for our Operating Portfolio – Our diversified real estate portfolio requires capital expenditures, including tenant improvements, to maintain and improve its operating performance. The following table represents our capital expenditures by segment:
Six Months Ended June 30, | ||||||
2017 | 2016 | |||||
(in thousands) | ||||||
Operating properties: | ||||||
Office Segment | $ | 9,555 | $ | 3,609 | ||
Apartment Segment | 10,106 | 5,700 | ||||
Retail Segment | 392 | 2,743 | ||||
Total operating properties | 20,053 | 12,052 | ||||
Corporate Segment | 364 | — | ||||
Tenant improvements: | ||||||
Office Segment | 17,746 | 10,417 | ||||
Retail Segment | 1,769 | 1,698 | ||||
Total capital expenditures | $ | 39,932 | $ | 24,167 | ||
32
Forest City Realty Trust, Inc. and Subsidiaries
Supplemental Operating Information
Reconciliation of Net Earnings to FFO
The table below reconciles net earnings, the most comparable GAAP measure, to FFO, a non-GAAP measure.
Three Months Ended June 30, | Six Months Ended June 30, | ||||||||||||
2017 | 2016 | 2017 | 2016 | ||||||||||
(in thousands) | |||||||||||||
Net earnings attributable to Forest City Realty Trust, Inc. (GAAP) | $ | 56,753 | $ | 26,599 | $ | 97,670 | $ | 270,634 | |||||
Depreciation and Amortization—real estate (1) | 81,400 | 78,788 | 159,749 | 157,650 | |||||||||
Gain on disposition of full or partial interests in rental properties | (39,314 | ) | (11,990 | ) | (66,318 | ) | (111,748 | ) | |||||
Impairment of depreciable rental properties | — | 2,100 | — | 14,564 | |||||||||
Income tax expense adjustment — current and deferred (2): | |||||||||||||
Gain on disposition of full or partial interests in rental properties | 4,642 | 236 | 4,642 | 55,272 | |||||||||
FFO attributable to Forest City Realty Trust, Inc. (Non-GAAP) | $ | 103,481 | $ | 95,733 | $ | 195,743 | $ | 386,372 | |||||
FFO Per Share - Diluted | |||||||||||||
Numerator (in thousands): | |||||||||||||
FFO attributable to Forest City Realty Trust, Inc. | $ | 103,481 | $ | 95,733 | $ | 195,743 | $ | 386,372 | |||||
If-Converted Method (adjustments for interest): | |||||||||||||
4.250% Notes due 2018 | 778 | 778 | 1,556 | 2,250 | |||||||||
3.625% Notes due 2020 | 362 | 362 | 725 | 1,280 | |||||||||
FFO for per share data | $ | 104,621 | $ | 96,873 | $ | 198,024 | $ | 389,902 | |||||
Denominator: | |||||||||||||
Weighted average shares outstanding—Basic | 260,569,749 | 258,645,220 | 259,688,409 | 258,298,148 | |||||||||
Effect of stock options, restricted stock and performance shares | 1,319,110 | 995,175 | 1,320,011 | 1,239,960 | |||||||||
Effect of convertible debt | 5,153,256 | 5,031,753 | 5,153,256 | 7,804,478 | |||||||||
Effect of convertible 2006 Class A Common Units | 1,797,909 | 1,940,788 | 1,853,955 | 1,940,788 | |||||||||
Weighted average shares outstanding - Diluted | 268,840,024 | 266,612,936 | 268,015,631 | 269,283,374 | |||||||||
FFO Per Share - Diluted | $ | 0.39 | $ | 0.36 | $ | 0.74 | $ | 1.45 | |||||
(1) | The following table provides detail of depreciation and amortization: |
Three Months Ended June 30, | Six Months Ended June 30, | ||||||||||||
2017 | 2016 | 2017 | 2016 | ||||||||||
(in thousands) | |||||||||||||
Full Consolidation | $ | 65,747 | $ | 62,418 | $ | 129,302 | $ | 125,629 | |||||
Non-Real Estate | (689 | ) | (754 | ) | (1,391 | ) | (1,573 | ) | |||||
Real Estate Full Consolidation | 65,058 | 61,664 | 127,911 | 124,056 | |||||||||
Real Estate related to noncontrolling interest | (6,853 | ) | (5,463 | ) | (13,549 | ) | (9,790 | ) | |||||
Real Estate Unconsolidated | 23,195 | 22,587 | 45,387 | 43,349 | |||||||||
Real Estate Discontinued Operations | — | — | — | 35 | |||||||||
Real Estate at Company share | $ | 81,400 | $ | 78,788 | $ | 159,749 | $ | 157,650 | |||||
(2) | The following table provides detail of income tax expense (benefit): |
Three Months Ended June 30, | Six Months Ended June 30, | ||||||||||||
2017 | 2016 | 2017 | 2016 | ||||||||||
(in thousands) | |||||||||||||
Income tax expense on FFO | |||||||||||||
Operating Earnings: | |||||||||||||
Current taxes | $ | 12 | $ | 91 | $ | 63 | $ | 3,720 | |||||
Deferred taxes | — | (135 | ) | — | 24,022 | ||||||||
Total income tax expense on FFO | 12 | (44 | ) | 63 | 27,742 | ||||||||
Income tax expense (benefit) on non-FFO | |||||||||||||
Disposition of full or partial interests in rental properties: | |||||||||||||
Current taxes | $ | 4,642 | $ | 236 | $ | 4,642 | $ | (4,351 | ) | ||||
Deferred taxes | — | — | — | 59,623 | |||||||||
Total income tax expense on non-FFO | 4,642 | 236 | 4,642 | 55,272 | |||||||||
Grand Total | $ | 4,654 | $ | 192 | $ | 4,705 | $ | 83,014 | |||||
33
Forest City Realty Trust, Inc. and Subsidiaries
Supplemental Operating Information
Reconciliation of FFO to Operating FFO
Three Months Ended June 30, | Six Months Ended June 30, | ||||||||||||||
2017 | 2016 | % Change | 2017 | 2016 | % Change | ||||||||||
(in thousands) | (in thousands) | ||||||||||||||
FFO attributable to Forest City Realty Trust, Inc. | $ | 103,481 | $ | 95,733 | $ | 195,743 | $ | 386,372 | |||||||
Write-offs of abandoned development projects and demolition costs | 1,992 | — | 2,343 | — | |||||||||||
Tax credit income | (2,521 | ) | (2,936 | ) | (5,212 | ) | (5,944 | ) | |||||||
Loss on extinguishment of debt | 2 | 849 | 4,468 | 29,933 | |||||||||||
Change in fair market value of nondesignated hedges | (301 | ) | 590 | (1,803 | ) | 1,986 | |||||||||
Net gain on disposition of interest in development project | — | — | — | (136,687 | ) | ||||||||||
Net gain on disposition of partial interest in other investment - Nets | — | — | — | (136,247 | ) | ||||||||||
Straight-line rent adjustments | (3,993 | ) | (3,350 | ) | (6,935 | ) | (5,211 | ) | |||||||
Organizational transformation and termination benefits | 6,863 | 5,681 | 11,388 | 14,401 | |||||||||||
Nets pre-tax FFO | — | — | — | 1,400 | |||||||||||
Income tax expense (benefit) on FFO | 12 | (44 | ) | 63 | 27,742 | ||||||||||
Operating FFO attributable to Forest City Realty Trust, Inc. | $ | 105,535 | $ | 96,523 | 9.3% | $ | 200,055 | $ | 177,745 | 12.6% | |||||
If-Converted Method (adjustments for interest) (in thousands): | |||||||||||||||
4.250% Notes due 2018 | 778 | 778 | 1,556 | 2,250 | |||||||||||
3.625% Notes due 2020 | 362 | 362 | 725 | 1,280 | |||||||||||
Operating FFO attributable to Forest City Realty Trust, Inc. (If-Converted) | $ | 106,675 | $ | 97,663 | $ | 202,336 | $ | 181,275 | |||||||
Weighted average shares outstanding - Diluted | 268,840,024 | 266,612,936 | 268,015,631 | 269,283,374 | |||||||||||
Operating FFO per share - Diluted | $ | 0.40 | $ | 0.37 | 8.1% | $ | 0.75 | $ | 0.67 | 11.9% | |||||
Reconciliation of NOI to Operating FFO
Three Months Ended June 30, | Six Months Ended June 30, | ||||||||||||
2017 | 2016 | 2017 | 2016 | ||||||||||
(in thousands) | |||||||||||||
NOI attributable to Forest City Realty Trust, Inc. | $ | 158,717 | $ | 158,248 | $ | 311,970 | $ | 308,610 | |||||
Land sales | 38,101 | 8,050 | 46,183 | 12,258 | |||||||||
Other land development revenues | 1,676 | 2,021 | 3,065 | 3,794 | |||||||||
Cost of land sales | (28,677 | ) | (1,942 | ) | (32,587 | ) | (2,250 | ) | |||||
Other land development expenses | (1,893 | ) | (2,207 | ) | (4,264 | ) | (4,622 | ) | |||||
Corporate general and administrative expenses | (14,018 | ) | (16,750 | ) | (29,601 | ) | (33,862 | ) | |||||
Interest and other income | 9,899 | 11,029 | 21,172 | 20,671 | |||||||||
Interest expense | (48,857 | ) | (54,890 | ) | (96,688 | ) | (113,615 | ) | |||||
Amortization of mortgage procurement costs | (1,909 | ) | (2,031 | ) | (3,741 | ) | (4,437 | ) | |||||
Non-real estate depreciation and amortization | (689 | ) | (754 | ) | (1,391 | ) | (1,573 | ) | |||||
Tax credit income | (2,521 | ) | (2,936 | ) | (5,212 | ) | (5,944 | ) | |||||
Change in fair market value of nondesignated hedges | (301 | ) | 590 | (1,803 | ) | 1,986 | |||||||
Straight-line rent adjustments | (3,993 | ) | (3,350 | ) | (6,935 | ) | (5,211 | ) | |||||
Other | — | 1,445 | (113 | ) | 1,940 | ||||||||
Operating FFO attributable to Forest City Realty Trust, Inc. | $ | 105,535 | $ | 96,523 | $ | 200,055 | $ | 177,745 | |||||
34
Forest City Realty Trust, Inc. and Subsidiaries
Supplemental Operating Information
Reconciliation of Net Earnings (GAAP) to EBITDA (non-GAAP)
Three Months Ended June 30, | Six Months Ended June 30, | ||||||||||||
2017 | 2016 | 2017 | 2016 | ||||||||||
(in thousands) | |||||||||||||
Net earnings attributable to Forest City Realty Trust, Inc. (GAAP) | $ | 56,753 | $ | 26,599 | $ | 97,670 | $ | 270,634 | |||||
Depreciation and amortization | 82,089 | 79,542 | 161,140 | 159,223 | |||||||||
Interest expense (1) | 48,857 | 54,890 | 96,688 | 113,615 | |||||||||
Amortization of mortgage procurement costs | 1,909 | 2,031 | 3,741 | 4,437 | |||||||||
Income tax expense | 4,654 | 192 | 4,705 | 83,014 | |||||||||
EBITDA attributable to Forest City Realty Trust, Inc. (Non-GAAP) | $ | 194,262 | $ | 163,254 | $ | 363,944 | $ | 630,923 | |||||
Impairment of real estate | — | 2,100 | — | 14,564 | |||||||||
Net loss on extinguishment of debt | 2 | 849 | 4,468 | 29,933 | |||||||||
Net gain on disposition of interest in development project | — | — | — | (136,687 | ) | ||||||||
Net gain on disposition of partial interest in other investment - Nets | — | — | — | (136,247 | ) | ||||||||
Net gain on disposition of full or partial interests in rental properties | (39,314 | ) | (11,990 | ) | (66,318 | ) | (111,748 | ) | |||||
Nets pre-tax EBITDA | — | — | — | 1,400 | |||||||||
Organizational transformation and termination benefits | 6,863 | 5,681 | 11,388 | 14,401 | |||||||||
Adjusted EBITDA attributable to Forest City Realty Trust, Inc. (Non-GAAP) | $ | 161,813 | $ | 159,894 | $ | 313,482 | $ | 306,539 | |||||
As of June 30, | As of June 30, | ||||||||||||
2017 | 2016 | 2017 | 2016 | ||||||||||
(in thousands) | |||||||||||||
Nonrecourse mortgage debt and notes payable, net, at company share | $ | 5,025,661 | $ | 5,664,408 | $ | 5,025,661 | $ | 5,664,408 | |||||
Revolving credit facility | — | — | — | — | |||||||||
Term loan, net | 333,468 | — | 333,468 | — | |||||||||
Convertible senior debt, net | 112,410 | 111,952 | 112,410 | 111,952 | |||||||||
Total debt | $ | 5,471,539 | $ | 5,776,360 | $ | 5,471,539 | $ | 5,776,360 | |||||
Less cash and equivalents | (223,141 | ) | (461,369 | ) | (223,141 | ) | (461,369 | ) | |||||
Net Debt | $ | 5,248,398 | $ | 5,314,991 | $ | 5,248,398 | $ | 5,314,991 | |||||
Net Debt to Adjusted EBITDA (Annualized) | 8.1 | x | 8.3 | x | 8.4 | x | 8.7 | x | |||||
(1) | The following table provides detail of interest expense: |
Three Months Ended June 30, | Six Months Ended June 30, | ||||||||||||
2017 | 2016 | 2017 | 2016 | ||||||||||
(in thousands) | |||||||||||||
Full consolidation | $ | 28,901 | $ | 32,435 | $ | 56,876 | $ | 67,070 | |||||
Noncontrolling interest | (3,970 | ) | (3,049 | ) | (7,534 | ) | (5,038 | ) | |||||
Unconsolidated entities at Company share | 23,926 | 25,504 | 47,346 | 49,845 | |||||||||
Discontinued operations at Company share | — | — | — | 1,738 | |||||||||
Company share | $ | 48,857 | $ | 54,890 | $ | 96,688 | $ | 113,615 | |||||
35
(THIS PAGE INTENTIONALLY LEFT BLANK)
36
Forest City Realty Trust, Inc. and Subsidiaries
Supplemental Operating Information
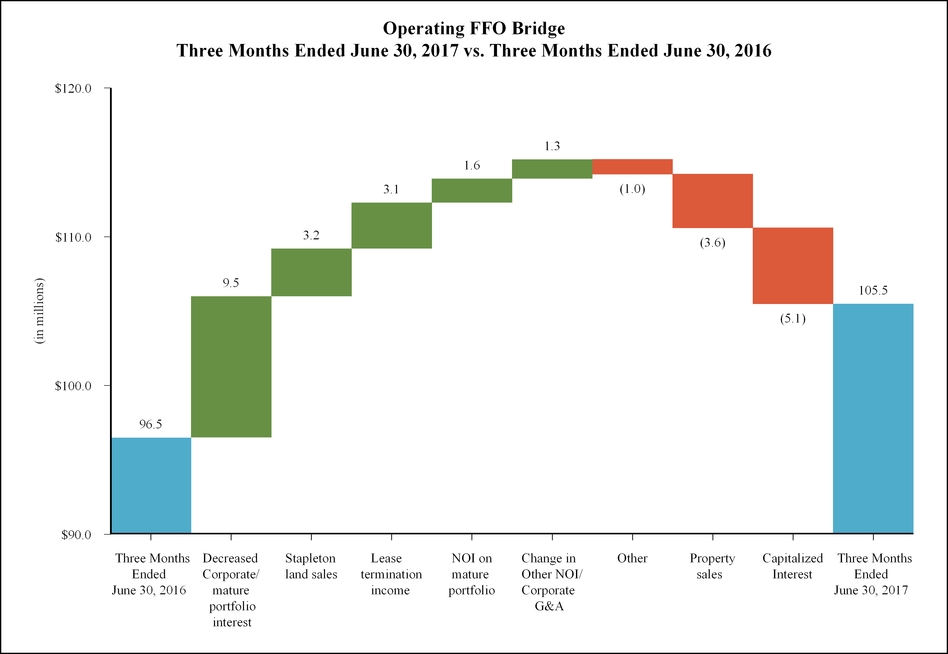
37
Forest City Realty Trust, Inc. and Subsidiaries
Supplemental Operating Information
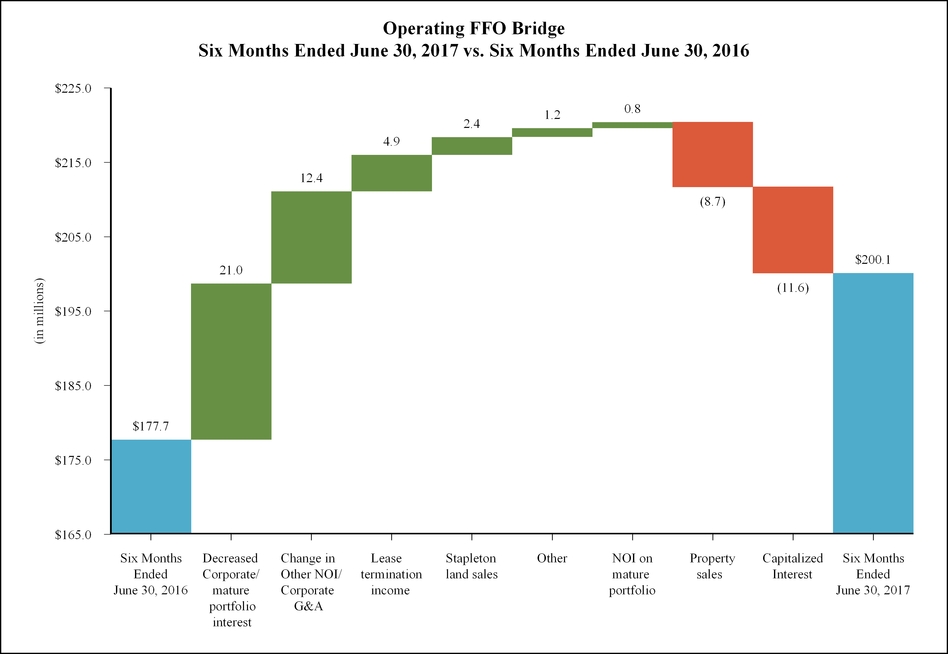
38
Forest City Realty Trust, Inc. and Subsidiaries
Supplemental Operating Information
Historical Trends
Through the implementation of our strategic plan, we approach our business by:
• | Focus on the Core: Aligning our business initiatives with our core markets and products as we develop, own and operate a high-quality real estate portfolio; |
• | Sustainable Capital Structure: Improving our metrics by delevering our balance sheet and activating our existing pipeline; and |
• | Operational Excellence: Using the strength of the enterprise to maximize efficiency, effectiveness and customer satisfaction through continuous business process improvements. |
The tables below illustrate our progress as we continue to implement our strategic plan. The financial and operating data presented is as reported in previous year-end supplemental packages. GAAP reconciliations for previous years can be found in prior supplemental packages furnished to the SEC and are available on our website at www.forestcity.net.
Development ratio is defined as total assets (less accumulated depreciation) divided by total projects under construction and development and land inventory. Total debt includes outstanding borrowings on our revolving credit facility, our term loan, net, convertible senior debt, net, nonrecourse mortgages and notes payable, net. All metrics are reflected at company share.
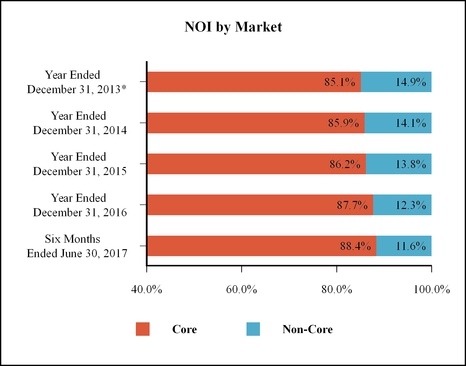
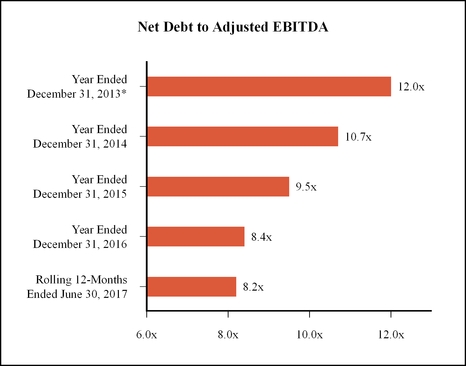
* | Represents data for the full year ended December 31, 2013, which is consistent with our calendar year-end adopted in 2013. As such, data for the year ended December 31, 2013 includes results for the month ended January 31, 2013, which was previously included in the financial results for the year ended January 31, 2013 in our supplemental package furnished with the SEC on March 27, 2013. |
39
Forest City Realty Trust, Inc. and Subsidiaries
Supplemental Operating Information
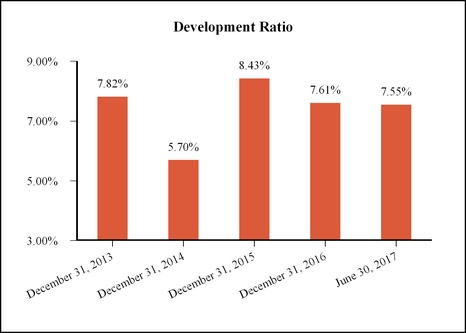
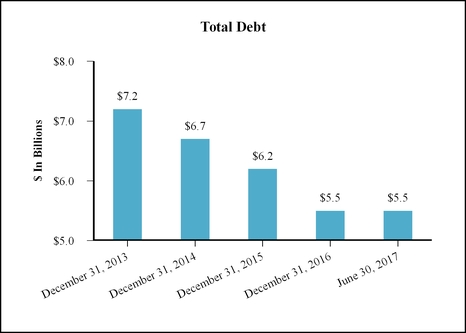
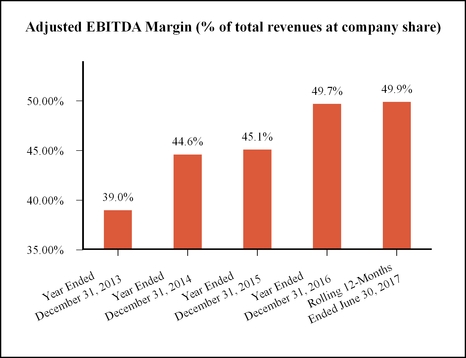
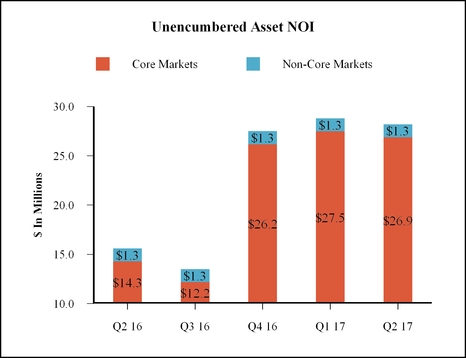
40
Forest City Realty Trust, Inc. and Subsidiaries
Supplemental Operating Information
Development Pipeline
Phased Openings and Projects Under Construction
June 30, 2017
Cost at Completion (b) | Cost Incurred to Date (c) | ||||||||||||||||||||||||||||
Anticipated | Legal | Cost at | Cost at | ||||||||||||||||||||||||||
Opening | Ownership | Company | Cost | Company | Cost | Company | No. of | Lease % | |||||||||||||||||||||
Location | Date | (a) | % (a) | at 100% | Share | at 100% | Share | Units | GLA | (d) | |||||||||||||||||||
(in millions) | |||||||||||||||||||||||||||||
2017 Phased Openings | |||||||||||||||||||||||||||||
Apartments | |||||||||||||||||||||||||||||
Greenland Joint Venture (e): | |||||||||||||||||||||||||||||
550 Vanderbilt (condominiums) (g) | Brooklyn, NY | Q1-17/Q3-17 | 30 | % | (f) | 30 | % | $ | 362.7 | $ | 116.4 | $ | 325.1 | $ | 106.7 | 278 | 7,000 | ||||||||||||
Pacific Park - Parking (h) | Brooklyn, NY | Q1-17/Q3-17 | 30 | % | (f) | 30 | % | 46.2 | 4.1 | 36.3 | 1.2 | — | — | ||||||||||||||||
Total Phased Openings | $ | 408.9 | $ | 120.5 | $ | 361.4 | $ | 107.9 | 278 | 7,000 | |||||||||||||||||||
Projects Under Construction | |||||||||||||||||||||||||||||
Apartments: | |||||||||||||||||||||||||||||
Arizona State Retirement System Joint Venture: | |||||||||||||||||||||||||||||
Axis | Los Angeles, CA | Q3-17/Q2-18 | 30 | % | 30 | % | $ | 140.4 | $ | 41.8 | $ | 132.7 | $ | 45.1 | 391 | 15,000 | |||||||||||||
Ardan | Dallas, TX | Q1-18/Q2-18 | 30 | % | 30 | % | 122.1 | 36.2 | 60.1 | 20.8 | 389 | 4,250 | |||||||||||||||||
$ | 262.5 | $ | 78.0 | $ | 192.8 | $ | 65.9 | 780 | 19,250 | ||||||||||||||||||||
Greenland Joint Venture (e): | |||||||||||||||||||||||||||||
38 Sixth Ave | Brooklyn, NY | Q3-17 | 30 | % | (f) | 30 | % | 202.7 | 50.1 | 153.9 | 40.1 | 303 | 28,000 | ||||||||||||||||
Mint Town Center | Denver, CO | Q3-17/Q4-17 | 95 | % | 95 | % | 93.1 | 88.4 | 68.8 | 65.4 | 399 | 7,000 | |||||||||||||||||
VYV | Jersey City, NJ | Q3-17/Q1-18 | 50 | % | (f) | 50 | % | 214.3 | 107.1 | 183.7 | 93.1 | 421 | 9,000 | ||||||||||||||||
Ballston Quarter Residential | Arlington, VA | Q3-18/Q1-19 | 51 | % | (f) | 51 | % | 181.9 | 92.9 | 43.0 | 23.8 | 406 | 53,000 | ||||||||||||||||
The Yards - The Guild | Washington, D.C. | Q4-18 | 0 | % | (i) | 0 | % | 91.1 | 0.0 | 25.8 | 0.0 | 191 | 6,000 | ||||||||||||||||
Capper 769 | Washington, D.C. | Q1-19 | 25 | % | (f) | 25 | % | 72.3 | 18.1 | 14.6 | 3.7 | 179 | — | ||||||||||||||||
$ | 1,117.9 | $ | 434.6 | $ | 682.6 | $ | 292.0 | 2,679 | 122,250 | ||||||||||||||||||||
Retail: | |||||||||||||||||||||||||||||
The Yards - District Winery | Washington, D.C. | Q4-17 | 100 | % | 100 | % | $ | 10.6 | $ | 10.6 | $ | 9.1 | $ | 9.1 | — | 16,150 | 100 | % | |||||||||||
Ballston Quarter Redevelopment | Arlington, VA | Q3-18 | 51 | % | (f) | 51 | % | 86.7 | 44.2 | 35.9 | 23.0 | — | 307,000 | 42 | % | ||||||||||||||
$ | 97.3 | $ | 54.8 | $ | 45.0 | $ | 32.1 | — | 323,150 | ||||||||||||||||||||
Total Projects Under Construction (j) | $ | 1,215.2 | $ | 489.4 | $ | 727.6 | $ | 324.1 | |||||||||||||||||||||
Estimated Initial Yield on Cost (k): | |||||||||||||||||||||||||||||
Apartments | 5.6% - 6.1% | ||||||||||||||||||||||||||||
Retail | 6.7% - 7.2% | ||||||||||||||||||||||||||||
Total Projects Under Construction | 5.7% - 6.2% | ||||||||||||||||||||||||||||
See footnotes on the following page.
41
Forest City Realty Trust, Inc. and Subsidiaries
Supplemental Operating Information
Development Pipeline
Property Openings
June 30, 2017
Cost at Completion (b) | ||||||||||||||||||||||
Date | Legal | Cost | Cost at | No. of | ||||||||||||||||||
Location | Opened | Ownership (a) | Company % (a) | at 100% | Company Share | Units | GLA | Lease % (d) | ||||||||||||||
(in millions) | ||||||||||||||||||||||
2017 Property Openings | ||||||||||||||||||||||
Office: | ||||||||||||||||||||||
The Bridge at Cornell Tech | Roosevelt Island, NY | Q2-17 | 100 | % | 100 | % | $ | 164.1 | $ | 164.1 | — | 235,000 | 50 | % | ||||||||
Apartments: | ||||||||||||||||||||||
Greenland Joint Venture (e): | ||||||||||||||||||||||
535 Carlton | Brooklyn, NY | Q1-17/Q2-17 | 30 | % | (f) | 30 | % | $ | 168.1 | $ | 41.7 | 298 | — | 36 | % | |||||||
461 Dean Street | Brooklyn, NY | Q3-16/Q1-17 | 100 | % | 100 | % | 195.6 | 195.6 | 363 | 4,000 | 77 | % | ||||||||||
The Bixby | Washington, D.C. | Q3-16/Q2-17 | 25 | % | (f) | 25 | % | 59.2 | 11.8 | 195 | — | 99 | % | |||||||||
Arizona State Retirement System Joint Venture: | ||||||||||||||||||||||
Eliot on 4th (l) | Washington, D.C. | Q1-17/Q3-17 | 30 | % | 30 | % | $ | 143.7 | $ | 44.2 | 365 | 5,000 | 39 | % | ||||||||
NorthxNorthwest | Philadelphia, PA | Q4-16/Q1-17 | 30 | % | 30 | % | 115.0 | 33.5 | 286 | — | 24 | % | ||||||||||
$ | 258.7 | $ | 77.7 | 651 | 5,000 | |||||||||||||||||
$ | 681.6 | $ | 326.8 | 1,507 | 9,000 | |||||||||||||||||
Total Property Openings | $ | 845.7 | $ | 490.9 | ||||||||||||||||||
(a) | The Company invests in certain real estate projects through joint ventures and, at times, may provide funding at percentages that differ from the Company’s legal ownership. |
(b) | Represents estimated project costs to achieve stabilization, at 100% and the Company’s share, respectively. Amounts exclude capitalized interest not allocated to the underlying joint venture. |
(c) | Represents total capitalized project costs incurred to date, at 100% and the Company’s share, respectively, including all capitalized interest related to the development project. |
(d) | Lease commitments as of July 23, 2017. |
(e) | During the year ended December 31, 2016, the Company recorded an impairment related to our equity method investment in the Greenland Joint Venture, of which was partially allocated to the assets listed above. Costs at completion and incurred to date amounts at company share have been adjusted by this impairment. |
(f) | Reported under the equity method of accounting. This method represents a GAAP measure for investments in which the Company is not deemed to have control or to be the primary beneficiary of its investments in a VIE. |
(g) | Costs Incurred to Date at 550 Vanderbilt represents total cumulative capitalized project costs incurred to date, gross of cost of goods sold related to applicable condominium units. |
(h) | Expected to include 370 parking spaces. |
(i) | Represents an apartment community under construction in which the Company has a 0% legal ownership interest. However, the Company is the project developer, on a fee basis. In addition, the Company has issued a project completion guarantee to the first mortgagee and is funding a portion of the construction costs through a mezzanine loan to the owner. As a result, the Company determined it was the primary beneficiary of this variable interest entity and has consolidated the project. |
(j) | Of the remaining project costs, the Company has undrawn construction loan commitments of $251.1 million at the company’s share ($547.3 million at 100%). |
(k) | Range of estimated initial yield on cost for projects under construction is calculated using estimated company-share initial stabilized NOI divided by the company’s share of project cost per above, net of anticipated subsidies and other cost adjustments. |
(l) | As of June 30, 2017, construction on Eliot on 4th is complete. The property is open and has received partial tenant certificates of occupancy, 333 of 365, and is awaiting remaining tenant certificates of occupancy. |
42
Forest City Realty Trust, Inc. and Subsidiaries
Supplemental Operating Information
Development Pipeline
Projects Under Development
June 30, 2017
Below is a summary of our active large scale development projects which are crucial to our long-term growth. While we cannot make any assurances on the timing or delivery of these projects, we believe our track record speaks to our ability to bring large, complex projects to fruition when there is demand and available construction financing. The projects listed below and other projects in core markets represent company ownership costs of $206.9 million ($157.9 million at full consolidation) of Projects Under Development on our balance sheet and company ownership mortgage debt, net of $165.8 million ($9.0 million at full consolidation).
1) | Pacific Park Brooklyn - Brooklyn, NY |
Pacific Park Brooklyn, a 22-acre mixed-use project, is located adjacent to the state-of-the-art arena, Barclays Center. At full build-out, Pacific Park Brooklyn is expected to feature more than 6,400 units of housing, including 2,250 affordable units, and more than 8 acres of landscaped open space. Included in the square feet of residential entitlements is 250,000 square feet of amenity retail that will reside in the base of the various buildings. The project is also currently entitled for approximately 1 million square feet of office space. 38 Sixth Ave, a 303-unit, 100% affordable rental building, is currently under construction. Current partially opened projects include 550 Vanderbilt, a 278-unit condominium building, and parking garages which are expected to include 370 parking spaces. 535 Carlton, a 100% affordable rental building with 298 apartment units, and 461 Dean Street, a 50% market-rate and 50% affordable rental building with 363 apartment units, are complete.
2) | The Yards - Washington, D.C. |
The Yards is a fully entitled, 53-acre mixed-use project, located in the neighborhood of the Washington Nationals baseball park in the Capitol Riverfront District. At full build-out, the project is expected to include up to 3,000 residential units, 1.8 million square feet of office space and approximately 400,000 square feet of retail and dining space. The Yards features a 5.5-acre publicly funded public park that is a gathering place and recreational focus for the community. Current completed projects include 715 apartment units and 178,000 square feet of retail. Currently under construction is the District Winery, a 16,150 square-foot retail building, which is 100% leased to a single tenant, and The Guild, a 191-unit apartment building.
3) Waterfront Station - Washington, D.C.
Located in Southwest Washington, D.C., Waterfront Station is adjacent to the Waterfront MetroRail station. At full build-out, Waterfront Station is expected to include 980 apartment units and approximately 50,000 square feet of retail stores and restaurants. Currently completed is a 365-unit apartment building, Eliot on 4th.
4) Pier 70 - San Francisco, CA
Pier 70 is a former shipyard on San Francisco’s eastern waterfront. Our master development area of 28 acres is a mixed-use project, which is expected to include 3.2 million total square feet, consisting of 900,000 to 1.8 million square feet of office space, approximately 360,000 square feet of traditional retail, local production, and cultural/community uses, 1,000 to 2,000 residential units, approximately 2,000 parking spaces and 7 acres of waterfront parks. The provided ranges for commercial and residential uses are the result of a flexible zoning approach taken with a select number of parcels, allowing either commercial or residential uses. Project entitlements are anticipated in Q4-2017 through the Port Commission, Planning Commission and Board of Supervisors.
5) 5M - San Francisco, CA
5M is a fully entitled, mixed-use project on approximately 4 acres in downtown San Francisco. 5M is expected to include approximately 800,000 square feet of commercial uses and 690 residential units. The project will retain three existing historic buildings, including the iconic San Francisco Chronicle building, and would create significant new open spaces for the neighborhood. The project is designed to house a dynamic ground-floor mix featuring local retail and arts, cultural and community uses for a total of approximately 1.7 million square feet of development.
6) Hudson Exchange - Jersey City, NJ
Hudson Exchange is a partnership with G&S Investors, the owner of an 18-acre parcel of land, three miles from downtown Manhattan in the waterfront section of Jersey City. At full build-out, the project is expected to include up to 5,400 apartment units in twelve towers and 350,000 square feet of amenity retail and dining space. Currently under construction is VYV, a 421-unit apartment building.
43
Forest City Realty Trust, Inc. and Subsidiaries
Supplemental Operating Information
Development Pipeline
Summary of Development Projects
June 30, 2017
Below is a summary of our active large scale development projects in core markets, as well as other projects in core and non-core markets along with the approximate related developable square footage, by product type. These development opportunities are in a wide range of various stages, including but not limited to, being entitled for its intended development purposes and ready for construction to merely being controlled through a land option. The other product type includes condominiums and hotels. Amounts exclude any currently open or under construction projects within the larger overall development project and are shown at 100% and our estimated ownership share.
Developable Square Feet | Square Feet at 100% | Square Feet at Company Share | ||||||||||||||||||||||
Office | Apartments | Retail | Other | Total | Office | Apartments | Retail | Other | Total | Projects under development balance | ||||||||||||||
Development Projects - Core Markets | (in thousands) | |||||||||||||||||||||||
Pacific Park Brooklyn - Brooklyn, NY | 1,068,190 | 3,858,724 | — | 944,877 | 5,871,791 | 320,457 | 1,157,617 | — | 283,463 | 1,761,537 | $ | 40,874 | ||||||||||||
The Yards - Washington, D.C. | 1,838,702 | 2,060,342 | 263,384 | 471,897 | 4,634,325 | 1,838,702 | 2,038,290 | 263,384 | 471,897 | 4,612,273 | 70,445 | |||||||||||||
Waterfront Station - Washington, D.C. | — | 634,441 | 57,949 | — | 692,390 | — | 285,498 | 26,078 | — | 311,576 | 10,355 | |||||||||||||
Pier 70 - San Francisco, CA | 1,200,936 | 865,412 | 363,104 | 772,250 | 3,201,702 | 1,200,936 | 865,412 | 363,104 | 772,250 | 3,201,702 | 36,176 | |||||||||||||
5M - San Francisco, CA | 801,327 | 260,203 | 36,478 | 552,252 | 1,650,260 | 133,020 | 43,194 | 6,055 | 91,674 | 273,943 | 30,811 | |||||||||||||
Stapleton - Denver, CO | 3,494,444 | 2,260,722 | 200,000 | 270,000 | 6,225,166 | 3,145,000 | 2,034,650 | 180,000 | 243,000 | 5,602,650 | — | |||||||||||||
Hudson Exchange - Jersey City, NJ | — | 5,952,232 | 350,000 | — | 6,302,232 | — | 2,976,120 | 175,000 | — | 3,151,120 | 12,475 | |||||||||||||
Other | 414,344 | 935,000 | 252,373 | — | 1,601,717 | 62,152 | 467,500 | 233,356 | — | 763,008 | 5,749 | |||||||||||||
8,817,943 | 16,827,076 | 1,523,288 | 3,011,276 | 30,179,583 | 6,700,267 | 9,868,281 | 1,246,977 | 1,862,284 | 19,677,809 | $ | 206,885 | |||||||||||||
Development Projects - Non Core Markets | 1,590,895 | 374,217 | 99,744 | — | 2,064,856 | 1,590,895 | 374,217 | 99,744 | — | 2,064,856 | 53,448 | |||||||||||||
Projects under development - Operating Properties | — | — | — | — | — | — | — | — | — | — | 23,121 | |||||||||||||
Total | 10,408,838 | 17,201,293 | 1,623,032 | 3,011,276 | 32,244,439 | 8,291,162 | 10,242,498 | 1,346,721 | 1,862,284 | 21,742,665 | $ | 283,454 | ||||||||||||
Land Inventory
Land inventory represents undeveloped land parcels we currently do not intend to hold for future vertical development. A summary of our land inventory follows:
Stapleton
Stapleton, a 90% owned entity, represents one of the nation’s largest urban redevelopments. At full build-out of 4,700 acres or 7.5 square miles, Stapleton is planned for more than 12,000 homes and apartments, 3 million square feet of retail and 10 million square feet of office/research and development/industrial space. Located 10 minutes east of Downtown Denver and 20 minutes from Denver International Airport, Stapleton is expected to be home to 30,000 residents and 35,000 workers when complete. As of June 30, 2017, we own 468 gross acres, of which 169 acres are saleable. We also have an option to purchase an additional 408 gross acres at Stapleton.
Commercial Outlots
Commercial outlots are primarily undeveloped parcels of land adjacent to our retail assets throughout the United States. These parcels are sold to third party operators that benefit from being in close proximity to the existing retail asset. Typically, these outlots have zoning and entitlements consistent with our retail asset.
44
(THIS PAGE INTENTIONALLY LEFT BLANK)
45
Forest City Realty Trust, Inc. and Subsidiaries
Supplemental Financial Information
Common Stock Data (NYSE: FCE A and FCE B)
The following summarizes information related to the Company’s Class A and Class B common stock based on information reported by the New York Stock Exchange:
Quarter Ended | |||||||||||||||||||
June 30, 2017 | March 31, 2017 | December 31, 2016 | September 30, 2016 | June 30, 2016 | |||||||||||||||
Class A Common Stock | |||||||||||||||||||
Closing Price, end of period | $ | 24.17 | $ | 21.78 | $ | 20.84 | $ | 23.13 | $ | 22.31 | |||||||||
High Sales Price | $ | 24.73 | $ | 23.42 | $ | 23.08 | $ | 24.22 | $ | 23.56 | |||||||||
Low Sales Price | $ | 21.59 | $ | 20.25 | $ | 17.79 | $ | 22.24 | $ | 20.50 | |||||||||
Average Sales Price | $ | 23.04 | $ | 22.11 | $ | 20.29 | $ | 23.35 | $ | 21.77 | |||||||||
Total Volume | 91,271,300 | 114,635,533 | 114,234,232 | 74,328,684 | 60,999,364 | ||||||||||||||
Average Volume | 1,448,751 | 1,848,960 | 1,813,242 | 1,161,386 | 953,115 | ||||||||||||||
Common shares outstanding, end of period | 265,233,926 | 240,443,569 | 239,937,796 | 239,926,928 | 239,891,378 | ||||||||||||||
Class B Common Stock (1) | |||||||||||||||||||
Closing Price, end of period | $ | 31.73 | $ | 28.31 | $ | 26.93 | $ | 23.11 | $ | 22.19 | |||||||||
High Sales Price | $ | 31.97 | $ | 30.32 | $ | 28.41 | $ | 24.84 | $ | 23.20 | |||||||||
Low Sales Price | $ | 27.82 | $ | 26.25 | $ | 18.00 | $ | 22.29 | $ | 20.60 | |||||||||
Average Sales Price | $ | 29.38 | $ | 28.63 | $ | 22.21 | $ | 23.47 | $ | 21.80 | |||||||||
Total Volume | 57,800 | 85,539 | 211,574 | 73,494 | 61,451 | ||||||||||||||
Average Volume | 1,180 | 1,380 | 3,358 | 1,148 | 960 | ||||||||||||||
Common shares outstanding, end of period | — | 18,788,163 | 18,788,169 | 18,788,169 | 18,788,287 | ||||||||||||||
Common Equity Market Capitalization | $ | 6,410,703,991 | $ | 5,768,753,827 | $ | 5,506,269,060 | $ | 5,983,704,430 | $ | 5,768,888,732 | |||||||||
Quarterly dividends declared and paid per Class A and Class B common share | $ | 0.09 | $ | 0.09 | $ | 0.06 | $ | 0.06 | $ | 0.06 | |||||||||
(1) | Effective June 12, 2017, each share of Class B Common Stock outstanding was reclassified and exchanged into 1.31 shares of Class A common stock. As such, the Class B Common Stock data for the quarter ended June 30, 2017 relates to the period from April 1, 2017 to June 12, 2017. |
Financial Covenants
Our revolving credit facility and term loan facility contain certain identical restrictive financial covenants. A summary of the key financial covenants as defined in the agreements, all of which we are compliant with at June 30, 2017, follows:
Requirement Per Agreements | As of June 30, 2017 | As of March 31, 2017 | As of December 31, 2016 | As of September 30, 2016 | |||||||||
Credit Facility Financial Covenants | |||||||||||||
Maximum Total Leverage Ratio | ≤65% | 47.90 | % | 48.27 | % | 49.45 | % | 50.96 | % | ||||
Maximum Secured Leverage Ratio | ≤55% | 44.28 | % | 44.54 | % | 45.49 | % | 51.08 | % | ||||
Maximum Secured Recourse Leverage Ratio | ≤15% | 0.00 | % | 0.00 | % | 0.00 | % | 0.00 | % | ||||
Maximum Unsecured Leverage Ratio | ≤60% | 18.10 | % | 18.72 | % | 19.86 | % | 0.00 | % | ||||
Minimum Fixed Charge Coverage Ratio | ≥1.50x | 2.06 | x | 2.00 | x | 1.95 | x | 1.74 | x | ||||
Minimum Unencumbered Interest Coverage Ratio | ≥1.50x | 8.15 | x | 9.73 | x | 10.07 | x | 4.72 | x | ||||
46
Forest City Realty Trust, Inc. and Subsidiaries
Supplemental Financial Information
Nonrecourse Debt Maturities Table (dollars in thousands)
As of June 30, 2017
Year Ending December 31, 2017 | Year Ending December 31, 2018 | ||||||||||||||||||||||||
Full Consolidation | Noncontrolling Interest | Company Share of Unconsolidated Entities | Company Share | Full Consolidation | Noncontrolling Interest | Company Share of Unconsolidated Entities | Company Share | ||||||||||||||||||
Fixed: | |||||||||||||||||||||||||
Fixed-rate debt | $ | 170,387 | $ | 10,219 | $ | 89,825 | $ | 249,993 | $ | 208,235 | $ | 7,777 | $ | 247,785 | $ | 448,243 | |||||||||
Weighted average rate | 6.04 | % | 6.47 | % | 5.20 | % | 5.72 | % | 4.52 | % | 3.58 | % | 4.96 | % | 4.78 | % | |||||||||
Variable: | |||||||||||||||||||||||||
Variable-rate debt | 36,779 | 4,467 | 1,158 | 33,470 | 176,560 | 111,540 | 227,795 | 292,815 | |||||||||||||||||
Weighted average rate | 3.84 | % | 3.84 | % | 3.79 | % | 3.84 | % | 3.62 | % | 3.42 | % | 5.13 | % | 4.87 | % | |||||||||
Tax-Exempt | — | — | — | — | 100,775 | 1,616 | 20,000 | 119,159 | |||||||||||||||||
Weighted average rate | — | — | — | — | 1.85 | % | 1.79 | % | 2.48 | % | 1.96 | % | |||||||||||||
Total variable-rate debt | 36,779 | 4,467 | 1,158 | 33,470 | 277,335 | 113,156 | 247,795 | 411,974 | |||||||||||||||||
Total Nonrecourse Debt | $ | 207,166 | $ | 14,686 | $ | 90,983 | $ | 283,463 | $ | 485,570 | $ | 120,933 | $ | 495,580 | $ | 860,217 | |||||||||
Weighted Average Rate | 5.65 | % | 5.67 | % | 5.19 | % | 5.50 | % | 3.64 | % | 3.40 | % | 4.94 | % | 4.42 | % | |||||||||
Year Ending December 31, 2019 | Year Ending December 31, 2020 | ||||||||||||||||||||||||
Full Consolidation | Noncontrolling Interest | Company Share of Unconsolidated Entities | Company Share | Full Consolidation | Noncontrolling Interest | Company Share of Unconsolidated Entities | Company Share | ||||||||||||||||||
Fixed: | |||||||||||||||||||||||||
Fixed-rate debt | $ | 107,423 | $ | 4,362 | $ | 32,932 | $ | 135,993 | $ | 160,563 | $ | 22,629 | $ | 150,759 | $ | 288,693 | |||||||||
Weighted average rate | 4.06 | % | 4.25 | % | 5.29 | % | 4.35 | % | 5.03 | % | 4.36 | % | 4.81 | % | 4.97 | % | |||||||||
Variable: | |||||||||||||||||||||||||
Variable-rate debt | 353,095 | 131,422 | 99,042 | 320,715 | 58,567 | — | 1,121 | 59,688 | |||||||||||||||||
Weighted average rate | 2.99 | % | 2.86 | % | 4.32 | % | 3.46 | % | 3.58 | % | — | 2.92 | % | 3.57 | % | ||||||||||
Tax-Exempt | 8,500 | — | — | 8,500 | — | — | — | — | |||||||||||||||||
Weighted average rate | 3.90 | % | — | — | 3.90 | % | — | — | — | — | |||||||||||||||
Total variable-rate debt | 361,595 | 131,422 | 99,042 | 329,215 | 58,567 | — | 1,121 | 59,688 | |||||||||||||||||
Total Nonrecourse Debt | $ | 469,018 | $ | 135,784 | $ | 131,974 | $ | 465,208 | $ | 219,130 | $ | 22,629 | $ | 151,880 | $ | 348,381 | |||||||||
Weighted Average Rate | 3.25 | % | 2.90 | % | 4.56 | % | 3.73 | % | 4.64 | % | 4.36 | % | 4.79 | % | 4.73 | % | |||||||||
47
Forest City Realty Trust, Inc. and Subsidiaries
Supplemental Financial Information
Scheduled Maturities Table: Nonrecourse Debt (dollars in thousands) (continued)
As of June 30, 2017
Year Ending December 31, 2021 | Thereafter | ||||||||||||||||||||||||
Full Consolidation | Noncontrolling Interest | Company Share of Unconsolidated Entities | Company Share | Full Consolidation | Noncontrolling Interest | Company Share of Unconsolidated Entities | Company Share | ||||||||||||||||||
Fixed: | |||||||||||||||||||||||||
Fixed-rate debt | $ | 171,208 | $ | 4,923 | $ | 60,694 | $ | 226,979 | $ | 1,089,488 | $ | 105,719 | $ | 1,308,503 | $ | 2,292,272 | |||||||||
Weighted average rate | 4.65 | % | 3.49 | % | 4.75 | % | 4.70 | % | 3.99 | % | 4.41 | % | 4.09 | % | 4.03 | % | |||||||||
Variable: | |||||||||||||||||||||||||
Variable-rate debt | 22,051 | — | 600 | 22,651 | 21,424 | (1,974 | ) | 700 | 24,098 | ||||||||||||||||
Weighted average rate | 4.66 | % | — | 2.02 | % | 4.59 | % | 3.42 | % | — | 2.02 | % | 3.38 | % | |||||||||||
Tax-Exempt | — | — | — | — | 508,834 | 140,779 | 184,204 | 552,259 | |||||||||||||||||
Weighted average rate | — | — | — | — | 1.84 | % | 1.78 | % | 2.12 | % | 1.95 | % | |||||||||||||
Total variable-rate debt | 22,051 | — | 600 | 22,651 | 530,258 | 138,805 | 184,904 | 576,357 | |||||||||||||||||
Total Nonrecourse Debt | $ | 193,259 | $ | 4,923 | $ | 61,294 | $ | 249,630 | $ | 1,619,746 | $ | 244,524 | $ | 1,493,407 | $ | 2,868,629 | |||||||||
Weighted Average Rate | 4.65 | % | 3.49 | % | 4.72 | % | 4.69 | % | 3.31 | % | 2.92 | % | 3.85 | % | 3.62 | % | |||||||||
Total | |||||||||||||||||||||||||
Full Consolidation | Noncontrolling Interest | Company Share of Unconsolidated Entities | Company Share | ||||||||||||||||||||||
Fixed: | |||||||||||||||||||||||||
Fixed-rate debt | $ | 1,907,304 | $ | 155,629 | $ | 1,890,498 | $ | 3,642,173 | |||||||||||||||||
Weighted average rate | 4.38 | % | 4.46 | % | 4.36 | % | 4.37 | % | |||||||||||||||||
Variable: | |||||||||||||||||||||||||
Variable-rate debt | 668,476 | 245,455 | 330,416 | 753,437 | |||||||||||||||||||||
Weighted average rate | 3.32 | % | 3.13 | % | 4.86 | % | 4.06 | % | |||||||||||||||||
Tax-Exempt | 618,109 | 142,395 | 204,204 | 679,918 | |||||||||||||||||||||
Weighted average rate | 1.87 | % | 1.78 | % | 2.16 | % | 1.97 | % | |||||||||||||||||
Total variable-rate debt | 1,286,585 | 387,850 | 534,620 | 1,433,355 | |||||||||||||||||||||
Total Nonrecourse Debt | $ | 3,193,889 | $ | 543,479 | $ | 2,425,118 | $ | 5,075,528 | |||||||||||||||||
Net unamortized mortgage procurement costs | (35,609 | ) | (9,520 | ) | (23,778 | ) | $ | (49,867 | ) | ||||||||||||||||
Total Nonrecourse Debt, net | $ | 3,158,280 | $ | 533,959 | $ | 2,401,340 | $ | 5,025,661 | |||||||||||||||||
Weighted Average Rate | 3.68 | % | 3.16 | % | 4.24 | % | 4.00 | % | |||||||||||||||||
48
Forest City Realty Trust, Inc. and Subsidiaries - Appendix
Second Quarter 2017
Index
General Information | |
Selected Financial Information | |
Asset, Liability and Equity Information | |
Revenue and Expense Information | |
Interest Expense Information | |
Capital Expenditures Information | |
Adjusted EBITDA and NOI by Segment - Fully Consolidated Entities, Noncontrolling Interest, Company Share of Unconsolidated Entities and Company Share of Discontinued Operations | |
49
Forest City Realty Trust, Inc. and Subsidiaries
Appendix - General Information
General Information
This appendix to this supplemental package contains certain financial information of entities accounted for using the full consolidated accounting method (“Fully Consolidated Entities”), financial information on our partners share of entities accounted for using the full consolidated accounting method (“Noncontrolling Interest”), financial information on our share of entities that we do not control and therefore account for using the equity method of accounting (“Company Share of Unconsolidated Entities”) and financial information on our share of entities qualifying for discontinued operations reporting (“Company Share of Discontinued Operations”).
Amounts in columns labeled “Fully Consolidated Entities” represent 100% of the activity related to all entities that are consolidated under GAAP. Amounts in the columns labeled “Company Share of Unconsolidated Entities” were derived on a property-by-property basis by applying to each financial statement line item the ownership percentage interest used to arrive at our share of net income during the period when applying the equity method of accounting. Similar calculations were performed for the amounts in the columns labeled “Noncontrolling Interest”, which represent assets we consolidate but own less than 100%, and amounts in the columns labeled “Company Share of Discontinued Operations”. A financial statement user is able to calculate Total Company Ownership by beginning with the “Fully Consolidated Entities” column, subtracting the column labeled “Noncontrolling Interest” and adding the columns labeled “Company Share of Unconsolidated Entities” and “Company Share of Discontinued Operations”.
We believe disclosing financial information on Fully Consolidated Entities, Noncontrolling Interest, Company Share of Unconsolidated Entities and Company Share of Discontinued Operations is essential to allow our financial statement users the ability to arrive at our Total Company Ownership for all of our ownership interests, irrespective of the accounting method used to account for the entity. We believe it assists investors and analysts in estimating our economic interest in our consolidated and unconsolidated joint ventures when read in conjunction with the Company’s results under GAAP. The calculation of Total Company Ownership financial information has limitations as an analytical tool. Some of these limitations include:
• | The amounts shown in the Noncontrolling Interest, Company Share of Unconsolidated Entities and Company Share of Discontinued Operations columns were derived by applying our ownership percentage interest used to arrive at our share of net income during the period when applying the equity method of accounting and calculating income/loss to minority partners under noncontrolling interest accounting as well as our share of entities qualifying for discontinued operations reporting and may not accurately depict the legal and economic implications of holding a non-controlling interest of an entity; and |
• | Other companies in our industry may calculate their total company ownership amounts differently than we do, limiting the usefulness as a comparative measure. |
Because of these limitations, the calculation of Total Company Ownership should not be considered in isolation or as a substitute for our financial statements as reported under GAAP. We suggest you compensate for these limitations by relying primarily on our GAAP results and using the Total Company Ownership information only supplementally.
50
Forest City Realty Trust, Inc. and Subsidiaries
Appendix - Asset, Liability and Equity Information
June 30, 2017 | December 31, 2016 | ||||||||||||
Noncontrolling Interest | Company Share of Unconsolidated Investments | Noncontrolling Interest | Company Share of Unconsolidated Investments | ||||||||||
(in thousands) | |||||||||||||
Assets | |||||||||||||
Real Estate | |||||||||||||
Completed rental properties | |||||||||||||
Office | $ | 111,319 | $ | 218,654 | $ | 110,427 | $ | 137,312 | |||||
Apartments | 368,683 | 807,161 | 374,128 | 970,009 | |||||||||
Retail | — | 1,982,186 | — | 1,979,903 | |||||||||
Total Operations | 480,002 | 3,008,001 | 484,555 | 3,087,224 | |||||||||
Recently-Opened Properties/Redevelopment | 427,885 | 83,906 | 339,735 | 123,511 | |||||||||
Corporate | — | — | — | — | |||||||||
Total completed rental properties | 907,887 | 3,091,907 | 824,290 | 3,210,735 | |||||||||
Projects under construction | |||||||||||||
Office | — | — | — | — | |||||||||
Apartments | 164,978 | 244,787 | 210,836 | 251,938 | |||||||||
Retail | — | 22,980 | — | 17,618 | |||||||||
Total projects under construction | 164,978 | 267,767 | 210,836 | 269,556 | |||||||||
Projects under development | |||||||||||||
Operating properties | — | 21,636 | — | 24,121 | |||||||||
Office | 9,377 | 3,289 | 9,021 | 3,287 | |||||||||
Apartments | — | 57,936 | — | 26,092 | |||||||||
Retail | — | 1,320 | — | 1,320 | |||||||||
Total projects under development | 9,377 | 84,181 | 9,021 | 54,820 | |||||||||
Total projects under construction and development | 174,355 | 351,948 | 219,857 | 324,376 | |||||||||
Land inventory | 5,686 | 1,399 | 5,026 | 4,359 | |||||||||
Total Real Estate | 1,087,928 | 3,445,254 | 1,049,173 | 3,539,470 | |||||||||
Less accumulated depreciation | (102,169 | ) | (745,943 | ) | (90,917 | ) | (790,385 | ) | |||||
Real Estate, net | 985,759 | 2,699,311 | 958,256 | 2,749,085 | |||||||||
Cash and equivalents | 27,157 | 77,959 | 22,269 | 69,128 | |||||||||
Restricted cash | 7,622 | 91,395 | 7,429 | 109,093 | |||||||||
Accounts receivable, net | 8,064 | 54,975 | 9,693 | 55,751 | |||||||||
Notes receivable | (8,191 | ) | 19,789 | 12,343 | 17,239 | ||||||||
Investments in and advances to unconsolidated entities | (58,332 | ) | (557,308 | ) | (58,189 | ) | (569,864 | ) | |||||
Lease procurement costs, net | 3,177 | 59,671 | 3,040 | 60,150 | |||||||||
Prepaid expenses and other deferred costs, net | 7,134 | 19,026 | 7,192 | 23,458 | |||||||||
Intangible assets, net | 12,869 | 11,944 | 14,008 | 12,446 | |||||||||
Total Assets | $ | 985,259 | $ | 2,476,762 | $ | 976,041 | $ | 2,526,486 | |||||
51
Forest City Realty Trust, Inc. and Subsidiaries
Appendix - Asset, Liability and Equity Information
June 30, 2017 | December 31, 2016 | ||||||||||||
Noncontrolling Interest | Company Share of Unconsolidated Investments | Noncontrolling Interest | Company Share of Unconsolidated Investments | ||||||||||
(in thousands) | |||||||||||||
Liabilities and Equity | |||||||||||||
Liabilities | |||||||||||||
Nonrecourse mortgage debt and notes payable, net | |||||||||||||
Completed rental properties | |||||||||||||
Office | $ | 40,988 | $ | 179,641 | $ | 41,605 | $ | 112,409 | |||||
Apartments | 201,995 | 571,672 | 209,660 | 643,307 | |||||||||
Retail | — | 1,354,717 | — | 1,366,375 | |||||||||
Total Operations | 242,983 | 2,106,030 | 251,265 | 2,122,091 | |||||||||
Recently-Opened Properties/Redevelopment | 253,576 | 29,694 | 207,577 | 75,482 | |||||||||
Total completed rental properties | 496,559 | 2,135,724 | 458,842 | 2,197,573 | |||||||||
Projects under construction | |||||||||||||
Office | — | — | — | — | |||||||||
Apartments | 37,400 | 108,805 | 49,485 | 98,497 | |||||||||
Retail | — | — | — | — | |||||||||
Total projects under construction | 37,400 | 108,805 | 49,485 | 98,497 | |||||||||
Projects under development | |||||||||||||
Operating properties | — | — | — | — | |||||||||
Office | — | — | — | — | |||||||||
Apartments | — | 156,811 | — | 154,599 | |||||||||
Retail | — | — | — | — | |||||||||
Total projects under development | — | 156,811 | — | 154,599 | |||||||||
Total projects under construction and development | 37,400 | 265,616 | 49,485 | 253,096 | |||||||||
Land inventory | — | — | — | — | |||||||||
Nonrecourse mortgage debt and notes payable, net | 533,959 | 2,401,340 | 508,327 | 2,450,669 | |||||||||
Revolving credit facility | — | — | — | — | |||||||||
Term loan, net | — | — | — | — | |||||||||
Convertible senior debt, net | — | — | — | — | |||||||||
Construction payables | 45,709 | 50,492 | 53,749 | 65,684 | |||||||||
Operating accounts payable and accrued expenses | 33,844 | 159,971 | 27,753 | 161,767 | |||||||||
Accrued derivative liability | — | 3,190 | 654 | 4,543 | |||||||||
Total Accounts payable, accrued expenses and other liabilities | 79,553 | 213,653 | 82,156 | 231,994 | |||||||||
Cash distributions and losses in excess of investments in unconsolidated entities | (16,893 | ) | (138,231 | ) | (16,603 | ) | (156,177 | ) | |||||
Total Liabilities | 596,619 | 2,476,762 | 573,880 | 2,526,486 | |||||||||
Equity | |||||||||||||
Stockholders’ Equity | |||||||||||||
Stockholders’ equity before accumulated other comprehensive loss | — | — | — | — | |||||||||
Accumulated other comprehensive loss | — | — | — | — | |||||||||
Total Stockholders’ Equity | — | — | — | — | |||||||||
Noncontrolling interest | 388,640 | — | 402,161 | — | |||||||||
Total Equity | 388,640 | — | 402,161 | — | |||||||||
Total Liabilities and Equity | $ | 985,259 | $ | 2,476,762 | $ | 976,041 | $ | 2,526,486 | |||||
52
Forest City Realty Trust, Inc. and Subsidiaries
Appendix - Revenue and Expense Information
Three Months Ended June 30, 2017 | Three Months Ended June 30, 2016 | ||||||||||||
Noncontrolling Interest | Company Share of Unconsolidated Investments | Noncontrolling Interest | Company Share of Unconsolidated Investments | ||||||||||
(in thousands) | |||||||||||||
Revenues | |||||||||||||
Rental | $ | 16,645 | $ | 64,170 | $ | 13,412 | $ | 62,392 | |||||
Tenant recoveries | 2,119 | 17,644 | 1,632 | 16,926 | |||||||||
Service and management fees | 86 | 2,358 | 43 | 2,329 | |||||||||
Parking and other | 647 | 4,270 | 917 | 5,079 | |||||||||
Arena | — | — | — | — | |||||||||
Land sales | 1,377 | 21,716 | 822 | 651 | |||||||||
Subsidized Senior Housing | — | 7,462 | — | 12,543 | |||||||||
Military Housing | — | — | — | — | |||||||||
Total revenues | 20,874 | 117,620 | 16,826 | 99,920 | |||||||||
Expenses | |||||||||||||
Property operating and management | 6,448 | 27,592 | 4,505 | 24,064 | |||||||||
Real estate taxes | 2,533 | 8,870 | 1,976 | 8,134 | |||||||||
Ground rent | 51 | 2,074 | 133 | 2,677 | |||||||||
Arena operating | — | — | — | — | |||||||||
Cost of land sales | 357 | 21,340 | 161 | 401 | |||||||||
Subsidized Senior Housing operating | — | 3,802 | — | 8,202 | |||||||||
Military Housing operating | — | — | — | — | |||||||||
Corporate general and administrative | — | — | — | — | |||||||||
Organizational transformation and termination benefits | — | — | — | — | |||||||||
9,389 | 63,678 | 6,775 | 43,478 | ||||||||||
Depreciation and amortization | 6,853 | 23,195 | 5,463 | 22,587 | |||||||||
Write-offs of abandoned development projects and demolition costs | — | 396 | — | — | |||||||||
Impairment of real estate | — | — | — | — | |||||||||
Total expenses | 16,242 | 87,269 | 12,238 | 66,065 | |||||||||
Operating income (loss) | 4,632 | 30,351 | 4,588 | 33,855 | |||||||||
Interest and other income | 448 | 451 | 392 | 390 | |||||||||
Net gain on disposition of interest in unconsolidated entities | — | 34,596 | — | 12,613 | |||||||||
Interest expense | (3,970 | ) | (23,926 | ) | (3,049 | ) | (25,504 | ) | |||||
Amortization of mortgage procurement costs | (341 | ) | (743 | ) | (267 | ) | (882 | ) | |||||
Loss on extinguishment of debt | — | (2 | ) | — | (849 | ) | |||||||
Earnings (loss) before income taxes and earnings (loss) from unconsolidated entities | 769 | 40,727 | 1,664 | 19,623 | |||||||||
Equity in earnings | 130 | (6,131 | ) | 96 | (7,010 | ) | |||||||
Net gain on disposition of interest in unconsolidated entities | 657 | (34,596 | ) | — | (12,613 | ) | |||||||
787 | (40,727 | ) | 96 | (19,623 | ) | ||||||||
Earnings (loss) before income taxes | 1,556 | — | 1,760 | — | |||||||||
Income tax expense (benefit) of taxable REIT subsidiaries | |||||||||||||
Current | — | — | — | — | |||||||||
Deferred | — | — | — | — | |||||||||
— | — | — | — | ||||||||||
Earnings (loss) before loss on disposal of real estate | 1,556 | — | 1,760 | — | |||||||||
Net gain on disposition of interest in development project, net of tax | — | — | — | — | |||||||||
Net gain (loss) on disposition of full or partial interests in rental properties, net of tax | — | — | — | — | |||||||||
Earnings (loss) from continuing operations | 1,556 | — | 1,760 | — | |||||||||
Discontinued operations, net of tax | |||||||||||||
Operating loss from rental properties | — | — | — | — | |||||||||
Gain (loss) on disposition of rental properties | — | — | — | — | |||||||||
Equity in earnings (loss) | — | — | — | — | |||||||||
— | — | — | — | ||||||||||
Net earnings (loss) | 1,556 | — | 1,760 | — | |||||||||
Noncontrolling interests, gross of tax | |||||||||||||
Earnings from continuing operations attributable to noncontrolling interests | (1,556 | ) | — | (1,760 | ) | — | |||||||
Loss from discontinued operations attributable to noncontrolling interests | — | — | — | — | |||||||||
(1,556 | ) | — | (1,760 | ) | — | ||||||||
Net earnings (loss) attributable to Forest City Realty Trust, Inc. | $ | — | $ | — | $ | — | $ | — | |||||
53
Forest City Realty Trust, Inc. and Subsidiaries
Appendix - Revenue and Expense Information
Six Months Ended June 30, 2017 | Six Months Ended June 30, 2016 | |||||||||||||||
Noncontrolling Interest | Company Share of Unconsolidated Investments | Noncontrolling Interest | Company Share of Unconsolidated Investments | Company Share of Discontinued Operations | ||||||||||||
(in thousands) | ||||||||||||||||
Revenues | ||||||||||||||||
Rental | $ | 32,809 | $ | 127,569 | $ | 26,200 | $ | 123,420 | $ | — | ||||||
Tenant recoveries | 3,865 | 35,335 | 3,229 | 32,938 | — | |||||||||||
Service and management fees | 127 | 4,890 | 81 | 3,932 | — | |||||||||||
Parking and other | 1,655 | 9,042 | 1,748 | 9,352 | — | |||||||||||
Arena | — | — | — | — | 8,136 | |||||||||||
Land sales | 1,907 | 24,568 | 1,213 | 1,317 | — | |||||||||||
Subsidized Senior Housing | — | 19,478 | — | 25,432 | — | |||||||||||
Military Housing | — | — | — | 971 | — | |||||||||||
Total revenues | 40,363 | 220,882 | 32,471 | 197,362 | 8,136 | |||||||||||
Expenses | ||||||||||||||||
Property operating and management | 13,724 | 53,040 | 9,669 | 47,288 | — | |||||||||||
Real estate taxes | 4,678 | 17,647 | 3,936 | 15,909 | — | |||||||||||
Ground rent | 103 | 4,859 | 267 | 5,335 | — | |||||||||||
Arena operating | — | — | — | — | 6,938 | |||||||||||
Cost of land sales | 516 | 23,408 | 193 | 401 | — | |||||||||||
Subsidized Senior Housing operating | — | 11,810 | — | 15,923 | — | |||||||||||
Military Housing operating | — | — | — | 455 | — | |||||||||||
Corporate general and administrative | — | — | — | — | — | |||||||||||
Organizational transformation and termination benefits | — | — | — | — | — | |||||||||||
19,021 | 110,764 | 14,065 | 85,311 | 6,938 | ||||||||||||
Depreciation and amortization | 13,549 | 45,387 | 9,790 | 43,349 | 35 | |||||||||||
Write-offs of abandoned development projects and demolition costs | — | 747 | — | — | — | |||||||||||
Impairment of real estate | — | — | — | — | — | |||||||||||
Total expenses | 32,570 | 156,898 | 23,855 | 128,660 | 6,973 | |||||||||||
Operating income | 7,793 | 63,984 | 8,616 | 68,702 | 1,163 | |||||||||||
Interest and other income | 972 | 1,976 | 769 | 755 | — | |||||||||||
Net gain on disposition of interest in unconsolidated entities | — | 52,297 | — | 12,613 | — | |||||||||||
Interest expense | (7,534 | ) | (47,346 | ) | (5,038 | ) | (49,845 | ) | (1,738 | ) | ||||||
Amortization of mortgage procurement costs | (628 | ) | (1,640 | ) | (459 | ) | (1,794 | ) | (21 | ) | ||||||
Loss on extinguishment of debt | — | (1,625 | ) | — | (849 | ) | — | |||||||||
Earnings (loss) before income taxes and earnings (loss) from unconsolidated entities | 603 | 67,646 | 3,888 | 29,582 | (596 | ) | ||||||||||
Equity in earnings | 190 | (15,349 | ) | 178 | (16,969 | ) | (1,400 | ) | ||||||||
Net gain on disposition of interest in unconsolidated entities | 657 | (52,297 | ) | — | (12,613 | ) | — | |||||||||
847 | (67,646 | ) | 178 | (29,582 | ) | (1,400 | ) | |||||||||
Earnings (loss) before income taxes | 1,450 | — | 4,066 | — | (1,996 | ) | ||||||||||
Income tax expense (benefit) of taxable REIT subsidiaries | ||||||||||||||||
Current | — | — | — | — | (431 | ) | ||||||||||
Deferred | — | — | — | — | (393 | ) | ||||||||||
— | — | — | — | (824 | ) | |||||||||||
Earnings (loss) before gain on disposal of real estate | 1,450 | — | 4,066 | — | (1,172 | ) | ||||||||||
Net gain (loss) on disposition of interest in development project, net of tax | — | — | — | — | — | |||||||||||
Net gain (loss) on disposition of full or partial interests in rental properties, net of tax | — | — | (185 | ) | — | 64,553 | ||||||||||
Earnings (loss) from continuing operations | 1,450 | — | 3,881 | — | 63,381 | |||||||||||
Discontinued operations, net of tax | ||||||||||||||||
Operating loss from rental properties | — | — | (776 | ) | — | 350 | ||||||||||
Gain on disposition of disposal group | — | — | — | — | (64,553 | ) | ||||||||||
Equity in earnings (loss) | — | — | — | — | 822 | |||||||||||
— | — | (776 | ) | — | (63,381 | ) | ||||||||||
Net earnings (loss) | 1,450 | — | 3,105 | — | — | |||||||||||
Noncontrolling interests, gross of tax | ||||||||||||||||
Earnings from continuing operations attributable to noncontrolling interests | (1,450 | ) | — | (3,881 | ) | — | — | |||||||||
Loss from discontinued operations attributable to noncontrolling interests | — | — | 776 | — | — | |||||||||||
(1,450 | ) | — | (3,105 | ) | — | — | ||||||||||
Net earnings (loss) attributable to Forest City Realty Trust, Inc. | $ | — | $ | — | $ | — | $ | — | $ | — | ||||||
54
Forest City Realty Trust, Inc. and Subsidiaries
Appendix
Interest Expense Information
Three Months Ended June 30, 2017 | Three Months Ended June 30, 2016 | |||||||||||
Noncontrolling Interest | Company Share of Unconsolidated Entities | Noncontrolling Interest | Company Share of Unconsolidated Entities | |||||||||
(in thousands) | ||||||||||||
Amortization and mark-to-market adjustments of derivative instruments | $ | 4 | $ | — | $ | (5 | ) | $ | 12 | |||
Interest incurred | 4,510 | 26,467 | 3,131 | 27,917 | ||||||||
Interest capitalized | (544 | ) | (2,541 | ) | (77 | ) | (2,425 | ) | ||||
Net interest expense | $ | 3,970 | $ | 23,926 | $ | 3,049 | $ | 25,504 | ||||
Six Months Ended June 30, 2017 | Six Months Ended June 30, 2016 | ||||||||||||||
Noncontrolling Interest | Company Share of Unconsolidated Entities | Noncontrolling Interest | Company Share of Unconsolidated Entities | Company Share of Discontinued Operations | |||||||||||
(in thousands) | |||||||||||||||
Amortization and mark-to-market adjustments of derivative instruments | $ | 13 | $ | — | $ | 2 | $ | 16 | $ | — | |||||
Interest incurred | 8,689 | 52,747 | 5,631 | 54,560 | 1,738 | ||||||||||
Interest capitalized | (1,168 | ) | (5,401 | ) | (595 | ) | (4,731 | ) | — | ||||||
Net interest expense | $ | 7,534 | $ | 47,346 | $ | 5,038 | $ | 49,845 | $ | 1,738 | |||||
Capital Expenditures Information
Six Months Ended June 30, 2017 | Six Months Ended June 30, 2016 | |||||||||||
Noncontrolling Interest | Company Share of Unconsolidated Entities | Noncontrolling Interest | Company Share of Unconsolidated Entities | |||||||||
(in thousands) | ||||||||||||
Operating properties: | ||||||||||||
Office Segment | $ | 337 | $ | 535 | $ | 78 | $ | 375 | ||||
Apartment Segment | 824 | 7,995 | 463 | 5,771 | ||||||||
Retail Segment | — | 6,749 | — | 4,695 | ||||||||
Total operating properties | 1,161 | 15,279 | 541 | 10,841 | ||||||||
Corporate Segment | — | — | — | — | ||||||||
Tenant improvements: | ||||||||||||
Office Segment | 218 | 733 | 189 | 3,195 | ||||||||
Retail Segment | — | 6,702 | — | 5,304 | ||||||||
Total capital expenditures | $ | 1,379 | $ | 22,714 | $ | 730 | $ | 19,340 | ||||
55
Forest City Realty Trust, Inc. and Subsidiaries
Appendix
Summary of Adjusted EBITDA and NOI by Segment - Three and Six Months Ended June 30, 2017 and 2016 (in thousands)
Three Months Ended June 30, 2017 | |||||||||||||||||||||
Fully Consolidated Entities | Office | Apartments | Retail | Total Operations | Development | Corporate | Total | ||||||||||||||
(in thousands) | |||||||||||||||||||||
Revenues | |||||||||||||||||||||
Rental | $ | 86,119 | $ | 66,282 | $ | 6,511 | $ | 158,912 | $ | 7,052 | $ | — | $ | 165,964 | |||||||
Tenant recoveries | 23,689 | 518 | 3,493 | 27,700 | 432 | — | 28,132 | ||||||||||||||
Service and management fees | 444 | 2,076 | 4,806 | 7,326 | 4,037 | — | 11,363 | ||||||||||||||
Other revenues (includes Subsidized Senior Housing) | 7,131 | 3,438 | 234 | 10,803 | 20,180 | — | 30,983 | ||||||||||||||
117,383 | 72,314 | 15,044 | 204,741 | 31,701 | — | 236,442 | |||||||||||||||
Expenses | |||||||||||||||||||||
Property operating and management | (29,631 | ) | (25,257 | ) | (8,967 | ) | (63,855 | ) | (14,303 | ) | — | (78,158 | ) | ||||||||
Real estate taxes | (11,934 | ) | (6,450 | ) | (1,519 | ) | (19,903 | ) | (1,454 | ) | — | (21,357 | ) | ||||||||
Ground rent | (3,173 | ) | (483 | ) | (110 | ) | (3,766 | ) | — | — | (3,766 | ) | |||||||||
Other expenses (includes Subsidized Senior Housing) | — | — | — | — | (7,694 | ) | (20,881 | ) | (28,575 | ) | |||||||||||
(44,738 | ) | (32,190 | ) | (10,596 | ) | (87,524 | ) | (23,451 | ) | (20,881 | ) | (131,856 | ) | ||||||||
Less organizational transformation and termination benefits | — | — | — | — | — | 6,863 | 6,863 | ||||||||||||||
Write-offs of abandoned development projects and demolition costs | — | — | — | — | (1,596 | ) | — | (1,596 | ) | ||||||||||||
Interest and other income | — | — | — | — | — | 9,896 | 9,896 | ||||||||||||||
Adjusted EBITDA attributable to Fully Consolidated Entities | $ | 72,645 | $ | 40,124 | $ | 4,448 | $ | 117,217 | $ | 6,654 | $ | (4,122 | ) | $ | 119,749 | ||||||
Exclude: | |||||||||||||||||||||
Land sales | — | — | — | — | (17,762 | ) | — | (17,762 | ) | ||||||||||||
Other land development revenues | — | — | — | — | (1,862 | ) | — | (1,862 | ) | ||||||||||||
Cost of land sales | — | — | — | — | 7,694 | — | 7,694 | ||||||||||||||
Other land development expenses | — | — | — | — | 2,034 | — | 2,034 | ||||||||||||||
Corporate general and administrative expenses | — | — | — | — | — | 14,018 | 14,018 | ||||||||||||||
Write-offs of abandoned development projects and demolition costs | — | — | — | — | 1,596 | — | 1,596 | ||||||||||||||
Interest and other income | — | — | — | — | — | (9,896 | ) | (9,896 | ) | ||||||||||||
Subtotal NOI exclusions | $ | — | $ | — | $ | — | $ | — | $ | (8,300 | ) | $ | 4,122 | $ | (4,178 | ) | |||||
Net Operating Income attributable to Fully Consolidated Entities | $ | 72,645 | $ | 40,124 | $ | 4,448 | $ | 117,217 | $ | (1,646 | ) | $ | — | $ | 115,571 | ||||||
NOI exclusions per above | 4,178 | ||||||||||||||||||||
Depreciation and Amortization | (65,747 | ) | |||||||||||||||||||
Interest Expense | (28,901 | ) | |||||||||||||||||||
Amortization of mortgage procurement costs | (1,507 | ) | |||||||||||||||||||
Net loss on extinguishment of debt | — | ||||||||||||||||||||
Net gain on disposition of interest in unconsolidated entities | — | ||||||||||||||||||||
Organizational transformation and termination benefits | (6,863 | ) | |||||||||||||||||||
Earnings (loss) from unconsolidated entities | 41,514 | ||||||||||||||||||||
Earnings (loss) before income taxes | $ | 58,245 | |||||||||||||||||||
Margin % (based on Adjusted EBITDA) | 61.9 | % | 55.5 | % | 29.6 | % | 57.3 | % | 21.0 | % | 0.0 | % | 50.6 | % | |||||||
56
Forest City Realty Trust, Inc. and Subsidiaries
Appendix
Summary of Adjusted EBITDA and NOI by Segment - Three and Six Months Ended June 30, 2017 and 2016 (in thousands) (continued)
Three Months Ended June 30, 2017 | |||||||||||||||||||||
Noncontrolling Interest | Office | Apartments | Retail | Total Operations | Development | Corporate | Total | ||||||||||||||
(in thousands) | |||||||||||||||||||||
Revenues | |||||||||||||||||||||
Rental | $ | 3,307 | $ | 9,087 | $ | — | $ | 12,394 | $ | 4,251 | $ | — | $ | 16,645 | |||||||
Tenant recoveries | 2,052 | 52 | — | 2,104 | 15 | — | 2,119 | ||||||||||||||
Service and management fees | 1 | (3 | ) | — | (2 | ) | 88 | — | 86 | ||||||||||||
Other revenues (includes Subsidized Senior Housing) | 145 | 226 | — | 371 | 1,653 | — | 2,024 | ||||||||||||||
5,505 | 9,362 | — | 14,867 | 6,007 | — | 20,874 | |||||||||||||||
Expenses | |||||||||||||||||||||
Property operating and management | (1,908 | ) | (2,527 | ) | — | (4,435 | ) | (2,013 | ) | — | (6,448 | ) | |||||||||
Real estate taxes | (747 | ) | (933 | ) | — | (1,680 | ) | (853 | ) | — | (2,533 | ) | |||||||||
Ground rent | (80 | ) | 29 | — | (51 | ) | — | — | (51 | ) | |||||||||||
Other expenses (includes Subsidized Senior Housing) | — | — | — | — | (357 | ) | — | (357 | ) | ||||||||||||
(2,735 | ) | (3,431 | ) | — | (6,166 | ) | (3,223 | ) | — | (9,389 | ) | ||||||||||
Less organizational transformation and termination benefits | — | — | — | — | — | — | — | ||||||||||||||
Write-offs of abandoned development projects and demolition costs | — | — | — | — | — | — | — | ||||||||||||||
Interest and other income | — | — | — | — | — | 448 | 448 | ||||||||||||||
Adjusted EBITDA attributable to Noncontrolling Interest | $ | 2,770 | $ | 5,931 | $ | — | $ | 8,701 | $ | 2,784 | $ | 448 | $ | 11,933 | |||||||
Exclude: | |||||||||||||||||||||
Land sales | — | — | — | — | (1,377 | ) | — | (1,377 | ) | ||||||||||||
Other land development revenues | — | — | — | — | (186 | ) | — | (186 | ) | ||||||||||||
Cost of land sales | — | — | — | — | 357 | — | 357 | ||||||||||||||
Other land development expenses | — | — | — | — | 204 | — | 204 | ||||||||||||||
Corporate general and administrative expenses | — | — | — | — | — | — | — | ||||||||||||||
Write-offs of abandoned development projects and demolition costs | — | — | — | — | — | — | — | ||||||||||||||
Interest and other income | — | — | — | — | — | (448 | ) | (448 | ) | ||||||||||||
Subtotal NOI exclusions | $ | — | $ | — | $ | — | $ | — | $ | (1,002 | ) | $ | (448 | ) | $ | (1,450 | ) | ||||
Net Operating Income attributable to Noncontrolling Interest | $ | 2,770 | $ | 5,931 | $ | — | $ | 8,701 | $ | 1,782 | $ | — | $ | 10,483 | |||||||
NOI exclusions per above | 1,450 | ||||||||||||||||||||
Depreciation and Amortization | (6,853 | ) | |||||||||||||||||||
Interest Expense | (3,970 | ) | |||||||||||||||||||
Amortization of mortgage procurement costs | (341 | ) | |||||||||||||||||||
Net loss on extinguishment of debt | — | ||||||||||||||||||||
Net gain on disposition of interest in unconsolidated entities | — | ||||||||||||||||||||
Organizational transformation and termination benefits | — | ||||||||||||||||||||
Earnings (loss) from unconsolidated entities | 787 | ||||||||||||||||||||
Earnings (loss) before income taxes | $ | 1,556 | |||||||||||||||||||
Margin % (based on Adjusted EBITDA) | 50.3 | % | 63.4 | % | 0.0 | % | 58.5 | % | 46.3 | % | 0.0 | % | 57.2 | % | |||||||
57
Forest City Realty Trust, Inc. and Subsidiaries
Appendix
Summary of Adjusted EBITDA and NOI by Segment - Three and Six Months Ended June 30, 2017 and 2016 (in thousands) (continued)
Three Months Ended June 30, 2017 | |||||||||||||||||||||
Company Share of Unconsolidated Entities | Office | Apartments | Retail | Total Operations | Development | Corporate | Total | ||||||||||||||
(in thousands) | |||||||||||||||||||||
Revenues | |||||||||||||||||||||
Rental | $ | 6,849 | $ | 19,662 | $ | 37,233 | $ | 63,744 | $ | 426 | $ | — | $ | 64,170 | |||||||
Tenant recoveries | 1,222 | 105 | 16,108 | 17,435 | 209 | — | 17,644 | ||||||||||||||
Service and management fees | 465 | 1,030 | 927 | 2,422 | (64 | ) | — | 2,358 | |||||||||||||
Other revenues (includes Subsidized Senior Housing) | 482 | 8,425 | 2,804 | 11,711 | 21,737 | — | 33,448 | ||||||||||||||
9,018 | 29,222 | 57,072 | 95,312 | 22,308 | — | 117,620 | |||||||||||||||
Expenses | |||||||||||||||||||||
Property operating and management | (2,102 | ) | (7,214 | ) | (14,882 | ) | (24,198 | ) | (3,394 | ) | — | (27,592 | ) | ||||||||
Real estate taxes | (844 | ) | (1,742 | ) | (6,210 | ) | (8,796 | ) | (74 | ) | — | (8,870 | ) | ||||||||
Ground rent | (593 | ) | (254 | ) | (1,230 | ) | (2,077 | ) | 3 | — | (2,074 | ) | |||||||||
Other expenses (includes Subsidized Senior Housing) | — | (3,802 | ) | — | (3,802 | ) | (21,340 | ) | — | (25,142 | ) | ||||||||||
(3,539 | ) | (13,012 | ) | (22,322 | ) | (38,873 | ) | (24,805 | ) | — | (63,678 | ) | |||||||||
Less organizational transformation and termination benefits | — | — | — | — | — | — | — | ||||||||||||||
Write-offs of abandoned development projects and demolition costs | — | — | — | — | (396 | ) | — | (396 | ) | ||||||||||||
Interest and other income | — | — | — | — | — | 451 | 451 | ||||||||||||||
Adjusted EBITDA attributable to Unconsolidated Entities | $ | 5,479 | $ | 16,210 | $ | 34,750 | $ | 56,439 | $ | (2,893 | ) | $ | 451 | $ | 53,997 | ||||||
Exclude: | |||||||||||||||||||||
Land sales | — | — | — | — | (21,716 | ) | — | (21,716 | ) | ||||||||||||
Other land development revenues | — | — | — | — | — | — | — | ||||||||||||||
Cost of land sales | — | — | — | — | 21,340 | — | 21,340 | ||||||||||||||
Other land development expenses | — | — | — | — | 63 | — | 63 | ||||||||||||||
Corporate general and administrative expenses | — | — | — | — | — | — | — | ||||||||||||||
Write-offs of abandoned development projects and demolition costs | — | — | — | — | 396 | — | 396 | ||||||||||||||
Interest and other income | — | — | — | — | — | (451 | ) | (451 | ) | ||||||||||||
Subtotal NOI exclusions | $ | — | $ | — | $ | — | $ | — | $ | 83 | $ | (451 | ) | $ | (368 | ) | |||||
Net Operating Income attributable to Unconsolidated Entities | $ | 5,479 | $ | 16,210 | $ | 34,750 | $ | 56,439 | $ | (2,810 | ) | $ | — | $ | 53,629 | ||||||
NOI exclusions per above | 368 | ||||||||||||||||||||
Depreciation and Amortization | (23,195 | ) | |||||||||||||||||||
Interest Expense | (23,926 | ) | |||||||||||||||||||
Amortization of mortgage procurement costs | (743 | ) | |||||||||||||||||||
Net loss on extinguishment of debt | (2 | ) | |||||||||||||||||||
Net gain on disposition of interest in unconsolidated entities | 34,596 | ||||||||||||||||||||
Organizational transformation and termination benefits | — | ||||||||||||||||||||
Earnings (loss) from unconsolidated entities | (40,727 | ) | |||||||||||||||||||
Earnings (loss) before income taxes | $ | — | |||||||||||||||||||
Margin % (based on Adjusted EBITDA) | 60.8 | % | 55.5 | % | 60.9 | % | 59.2 | % | (13.0 | )% | 0.0 | % | 45.9 | % | |||||||
58
Forest City Realty Trust, Inc. and Subsidiaries
Appendix
Summary of Adjusted EBITDA and NOI by Segment - Three and Six Months Ended June 30, 2017 and 2016 (in thousands) (continued)
Three Months Ended June 30, 2017 | |||||||||||||||||||||
Company Share of Discontinued Operations | Office | Apartments | Retail | Total Operations | Development | Corporate | Total | ||||||||||||||
(in thousands) | |||||||||||||||||||||
Revenues | |||||||||||||||||||||
Rental | $ | — | $ | — | $ | — | $ | — | $ | — | $ | — | $ | — | |||||||
Tenant recoveries | — | — | — | — | — | — | — | ||||||||||||||
Service and management fees | — | — | — | — | — | — | — | ||||||||||||||
Other revenues (includes Subsidized Senior Housing) | — | — | — | — | — | — | — | ||||||||||||||
— | — | — | — | — | — | — | |||||||||||||||
Expenses | |||||||||||||||||||||
Property operating and management | — | — | — | — | — | — | — | ||||||||||||||
Real estate taxes | — | — | — | — | — | — | — | ||||||||||||||
Ground rent | — | — | — | — | — | — | — | ||||||||||||||
Other expenses (includes Subsidized Senior Housing) | — | — | — | — | — | — | — | ||||||||||||||
— | — | — | — | — | — | — | |||||||||||||||
Less organizational transformation and termination benefits | — | — | — | — | — | — | — | ||||||||||||||
Write-offs of abandoned development projects and demolition costs | — | — | — | — | — | — | — | ||||||||||||||
Interest and other income | — | — | — | — | — | — | — | ||||||||||||||
Adjusted EBITDA attributable to Discontinued Operations | $ | — | $ | — | $ | — | $ | — | $ | — | $ | — | $ | — | |||||||
Exclude: | |||||||||||||||||||||
Land sales | — | — | — | — | — | — | — | ||||||||||||||
Other land development revenues | — | — | — | — | — | — | — | ||||||||||||||
Cost of land sales | — | — | — | — | — | — | — | ||||||||||||||
Other land development expenses | — | — | — | — | — | — | — | ||||||||||||||
Corporate general and administrative expenses | — | — | — | — | — | — | — | ||||||||||||||
Write-offs of abandoned development projects and demolition costs | — | — | — | — | — | — | — | ||||||||||||||
Interest and other income | — | — | — | — | — | — | — | ||||||||||||||
Subtotal NOI exclusions | $ | — | $ | — | $ | — | $ | — | $ | — | $ | — | $ | — | |||||||
Net Operating Income attributable to Discontinued Operations | $ | — | $ | — | $ | — | $ | — | $ | — | $ | — | $ | — | |||||||
NOI exclusions per above | — | ||||||||||||||||||||
Depreciation and Amortization | — | ||||||||||||||||||||
Interest Expense | — | ||||||||||||||||||||
Amortization of mortgage procurement costs | — | ||||||||||||||||||||
Net loss on extinguishment of debt | — | ||||||||||||||||||||
Net gain on disposition of interest in unconsolidated entities | — | ||||||||||||||||||||
Organizational transformation and termination benefits | — | ||||||||||||||||||||
Earnings (loss) from unconsolidated entities | — | ||||||||||||||||||||
Earnings (loss) before income taxes | $ | — | |||||||||||||||||||
Margin % (based on Adjusted EBITDA) | 0.0 | % | 0.0 | % | 0.0 | % | 0.0 | % | 0.0 | % | 0.0 | % | 0.0 | % | |||||||
59
Forest City Realty Trust, Inc. and Subsidiaries
Appendix
Summary of Adjusted EBITDA and NOI by Segment - Three and Six Months Ended June 30, 2017 and 2016 (in thousands) (continued)
Three Months Ended June 30, 2016 | |||||||||||||||||||||
Fully Consolidated Entities | Office | Apartments | Retail | Total Operations | Development | Corporate | Total | ||||||||||||||
(in thousands) | |||||||||||||||||||||
Revenues | |||||||||||||||||||||
Rental | $ | 85,512 | $ | 65,473 | $ | 9,743 | $ | 160,728 | $ | 1,818 | $ | — | $ | 162,546 | |||||||
Tenant recoveries | 25,053 | 310 | 3,264 | 28,627 | 17 | — | 28,644 | ||||||||||||||
Service and management fees | 3,831 | 4,422 | 1,725 | 9,978 | 2,533 | — | 12,511 | ||||||||||||||
Other revenues (includes Subsidized Senior Housing) | 6,169 | 3,668 | 1,203 | 11,040 | 11,222 | — | 22,262 | ||||||||||||||
120,565 | 73,873 | 15,935 | 210,373 | 15,590 | — | 225,963 | |||||||||||||||
Expenses | |||||||||||||||||||||
Property operating and management | (32,592 | ) | (25,613 | ) | (7,158 | ) | (65,363 | ) | (16,072 | ) | — | (81,435 | ) | ||||||||
Real estate taxes | (13,026 | ) | (6,163 | ) | (1,752 | ) | (20,941 | ) | (659 | ) | — | (21,600 | ) | ||||||||
Ground rent | (2,833 | ) | (507 | ) | (107 | ) | (3,447 | ) | — | — | (3,447 | ) | |||||||||
Other expenses (includes Subsidized Senior Housing) | — | — | — | — | (1,702 | ) | (22,431 | ) | (24,133 | ) | |||||||||||
(48,451 | ) | (32,283 | ) | (9,017 | ) | (89,751 | ) | (18,433 | ) | (22,431 | ) | (130,615 | ) | ||||||||
Less organizational transformation and termination benefits | — | — | — | — | — | 5,681 | 5,681 | ||||||||||||||
Interest and other income | — | — | — | — | — | 11,031 | 11,031 | ||||||||||||||
Earnings (loss) from unconsolidated entities in Adjusted EBITDA | — | — | — | — | — | — | — | ||||||||||||||
Adjusted EBITDA attributable to Fully Consolidated Entities | $ | 72,114 | $ | 41,590 | $ | 6,918 | $ | 120,622 | $ | (2,843 | ) | $ | (5,719 | ) | $ | 112,060 | |||||
Exclude: | |||||||||||||||||||||
Land sales | — | — | — | — | (8,221 | ) | — | (8,221 | ) | ||||||||||||
Other land development revenues | — | — | — | — | (2,228 | ) | — | (2,228 | ) | ||||||||||||
Cost of land sales | — | — | — | — | 1,702 | — | 1,702 | ||||||||||||||
Other land development expenses | — | — | — | — | 2,397 | — | 2,397 | ||||||||||||||
Corporate general and administrative expenses | — | — | — | — | — | 16,750 | 16,750 | ||||||||||||||
Interest and other income | — | — | — | — | — | (11,031 | ) | (11,031 | ) | ||||||||||||
Earnings (loss) from unconsolidated entities in Adjusted EBITDA | — | — | — | — | — | — | — | ||||||||||||||
Subtotal NOI exclusions | $ | — | $ | — | $ | — | $ | — | $ | (6,350 | ) | $ | 5,719 | $ | (631 | ) | |||||
Net Operating Income attributable to Fully Consolidated Entities | $ | 72,114 | $ | 41,590 | $ | 6,918 | $ | 120,622 | $ | (9,193 | ) | $ | — | $ | 111,429 | ||||||
NOI exclusions per above | 631 | ||||||||||||||||||||
Depreciation and Amortization | (62,418 | ) | |||||||||||||||||||
Interest Expense | (32,435 | ) | |||||||||||||||||||
Amortization of mortgage procurement costs | (1,416 | ) | |||||||||||||||||||
Impairment of real estate | (2,100 | ) | |||||||||||||||||||
Net loss on extinguishment of debt | — | ||||||||||||||||||||
Net gain on disposition of interest in unconsolidated entities | — | ||||||||||||||||||||
Organizational transformation and termination benefits | (5,681 | ) | |||||||||||||||||||
(Earnings) loss from unconsolidated entities in Adjusted EBITDA | — | ||||||||||||||||||||
Earnings (loss) from unconsolidated entities | 21,164 | ||||||||||||||||||||
Earnings (loss) before income taxes | $ | 29,174 | |||||||||||||||||||
Margin % (based on Adjusted EBITDA) | 59.8 | % | 56.3 | % | 43.4 | % | 57.3 | % | (18.2 | )% | 0.0 | % | 49.6 | % | |||||||
60
Forest City Realty Trust, Inc. and Subsidiaries
Appendix
Summary of Adjusted EBITDA and NOI by Segment - Three and Six Months Ended June 30, 2017 and 2016 (in thousands) (continued)
Three Months Ended June 30, 2016 | |||||||||||||||||||||
Noncontrolling Interest | Office | Apartments | Retail | Total Operations | Development | Corporate | Total | ||||||||||||||
(in thousands) | |||||||||||||||||||||
Revenues | |||||||||||||||||||||
Rental | $ | 3,210 | $ | 8,994 | $ | — | $ | 12,204 | $ | 1,208 | $ | — | $ | 13,412 | |||||||
Tenant recoveries | 1,599 | 31 | — | 1,630 | 2 | — | 1,632 | ||||||||||||||
Service and management fees | 1 | (9 | ) | — | (8 | ) | 51 | — | 43 | ||||||||||||
Other revenues (includes Subsidized Senior Housing) | 161 | 486 | — | 647 | 1,092 | — | 1,739 | ||||||||||||||
4,971 | 9,502 | — | 14,473 | 2,353 | — | 16,826 | |||||||||||||||
Expenses | |||||||||||||||||||||
Property operating and management | (1,686 | ) | (1,661 | ) | — | (3,347 | ) | (1,158 | ) | — | (4,505 | ) | |||||||||
Real estate taxes | (669 | ) | (948 | ) | — | (1,617 | ) | (359 | ) | — | (1,976 | ) | |||||||||
Ground rent | (79 | ) | (54 | ) | — | (133 | ) | — | — | (133 | ) | ||||||||||
Other expenses (includes Subsidized Senior Housing) | — | — | — | — | (161 | ) | — | (161 | ) | ||||||||||||
(2,434 | ) | (2,663 | ) | — | (5,097 | ) | (1,678 | ) | — | (6,775 | ) | ||||||||||
Less organizational transformation and termination benefits | — | — | — | — | — | — | — | ||||||||||||||
Interest and other income | — | — | — | — | — | 392 | 392 | ||||||||||||||
Earnings (loss) from unconsolidated entities in Adjusted EBITDA | — | — | — | — | — | — | — | ||||||||||||||
Adjusted EBITDA attributable to Noncontrolling Interest | $ | 2,537 | $ | 6,839 | $ | — | $ | 9,376 | $ | 675 | $ | 392 | $ | 10,443 | |||||||
Exclude: | |||||||||||||||||||||
Land sales | — | — | — | — | (822 | ) | — | (822 | ) | ||||||||||||
Other land development revenues | — | — | — | — | (222 | ) | — | (222 | ) | ||||||||||||
Cost of land sales | — | — | — | — | 161 | — | 161 | ||||||||||||||
Other land development expenses | — | — | — | — | 266 | — | 266 | ||||||||||||||
Corporate general and administrative expenses | — | — | — | — | — | — | — | ||||||||||||||
Interest and other income | — | — | — | — | — | (392 | ) | (392 | ) | ||||||||||||
Earnings (loss) from unconsolidated entities in Adjusted EBITDA | — | — | — | — | — | — | — | ||||||||||||||
Subtotal NOI exclusions | $ | — | $ | — | $ | — | $ | — | $ | (617 | ) | $ | (392 | ) | $ | (1,009 | ) | ||||
Net Operating Income attributable to Noncontrolling Interest | $ | 2,537 | $ | 6,839 | $ | — | $ | 9,376 | $ | 58 | $ | — | $ | 9,434 | |||||||
NOI exclusions per above | 1,009 | ||||||||||||||||||||
Depreciation and Amortization | (5,463 | ) | |||||||||||||||||||
Interest Expense | (3,049 | ) | |||||||||||||||||||
Amortization of mortgage procurement costs | (267 | ) | |||||||||||||||||||
Impairment of real estate | — | ||||||||||||||||||||
Net loss on extinguishment of debt | — | ||||||||||||||||||||
Net gain on disposition of interest in unconsolidated entities | — | ||||||||||||||||||||
Organizational transformation and termination benefits | — | ||||||||||||||||||||
(Earnings) loss from unconsolidated entities in Adjusted EBITDA | — | ||||||||||||||||||||
Earnings (loss) from unconsolidated entities | 96 | ||||||||||||||||||||
Earnings (loss) before income taxes | $ | 1,760 | |||||||||||||||||||
Margin % (based on Adjusted EBITDA) | 51.0 | % | 72.0 | % | 0.0 | % | 64.8 | % | 28.7 | % | 0.0 | % | 62.1 | % | |||||||
61
Forest City Realty Trust, Inc. and Subsidiaries
Appendix
Summary of Adjusted EBITDA and NOI by Segment - Three and Six Months Ended June 30, 2017 and 2016 (in thousands) (continued)
Three Months Ended June 30, 2016 | |||||||||||||||||||||
Company Share of Unconsolidated Entities | Office | Apartments | Retail | Total Operations | Development | Corporate | Total | ||||||||||||||
(in thousands) | |||||||||||||||||||||
Revenues | |||||||||||||||||||||
Rental | $ | 4,011 | $ | 19,622 | $ | 36,045 | $ | 59,678 | $ | 2,714 | $ | — | $ | 62,392 | |||||||
Tenant recoveries | 685 | 96 | 15,460 | 16,241 | 685 | — | 16,926 | ||||||||||||||
Service and management fees | 515 | 1,075 | 719 | 2,309 | 20 | — | 2,329 | ||||||||||||||
Other revenues (includes Subsidized Senior Housing) | 447 | 13,535 | 3,406 | 17,388 | 885 | — | 18,273 | ||||||||||||||
5,658 | 34,328 | 55,630 | 95,616 | 4,304 | — | 99,920 | |||||||||||||||
Expenses | |||||||||||||||||||||
Property operating and management | (1,833 | ) | (7,107 | ) | (13,641 | ) | (22,581 | ) | (1,483 | ) | — | (24,064 | ) | ||||||||
Real estate taxes | (589 | ) | (1,605 | ) | (5,613 | ) | (7,807 | ) | (327 | ) | — | (8,134 | ) | ||||||||
Ground rent | (231 | ) | (255 | ) | (1,861 | ) | (2,347 | ) | (330 | ) | — | (2,677 | ) | ||||||||
Other expenses (includes Subsidized Senior Housing) | — | (8,202 | ) | — | (8,202 | ) | (401 | ) | — | (8,603 | ) | ||||||||||
(2,653 | ) | (17,169 | ) | (21,115 | ) | (40,937 | ) | (2,541 | ) | — | (43,478 | ) | |||||||||
Less organizational transformation and termination benefits | — | — | — | — | — | — | — | ||||||||||||||
Interest and other income | — | — | — | — | — | 390 | 390 | ||||||||||||||
Earnings (loss) from unconsolidated entities in Adjusted EBITDA | — | (75 | ) | — | (75 | ) | 1,520 | — | 1,445 | ||||||||||||
Adjusted EBITDA attributable to Unconsolidated Entities | $ | 3,005 | $ | 17,084 | $ | 34,515 | $ | 54,604 | $ | 3,283 | $ | 390 | $ | 58,277 | |||||||
Exclude: | |||||||||||||||||||||
Land sales | — | — | — | — | (651 | ) | — | (651 | ) | ||||||||||||
Other land development revenues | — | — | — | — | (15 | ) | — | (15 | ) | ||||||||||||
Cost of land sales | — | — | — | — | 401 | — | 401 | ||||||||||||||
Other land development expenses | — | — | — | — | 76 | — | 76 | ||||||||||||||
Corporate general and administrative expenses | — | — | — | — | — | — | — | ||||||||||||||
Interest and other income | — | — | — | — | — | (390 | ) | (390 | ) | ||||||||||||
Earnings (loss) from unconsolidated entities in Adjusted EBITDA | — | 75 | — | 75 | (1,520 | ) | — | (1,445 | ) | ||||||||||||
Subtotal NOI exclusions | $ | — | $ | 75 | $ | — | $ | 75 | $ | (1,709 | ) | $ | (390 | ) | $ | (2,024 | ) | ||||
Net Operating Income attributable to Unconsolidated Entities | $ | 3,005 | $ | 17,159 | $ | 34,515 | $ | 54,679 | $ | 1,574 | $ | — | $ | 56,253 | |||||||
NOI exclusions per above | 2,024 | ||||||||||||||||||||
Depreciation and Amortization | (22,587 | ) | |||||||||||||||||||
Interest Expense | (25,504 | ) | |||||||||||||||||||
Amortization of mortgage procurement costs | (882 | ) | |||||||||||||||||||
Impairment of real estate | — | ||||||||||||||||||||
Net loss on extinguishment of debt | (849 | ) | |||||||||||||||||||
Net gain on disposition of interest in unconsolidated entities | 12,613 | ||||||||||||||||||||
Organizational transformation and termination benefits | — | ||||||||||||||||||||
(Earnings) loss from unconsolidated entities in Adjusted EBITDA | (1,445 | ) | |||||||||||||||||||
Earnings (loss) from unconsolidated entities | (19,623 | ) | |||||||||||||||||||
Earnings (loss) before income taxes | $ | — | |||||||||||||||||||
Margin % (based on Adjusted EBITDA) | 53.1 | % | 49.8 | % | 62.0 | % | 57.1 | % | 76.3 | % | 0.0 | % | 58.3 | % | |||||||
62
Forest City Realty Trust, Inc. and Subsidiaries
Appendix
Summary of Adjusted EBITDA and NOI by Segment - Three and Six Months Ended June 30, 2017 and 2016 (in thousands) (continued)
Three Months Ended June 30, 2016 | |||||||||||||||||||||
Company Share of Discontinued Operations | Office | Apartments | Retail | Total Operations | Development | Corporate | Total | ||||||||||||||
(in thousands) | |||||||||||||||||||||
Revenues | |||||||||||||||||||||
Rental | $ | — | $ | — | $ | — | $ | — | $ | — | $ | — | $ | — | |||||||
Tenant recoveries | — | — | — | — | — | — | — | ||||||||||||||
Service and management fees | — | — | — | — | — | — | — | ||||||||||||||
Other revenues (includes Subsidized Senior Housing) | — | — | — | — | — | — | — | ||||||||||||||
— | — | — | — | — | — | — | |||||||||||||||
Expenses | |||||||||||||||||||||
Property operating and management | — | — | — | — | — | — | — | ||||||||||||||
Real estate taxes | — | — | — | — | — | — | — | ||||||||||||||
Ground rent | — | — | — | — | — | — | — | ||||||||||||||
Other expenses (includes Subsidized Senior Housing) | — | — | — | — | — | — | — | ||||||||||||||
— | — | — | — | — | — | — | |||||||||||||||
Less organizational transformation and termination benefits | — | — | — | — | — | — | — | ||||||||||||||
Interest and other income | — | — | — | — | — | — | — | ||||||||||||||
Earnings (loss) from unconsolidated entities in Adjusted EBITDA | — | — | — | — | — | — | — | ||||||||||||||
Adjusted EBITDA attributable to Discontinued Operations | $ | — | $ | — | $ | — | $ | — | $ | — | $ | — | $ | — | |||||||
Exclude: | |||||||||||||||||||||
Land sales | — | — | — | — | — | — | — | ||||||||||||||
Other land development revenues | — | — | — | — | — | — | — | ||||||||||||||
Cost of land sales | — | — | — | — | — | — | — | ||||||||||||||
Other land development expenses | — | — | — | — | — | — | — | ||||||||||||||
Corporate general and administrative expenses | — | — | — | — | — | — | — | ||||||||||||||
Interest and other income | — | — | — | — | — | — | — | ||||||||||||||
Earnings (loss) from unconsolidated entities in Adjusted EBITDA | — | — | — | — | — | — | — | ||||||||||||||
Subtotal NOI exclusions | $ | — | $ | — | $ | — | $ | — | $ | — | $ | — | $ | — | |||||||
Net Operating Income attributable to Discontinued Operations | $ | — | $ | — | $ | — | $ | — | $ | — | $ | — | $ | — | |||||||
NOI exclusions per above | — | ||||||||||||||||||||
Depreciation and Amortization | — | ||||||||||||||||||||
Interest Expense | — | ||||||||||||||||||||
Amortization of mortgage procurement costs | — | ||||||||||||||||||||
Impairment of real estate | — | ||||||||||||||||||||
Net loss on extinguishment of debt | — | ||||||||||||||||||||
Net gain on disposition of interest in unconsolidated entities | — | ||||||||||||||||||||
Organizational transformation and termination benefits | — | ||||||||||||||||||||
(Earnings) loss from unconsolidated entities in Adjusted EBITDA | — | ||||||||||||||||||||
Earnings (loss) from unconsolidated entities | — | ||||||||||||||||||||
Earnings (loss) before income taxes | $ | — | |||||||||||||||||||
Margin % (based on Adjusted EBITDA) | 0.0 | % | 0.0 | % | 0.0 | % | 0.0 | % | 0.0 | % | 0.0 | % | 0.0 | % | |||||||
63
Forest City Realty Trust, Inc. and Subsidiaries
Appendix
Summary of Adjusted EBITDA and NOI by Segment - Three and Six Months Ended June 30, 2017 and 2016 (in thousands) (continued)
Six Months Ended June 30, 2017 | |||||||||||||||||||||
Fully Consolidated Entities | Office | Apartments | Retail | Total Operations | Development | Corporate | Total | ||||||||||||||
(in thousands) | |||||||||||||||||||||
Revenues | |||||||||||||||||||||
Rental | $ | 170,893 | $ | 131,070 | $ | 13,418 | $ | 315,381 | $ | 13,032 | $ | — | $ | 328,413 | |||||||
Tenant recoveries | 45,544 | 1,034 | 6,663 | 53,241 | 823 | — | 54,064 | ||||||||||||||
Service and management fees | 1,367 | 5,176 | 9,137 | 15,680 | 5,810 | — | 21,490 | ||||||||||||||
Other revenues (includes Subsidized Senior Housing) | 13,118 | 7,132 | 576 | 20,826 | 27,655 | — | 48,481 | ||||||||||||||
230,922 | 144,412 | 29,794 | 405,128 | 47,320 | — | 452,448 | |||||||||||||||
Expenses | |||||||||||||||||||||
Property operating and management | (56,790 | ) | (52,106 | ) | (18,176 | ) | (127,072 | ) | (29,879 | ) | — | (156,951 | ) | ||||||||
Real estate taxes | (24,333 | ) | (12,955 | ) | (2,944 | ) | (40,232 | ) | (2,325 | ) | — | (42,557 | ) | ||||||||
Ground rent | (6,391 | ) | (1,033 | ) | (230 | ) | (7,654 | ) | — | — | (7,654 | ) | |||||||||
Other expenses (includes Subsidized Senior Housing) | — | — | — | — | (9,695 | ) | (40,989 | ) | (50,684 | ) | |||||||||||
(87,514 | ) | (66,094 | ) | (21,350 | ) | (174,958 | ) | (41,899 | ) | (40,989 | ) | (257,846 | ) | ||||||||
Less organizational transformation and termination benefits | — | — | — | — | — | 11,388 | 11,388 | ||||||||||||||
Write-offs of abandoned development projects and demolition costs | — | — | — | — | (1,596 | ) | — | (1,596 | ) | ||||||||||||
Interest and other income | — | — | — | — | — | 20,168 | 20,168 | ||||||||||||||
Loss on disposition of interest in development project | — | — | — | — | (113 | ) | — | (113 | ) | ||||||||||||
Adjusted EBITDA attributable to Fully Consolidated Entities | $ | 143,408 | $ | 78,318 | $ | 8,444 | $ | 230,170 | $ | 3,712 | $ | (9,433 | ) | $ | 224,449 | ||||||
Exclude: | |||||||||||||||||||||
Land sales | — | — | — | — | (23,522 | ) | — | (23,522 | ) | ||||||||||||
Other land development revenues | — | — | — | — | (2,967 | ) | — | (2,967 | ) | ||||||||||||
Cost of land sales | — | — | — | — | 9,695 | — | 9,695 | ||||||||||||||
Other land development expenses | — | — | — | — | 4,598 | — | 4,598 | ||||||||||||||
Corporate general and administrative expenses | — | — | — | — | — | 29,601 | 29,601 | ||||||||||||||
Write-offs of abandoned development projects and demolition costs | — | — | — | — | 1,596 | — | 1,596 | ||||||||||||||
Interest and other income | — | — | — | — | — | (20,168 | ) | (20,168 | ) | ||||||||||||
Loss on disposition of interest in development project | — | — | — | — | 113 | — | 113 | ||||||||||||||
Subtotal NOI exclusions | $ | — | $ | — | $ | — | $ | — | $ | (10,487 | ) | $ | 9,433 | $ | (1,054 | ) | |||||
Net Operating Income attributable to Fully Consolidated Entities | $ | 143,408 | $ | 78,318 | $ | 8,444 | $ | 230,170 | $ | (6,775 | ) | $ | — | $ | 223,395 | ||||||
NOI exclusions per above | 1,054 | ||||||||||||||||||||
Depreciation and Amortization | (129,302 | ) | |||||||||||||||||||
Interest Expense | (56,876 | ) | |||||||||||||||||||
Amortization of mortgage procurement costs | (2,729 | ) | |||||||||||||||||||
Net loss on extinguishment of debt | (2,843 | ) | |||||||||||||||||||
Net gain on disposition of interest in unconsolidated entities | — | ||||||||||||||||||||
Organizational transformation and termination benefits | (11,388 | ) | |||||||||||||||||||
Loss on disposition of interest in development project | 113 | ||||||||||||||||||||
Earnings (loss) from unconsolidated entities | 68,493 | ||||||||||||||||||||
Earnings (loss) before income taxes | $ | 89,917 | |||||||||||||||||||
Margin % (based on Adjusted EBITDA) | 62.1 | % | 54.2 | % | 28.3 | % | 56.8 | % | 7.8 | % | 0.0 | % | 49.6 | % | |||||||
64
Forest City Realty Trust, Inc. and Subsidiaries
Appendix
Summary of Adjusted EBITDA and NOI by Segment - Three and Six Months Ended June 30, 2017 and 2016 (in thousands) (continued)
Six Months Ended June 30, 2017 | |||||||||||||||||||||
Noncontrolling Interest | Office | Apartments | Retail | Total Operations | Development | Corporate | Total | ||||||||||||||
(in thousands) | |||||||||||||||||||||
Revenues | |||||||||||||||||||||
Rental | $ | 6,651 | $ | 18,168 | $ | — | $ | 24,819 | $ | 7,990 | $ | — | $ | 32,809 | |||||||
Tenant recoveries | 3,718 | 127 | — | 3,845 | 20 | — | 3,865 | ||||||||||||||
Service and management fees | 2 | (3 | ) | — | (1 | ) | 128 | — | 127 | ||||||||||||
Other revenues (includes Subsidized Senior Housing) | 298 | 676 | — | 974 | 2,588 | — | 3,562 | ||||||||||||||
10,669 | 18,968 | — | 29,637 | 10,726 | — | 40,363 | |||||||||||||||
Expenses | |||||||||||||||||||||
Property operating and management | (3,565 | ) | (5,514 | ) | — | (9,079 | ) | (4,645 | ) | — | (13,724 | ) | |||||||||
Real estate taxes | (1,492 | ) | (1,880 | ) | — | (3,372 | ) | (1,306 | ) | — | (4,678 | ) | |||||||||
Ground rent | (160 | ) | 57 | — | (103 | ) | — | — | (103 | ) | |||||||||||
Other expenses (includes Subsidized Senior Housing) | — | — | — | — | (516 | ) | — | (516 | ) | ||||||||||||
(5,217 | ) | (7,337 | ) | — | (12,554 | ) | (6,467 | ) | — | (19,021 | ) | ||||||||||
Less organizational transformation and termination benefits | — | — | — | — | — | — | — | ||||||||||||||
Write-offs of abandoned development projects and demolition costs | — | — | — | — | — | — | — | ||||||||||||||
Interest and other income | — | — | — | — | — | 972 | 972 | ||||||||||||||
Loss on disposition of interest in development project | — | — | — | — | — | — | — | ||||||||||||||
Adjusted EBITDA attributable to Noncontrolling Interest | $ | 5,452 | $ | 11,631 | $ | — | $ | 17,083 | $ | 4,259 | $ | 972 | $ | 22,314 | |||||||
Exclude: | |||||||||||||||||||||
Land sales | — | — | — | — | (1,907 | ) | — | (1,907 | ) | ||||||||||||
Other land development revenues | — | — | — | — | (294 | ) | — | (294 | ) | ||||||||||||
Cost of land sales | — | — | — | — | 516 | — | 516 | ||||||||||||||
Other land development expenses | — | — | — | — | 497 | — | 497 | ||||||||||||||
Corporate general and administrative expenses | — | — | — | — | — | — | — | ||||||||||||||
Write-offs of abandoned development projects and demolition costs | — | — | — | — | — | — | — | ||||||||||||||
Interest and other income | — | — | — | — | — | (972 | ) | (972 | ) | ||||||||||||
Loss on disposition of interest in development project | — | — | — | — | — | — | — | ||||||||||||||
Subtotal NOI exclusions | $ | — | $ | — | $ | — | $ | — | $ | (1,188 | ) | $ | (972 | ) | $ | (2,160 | ) | ||||
Net Operating Income attributable to Noncontrolling Interest | $ | 5,452 | $ | 11,631 | $ | — | $ | 17,083 | $ | 3,071 | $ | — | $ | 20,154 | |||||||
NOI exclusions per above | 2,160 | ||||||||||||||||||||
Depreciation and Amortization | (13,549 | ) | |||||||||||||||||||
Interest Expense | (7,534 | ) | |||||||||||||||||||
Amortization of mortgage procurement costs | (628 | ) | |||||||||||||||||||
Net loss on extinguishment of debt | — | ||||||||||||||||||||
Net gain on disposition of interest in unconsolidated entities | — | ||||||||||||||||||||
Organizational transformation and termination benefits | — | ||||||||||||||||||||
Loss on disposition of interest in development project | — | ||||||||||||||||||||
Earnings (loss) from unconsolidated entities | 847 | ||||||||||||||||||||
Earnings (loss) before income taxes | $ | 1,450 | |||||||||||||||||||
Margin % (based on Adjusted EBITDA) | 51.1 | % | 61.3 | % | 0.0 | % | 57.6 | % | 39.7 | % | 0.0 | % | 55.3 | % | |||||||
65
Forest City Realty Trust, Inc. and Subsidiaries
Appendix
Summary of Adjusted EBITDA and NOI by Segment - Three and Six Months Ended June 30, 2017 and 2016 (in thousands) (continued)
Six Months Ended June 30, 2017 | |||||||||||||||||||||
Company Share of Unconsolidated Entities | Office | Apartments | Retail | Total Operations | Development | Corporate | Total | ||||||||||||||
(in thousands) | |||||||||||||||||||||
Revenues | |||||||||||||||||||||
Rental | $ | 13,419 | $ | 39,081 | $ | 74,333 | $ | 126,833 | $ | 736 | $ | — | $ | 127,569 | |||||||
Tenant recoveries | 2,478 | 209 | 32,249 | 34,936 | 399 | — | 35,335 | ||||||||||||||
Service and management fees | 881 | 2,339 | 2,085 | 5,305 | (415 | ) | — | 4,890 | |||||||||||||
Other revenues (includes Subsidized Senior Housing) | 918 | 21,448 | 5,700 | 28,066 | 25,022 | — | 53,088 | ||||||||||||||
17,696 | 63,077 | 114,367 | 195,140 | 25,742 | — | 220,882 | |||||||||||||||
Expenses | |||||||||||||||||||||
Property operating and management | (3,983 | ) | (14,588 | ) | (29,143 | ) | (47,714 | ) | (5,326 | ) | — | (53,040 | ) | ||||||||
Real estate taxes | (1,731 | ) | (3,496 | ) | (12,280 | ) | (17,507 | ) | (140 | ) | — | (17,647 | ) | ||||||||
Ground rent | (1,184 | ) | (510 | ) | (3,165 | ) | (4,859 | ) | — | — | (4,859 | ) | |||||||||
Other expenses (includes Subsidized Senior Housing) | — | (11,810 | ) | — | (11,810 | ) | (23,408 | ) | — | (35,218 | ) | ||||||||||
(6,898 | ) | (30,404 | ) | (44,588 | ) | (81,890 | ) | (28,874 | ) | — | (110,764 | ) | |||||||||
Less organizational transformation and termination benefits | — | — | — | — | — | — | — | ||||||||||||||
Write-offs of abandoned development projects and demolition costs | — | — | — | — | (747 | ) | — | (747 | ) | ||||||||||||
Interest and other income | — | — | — | — | — | 1,976 | 1,976 | ||||||||||||||
Loss on disposition of interest in development project | — | — | — | — | — | — | — | ||||||||||||||
Adjusted EBITDA attributable to Unconsolidated Entities | $ | 10,798 | $ | 32,673 | $ | 69,779 | $ | 113,250 | $ | (3,879 | ) | $ | 1,976 | $ | 111,347 | ||||||
Exclude: | |||||||||||||||||||||
Land sales | — | — | — | — | (24,568 | ) | — | (24,568 | ) | ||||||||||||
Other land development revenues | — | — | — | — | (392 | ) | — | (392 | ) | ||||||||||||
Cost of land sales | — | — | — | — | 23,408 | — | 23,408 | ||||||||||||||
Other land development expenses | — | — | — | — | 163 | — | 163 | ||||||||||||||
Corporate general and administrative expenses | — | — | — | — | — | — | — | ||||||||||||||
Write-offs of abandoned development projects and demolition costs | — | — | — | — | 747 | — | 747 | ||||||||||||||
Interest and other income | — | — | — | — | — | (1,976 | ) | (1,976 | ) | ||||||||||||
Loss on disposition of interest in development project | — | — | — | — | — | — | — | ||||||||||||||
Subtotal NOI exclusions | $ | — | $ | — | $ | — | $ | — | $ | (642 | ) | $ | (1,976 | ) | $ | (2,618 | ) | ||||
Net Operating Income attributable to Unconsolidated Entities | $ | 10,798 | $ | 32,673 | $ | 69,779 | $ | 113,250 | $ | (4,521 | ) | $ | — | $ | 108,729 | ||||||
NOI exclusions per above | 2,618 | ||||||||||||||||||||
Depreciation and Amortization | (45,387 | ) | |||||||||||||||||||
Interest Expense | (47,346 | ) | |||||||||||||||||||
Amortization of mortgage procurement costs | (1,640 | ) | |||||||||||||||||||
Net loss on extinguishment of debt | (1,625 | ) | |||||||||||||||||||
Net gain on disposition of interest in unconsolidated entities | 52,297 | ||||||||||||||||||||
Organizational transformation and termination benefits | — | ||||||||||||||||||||
Loss on disposition of interest in development project | — | ||||||||||||||||||||
Earnings (loss) from unconsolidated entities | (67,646 | ) | |||||||||||||||||||
Earnings (loss) before income taxes | $ | — | |||||||||||||||||||
Margin % (based on Adjusted EBITDA) | 61.0 | % | 51.8 | % | 61.0 | % | 58.0 | % | (15.1 | )% | 0.0 | % | 50.4 | % | |||||||
66
Forest City Realty Trust, Inc. and Subsidiaries
Appendix
Summary of Adjusted EBITDA and NOI by Segment - Three and Six Months Ended June 30, 2017 and 2016 (in thousands) (continued)
Six Months Ended June 30, 2017 | |||||||||||||||||||||
Company Share of Discontinued Operations | Office | Apartments | Retail | Total Operations | Development | Corporate | Total | ||||||||||||||
(in thousands) | |||||||||||||||||||||
Revenues | |||||||||||||||||||||
Rental | $ | — | $ | — | $ | — | $ | — | $ | — | $ | — | $ | — | |||||||
Tenant recoveries | — | — | — | — | — | — | — | ||||||||||||||
Service and management fees | — | — | — | — | — | — | — | ||||||||||||||
Other revenues (includes Subsidized Senior Housing) | — | — | — | — | — | — | — | ||||||||||||||
— | — | — | — | — | — | — | |||||||||||||||
Expenses | |||||||||||||||||||||
Property operating and management | — | — | — | — | — | — | — | ||||||||||||||
Real estate taxes | — | — | — | — | — | — | — | ||||||||||||||
Ground rent | — | — | — | — | — | — | — | ||||||||||||||
Other expenses (includes Subsidized Senior Housing) | — | — | — | — | — | — | — | ||||||||||||||
— | — | — | — | — | — | — | |||||||||||||||
Less organizational transformation and termination benefits | — | — | — | — | — | — | — | ||||||||||||||
Write-offs of abandoned development projects and demolition costs | — | — | — | — | — | — | — | ||||||||||||||
Interest and other income | — | — | — | — | — | — | — | ||||||||||||||
Loss on disposition of interest in development project | — | — | — | — | — | — | — | ||||||||||||||
Adjusted EBITDA attributable to Discontinued Operations | $ | — | $ | — | $ | — | $ | — | $ | — | $ | — | $ | — | |||||||
Exclude: | |||||||||||||||||||||
Land sales | — | — | — | — | — | — | — | ||||||||||||||
Other land development revenues | — | — | — | — | — | — | — | ||||||||||||||
Cost of land sales | — | — | — | — | — | — | — | ||||||||||||||
Other land development expenses | — | — | — | — | — | — | — | ||||||||||||||
Corporate general and administrative expenses | — | — | — | — | — | — | — | ||||||||||||||
Write-offs of abandoned development projects and demolition costs | — | — | — | — | — | — | — | ||||||||||||||
Interest and other income | — | — | — | — | — | — | — | ||||||||||||||
Loss on disposition of interest in development project | — | — | — | — | — | — | — | ||||||||||||||
Subtotal NOI exclusions | $ | — | $ | — | $ | — | $ | — | $ | — | $ | — | $ | — | |||||||
Net Operating Income attributable to Discontinued Operations | $ | — | $ | — | $ | — | $ | — | $ | — | $ | — | $ | — | |||||||
NOI exclusions per above | — | ||||||||||||||||||||
Depreciation and Amortization | — | ||||||||||||||||||||
Interest Expense | — | ||||||||||||||||||||
Amortization of mortgage procurement costs | — | ||||||||||||||||||||
Net loss on extinguishment of debt | — | ||||||||||||||||||||
Net gain on disposition of interest in unconsolidated entities | — | ||||||||||||||||||||
Organizational transformation and termination benefits | — | ||||||||||||||||||||
Loss on disposition of interest in development project | — | ||||||||||||||||||||
Earnings (loss) from unconsolidated entities | — | ||||||||||||||||||||
Earnings (loss) before income taxes | $ | — | |||||||||||||||||||
Margin % (based on Adjusted EBITDA) | 0.0 | % | 0.0 | % | 0.0 | % | 0.0 | % | 0.0 | % | 0.0 | % | 0.0 | % | |||||||
67
Forest City Realty Trust, Inc. and Subsidiaries
Appendix
Summary of Adjusted EBITDA and NOI by Segment - Three and Six Months Ended June 30, 2017 and 2016 (in thousands) (continued)
Six Months Ended June 30, 2016 | ||||||||||||||||||||||||
Fully Consolidated Entities | Office | Apartments | Retail | Total Operations | Development | Corporate | Other | Total | ||||||||||||||||
(in thousands) | ||||||||||||||||||||||||
Revenues | ||||||||||||||||||||||||
Rental | $ | 170,389 | $ | 130,016 | $ | 21,302 | $ | 321,707 | $ | 4,022 | $ | — | $ | — | $ | 325,729 | ||||||||
Tenant recoveries | 49,620 | 619 | 9,333 | 59,572 | 662 | — | — | 60,234 | ||||||||||||||||
Service and management fees | 3,777 | 6,856 | 6,222 | 16,855 | 4,338 | — | — | 21,193 | ||||||||||||||||
Other revenues (includes Subsidized Senior Housing) | 12,387 | 7,550 | 4,269 | 24,206 | 17,346 | — | 3,518 | 45,070 | ||||||||||||||||
236,173 | 145,041 | 41,126 | 422,340 | 26,368 | — | 3,518 | 452,226 | |||||||||||||||||
Expenses | ||||||||||||||||||||||||
Property operating and management | (62,450 | ) | (54,510 | ) | (20,769 | ) | (137,729 | ) | (33,626 | ) | — | — | (171,355 | ) | ||||||||||
Real estate taxes | (26,145 | ) | (13,368 | ) | (5,002 | ) | (44,515 | ) | (1,551 | ) | — | — | (46,066 | ) | ||||||||||
Ground rent | (5,754 | ) | (1,034 | ) | (294 | ) | (7,082 | ) | (4 | ) | — | — | (7,086 | ) | ||||||||||
Other expenses (includes Subsidized Senior Housing) | — | — | — | — | (2,042 | ) | (48,263 | ) | (2,730 | ) | (53,035 | ) | ||||||||||||
(94,349 | ) | (68,912 | ) | (26,065 | ) | (189,326 | ) | (37,223 | ) | (48,263 | ) | (2,730 | ) | (277,542 | ) | |||||||||
Less organizational transformation and termination benefits | — | — | — | — | — | 14,401 | — | 14,401 | ||||||||||||||||
Write-offs of abandoned development projects | — | — | — | — | — | — | — | — | ||||||||||||||||
Interest and other income | — | — | — | — | — | 20,685 | — | 20,685 | ||||||||||||||||
Earnings (loss) from unconsolidated entities in Adjusted EBITDA | — | — | — | — | — | — | — | — | ||||||||||||||||
Adjusted EBITDA attributable to Fully Consolidated Entities | $ | 141,824 | $ | 76,129 | $ | 15,061 | $ | 233,014 | $ | (10,855 | ) | $ | (13,177 | ) | $ | 788 | $ | 209,770 | ||||||
Exclude: | ||||||||||||||||||||||||
Land sales | — | — | — | — | (12,154 | ) | — | — | (12,154 | ) | ||||||||||||||
Other land development revenues | — | — | — | — | (4,144 | ) | — | — | (4,144 | ) | ||||||||||||||
Cost of land sales | — | — | — | — | 2,042 | — | — | 2,042 | ||||||||||||||||
Other land development expenses | — | — | — | — | 4,745 | — | — | 4,745 | ||||||||||||||||
Corporate general and administrative expenses | — | — | — | — | — | 33,862 | — | 33,862 | ||||||||||||||||
Write-offs of abandoned development projects and demolition costs | — | — | — | — | — | — | — | — | ||||||||||||||||
Interest and other income | — | — | — | — | — | (20,685 | ) | — | (20,685 | ) | ||||||||||||||
Earnings (loss) from unconsolidated entities in Adjusted EBITDA | — | — | — | — | — | — | — | — | ||||||||||||||||
Subtotal NOI exclusions | $ | — | $ | — | $ | — | $ | — | $ | (9,511 | ) | $ | 13,177 | $ | — | $ | 3,666 | |||||||
Net Operating Income attributable to Fully Consolidated Entities | $ | 141,824 | $ | 76,129 | $ | 15,061 | $ | 233,014 | $ | (20,366 | ) | $ | — | $ | 788 | $ | 213,436 | |||||||
NOI exclusions per above | (3,666 | ) | ||||||||||||||||||||||
Depreciation and Amortization | (125,629 | ) | ||||||||||||||||||||||
Interest Expense | (67,070 | ) | ||||||||||||||||||||||
Amortization of mortgage procurement costs | (3,081 | ) | ||||||||||||||||||||||
Impairment of real estate | (14,564 | ) | ||||||||||||||||||||||
Net loss on extinguishment of debt | (29,084 | ) | ||||||||||||||||||||||
Net gain on disposition of interest in unconsolidated entities | — | |||||||||||||||||||||||
Organizational transformation and termination benefits | (14,401 | ) | ||||||||||||||||||||||
(Earnings) loss from unconsolidated entities in Adjusted EBITDA | — | |||||||||||||||||||||||
Earnings (loss) from unconsolidated entities | 31,700 | |||||||||||||||||||||||
Earnings (loss) before income taxes | $ | (12,359 | ) | |||||||||||||||||||||
Margin % (based on Adjusted EBITDA) | 60.1 | % | 52.5 | % | 36.6 | % | 55.2 | % | (41.2 | )% | 0.0 | % | 22.4 | % | 46.4 | % | ||||||||
68
Forest City Realty Trust, Inc. and Subsidiaries
Appendix
Summary of Adjusted EBITDA and NOI by Segment - Three and Six Months Ended June 30, 2017 and 2016 (in thousands) (continued)
Six Months Ended June 30, 2016 | ||||||||||||||||||||||||
Noncontrolling Interest | Office | Apartments | Retail | Total Operations | Development | Corporate | Other | Total | ||||||||||||||||
(in thousands) | ||||||||||||||||||||||||
Revenues | ||||||||||||||||||||||||
Rental | $ | 6,378 | $ | 17,907 | $ | — | $ | 24,285 | $ | 1,915 | $ | — | $ | — | $ | 26,200 | ||||||||
Tenant recoveries | 3,164 | 63 | — | 3,227 | 2 | — | — | 3,229 | ||||||||||||||||
Service and management fees | 1 | (9 | ) | — | (8 | ) | 89 | — | — | 81 | ||||||||||||||
Other revenues (includes Subsidized Senior Housing) | 290 | 1,069 | — | 1,359 | 1,602 | — | — | 2,961 | ||||||||||||||||
9,833 | 19,030 | — | 28,863 | 3,608 | — | — | 32,471 | |||||||||||||||||
Expenses | ||||||||||||||||||||||||
Property operating and management | (3,172 | ) | (4,249 | ) | — | (7,421 | ) | (2,248 | ) | — | — | (9,669 | ) | |||||||||||
Real estate taxes | (1,338 | ) | (1,983 | ) | — | (3,321 | ) | (615 | ) | — | — | (3,936 | ) | |||||||||||
Ground rent | (160 | ) | (107 | ) | — | (267 | ) | — | — | — | (267 | ) | ||||||||||||
Other expenses (includes Subsidized Senior Housing) | — | — | — | — | (193 | ) | — | — | (193 | ) | ||||||||||||||
(4,670 | ) | (6,339 | ) | — | (11,009 | ) | (3,056 | ) | — | — | (14,065 | ) | ||||||||||||
Less organizational transformation and termination benefits | — | — | — | — | — | — | — | — | ||||||||||||||||
Write-offs of abandoned development projects | — | — | — | — | — | — | — | — | ||||||||||||||||
Interest and other income | — | — | — | — | — | 769 | — | 769 | ||||||||||||||||
Earnings (loss) from unconsolidated entities in Adjusted EBITDA | — | — | — | — | — | — | — | — | ||||||||||||||||
Adjusted EBITDA attributable to Noncontrolling Interest | $ | 5,163 | $ | 12,691 | $ | — | $ | 17,854 | $ | 552 | $ | 769 | $ | — | $ | 19,175 | ||||||||
Exclude: | ||||||||||||||||||||||||
Land sales | — | — | — | — | (1,213 | ) | — | — | (1,213 | ) | ||||||||||||||
Other land development revenues | — | — | — | — | (411 | ) | — | — | (411 | ) | ||||||||||||||
Cost of land sales | — | — | — | — | 193 | — | — | 193 | ||||||||||||||||
Other land development expenses | — | — | — | — | 547 | — | — | 547 | ||||||||||||||||
Corporate general and administrative expenses | — | — | — | — | — | — | — | — | ||||||||||||||||
Write-offs of abandoned development projects and demolition costs | — | — | — | — | — | — | — | — | ||||||||||||||||
Interest and other income | — | — | — | — | — | (769 | ) | — | (769 | ) | ||||||||||||||
Earnings (loss) from unconsolidated entities in Adjusted EBITDA | — | — | — | — | — | — | — | — | ||||||||||||||||
Subtotal NOI exclusions | $ | — | $ | — | $ | — | $ | — | $ | (884 | ) | $ | (769 | ) | $ | — | $ | (1,653 | ) | |||||
Net Operating Income attributable to Noncontrolling Interest | $ | 5,163 | $ | 12,691 | $ | — | $ | 17,854 | $ | (332 | ) | $ | — | $ | — | $ | 17,522 | |||||||
NOI exclusions per above | 1,653 | |||||||||||||||||||||||
Depreciation and Amortization | (9,790 | ) | ||||||||||||||||||||||
Interest Expense | (5,038 | ) | ||||||||||||||||||||||
Amortization of mortgage procurement costs | (459 | ) | ||||||||||||||||||||||
Impairment of real estate | — | |||||||||||||||||||||||
Net loss on extinguishment of debt | — | |||||||||||||||||||||||
Net gain on disposition of interest in unconsolidated entities | — | |||||||||||||||||||||||
Organizational transformation and termination benefits | — | |||||||||||||||||||||||
(Earnings) loss from unconsolidated entities in Adjusted EBITDA | — | |||||||||||||||||||||||
Earnings (loss) from unconsolidated entities | 178 | |||||||||||||||||||||||
Earnings (loss) before income taxes | $ | 4,066 | ||||||||||||||||||||||
Margin % (based on Adjusted EBITDA) | 52.5 | % | 66.7 | % | 0.0 | % | 61.9 | % | 15.3 | % | 0.0 | % | 0.0 | % | 59.1 | % | ||||||||
69
Forest City Realty Trust, Inc. and Subsidiaries
Appendix
Summary of Adjusted EBITDA and NOI by Segment - Three and Six Months Ended June 30, 2017 and 2016 (in thousands) (continued)
Six Months Ended June 30, 2016 | ||||||||||||||||||||||||
Company Share of Unconsolidated Entities | Office | Apartments | Retail | Total Operations | Development | Corporate | Other | Total | ||||||||||||||||
(in thousands) | ||||||||||||||||||||||||
Revenues | ||||||||||||||||||||||||
Rental | $ | 7,945 | $ | 39,043 | $ | 72,930 | $ | 119,918 | $ | 3,502 | $ | — | $ | — | $ | 123,420 | ||||||||
Tenant recoveries | 1,515 | 200 | 30,456 | 32,171 | 767 | — | — | 32,938 | ||||||||||||||||
Service and management fees | 612 | 2,002 | 1,293 | 3,907 | 25 | — | — | 3,932 | ||||||||||||||||
Other revenues (includes Subsidized Senior Housing) | (141 | ) | 27,381 | 7,167 | 34,407 | 1,694 | — | 971 | 37,072 | |||||||||||||||
9,931 | 68,626 | 111,846 | 190,403 | 5,988 | — | 971 | 197,362 | |||||||||||||||||
Expenses | ||||||||||||||||||||||||
Property operating and management | (2,954 | ) | (14,837 | ) | (27,134 | ) | (44,925 | ) | (2,363 | ) | — | — | (47,288 | ) | ||||||||||
Real estate taxes | (1,179 | ) | (3,222 | ) | (10,960 | ) | (15,361 | ) | (548 | ) | — | — | (15,909 | ) | ||||||||||
Ground rent | (459 | ) | (511 | ) | (3,925 | ) | (4,895 | ) | (440 | ) | — | — | (5,335 | ) | ||||||||||
Other expenses (includes Subsidized Senior Housing) | — | (15,923 | ) | — | (15,923 | ) | (401 | ) | — | (455 | ) | (16,779 | ) | |||||||||||
(4,592 | ) | (34,493 | ) | (42,019 | ) | (81,104 | ) | (3,752 | ) | — | (455 | ) | (85,311 | ) | ||||||||||
Less organizational transformation and termination benefits | — | — | — | — | — | — | — | — | ||||||||||||||||
Write-offs of abandoned development projects | — | — | — | — | — | — | — | — | ||||||||||||||||
Interest and other income | — | — | — | — | — | 755 | — | 755 | ||||||||||||||||
Earnings (loss) from unconsolidated entities in Adjusted EBITDA | — | (109 | ) | — | (109 | ) | 2,067 | — | (18 | ) | 1,940 | |||||||||||||
Adjusted EBITDA attributable to Unconsolidated Entities | $ | 5,339 | $ | 34,024 | $ | 69,827 | $ | 109,190 | $ | 4,303 | $ | 755 | $ | 498 | $ | 114,746 | ||||||||
Exclude: | ||||||||||||||||||||||||
Land sales | — | — | — | — | (1,317 | ) | — | — | (1,317 | ) | ||||||||||||||
Other land development revenues | — | — | — | — | (61 | ) | — | — | (61 | ) | ||||||||||||||
Cost of land sales | — | — | — | — | 401 | — | — | 401 | ||||||||||||||||
Other land development expenses | — | — | — | — | 424 | — | — | 424 | ||||||||||||||||
Corporate general and administrative expenses | — | — | — | — | — | — | — | — | ||||||||||||||||
Write-offs of abandoned development projects and demolition costs | — | — | — | — | — | — | — | — | ||||||||||||||||
Interest and other income | — | — | — | — | — | (755 | ) | — | (755 | ) | ||||||||||||||
Earnings (loss) from unconsolidated entities in Adjusted EBITDA | — | 109 | — | 109 | (2,067 | ) | — | 18 | (1,940 | ) | ||||||||||||||
Subtotal NOI exclusions | $ | — | $ | 109 | $ | — | $ | 109 | $ | (2,620 | ) | $ | (755 | ) | $ | 18 | $ | (3,248 | ) | |||||
Net Operating Income attributable to Unconsolidated Entities | $ | 5,339 | $ | 34,133 | $ | 69,827 | $ | 109,299 | $ | 1,683 | $ | — | $ | 516 | $ | 111,498 | ||||||||
NOI exclusions per above | 3,248 | |||||||||||||||||||||||
Depreciation and Amortization | (43,349 | ) | ||||||||||||||||||||||
Interest Expense | (49,845 | ) | ||||||||||||||||||||||
Amortization of mortgage procurement costs | (1,794 | ) | ||||||||||||||||||||||
Impairment of real estate | — | |||||||||||||||||||||||
Net loss on extinguishment of debt | (849 | ) | ||||||||||||||||||||||
Net gain on disposition of interest in unconsolidated entities | 12,613 | |||||||||||||||||||||||
Organizational transformation and termination benefits | — | |||||||||||||||||||||||
(Earnings) loss from unconsolidated entities in Adjusted EBITDA | (1,940 | ) | ||||||||||||||||||||||
Earnings (loss) from unconsolidated entities | (29,582 | ) | ||||||||||||||||||||||
Earnings (loss) before income taxes | $ | — | ||||||||||||||||||||||
Margin % (based on Adjusted EBITDA) | 53.8 | % | 49.6 | % | 62.4 | % | 57.3 | % | 71.9 | % | 0.0 | % | 51.3 | % | 58.1 | % | ||||||||
70
Forest City Realty Trust, Inc. and Subsidiaries
Appendix
Summary of Adjusted EBITDA and NOI by Segment - Three and Six Months Ended June 30, 2017 and 2016 (in thousands) (continued)
Six Months Ended June 30, 2016 | ||||||||||||||||||||||||
Company Share of Discontinued Operations | Office | Apartments | Retail | Total Operations | Development | Corporate | Other | Total | ||||||||||||||||
(in thousands) | ||||||||||||||||||||||||
Revenues | ||||||||||||||||||||||||
Rental | $ | — | $ | — | $ | — | $ | — | $ | — | $ | — | $ | — | $ | — | ||||||||
Tenant recoveries | — | — | — | — | — | — | — | — | ||||||||||||||||
Service and management fees | — | — | — | — | — | — | — | — | ||||||||||||||||
Other revenues (includes Subsidized Senior Housing) | — | — | — | — | — | — | 8,136 | 8,136 | ||||||||||||||||
— | — | — | — | — | — | 8,136 | 8,136 | |||||||||||||||||
Expenses | ||||||||||||||||||||||||
Property operating and management | — | — | — | — | — | — | — | — | ||||||||||||||||
Real estate taxes | — | — | — | — | — | — | — | — | ||||||||||||||||
Ground rent | — | — | — | — | — | — | — | — | ||||||||||||||||
Other expenses (includes Subsidized Senior Housing) | — | — | — | — | — | — | (6,938 | ) | (6,938 | ) | ||||||||||||||
— | — | — | — | — | — | (6,938 | ) | (6,938 | ) | |||||||||||||||
Less organizational transformation and termination benefits | — | — | — | — | — | — | — | — | ||||||||||||||||
Write-offs of abandoned development projects | — | — | — | — | — | — | — | — | ||||||||||||||||
Interest and other income | — | — | — | — | — | — | — | — | ||||||||||||||||
Earnings (loss) from unconsolidated entities in Adjusted EBITDA | — | — | — | — | — | — | — | — | ||||||||||||||||
Adjusted EBITDA attributable to Discontinued Operations | $ | — | $ | — | $ | — | $ | — | $ | — | $ | — | $ | 1,198 | $ | 1,198 | ||||||||
Exclude: | ||||||||||||||||||||||||
Land sales | — | — | — | — | — | — | — | — | ||||||||||||||||
Other land development revenues | — | — | — | — | — | — | — | — | ||||||||||||||||
Cost of land sales | — | — | — | — | — | — | — | — | ||||||||||||||||
Other land development expenses | — | — | — | — | — | — | — | — | ||||||||||||||||
Corporate general and administrative expenses | — | — | — | — | — | — | — | — | ||||||||||||||||
Write-offs of abandoned development projects and demolition costs | — | — | — | — | — | — | — | — | ||||||||||||||||
Interest and other income | — | — | — | — | — | — | — | — | ||||||||||||||||
Earnings (loss) from unconsolidated entities in Adjusted EBITDA | — | — | — | — | — | — | — | — | ||||||||||||||||
Subtotal NOI exclusions | $ | — | $ | — | $ | — | $ | — | $ | — | $ | — | $ | — | $ | — | ||||||||
Net Operating Income attributable to Discontinued Operations | $ | — | $ | — | $ | — | $ | — | $ | — | $ | — | $ | 1,198 | $ | 1,198 | ||||||||
NOI exclusions per above | — | |||||||||||||||||||||||
Depreciation and Amortization | (35 | ) | ||||||||||||||||||||||
Interest Expense | (1,738 | ) | ||||||||||||||||||||||
Amortization of mortgage procurement costs | (21 | ) | ||||||||||||||||||||||
Impairment of real estate | — | |||||||||||||||||||||||
Net loss on extinguishment of debt | — | |||||||||||||||||||||||
Net gain on disposition of interest in unconsolidated entities | — | |||||||||||||||||||||||
Organizational transformation and termination benefits | — | |||||||||||||||||||||||
(Earnings) loss from unconsolidated entities in Adjusted EBITDA | — | |||||||||||||||||||||||
Earnings (loss) from unconsolidated entities | (1,400 | ) | ||||||||||||||||||||||
Earnings (loss) before income taxes | $ | (1,996 | ) | |||||||||||||||||||||
Margin % (based on Adjusted EBITDA) | 0.0 | % | 0.0 | % | 0.0 | % | 0.0 | % | 0.0 | % | 0.0 | % | 14.7 | % | 14.7 | % | ||||||||
71