Attached files
| file | filename |
|---|---|
| EX-99.2 - EXHIBIT 99.2 - FEDERAL NATIONAL MORTGAGE ASSOCIATION FANNIE MAE | q22017creditsupplemene59.htm |
| 8-K - 8-K - FEDERAL NATIONAL MORTGAGE ASSOCIATION FANNIE MAE | a2017q28k.htm |

Resource Center: 1-800-232-6643
Exhibit 99.1
Contact: Pete Bakel
202-752-2034
Date: August 3, 2017
Fannie Mae Reports Net Income of $3.2 billion and Comprehensive Income of $3.1 billion for Second Quarter 2017
• | Fannie Mae paid a $2.8 billion dividend to Treasury in June 2017. Through the second quarter of 2017, the company has paid $162.7 billion in dividends to Treasury. |
• | Fannie Mae was the largest provider of liquidity to the mortgage market in the second quarter of 2017, providing approximately $135 billion in mortgage financing that enabled families to buy, refinance, or rent homes. |
• | Fannie Mae has transitioned from a portfolio-focused business to a guaranty-focused business. Income from the company’s guaranty business accounted for more than 75 percent of the company’s net interest income in the first half of 2017. Fannie Mae expects net interest income from the company’s guaranty business to account for an increasing portion of net interest income as its retained mortgage portfolio continues to shrink. |
• | Fannie Mae is focused on providing value to the housing finance system by: |
◦ | delivering increased speed, simplicity, and certainty to customers and serving their needs by building a company that is efficient, innovative, and continuously improving; |
◦ | implementing innovations that deliver greater value and reduced risk to lenders, such as the company’s Day 1 Certainty™ initiative with verification tools to expand representation and warranty relief; and |
◦ | helping make predictable long-term fixed-rate mortgages, including the 30-year fixed-rate mortgage, available to families across the country. |
• | Fannie Mae continues to increase the role of private capital in the mortgage market and reduce the risk to Fannie Mae’s business, taxpayers, and the housing finance system through its credit risk transfer transactions, which transfer a portion of the mortgage credit risk on some of the recently acquired loans in its single-family book of business. As of June 30, 2017, $798 billion in single-family mortgages or approximately 28 percent of the loans in the company’s single-family conventional guaranty book of business, measured by unpaid principal balance, were covered by a credit risk transfer transaction. |
WASHINGTON, DC — Fannie Mae (FNMA/OTC) reported net income of $3.2 billion and comprehensive income of $3.1 billion for the second quarter of 2017. The company reported a positive net worth of $3.7 billion as of June 30, 2017. As a result, the company will pay Treasury a $3.1 billion dividend in September 2017 if the Federal Housing Finance Agency (FHFA) declares a dividend in this amount.
“Our results reflect the strength of our business model and the momentum of our strategy,” said Timothy J. Mayopoulos, President and Chief Executive Officer. “We are focused on helping lenders save time and money, making the mortgage process easier, and expanding access to credit in ways that make sense. We will continue to deliver innovative solutions that help our customers succeed, improve the mortgage process, and create safe and sustainable opportunities for families to own or rent a home.”
Second Quarter 2017 Results — Fannie Mae’s net income of $3.2 billion for the second quarter of 2017 compares to net income of $2.8 billion for the first quarter of 2017. The increase in net income was due primarily to an increase in credit-related income and a shift to investment gains in the second quarter from investment losses in the first quarter, partially offset by higher fair value losses on the company’s risk management derivatives.

Second Quarter 2017 Results | 1 | |
SUMMARY OF SECOND QUARTER 2017 RESULTS

(Dollars in millions) | 2Q17 | 1Q17 | Variance | 2Q17 | 2Q16 | Variance | ||||||||||||||||||
Net interest income | $ | 5,002 | $ | 5,346 | $ | (344 | ) | $ | 5,002 | $ | 5,286 | $ | (284 | ) | ||||||||||
Fee and other income | 353 | 249 | 104 | 353 | 174 | 179 | ||||||||||||||||||
Net revenues | 5,355 | 5,595 | (240 | ) | 5,355 | 5,460 | (105 | ) | ||||||||||||||||
Investment gains (losses), net | 385 | (9 | ) | 394 | 385 | 398 | (13 | ) | ||||||||||||||||
Fair value losses, net | (691 | ) | (40 | ) | (651 | ) | (691 | ) | (1,667 | ) | 976 | |||||||||||||
Administrative expenses | (686 | ) | (684 | ) | (2 | ) | (686 | ) | (678 | ) | (8 | ) | ||||||||||||
Credit-related income | ||||||||||||||||||||||||
Benefit for credit losses | 1,267 | 396 | 871 | 1,267 | 1,601 | (334 | ) | |||||||||||||||||
Foreclosed property expense | (34 | ) | (217 | ) | 183 | (34 | ) | (63 | ) | 29 | ||||||||||||||
Total credit-related income | 1,233 | 179 | 1,054 | 1,233 | 1,538 | (305 | ) | |||||||||||||||||
Temporary Payroll Tax Cut Continuation Act of 2011 (TCCA) fees | (518 | ) | (503 | ) | (15 | ) | (518 | ) | (453 | ) | (65 | ) | ||||||||||||
Other expenses, net | (291 | ) | (382 | ) | 91 | (291 | ) | (254 | ) | (37 | ) | |||||||||||||
Income before federal income taxes | 4,787 | 4,156 | 631 | 4,787 | 4,344 | 443 | ||||||||||||||||||
Provision for federal income taxes | (1,587 | ) | (1,383 | ) | (204 | ) | (1,587 | ) | (1,398 | ) | (189 | ) | ||||||||||||
Net income | $ | 3,200 | $ | 2,773 | $ | 427 | $ | 3,200 | $ | 2,946 | $ | 254 | ||||||||||||
Total comprehensive income | $ | 3,117 | $ | 2,779 | $ | 338 | $ | 3,117 | $ | 2,869 | $ | 248 | ||||||||||||
Dividends distributed or available for distribution to senior preferred stockholder | $ | (3,117 | ) | $ | (2,779 | ) | $ | (338 | ) | $ | (3,117 | ) | $ | (2,869 | ) | $ | (248 | ) | ||||||
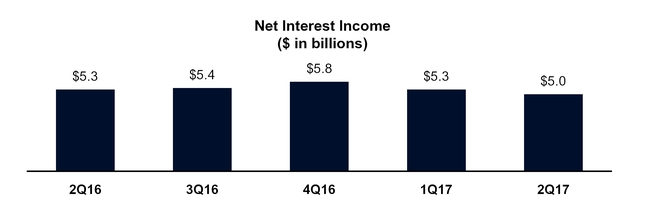
Net revenues, which consist of net interest income and fee and other income, were $5.4 billion for the second quarter of 2017, compared with $5.6 billion for the first quarter of 2017.
The company has two primary sources of net interest income: (1) the guaranty fees it receives for managing the credit risk on loans underlying Fannie Mae mortgage-backed securities held by third parties; and (2) the difference between interest income earned on the assets in its retained mortgage portfolio and the interest expense associated with the debt that funds those assets.
Net interest income was $5.0 billion for the second quarter of 2017, compared with $5.3 billion for the first quarter of 2017. The decrease in net interest income for the second quarter of 2017 was due to lower guaranty fee income as a result of lower amortization income, which was driven by lower mortgage prepayments due to lower refinance activity.
Second Quarter 2017 Results | 2 | |
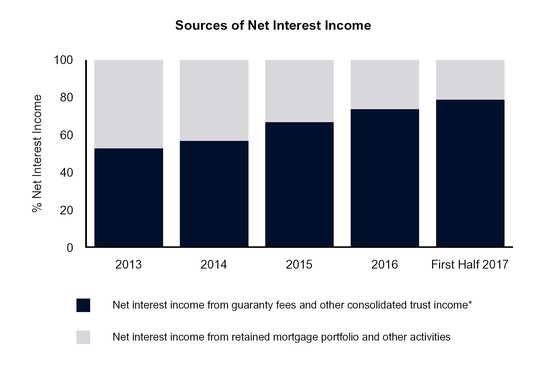
In recent periods, an increasing portion of Fannie Mae’s net interest income has been derived from guaranty fees rather than from the company’s retained mortgage portfolio assets. This shift has been driven by both the guaranty fee increases the company implemented in 2012 and the reduction of the company’s retained mortgage portfolio. More than 75 percent of the company’s net interest income in the first half of 2017 was derived from its guaranty business. The company expects that guaranty fees will continue to account for an increasing portion of its net interest income.
__________
* | Guaranty fee income reflects the impact of a 10 basis point guaranty fee increase implemented in 2012 pursuant to the Temporary Payroll Tax Cut Continuation Act of 2011, the incremental revenue from which is remitted to Treasury and not retained by us. |
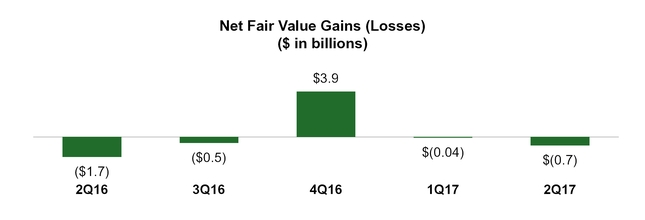
Net fair value losses were $691 million in the second quarter of 2017, compared with $40 million in the first quarter of 2017. Net fair value losses for the second quarter of 2017 were due primarily to decreases in the fair value of the company’s risk management derivatives due to declines in longer-term swap rates during the second quarter of 2017 and to decreases in the fair value of the company’s mortgage commitments due to an increase in prices as interest rates decreased during the commitment period. The company recognized additional fair value losses in second quarter of 2017 on Connecticut Avenue Securities™ debt reported at fair value resulting from tightening spreads between Connecticut Avenue Securities debt yields and LIBOR during the period. The estimated fair value of the company’s derivatives and securities may fluctuate substantially from period to period because of changes in interest rates, the yield curve, mortgage and credit spreads, implied volatility, and activity related to these financial instruments.
Second Quarter 2017 Results | 3 | |
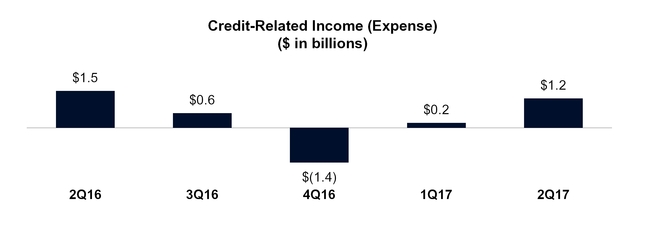
Credit-related income consists of a benefit for credit losses and foreclosed property expense. Credit-related income was $1.2 billion in the second quarter of 2017, compared with $179 million in the first quarter of 2017. The increase in credit-related income for the second quarter of 2017 was driven primarily by a higher benefit for credit losses due primarily to a redesignation of loans from held for investment to held for sale and decreases in actual and projected interest rates, as well as a decrease in foreclosed property expense during the quarter.
Investment gains were $385 million in the second quarter of 2017, compared with investment losses of $9 million in the first quarter of 2017. The shift to investment gains was driven by the sale of available-for-sale securities and reperforming loans in the second quarter of 2017.
Second Quarter 2017 Results | 4 | |
VARIABILITY OF FINANCIAL RESULTS
Fannie Mae expects to remain profitable on an annual basis for the foreseeable future; however, certain factors, such as changes in interest rates or home prices, could result in significant volatility in the company’s financial results from quarter to quarter or year to year. Fannie Mae’s future financial results also will be affected by a number of other factors, including: the company’s guaranty fee rates; the volume of single-family mortgage originations in the future; the size, composition, and quality of its retained mortgage portfolio and guaranty book of business; and economic and housing market conditions. Although Fannie Mae expects to remain profitable on an annual basis for the foreseeable future, due to the company’s limited and declining capital reserves (which decrease to zero in 2018) and the potential for significant volatility in its financial results, the company could experience a net worth deficit in a future quarter. If Fannie Mae experiences a net worth deficit in a future quarter, the company will be required to draw additional funds from Treasury under the senior preferred stock purchase agreement to avoid being placed into receivership.
The company’s expectations for its future financial results do not take into account the impact on its business of potential future legislative or regulatory changes, which could have a material impact on the company’s financial results, particularly the enactment of housing finance reform legislation, corporate income tax reform legislation, and changes in accounting standards. For example, the current Administration proposes reducing the U.S. corporate income tax rate. Under applicable accounting standards, a significant reduction in the U.S. corporate income tax rate would require the company to record a substantial reduction in the value of its deferred tax assets in the quarter in which the legislation is enacted. Thus, if legislation significantly lowering the U.S. corporate income tax rate is enacted, the company expects to incur a significant net loss and net worth deficit for the quarter in which the legislation is enacted and could potentially incur a net loss for that year. If the company experiences a net worth deficit in a future quarter, it will be required to draw additional funds from Treasury under the senior preferred stock purchase agreement in order to avoid being placed into receivership. For additional information on factors that affect the company’s financial results, please refer to the company’s quarterly report on Form 10-Q for the quarter ended June 30, 2017 (the “Second Quarter 2017 Form 10-Q”).
SUMMARY OF SECOND QUARTER 2017 BUSINESS SEGMENT RESULTS
Fannie Mae’s two reportable business segments—Single-Family and Multifamily—engage in complementary business activities in pursuing Fannie Mae’s vision to be America’s most valued housing partner and to provide liquidity, access to credit, and affordability in all U.S. housing markets at all times, while effectively managing and reducing risk to Fannie Mae’s business, taxpayers, and the housing finance system. In support of this vision, Fannie Mae is focused on: advancing a sustainable and reliable business model that reduces risk to the housing finance system and taxpayers; providing reliable, large-scale access to affordable mortgage credit for qualified borrowers and helping struggling homeowners; and serving customer needs by building a company that is efficient, innovative, and continuously improving.
Second Quarter 2017 Results | 5 | |

(Dollars in millions) | 2Q17 | 1Q17 | Variance | 2Q17 | 2Q16 | Variance | ||||||||||||||||||
Single-Family Segment: | ||||||||||||||||||||||||
Net interest income | $ | 4,366 | $ | 4,756 | $ | (390 | ) | $ | 4,366 | $ | 4,730 | $ | (364 | ) | ||||||||||
Fee and other income | 111 | 76 | 35 | 111 | 78 | 33 | ||||||||||||||||||
Net revenues | 4,477 | 4,832 | (355 | ) | 4,477 | 4,808 | (331 | ) | ||||||||||||||||
Credit-related income | 1,223 | 184 | 1,039 | 1,223 | 1,535 | (312 | ) | |||||||||||||||||
Investment gains (losses), net | 321 | (50 | ) | 371 | 321 | 280 | 41 | |||||||||||||||||
Fair value losses, net | (685 | ) | (12 | ) | (673 | ) | (685 | ) | (1,679 | ) | 994 | |||||||||||||
Administrative expenses | (600 | ) | (601 | ) | 1 | (600 | ) | (597 | ) | (3 | ) | |||||||||||||
TCCA fees | (518 | ) | (503 | ) | (15 | ) | (518 | ) | (453 | ) | (65 | ) | ||||||||||||
Other expenses | (155 | ) | (256 | ) | 101 | (155 | ) | (252 | ) | 97 | ||||||||||||||
Income before federal income taxes | 4,063 | 3,594 | 469 | 4,063 | 3,642 | 421 | ||||||||||||||||||
Provision for federal income taxes | (1,401 | ) | (1,252 | ) | (149 | ) | (1,401 | ) | (1,254 | ) | (147 | ) | ||||||||||||
Net income | $ | 2,662 | $ | 2,342 | $ | 320 | $ | 2,662 | $ | 2,388 | $ | 274 | ||||||||||||
Multifamily Segment: | ||||||||||||||||||||||||
Net interest income | $ | 636 | $ | 590 | $ | 46 | $ | 636 | $ | 556 | $ | 80 | ||||||||||||
Fee and other income | 242 | 173 | 69 | 242 | 96 | 146 | ||||||||||||||||||
Net revenues | 878 | 763 | 115 | 878 | 652 | 226 | ||||||||||||||||||
Credit-related income (expense) | 10 | (5 | ) | 15 | 10 | 3 | 7 | |||||||||||||||||
Fair value gains (losses), net | (6 | ) | (28 | ) | 22 | (6 | ) | 12 | (18 | ) | ||||||||||||||
Administrative expenses | (86 | ) | (83 | ) | (3 | ) | (86 | ) | (81 | ) | (5 | ) | ||||||||||||
Other income (expense) | (72 | ) | (85 | ) | 13 | (72 | ) | 116 | (188 | ) | ||||||||||||||
Income before federal income taxes | 724 | 562 | 162 | 724 | 702 | 22 | ||||||||||||||||||
Provision for federal income taxes | (186 | ) | (131 | ) | (55 | ) | (186 | ) | (144 | ) | (42 | ) | ||||||||||||
Net income | $ | 538 | $ | 431 | $ | 107 | $ | 538 | $ | 558 | $ | (20 | ) | |||||||||||
Single-Family Business
• | Single-Family net income was $2.7 billion in the second quarter of 2017, compared with $2.3 billion in the first quarter of 2017. Net income for the second quarter of 2017 was driven primarily by net interest income and credit-related income. |
• | Single-Family net interest income was $4.4 billion in the second quarter of 2017, compared with $4.8 billion in the first quarter of 2017. The decrease in net interest income for the second quarter of 2017 was due to lower guaranty fee income as a result of lower amortization income, which was driven by lower mortgage prepayments due to lower refinance activity. |
• | Single-Family credit-related income was $1.2 billion in the second quarter of 2017, compared with $184 million in the first quarter of 2017. The increase in credit-related income in the second quarter of 2017 was driven primarily by a higher benefit for credit losses due primarily to a redesignation of loans from held for investment to held for sale and decreases in actual and projected interest rates, as well as a decrease in foreclosed property expense during the quarter. |
• | Single-Family net fair value losses were $685 million in the second quarter of 2017, compared with $12 million in the first quarter of 2017. Net fair value losses for the second quarter of 2017 were due primarily to decreases in the fair value of the company’s risk management derivatives due to declines in longer-term swap rates during the second quarter of 2017 and to decreases in the fair value of the company’s mortgage commitments due to an increase in prices as interest rates decreased during the commitment period. The company recognized additional fair value losses in the second quarter of 2017 on Connecticut Avenue Securities™ debt reported at fair value resulting from tightening spreads between Connecticut Avenue Securities debt yields and LIBOR |
Second Quarter 2017 Results | 6 | |
during the period. The estimated fair value of the company’s derivatives and securities may fluctuate substantially from period to period because of changes in interest rates, the yield curve, mortgage and credit spreads, implied volatility, and activity related to these financial instruments.
Multifamily Business
• | Multifamily net income was $538 million in the second quarter of 2017, compared with $431 million in the first quarter of 2017. Net income in the second quarter of 2017 was driven primarily by net interest income and fee and other income. |
• | Multifamily net interest income was $636 million in the second quarter of 2017, compared with $590 million in the first quarter of 2017. The increase in net interest income was due primarily to higher guaranty fee income as the company’s multifamily guaranty book of business grew and loans with higher guaranty fees became a larger part of its book, while loans with lower guaranty fees continued to liquidate. |
• | Multifamily fee and other income was $242 million in the second quarter of 2017, compared with $173 million in the first quarter of 2017. Fee and other income in the second quarter of 2017 increased primarily due to higher yield maintenance revenue driven by an increase in prepayment volumes. |
• | Multifamily new business and other rental volume totaled $30.6 billion for the first half of 2017, of which approximately 52 percent counted toward FHFA’ s 2017 multifamily volume cap. |
BUILDING A SUSTAINABLE HOUSING FINANCE SYSTEM
In addition to continuing to provide liquidity and support to the mortgage market, Fannie Mae has invested significant resources toward helping to maintain a safer and sustainable housing finance system for today and build a safer and sustainable housing finance system for the future. The company is pursuing the strategic goals identified by its conservator, FHFA. These strategic goals are: maintain, in a safe and sound manner, credit availability and foreclosure prevention activities for new and refinanced mortgages to foster liquid, efficient, competitive, and resilient national housing finance markets; reduce taxpayer risk through increasing the role of private capital in the mortgage market; and build a new single-family infrastructure for use by Fannie Mae and Freddie Mac and adaptable for use by other participants in the secondary market in the future.
ABOUT FANNIE MAE’S CONSERVATORSHIP AND AGREEMENTS WITH TREASURY
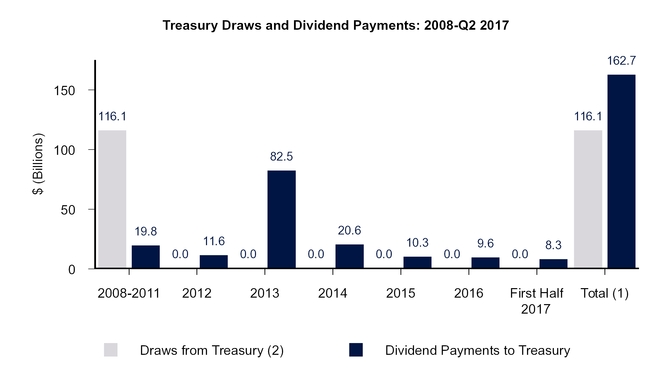
Fannie Mae has operated under the conservatorship of FHFA since September 6, 2008. Treasury has made a commitment under a senior preferred stock purchase agreement to provide funding to Fannie Mae under certain circumstances if the company has a net worth deficit. Pursuant to this agreement and the senior preferred stock the company issued to Treasury in 2008, the Director of FHFA has declared and directed Fannie Mae to pay dividends to Treasury on a quarterly basis since the company entered into conservatorship in 2008.
The chart below shows the funds the company has drawn from Treasury pursuant to the senior preferred stock purchase agreement, as well as the dividend payments the company has made to Treasury on the senior preferred stock, since entering into conservatorship.
Second Quarter 2017 Results | 7 | |
__________
(1) | Under the terms of the senior preferred stock purchase agreement, dividend payments the company makes to Treasury do not offset the company’s prior draws of funds from Treasury, and the company is not permitted to pay down draws it has made under the agreement except in limited circumstances. Accordingly, the current aggregate liquidation preference of the senior preferred stock is $117.1 billion, due to the initial $1.0 billion liquidation preference of the senior preferred stock (for which the company did not receive cash proceeds) and the $116.1 billion the company has drawn from Treasury. Amounts may not sum due to rounding. |
(2) | Treasury draws are shown in the period for which requested, not when the funds were received by the company. Fannie Mae has not requested a draw for any period since 2012. |
Fannie Mae will pay Treasury a dividend of $3.1 billion for the third quarter of 2017 by September 30, 2017 if FHFA declares a dividend in this amount before September 30, 2017. With such a dividend payment, Fannie Mae will have paid a total of $165.8 billion in dividends to Treasury. The dividend amount is based on the company’s net worth of $3.7 billion as of June 30, 2017, less the current capital reserve amount of $600 million.
The dividend provisions of the senior preferred stock provide for quarterly dividends consisting of the amount, if any, by which the company’s net worth as of the end of the immediately preceding fiscal quarter exceeds an applicable capital reserve amount. The capital reserve amount is $600 million for each quarter of 2017 and will decrease to zero in 2018. To the extent that these quarterly dividends are not paid, they will accumulate and be added to the liquidation preference of the senior preferred stock. This would not affect the amount of available funding from Treasury under the senior preferred stock purchase agreement.
The amount of remaining funding available to Fannie Mae under the senior preferred stock purchase agreement with Treasury is currently $117.6 billion. If the company were to draw additional funds from Treasury under the agreement in a future period, the amount of remaining funding under the agreement would be reduced by the amount of the company’s draw. Dividend payments Fannie Mae makes to Treasury do not restore or increase the amount of funding available to the company under the agreement.
Fannie Mae is not permitted to redeem the senior preferred stock prior to the termination of Treasury’s funding commitment under the senior preferred stock purchase agreement. The limited circumstances under which Treasury’s funding commitment will terminate are described in “Business—Conservatorship and Treasury Agreements” in the company’s annual report on Form 10-K for the year ended December 31, 2016 (the “2016 Form 10-K”).
Second Quarter 2017 Results | 8 | |
CREDIT RISK TRANSFER TRANSACTIONS
In late 2013, Fannie Mae began entering into credit risk transfer transactions with the goal of transferring, to the extent economically sensible, a portion of the mortgage credit risk on some of the recently acquired loans in its single-family book of business in order to reduce the economic risk to the company and taxpayers of future borrower defaults. Fannie Mae’s primary method of achieving this goal has been through the issuance of its Connecticut Avenue Securities™ (CAS) and its Credit Insurance Risk Transfer™ (CIRT™) transactions. In these transactions, the company transfers to investors a portion of the mortgage credit risk associated with losses on a reference pool of mortgage loans and in exchange pays investors a premium that effectively reduces the guaranty fee income the company retains on the loans.
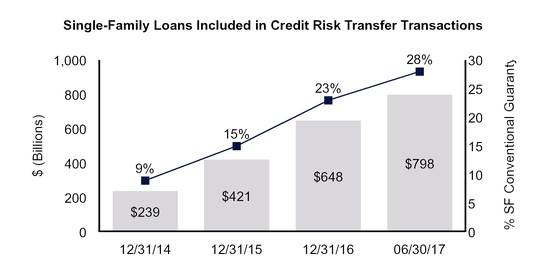
As of June 30, 2017, $798 billion in outstanding unpaid principal balance of the company’s single-family loans, or approximately 28 percent of the loans in its single-family conventional guaranty book of business measured by unpaid principal balance, were included in a reference pool for a credit risk transfer transaction. During the first half of 2017, the company transferred a portion of the mortgage credit risk on single-family mortgages with unpaid principal balance of $180 billion at the time of the transactions.
These transactions increase the role of private capital in the mortgage market and reduce the risk to Fannie Mae’s business, taxpayers, and the housing finance system. Over time, the company expects that a larger portion of its single-family conventional guaranty book of business will be covered by credit risk transfer transactions.
The chart below shows as of the dates specified the total outstanding unpaid principal balance of Fannie Mae’s single-family loans, as well as the percentage of the company’s total single-family conventional guaranty book of business measured by unpaid principal balance, that were included in a reference pool for a credit risk transfer transaction. The risk in force of these transactions, which refers to the maximum amount of losses that could be absorbed by credit risk transfer investors, was approximately $25 billion as of June 30, 2017.
CREDIT QUALITY
While continuing to make it possible for families to buy, refinance, or rent homes, Fannie Mae has maintained responsible credit standards. Since 2009, Fannie Mae has seen the effect of the actions it took, beginning in 2008, to significantly strengthen its underwriting and eligibility standards to promote sustainable homeownership and stability in the housing market. Fannie Mae actively monitors the credit risk profile and credit performance of the company’s single-family loan acquisitions, in conjunction with housing market and economic conditions, to determine if its pricing, eligibility, and underwriting criteria accurately reflect the risks associated with loans the company acquires or guarantees. Single-family conventional loans acquired by Fannie Mae in the second quarter of 2017 had a weighted average borrower FICO credit score at origination of 745 and a weighted average original loan-to-value ratio of 76 percent.
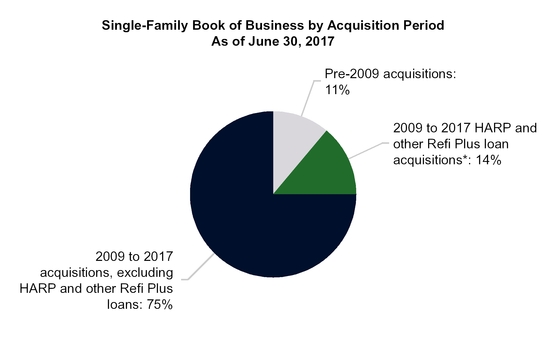
As of June 30, 2017, 89 percent of the company’s single-family conventional guaranty book of business consisted of loans acquired since 2009.
Second Quarter 2017 Results | 9 | |
__________
* | Fannie Mae has acquired HARP loans and other Refi Plus loans under its Refi PlusTM initiative since 2009. Fannie Mae’s Refi Plus initiative offers refinancing flexibility to eligible borrowers who are current on their loans and whose loans are owned or guaranteed by the company and meet certain additional criteria. HARP loans, which have loan-to-value (“LTV”) ratios at origination greater than 80 percent, refers to loans the company has acquired pursuant to the Home Affordable Refinance Program® (“HARP®”). Other Refi Plus loans, which have LTV ratios at origination of 80 percent or less, refers to loans the company has acquired under its Refi Plus initiative other than HARP loans. Loans the company acquires under Refi Plus and HARP are refinancings of loans that were originated prior to June 2009. |
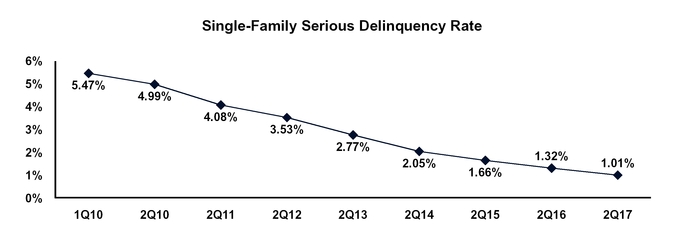
The single-family serious delinquency rate for Fannie Mae’s book of business has decreased for 29 consecutive quarters since the first quarter of 2010 and was 1.01 percent as of June 30, 2017, compared with 5.47 percent as of March 31, 2010.
Fannie Mae expects its single-family serious delinquency rate to continue to decline; however, as the single-family serious delinquency rate has already declined significantly over the past several years, the company expects more modest declines in this rate in the future. The company’s single-family serious delinquency rate and the period of time that loans remain seriously delinquent continue to be negatively affected by the length of time required to complete a foreclosure in some states. Other factors that affect the company’s single-family serious delinquency rate include the pace of loan modifications, the timing and volume of nonperforming loan sales we make, servicer performance, and changes in home prices, unemployment levels and other macroeconomic conditions.
Second Quarter 2017 Results | 10 | |
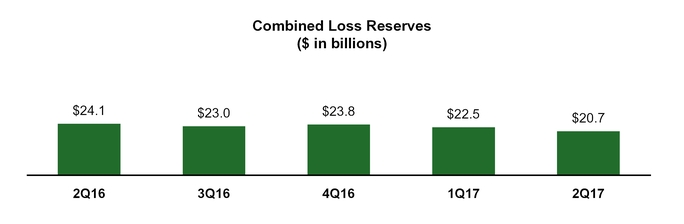
Combined loss reserves, which reflect the company’s estimate of the probable losses the company has incurred in its guaranty book of business, including concessions it granted borrowers upon modification of their loans, decreased to $20.7 billion as of June 30, 2017 from $22.5 billion as of March 31, 2017. The decrease in the company’s combined loss reserves for the second quarter of 2017 was driven primarily by redesignations of loans from held for investment to held for sale, liquidations, and an increase in actual and forecasted home prices. The company’s loss reserves have declined in recent years and are expected to decline further in 2017.
PROVIDING LIQUIDITY AND SUPPORT TO THE MARKET
Liquidity
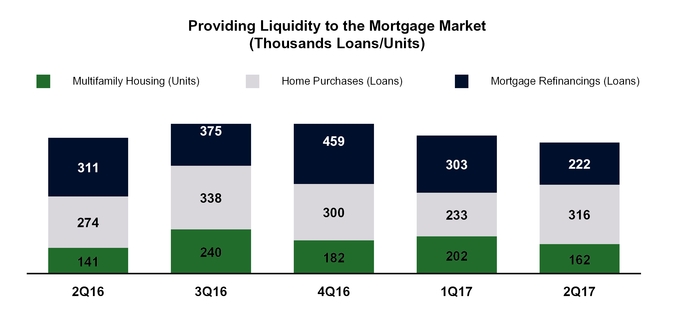
Fannie Mae provided approximately $135 billion in liquidity to the mortgage market in the second quarter of 2017, through its purchases of loans and guarantees of loans and securities, which resulted in:
• | Approximately 316,000 home purchases |
• | Approximately 222,000 mortgage refinancings |
• | Approximately 162,000 units of multifamily housing financed |
Second Quarter 2017 Results | 11 | |
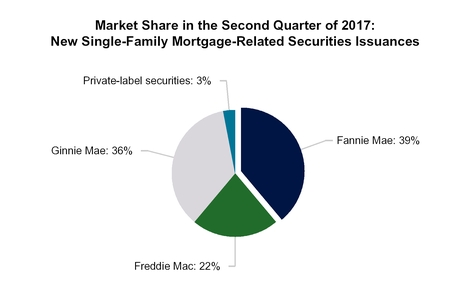
The company was the largest issuer of single-family mortgage-related securities in the secondary market in the second quarter of 2017. The company’s estimated market share of new single-family mortgage-related securities issuances was 39 percent in both the second and first quarter of 2017, compared with 38 percent in the second quarter of 2016.
The chart below shows the company’s market share of single-family mortgage-related securities issuances in the second quarter of 2017 compared with that of its primary competitors.
Fannie Mae also remained a continuous source of liquidity in the multifamily market in the second quarter of 2017. As of March 31, 2017 (the latest date for which information is available), the company owned or guaranteed approximately 20 percent of the outstanding debt on multifamily properties.
Second Quarter 2017 Results | 12 | |
Refinancing Initiatives
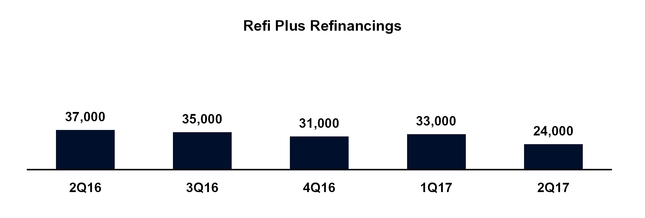
Through the company’s Refi Plus initiative, which offers refinancing flexibility to eligible Fannie Mae borrowers and includes HARP, the company acquired approximately 24,000 loans in the second quarter of 2017. Refinancings delivered to Fannie Mae through Refi Plus in the second quarter of 2017 reduced borrowers’ monthly mortgage payments by an average of $176.
Home Retention Solutions and Foreclosure Alternatives
To reduce the credit losses Fannie Mae ultimately incurs on its book of business, the company has been focusing its efforts on several strategies, including reducing defaults by offering home retention solutions, such as loan modifications.

For the Six Months Ended June 30, | |||||||||||||
2017 | 2016 | ||||||||||||
Unpaid Principal Balance | Number of Loans | Unpaid Principal Balance | Number of Loans | ||||||||||
(Dollars in millions) | |||||||||||||
Home retention solutions: | |||||||||||||
Modifications | $ | 6,878 | 41,467 | $ | 7,003 | 42,177 | |||||||
Repayment plans and forbearances completed | 524 | 3,703 | 395 | 2,825 | |||||||||
Total home retention solutions | 7,402 | 45,170 | 7,398 | 45,002 | |||||||||
Foreclosure alternatives: | |||||||||||||
Short sales | 881 | 4,280 | 1,214 | 5,887 | |||||||||
Deeds-in-lieu of foreclosure | 346 | 2,285 | 502 | 3,317 | |||||||||
Total foreclosure alternatives | 1,227 | 6,565 | 1,716 | 9,204 | |||||||||
Total loan workouts | $ | 8,629 | 51,735 | $ | 9,114 | 54,206 | |||||||
Loan workouts as a percentage of single-family guaranty book of business | 0.60 | % | 0.60 | % | 0.65 | % | 0.63 | % | |||||
Fannie Mae views foreclosure as a last resort. For homeowners and communities in need, the company offers alternatives to foreclosure. In dealing with homeowners in distress, the company first seeks home retention solutions, which enable borrowers to stay in their homes, before turning to foreclosure alternatives.
• | Fannie Mae provided approximately 52,000 loan workouts during the first six months of 2017 enabling borrowers to avoid foreclosure. |
• | Fannie Mae completed approximately 41,500 loan modifications during the first six months of 2017. |
Second Quarter 2017 Results | 13 | |
FORECLOSURES AND REAL ESTATE OWNED (REO) PROPERTIES
When there is no viable home retention solution or foreclosure alternative that can be applied, the company seeks to move to foreclosure expeditiously in an effort to minimize prolonged delinquencies that can hurt local home values and destabilize communities.

For the Six Months Ended June 30, | |||||||
2017 | 2016 | ||||||
Single-family foreclosed properties (number of properties): | |||||||
Beginning of period inventory of single-family foreclosed properties (REO) | 38,093 | 57,253 | |||||
Total properties acquired through foreclosure | 21,074 | 30,371 | |||||
Dispositions of REO | (27,796 | ) | (41,643 | ) | |||
End of period inventory of single-family foreclosed properties (REO) | 31,371 | 45,981 | |||||
Carrying value of single-family foreclosed properties (dollars in millions) | $ | 3,545 | $ | 5,301 | |||
Single-family foreclosure rate | 0.25 | % | 0.35 | % | |||
• | Fannie Mae acquired 21,074 single-family REO properties, primarily through foreclosure, in the first six months of 2017, compared with 30,371 in the first six months of 2016. |
• | As of June 30, 2017, the company’s inventory of single-family REO properties was 31,371, compared with 45,981 as of June 30, 2016. The carrying value of the company’s single-family REO was $3.5 billion as of June 30, 2017. |
• | The company’s single-family foreclosure rate was 0.25 percent for the six months ended June 30, 2017. This reflects the annualized total number of single-family properties acquired through foreclosure or deeds-in-lieu of foreclosure as a percentage of the total number of loans in Fannie Mae’s single-family guaranty book of business. |
Fannie Mae’s financial statements for the second quarter of 2017 are available in the accompanying Annex; however, investors and interested parties should read the company’s Second Quarter 2017 Form 10-Q, which was filed today with the Securities and Exchange Commission and is available on Fannie Mae’s website, www.fanniemae.com. The company provides further discussion of its financial results and condition, credit performance, and other matters in its Second Quarter 2017 Form 10-Q. Additional information about the company’s credit performance, the characteristics of its guaranty book of business, its foreclosure-prevention efforts, and other measures is contained in the “2017 Second Quarter Credit Supplement” at www.fanniemae.com.
# # #
In this release, the company has presented a number of estimates, forecasts, expectations, and other forward-looking statements, including statements regarding: its future dividend payments to Treasury; its work to help customers, improve the mortgage process, and create housing opportunities for families; the impact of and future plans with respect to the company’s credit risk transfer transactions; the sources of its future net interest income; the company’s future profitability; the factors that will affect the company’s future financial results; the company’s future serious delinquency rates and the factors that will affect the company’s future single-family serious delinquency rates; the future fair value of the company’s financial instruments; the company’s future loss reserves; and the impact of the company’s actions to reduce credit losses. These estimates, forecasts, expectations, and statements are forward-looking statements based on the company’s current assumptions regarding numerous factors. Actual results, and future projections, could be materially different from what is set forth in the forward-looking statements as a result of: home price changes; interest rate changes; unemployment rates; other macroeconomic and housing market variables; the company’s future serious delinquency rates; the company’s future guaranty fee pricing and the impact of that pricing on the company’s guaranty fee revenues and competitive environment; government policy; credit availability; changes in borrower behavior; the volume of loans it modifies; the effectiveness of its loss mitigation strategies; significant changes in modification and foreclosure activity; the volume and pace of future nonperforming and reperforming loan sales and their impact on the company’s results and serious delinquency rates; the effectiveness of its management of its real estate owned inventory and pursuit of contractual remedies; changes in the fair value of its assets and liabilities; future legislative or regulatory requirements or changes that have a significant impact on the company’s business, such as the enactment of housing
Second Quarter 2017 Results | 14 | |
finance reform legislation or corporate income tax reform legislation; actions by FHFA, Treasury, the Department of Housing and Urban Development or other regulators that affect the company’s business; the size, composition and quality of the company’s guaranty book of business and retained mortgage portfolio; the company’s market share; the life of the loans in the company’s guaranty book of business; future updates to the company’s models relating to loss reserves, including the assumptions used by these models; changes in generally accepted accounting principles; changes to the company’s accounting policies; whether the company’s counterparties meet their obligations in full; effects from activities the company takes to support the mortgage market and help borrowers; the company’s future objectives and activities in support of those objectives, including actions the company may take to reach additional underserved creditworthy borrowers; actions the company may be required to take by FHFA, in its role as the company’s conservator or as its regulator, such as changes in the type of business the company does or the implementation of the Single Security Initiative for Fannie Mae and Freddie Mac; limitations on the company’s business imposed by FHFA, in its role as the company’s conservator or as its regulator; the conservatorship and its effect on the company’s business; the investment by Treasury and its effect on the company’s business; the uncertainty of the company’s future; challenges the company faces in retaining and hiring qualified executives and other employees; the deteriorated credit performance of many loans in the company’s guaranty book of business; a decrease in the company’s credit ratings; defaults by one or more institutional counterparties; resolution or settlement agreements the company may enter into with its counterparties; operational control weaknesses; changes in the fiscal and monetary policies of the Federal Reserve, including implementation of the Federal Reserve’s balance sheet normalization program; changes in the structure and regulation of the financial services industry; the company’s ability to access the debt markets; disruptions in the housing, credit, and stock markets; government investigations and litigation; the company’s reliance on and the performance of the company’s servicers; conditions in the foreclosure environment; global political risks; natural disasters, environmental disasters, terrorist attacks, pandemics, or other major disruptive events; information security breaches or threats; and many other factors, including those discussed in the “Risk Factors” and “Forward-Looking Statements” sections of and elsewhere in the company’s annual report on Form 10-K for the year ended December 31, 2016 and the company’s quarterly report on Form 10-Q for the quarter ended June 30, 2017, and elsewhere in this release.
Fannie Mae provides website addresses in its news releases solely for readers’ information. Other content or information appearing on these websites is not part of this release.
Fannie Mae helps make the 30-year fixed-rate mortgage and affordable rental housing possible for millions of Americans. We partner with lenders to create housing opportunities for families across the country. We are driving positive changes in housing finance to make the home buying process easier, while reducing costs and risk. To learn more, visit fanniemae.com and follow us on twitter.com/fanniemae.
Second Quarter 2017 Results | 15 | |
ANNEX
FANNIE MAE
(In conservatorship)
Condensed Consolidated Balance Sheets — (Unaudited)
(Dollars in millions, except share amounts)
As of | |||||||||||
June 30, | December 31, | ||||||||||
2017 | 2016 | ||||||||||
ASSETS | |||||||||||
Cash and cash equivalents | $ | 16,904 | $ | 25,224 | |||||||
Restricted cash (includes $26,279 and $31,536, related to consolidated trusts) | 30,999 | 36,953 | |||||||||
Federal funds sold and securities purchased under agreements to resell or similar arrangements | 29,220 | 30,415 | |||||||||
Investments in securities: | |||||||||||
Trading, at fair value (includes $1,007 and $1,277, respectively, pledged as collateral ) | 39,274 | 40,562 | |||||||||
Available-for-sale, at fair value (includes $98 and $107, respectively, related to consolidated trusts) | 6,408 | 8,363 | |||||||||
Total investments in securities | 45,682 | 48,925 | |||||||||
Mortgage loans: | |||||||||||
Loans held for sale, at lower of cost or fair value | 5,322 | 2,899 | |||||||||
Loans held for investment, at amortized cost: | |||||||||||
Of Fannie Mae | 180,318 | 204,318 | |||||||||
Of consolidated trusts | 2,960,174 | 2,896,001 | |||||||||
Total loans held for investment (includes $11,406 and $12,057, respectively, at fair value) | 3,140,492 | 3,100,319 | |||||||||
Allowance for loan losses | (20,399 | ) | (23,465 | ) | |||||||
Total loans held for investment, net of allowance | 3,120,093 | 3,076,854 | |||||||||
Total mortgage loans | 3,125,415 | 3,079,753 | |||||||||
Deferred tax assets, net | 31,402 | 33,530 | |||||||||
Accrued interest receivable (includes $7,223 and $7,064, respectively, related to consolidated trusts) | 7,840 | 7,737 | |||||||||
Acquired property, net | 3,696 | 4,489 | |||||||||
Other assets | 18,072 | 20,942 | |||||||||
Total assets | $ | 3,309,230 | $ | 3,287,968 | |||||||
LIABILITIES AND EQUITY | |||||||||||
Liabilities: | |||||||||||
Accrued interest payable (includes $8,389 and $8,285, respectively, related to consolidated trusts) | $ | 9,473 | $ | 9,431 | |||||||
Debt: | |||||||||||
Of Fannie Mae (includes $9,008 and $9,582, respectively, at fair value) | 303,120 | 327,097 | |||||||||
Of consolidated trusts (includes $34,866 and $36,524, respectively, at fair value) | 2,984,547 | 2,935,219 | |||||||||
Other liabilities (includes $340 and $390, respectively, related to consolidated trusts) | 8,373 | 10,150 | |||||||||
Total liabilities | 3,305,513 | 3,281,897 | |||||||||
Commitments and contingencies | — | — | |||||||||
Stockholders’ equity: | |||||||||||
Senior preferred stock, 1,000,000 shares issued and outstanding | 117,149 | 117,149 | |||||||||
Preferred stock, 700,000,000 shares are authorized—555,374,922 shares issued and outstanding | 19,130 | 19,130 | |||||||||
Common stock, no par value, no maximum authorization—1,308,762,703 shares issued, 1,158,087,567 and 1,158,082,750 shares outstanding, respectively | 687 | 687 | |||||||||
Accumulated deficit | (126,531 | ) | (124,253 | ) | |||||||
Accumulated other comprehensive income | 682 | 759 | |||||||||
Treasury stock, at cost, 150,675,136 and 150,679,953 shares, respectively | (7,400 | ) | (7,401 | ) | |||||||
Total equity | 3,717 | 6,071 | |||||||||
Total liabilities and equity | $ | 3,309,230 | $ | 3,287,968 | |||||||
See Notes to Condensed Consolidated Financial Statements in the Second Quarter 2017 Form 10-Q
Second Quarter 2017 Results | 16 | |
FANNIE MAE
(In conservatorship)
Condensed Consolidated Statements of Operations and Comprehensive Income — (Unaudited)
(Dollars and shares in millions, except per share amounts)
For the Three Months Ended June 30, | For the Six Months Ended June 30, | |||||||||||||||||||
2017 | 2016 | 2017 | 2016 | |||||||||||||||||
Interest income: | ||||||||||||||||||||
Trading securities | $ | 176 | $ | 128 | $ | 318 | $ | 248 | ||||||||||||
Available-for-sale securities | 91 | 170 | 192 | 373 | ||||||||||||||||
Mortgage loans (includes $25,033 and $23,866, respectively, for the three months ended and $49,987 and $48,492, respectively, for the six months ended related to consolidated trusts) | 27,011 | 26,256 | 54,058 | 53,217 | ||||||||||||||||
Other | 115 | 46 | 209 | 94 | ||||||||||||||||
Total interest income | 27,393 | 26,600 | 54,777 | 53,932 | ||||||||||||||||
Interest expense: | ||||||||||||||||||||
Short-term debt | 57 | 57 | 101 | 108 | ||||||||||||||||
Long-term debt (includes $20,705 and $19,521, respectively, for the three months ended and $41,013 and $40,179, respectively, for the six months ended related to consolidated trusts) | 22,334 | 21,257 | 44,328 | 43,769 | ||||||||||||||||
Total interest expense | 22,391 | 21,314 | 44,429 | 43,877 | ||||||||||||||||
Net interest income | 5,002 | 5,286 | 10,348 | 10,055 | ||||||||||||||||
Benefit for credit losses | 1,267 | 1,601 | 1,663 | 2,785 | ||||||||||||||||
Net interest income after benefit for credit losses | 6,269 | 6,887 | 12,011 | 12,840 | ||||||||||||||||
Investment gains, net | 385 | 398 | 376 | 467 | ||||||||||||||||
Fair value losses, net | (691 | ) | (1,667 | ) | (731 | ) | (4,480 | ) | ||||||||||||
Fee and other income | 353 | 174 | 602 | 377 | ||||||||||||||||
Non-interest income (loss) | 47 | (1,095 | ) | 247 | (3,636 | ) | ||||||||||||||
Administrative expenses: | ||||||||||||||||||||
Salaries and employee benefits | 332 | 331 | 676 | 695 | ||||||||||||||||
Professional services | 234 | 232 | 463 | 447 | ||||||||||||||||
Occupancy expenses | 47 | 46 | 93 | 91 | ||||||||||||||||
Other administrative expenses | 73 | 69 | 138 | 133 | ||||||||||||||||
Total administrative expenses | 686 | 678 | 1,370 | 1,366 | ||||||||||||||||
Foreclosed property expense | 34 | 63 | 251 | 397 | ||||||||||||||||
Temporary Payroll Tax Cut Continuation Act of 2011 (“TCCA”) fees | 518 | 453 | 1,021 | 893 | ||||||||||||||||
Other expenses, net | 291 | 254 | 673 | 518 | ||||||||||||||||
Total expenses | 1,529 | 1,448 | 3,315 | 3,174 | ||||||||||||||||
Income before federal income taxes | 4,787 | 4,344 | 8,943 | 6,030 | ||||||||||||||||
Provision for federal income taxes | (1,587 | ) | (1,398 | ) | (2,970 | ) | (1,948 | ) | ||||||||||||
Net income | 3,200 | 2,946 | 5,973 | 4,082 | ||||||||||||||||
Other comprehensive loss: | ||||||||||||||||||||
Changes in unrealized gains on available-for-sale securities, net of reclassification adjustments and taxes | (81 | ) | (75 | ) | (73 | ) | (273 | ) | ||||||||||||
Other | (2 | ) | (2 | ) | (4 | ) | (4 | ) | ||||||||||||
Total other comprehensive loss | (83 | ) | (77 | ) | (77 | ) | (277 | ) | ||||||||||||
Total comprehensive income | $ | 3,117 | $ | 2,869 | $ | 5,896 | $ | 3,805 | ||||||||||||
Net income | $ | 3,200 | $ | 2,946 | 5,973 | 4,082 | ||||||||||||||
Dividends distributed or available for distribution to senior preferred stockholder | (3,117 | ) | (2,869 | ) | (5,896 | ) | (3,788 | ) | ||||||||||||
Net income (loss) attributable to common stockholders | $ | 83 | $ | 77 | $ | 77 | $ | 294 | ||||||||||||
Earnings per share: | ||||||||||||||||||||
Basic | $ | 0.01 | $ | 0.01 | 0.01 | 0.05 | ||||||||||||||
Diluted | 0.01 | 0.01 | 0.01 | 0.05 | ||||||||||||||||
Weighted-average common shares outstanding: | ||||||||||||||||||||
Basic | 5,762 | 5,762 | 5,762 | 5,762 | ||||||||||||||||
Diluted | 5,893 | 5,893 | 5,893 | 5,893 | ||||||||||||||||
See Notes to Condensed Consolidated Financial Statements in the Second Quarter 2017 Form 10-Q
Second Quarter 2017 Results | 17 | |
FANNIE MAE
(In conservatorship)
Condensed Consolidated Statements of Cash Flows— (Unaudited)
(Dollars in millions)
For the Six Months Ended June 30, | |||||||
2017 | 2016 | ||||||
Net cash provided by (used in) operating activities | $ | 262 | $ | (3,982 | ) | ||
Cash flows provided by investing activities: | |||||||
Proceeds from maturities and paydowns of trading securities held for investment | 937 | 1,109 | |||||
Proceeds from sales of trading securities held for investment | 124 | 1,313 | |||||
Proceeds from maturities and paydowns of available-for-sale securities | 1,214 | 1,778 | |||||
Proceeds from sales of available-for-sale securities | 922 | 7,584 | |||||
Purchases of loans held for investment | (90,180 | ) | (97,024 | ) | |||
Proceeds from repayments of loans acquired as held for investment of Fannie Mae | 12,835 | 11,804 | |||||
Proceeds from sales of loans acquired as held for investment of Fannie Mae | 2,361 | 1,964 | |||||
Proceeds from repayments and sales of loans acquired as held for investment of consolidated trusts | 208,576 | 238,188 | |||||
Net change in restricted cash | 5,954 | (6,818 | ) | ||||
Advances to lenders | (57,533 | ) | (57,956 | ) | |||
Proceeds from disposition of acquired property and preforeclosure sales | 6,874 | 8,557 | |||||
Net change in federal funds sold and securities purchased under agreements to resell or similar arrangements | 1,195 | 5,025 | |||||
Other, net | (208 | ) | (661 | ) | |||
Net cash provided by investing activities | 93,071 | 114,863 | |||||
Cash flows used in financing activities: | |||||||
Proceeds from issuance of debt of Fannie Mae | 489,301 | 432,025 | |||||
Payments to redeem debt of Fannie Mae | (514,228 | ) | (456,586 | ) | |||
Proceeds from issuance of debt of consolidated trusts | 181,764 | 171,004 | |||||
Payments to redeem debt of consolidated trusts | (250,251 | ) | (244,631 | ) | |||
Payments of cash dividends on senior preferred stock to Treasury | (8,250 | ) | (3,778 | ) | |||
Other, net | 11 | 30 | |||||
Net cash used in financing activities | (101,653 | ) | (101,936 | ) | |||
Net increase (decrease) in cash and cash equivalents | (8,320 | ) | 8,945 | ||||
Cash and cash equivalents at beginning of period | 25,224 | 14,674 | |||||
Cash and cash equivalents at end of period | $ | 16,904 | $ | 23,619 | |||
Cash paid during the period for: | |||||||
Interest | $ | 56,207 | $ | 52,354 | |||
Income taxes | 1,070 | 610 | |||||
See Notes to Condensed Consolidated Financial Statements in the Second Quarter 2017 Form 10-Q
Second Quarter 2017 Results | 18 | |