Attached files
| file | filename |
|---|---|
| EX-99.4 - EX-99.4 ANNOUNCEMENT - ADVANCED DRAINAGE SYSTEMS, INC. | wms-ex994_45.htm |
| 8-K - 8-K 1Q RESULTS - ADVANCED DRAINAGE SYSTEMS, INC. | wms-8k_20170630.htm |
| EX-99.3 - EX-99.3 DIVIDEND - ADVANCED DRAINAGE SYSTEMS, INC. | wms-ex993_8.htm |
| EX-99.1 - EX-99.1 EARNINGS RELEASE - ADVANCED DRAINAGE SYSTEMS, INC. | wms-ex991_7.htm |
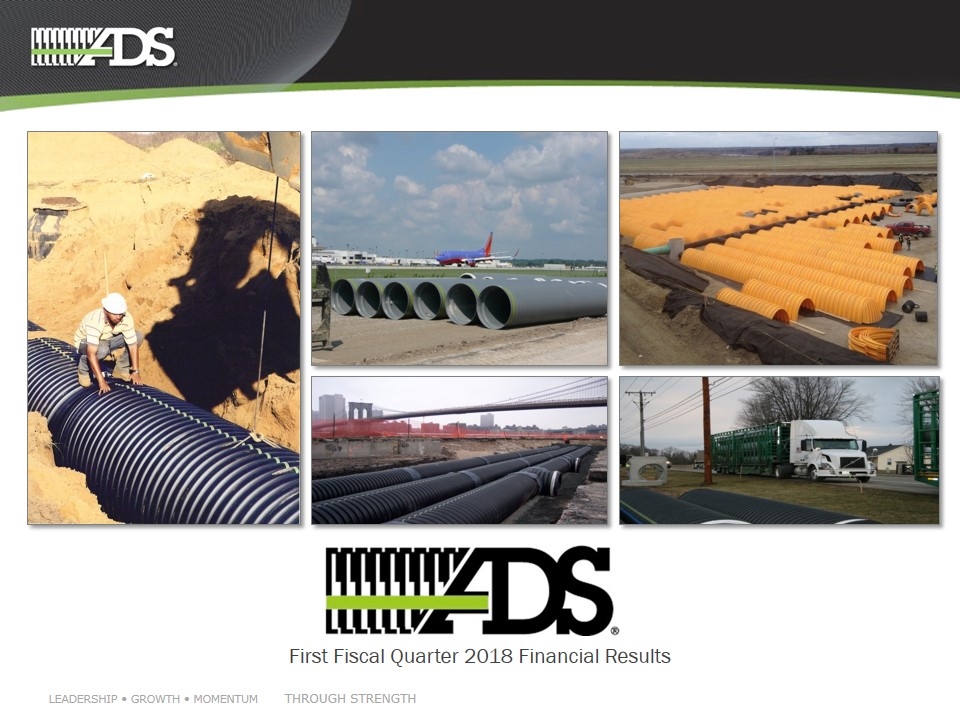
First Fiscal Quarter 2018 Financial Results
Management Presenters Joe Chlapaty Chairman and Chief Executive Officer Scott Cottrill Executive Vice President, Chief Financial Officer, Secretary and Treasurer Mike Higgins Director, Investor Relations & Business Strategy
Safe Harbor and Non-GAAP Financial Metrics Certain statements in this presentation may be deemed to be forward-looking statements within the meaning of Section 27A of the Securities Act of 1933, as amended, and Section 21E of the Securities Exchange Act of 1934, as amended. Such statements include, but are not limited to, statements regarding the anticipated timing for the issuance of additional historic and future financial information and related filings. These statements are not historical facts but rather are based on the Company’s current expectations, estimates and projections regarding the Company’s business, operations and other factors relating thereto. Words such as “may,” “will,” “could,” “would,” “should,” “anticipate,” “predict,” “potential,” “continue,” “expects,” “intends,” “plans,” “projects,” “believes,” “estimates,” “confident” and similar expressions are used to identify these forward-looking statements. Factors that could cause actual results to differ from those reflected in forward-looking statements relating to our operations and business include: fluctuations in the price and availability of resins and other raw materials and our ability to pass any increased costs of raw materials on to our customers in a timely manner; volatility in general business and economic conditions in the markets in which we operate, including, without limitation, factors relating to availability of credit, interest rates, fluctuations in capital and business and consumer confidence; cyclicality and seasonality of the non-residential and residential construction markets and infrastructure spending; the risks of increasing competition in our existing and future markets, including competition from both manufacturers of high performance thermoplastic corrugated pipe and manufacturers of products using alternative materials; our ability to continue to convert current demand for concrete, steel and PVC pipe products into demand for our high performance thermoplastic corrugated pipe and Allied Products; the effect of weather or seasonality; the loss of any of our significant customers; the risks of doing business internationally; the risks of conducting a portion of our operations through joint ventures; our ability to expand into new geographic or product markets; our ability to achieve the acquisition component of our growth strategy; the risk associated with manufacturing processes; our ability to manage our assets; the risks associated with our product warranties; our ability to manage our supply purchasing and customer credit policies; the risks associated with our self-insured programs; our ability to control labor costs and to attract, train and retain highly-qualified employees and key personnel; our ability to protect our intellectual property rights; changes in laws and regulations, including environmental laws and regulations; our ability to project product mix; the risks associated with our current levels of indebtedness; our ability to meet future capital requirements and fund our liquidity needs; the risk that additional information may arise during the course of the Company’s ongoing accounting review that would require the Company to make additional adjustments or revisions or to restate further the financial statements and other financial data for certain prior periods and any future periods; a conclusion that the Company’s disclosure controls and procedures (as defined in Rules 13a-15(e) and 15d-15(e) of the Exchange Act) were ineffective; the review of potential weaknesses or deficiencies in the Company’s disclosure controls and procedures, and discovering further weaknesses of which we are not currently aware or which have not been detected; additional uncertainties related to accounting issues generally and other risks and uncertainties described in the Company’s filings with the Securities and Exchange Commission. New risks and uncertainties emerge from time to time and it is not possible for the Company to predict all risks and uncertainties that could have an impact on the forward-looking statements contained in this press release. In light of the significant uncertainties inherent in the forward-looking information included herein, the inclusion of such information should not be regarded as a representation by the Company or any other person that the Company’s expectations, objectives or plans will be achieved in the timeframe anticipated or at all. Investors are cautioned not to place undue reliance on the Company’s forward-looking statements and the Company undertakes no obligation to publicly update or revise any forward-looking statements, whether as a result of new information, future events or otherwise, except as required by law. This presentation includes certain non-GAAP financial measures to describe the Company’s performance. The reconciliation of those measures to GAAP measures are provided within the appendix of the presentation. Those disclosures should not be viewed as a substitute for operating results determined in accordance with GAAP, nor are they necessarily comparable to non-GAAP performance measures that may be presented by other companies.
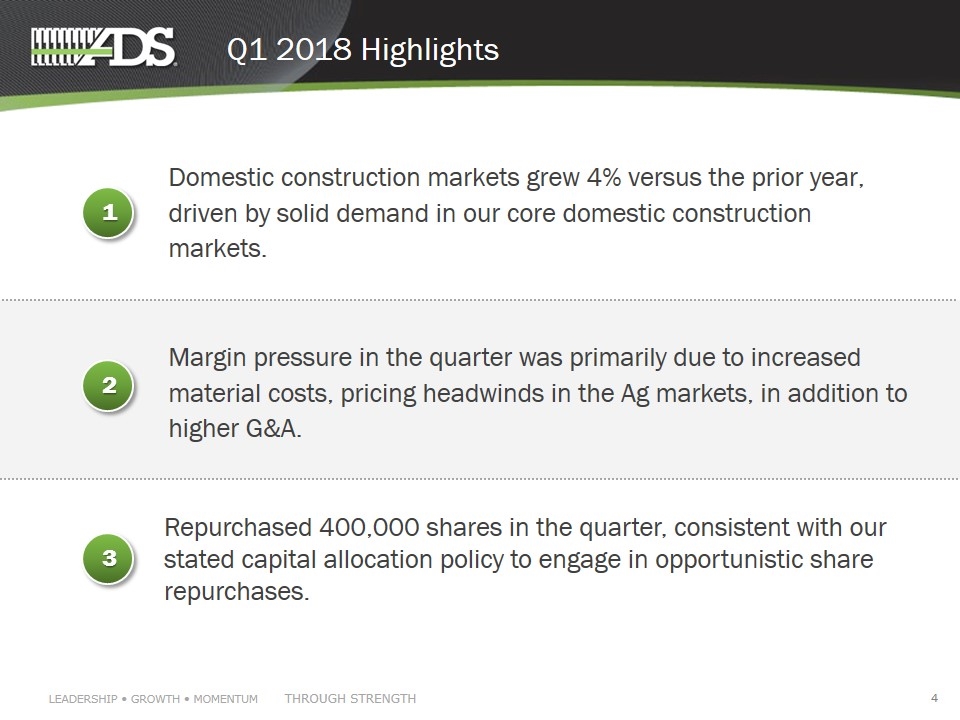
Domestic construction markets grew 4% versus the prior year, driven by solid demand in our core domestic construction markets. 1 Q1 2018 Highlights 2 3 Repurchased 400,000 shares in the quarter, consistent with our stated capital allocation policy to engage in opportunistic share repurchases. Margin pressure in the quarter was primarily due to increased material costs, pricing headwinds in the Ag markets, in addition to higher G&A.
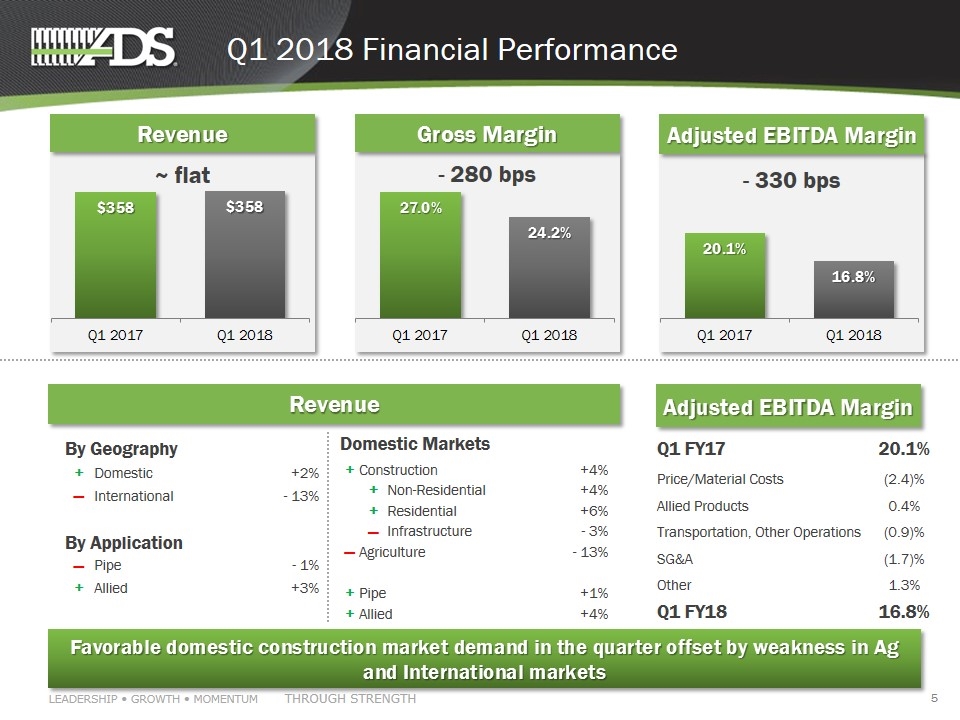
Q1 2018 Financial Performance Favorable domestic construction market demand in the quarter offset by weakness in Ag and International markets Adjusted EBITDA Margin - 330 bps (USD, in millions) Revenue Adjusted EBITDA Margin Q1 FY17 20.1% Price/Material Costs (2.4)% Allied Products 0.4% Transportation, Other Operations (0.9)% SG&A (1.7)% Other 1.3% Q1 FY18 16.8% ~ flat Revenue - 280 bps Gross Margin Domestic Markets + Construction +4% + Non-Residential +4% + Residential +6% ▬ Infrastructure - 3% ▬ Agriculture - 13% + Pipe +1% + Allied +4% By Geography + Domestic +2% ▬ International - 13% By Application ▬ Pipe - 1% + Allied +3%
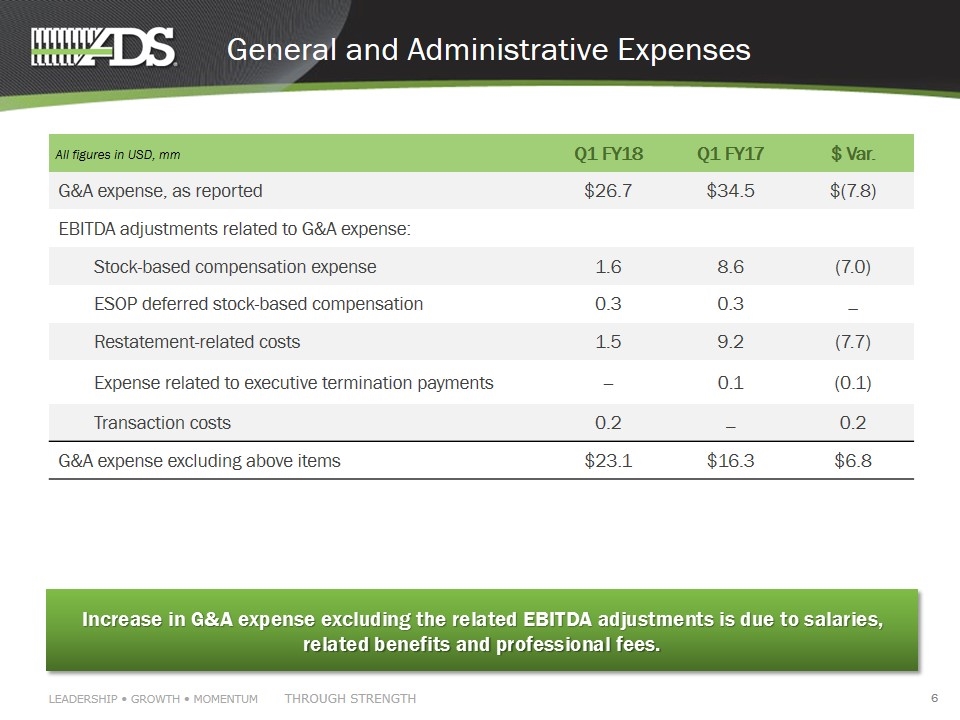
General and Administrative Expenses Q1 FY18 Q1 FY17 $ Var. G&A expense, as reported $26.7 $34.5 $(7.8) EBITDA adjustments related to G&A expense: Stock-based compensation expense 1.6 8.6 (7.0) ESOP deferred stock-based compensation 0.3 0.3 _ Restatement-related costs 1.5 9.2 (7.7) Expense related to executive termination payments _ 0.1 (0.1) Transaction costs 0.2 _ 0.2 G&A expense excluding above items $23.1 $16.3 $6.8 All figures in USD, mm Increase in G&A expense excluding the related EBITDA adjustments is due to salaries, related benefits and professional fees.
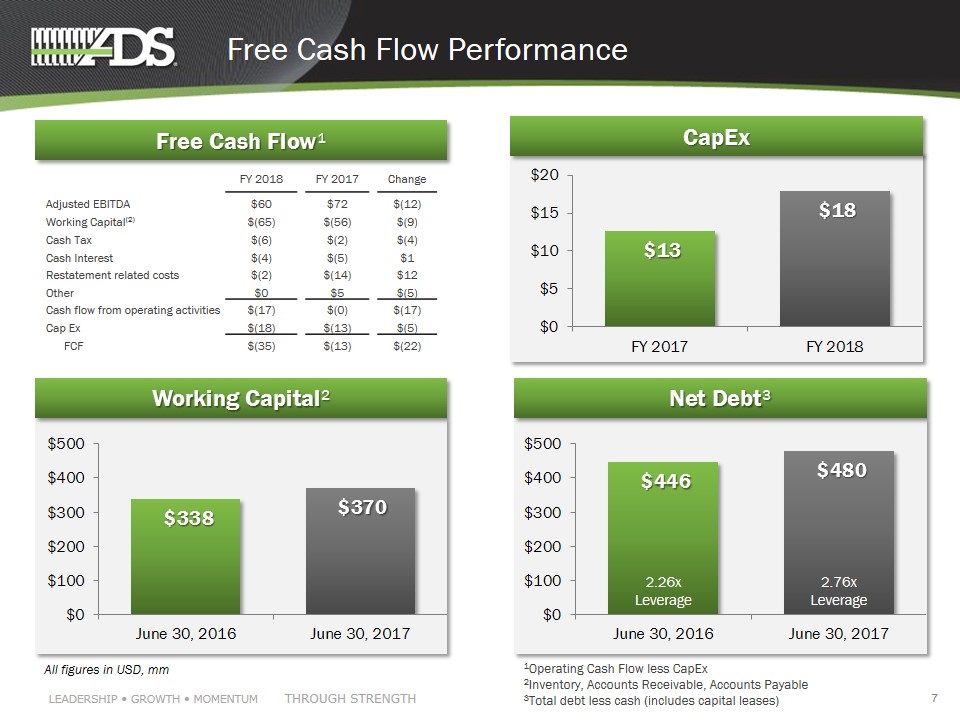
Free Cash Flow¹ Free Cash Flow Performance % of Sales 2.7% 3.5% All figures in USD, mm Net Debt³ FY 2018 FY 2017 Change Adjusted EBITDA $60 $72 $(12) Working Capital(2) $(65) $(56) $(9) Cash Tax $(6) $(2) $(4) Cash Interest $(4) $(5) $1 Restatement related costs $(2) $(14) $12 Other $0 $5 $(5) Cash flow from operating activities $(17) $(0) $(17) Cap Ex $(18) $(13) $(5) FCF $(35) $(13) $(22) 1Operating Cash Flow less CapEx 2Inventory, Accounts Receivable, Accounts Payable 3Total debt less cash (includes capital leases) 2.26x Leverage 2.76x Leverage CapEx Working Capital²
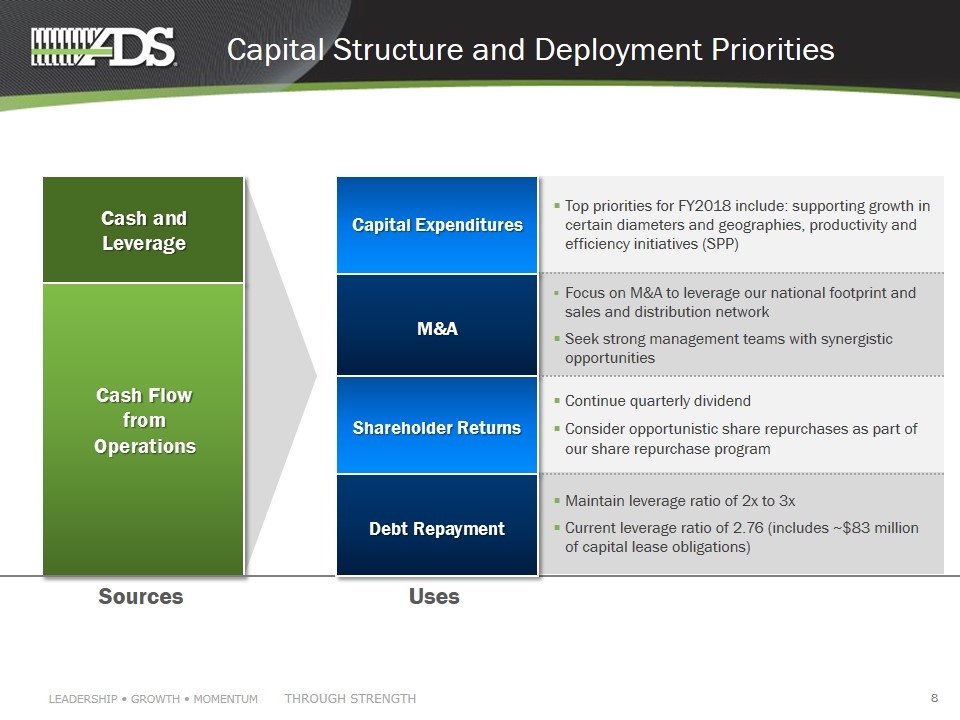
Capital Structure and Deployment Priorities Cash and Leverage Cash Flow from Operations Sources Uses Top priorities for FY2018 include: supporting growth in certain diameters and geographies, productivity and efficiency initiatives (SPP) Focus on M&A to leverage our national footprint and sales and distribution network Seek strong management teams with synergistic opportunities Continue quarterly dividend Consider opportunistic share repurchases as part of our share repurchase program Maintain leverage ratio of 2x to 3x Current leverage ratio of 2.76 (includes ~$83 million of capital lease obligations) Capital Expenditures M&A Shareholder Returns Debt Repayment
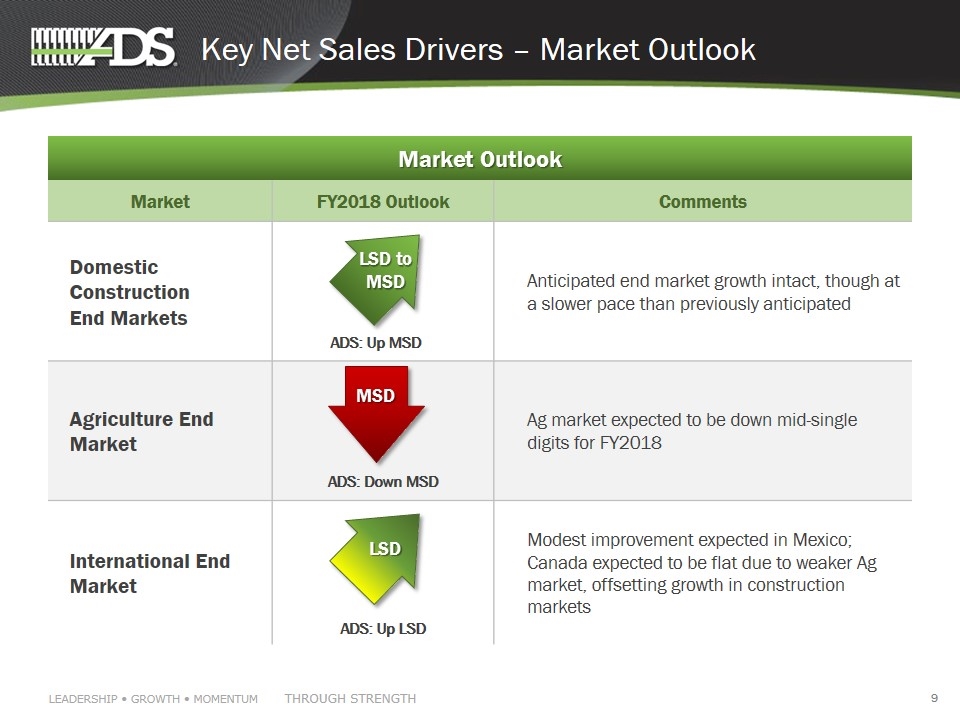
Market FY2018 Outlook Comments Domestic Construction End Markets Anticipated end market growth intact, though at a slower pace than previously anticipated Agriculture End Market Ag market expected to be down mid-single digits for FY2018 International End Market Modest improvement expected in Mexico; Canada expected to be flat due to weaker Ag market, offsetting growth in construction markets Key Net Sales Drivers – Market Outlook Market Outlook LSD to MSD MSD LSD ADS: Up MSD ADS: Down MSD ADS: Up LSD
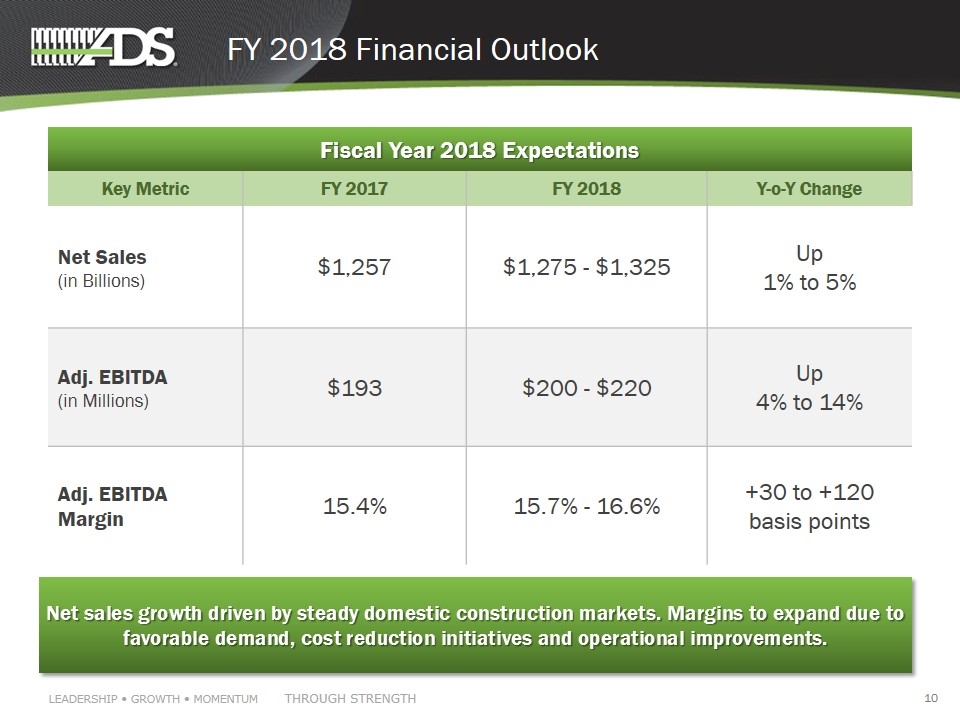
FY 2018 Financial Outlook Key Metric FY 2017 FY 2018 Y-o-Y Change Net Sales (in Billions) $1,257 $1,275 - $1,325 Up 1% to 5% Adj. EBITDA (in Millions) $193 $200 - $220 Up 4% to 14% Adj. EBITDA Margin 15.4% 15.7% - 16.6% +30 to +120 basis points Fiscal Year 2018 Expectations Net sales growth driven by steady domestic construction markets. Margins to expand due to favorable demand, cost reduction initiatives and operational improvements.

Q&A Session
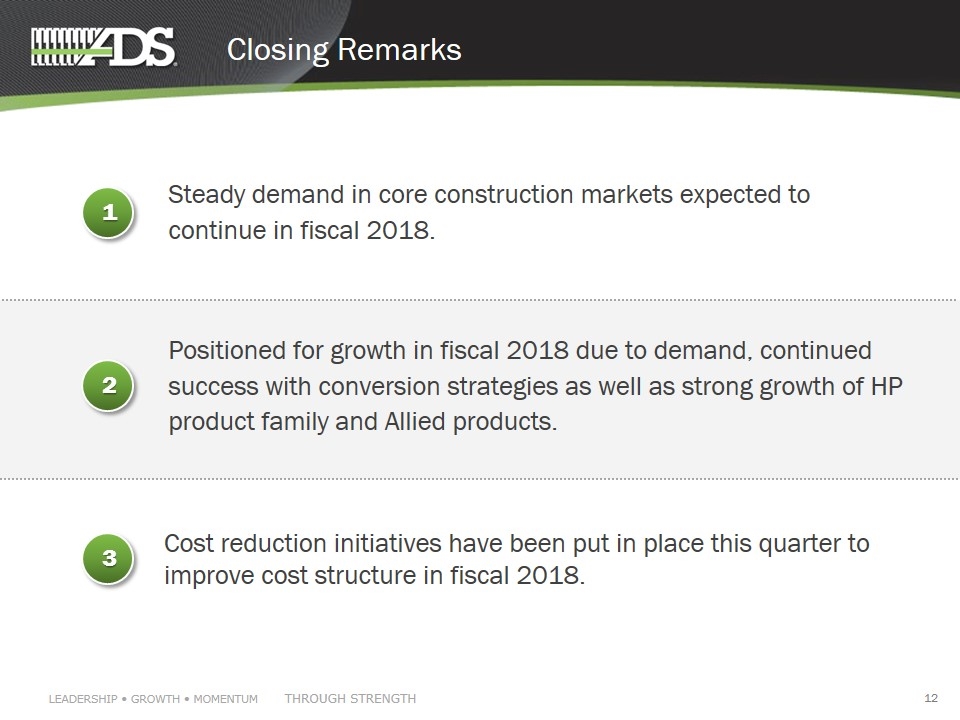
Steady demand in core construction markets expected to continue in fiscal 2018. 1 Closing Remarks 2 3 Cost reduction initiatives have been put in place this quarter to improve cost structure in fiscal 2018. Positioned for growth in fiscal 2018 due to demand, continued success with conversion strategies as well as strong growth of HP product family and Allied products.
Appendix
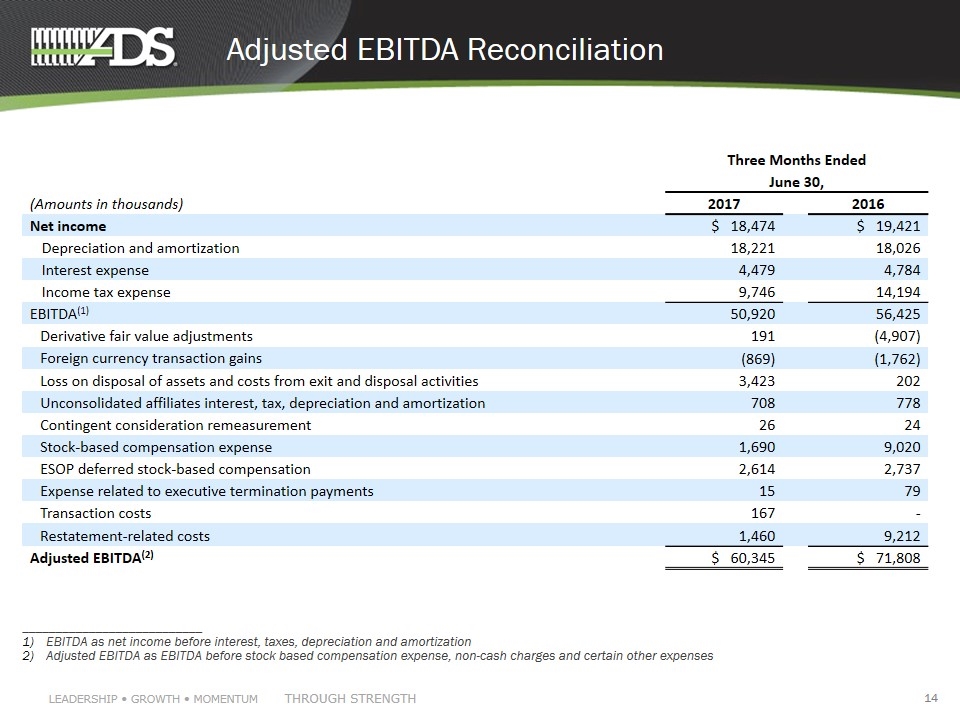
Adjusted EBITDA Reconciliation ___________________________ EBITDA as net income before interest, taxes, depreciation and amortization Adjusted EBITDA as EBITDA before stock based compensation expense, non-cash charges and certain other expenses Three Months Ended June 30, (Amounts in thousands) 2017 2016 Net income $ 18,474 $ 19,421 Depreciation and amortization 18,221 18,026 Interest expense 4,479 4,784 Income tax expense 9,746 14,194 EBITDA(1) 50,920 56,425 Derivative fair value adjustments 191 (4,907) Foreign currency transaction gains (869) (1,762) Loss on disposal of assets and costs from exit and disposal activities 3,423 202 Unconsolidated affiliates interest, tax, depreciation and amortization 708 778 Contingent consideration remeasurement 26 24 Stock-based compensation expense 1,690 9,020 ESOP deferred stock-based compensation 2,614 2,737 Expense related to executive termination payments 15 79 Transaction costs 167 - Restatement-related costs 1,460 9,212 Adjusted EBITDA(2) $ 60,345 $ 71,808
