Attached files
| file | filename |
|---|---|
| 8-K - 8-K - Tesla, Inc. | tsla-8k_20170802.htm |
Exhibit 99.1
|
|
|
Tesla Second Quarter 2017 Update
•Model 3 production on track to achieve previously announced targets •Expecting positive Model 3 gross margin in Q4; targeting 25% margin in 2018 •Deliveries grew 53% compared to Q2’16 in flat luxury vehicle market •Projecting Model S and Model X deliveries to increase in 2H’17 vs 1H’17 •Q2 Automotive gross margin at 27.9% GAAP and 25.0% non-GAAP •Q2 GAAP loss from operations improved sequentially, two quarters in a row •More than $3 billion cash on-hand at the end of Q2
|

On July 28, 2017, we started delivering the “even more affordable car” from our original Master Plan. This was a huge milestone for Tesla and is very exciting for our entire team.
During Q2, our engineering, manufacturing and supply chain teams were focused on the final stages of Model 3 product development and building the “machine-that-makes-the-machine” for the start of production. Model 3 has been designed to be affordably priced and to provide compelling customer value, even without government incentives, while achieving a target gross margin comparable to Model S and Model X as production scales into 2018. With no advertising, paid endorsements or guerilla marketing campaigns, Model 3 net reservations have still steadily climbed every month, and have even accelerated further in recent weeks.
Orders for Model S and Model X have also been increasing, both leading up to and following the Model 3 handover event. In July, our weekly net order rate for these vehicles was about 15% higher than our Q2 average weekly order rate. In addition, although too early to draw strong conclusions, we are seeing an even further increase in net Model S orders since the July 28th event. This growing demand gives us even more reason to expect increased deliveries of Model S and Model X in the second half of this year.
Development of our other new products continues as well. The first Solar Roof installations have been completed recently at the homes of our employees, who we chose to be our first customers to help perfect all aspects of Solar Roof customer experience. By pairing either Solar Roof or our existing retrofit solar panels with a Powerwall, our customers can enjoy sustainable energy independence.
Having started production of Model 3 on schedule in July, and having installed the first Solar Roofs, our teams are now focused on ramping the production rate of these products to support our mission of accelerating the world’s transition to sustainable energy.
ADVANCING SUSTAINABLE TRANSPORT
|
In addition to the increased orders for Model S and Model X, customer response to Model 3 has been overwhelming. Since the handover event last week, we are averaging over 1,800 net Model 3 reservations per day. We opened the Model 3 configurator to the thousands of our employees with reservations so they could begin ordering their vehicles. Soon, non-employee customers will begin receiving invitations to order their cars in small groups based on when they placed their reservations, with existing Tesla owners receiving first priority. Deliveries to non-employees will begin in Q4.
Our first production vehicles are pre-configured with rear-wheel drive, a long-range battery starting at $44,000, with premium upgrades for an additional $5,000. This vehicle will offer a range of 310 miles and a 0-60 mph time of 5.1 seconds. The standard Model 3, starting at $35,000 with 220 miles of range and a 0-60 mph time of 5.6 seconds, should be available in the U.S. in November. Dual Motor All-Wheel Drive configurations will be available in the U.S. early next year. International Model 3 deliveries will begin in late 2018, contingent upon regulatory approvals, starting with left-hand drive markets, followed by right-hand drive markets in 2019.
|
Model 3 Handover Event, July 28, 2017
|

|
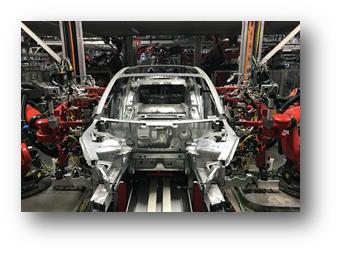
Model 3 Body Welding Line
|
We have learned many valuable lessons from designing and manufacturing Model S and Model X. Consequently, Model 3 is designed with greater simplicity and fewer components to reduce cost, improve ease of manufacturability and further enhance reliability. Early Model 3 builds will have fewer than 100 permutations due to standardized content and packaged options as compared to over 1,500 permutations for Model S. This significantly reduces manufacturing complexity and streamlines the purchasing process for our customers. At our Fremont factory, the new Model 3 body welding line and multi-level general assembly line are highly dense and automated. This densification sets the stage for us to produce over 500,000 Model 3 vehicles annually. Model 3 drive units as well as battery packs made with our proprietary 2170 form factor cells are being built on new lines at Gigafactory 1. We are now fine-tuning these manufacturing lines to significantly increase the production rate.
|
We wish we could do all of this faster and get everyone’s Model 3 to them right away. It’s important to understand that our production ramp will follow an S-Curve, meaning that it will begin slowly, grow exponentially, then start to tail off once we achieve full production. As we move through that ramp, our rate of production will move only as fast as the least successful part of our entire supply chain and production process. Based on our preparedness at this time, we are confident we can produce just over 1,500 vehicles in Q3, and achieve a run rate of 5,000 vehicles per week by the end of 2017. We also continue to plan on increasing Model 3 production to 10,000 vehicles per week at some point in 2018.
Model S and Model X remain our highest-performance and most capable vehicles, with greater range and acceleration, more premium features, more cargo space and extra options for customization. Both Model S and Model X are available now with Dual Motor All Wheel Drive, smart air suspension, and for customers referred by an existing Tesla owner, free unlimited Supercharging for as long as you own your car.
We continue to improve all Model S and Model X vehicles. In June, through a combination of new hardware and software updates, we enhanced the performance of new Model S and Model X 75D and 100D vehicles, with improved 0-60 mph times for each. We also recently pushed a new over-the-air update for Autopilot that added automatic perpendicular parking, and enhanced Autosteer and automatic emergency braking capabilities.
In June, the National Highway Traffic Safety Administration (NHTSA) awarded Model X a 5-star safety rating, the first such achievement for any sport utility vehicle. Significantly, Model X achieved a 5-star rating across the board on all nine subcategories covering frontal, side, and pole impacts for the driver-side, passenger-side, and rollover tests. This is the second-best set of test results for any car ever tested by NHTSA, behind only Model S, which received the lowest probability of injury score ever.
During Q2, we opened 29 new store and service locations, bringing us to a total of 300 locations globally. Ahead of scaling deliveries for Model 3, we have also broadened our distribution capabilities with the launch of new delivery hubs. We are also continuing to expand our service capability and build out our Supercharger network to achieve our goal of doubling the number of connection points in 2017.
We produced 25,708 vehicles in Q2, 40% more cars than we built in the same period a year ago, despite a production shortfall of 100 kWh battery packs through early June. During Q2, we added more Model X cars to our test drive and display fleet because our stores had been operating with far less than what was needed and, in some cases, none at all. In addition, we increased our service loaner fleet with fully loaded cars to provide the best customer experience. This additional visibility was likely a factor in helping Model X net orders in Q2, which grew by over 20% both sequentially and as compared to Q2 2016.
We delivered 22,026 Model S and Model X vehicles in Q2, for a total of 47,077 in the first half of the year. Model S and Model X combined deliveries in Q2 grew almost 53% globally versus the prior year, even though the luxury vehicle market was essentially flat. The combined Model S and Model X market share grew in the U.S. premium luxury vehicle market during Q2 2017.
ADVANCING SUSTAINABLE ENERGY
Our energy generation and storage business are strategically important long-term growth initiatives.
We officially began taking orders for Solar Roof in Q2 and have recently started installations. Adopting solar has historically required a degree of aesthetic compromise, but Solar Roof provides clean energy from a better-looking roof. Furthermore, Solar Roof is more affordable than conventional roofs because in most cases, it ultimately pays for itself by reducing or eliminating a home’s electricity bill.
Solar Roof is built with tempered glass that is more than three times stronger than standard roof tiles, and with less weight. In June, Solar Roof was certified by Underwriters Laboratories with its highest Class A fire rating. It has also been awarded ASTM International’s best Class F wind rating. We are so confident in the superior durability of our Solar Roof tiles that we offer the best warranty in the roofing industry—the lifetime of your house, or infinity, whichever comes first.


Q2 2017 RESULTS
Revenue & Gross Margin
|
|
Three Months Ended |
|
|
Change |
|
|||||||||||||
|
|
June 30, |
|
|
March 31, |
|
|
June 30, |
|
|
|
|
|
|
|
|
|||
|
|
2017 |
|
|
2017 |
|
|
2016 |
|
|
QoQ |
|
YoY |
|
|||||
|
Automotive revenue ($000) |
$ |
2,286,616 |
|
|
$ |
2,289,600 |
|
|
$ |
1,181,852 |
|
|
|
0 |
% |
|
93 |
% |
|
Automotive gross margin - GAAP |
|
27.9 |
% |
|
|
27.4 |
% |
|
|
23.1 |
% |
|
|
55 |
bp |
|
486 |
bp |
|
Automotive gross margin excluding SBC and ZEV credit - Non-GAAP |
|
25.0 |
% |
|
|
27.8 |
% |
|
|
23.6 |
% |
|
|
-285 |
bp |
|
136 |
bp |
|
• |
Automotive revenue grew 93% as compared to Q2 2016 largely due to 53% growth in total vehicle deliveries, and a smaller percentage of vehicles sold with residual value risk that were subject to lease accounting. Compared to the prior quarter, automotive revenue was flat despite a decline in vehicle deliveries due to lower mix of deliveries subject to lease accounting and the sale of $100 million of ZEV credits in Q2. |
|
• |
About 19% of Q2 deliveries were subject to lease accounting, down from about 25% in Q1, as we retained residual risk on fewer vehicle deliveries. When we do retain residual risk through a Resale Value Guarantee, or direct or indirect leasing, our vehicles are holding value better than estimated. Thus, we expect to be break even when re-selling them. |
|
• |
In line with our guidance, Q2 non-GAAP automotive gross margin was 25.0%, representing a sequential decline of about 285 basis points primarily due to the absence of the one-time benefit of Autopilot software recognized in Q1 and fluctuations in product mix. |
|
|
Three Months Ended |
|
|
Change |
|
|||||||||||||
|
|
June 30, |
|
|
March 31, |
|
|
June 30, |
|
|
|
|
|
|
|
|
|||
|
|
2017 |
|
|
2017 |
|
|
2016 |
|
|
QoQ |
|
YoY |
|
|||||
|
Energy generation and storage revenue ($000) |
$ |
286,780 |
|
|
$ |
213,944 |
|
|
$ |
3,947 |
|
|
|
34 |
% |
|
7166 |
% |
|
Energy generation and storage gross margin |
|
28.9 |
% |
|
|
29.1 |
% |
|
|
-106.7 |
% |
|
|
-11 |
bp |
|
13,566 |
bp |
|
• |
Q2 Energy generation and storage revenue increased 34% sequentially primarily because of a seasonal increase in solar lease revenue resulting from higher energy production versus the prior quarter, a greater percentage of cash sales and higher deployment of energy storage systems. |
|
• |
Total Q2 operating expenses declined sequentially primarily due to the absence of $67 million of non-recurring charges related to acquisitions that were recognized in Q1. |
|
• |
GAAP and non-GAAP loss from operations improved in Q2 as compared to Q1 due to lower operating expenses, despite increased costs related to the launch of Model 3. |
|
• |
GAAP and non-GAAP net loss increased slightly in Q2 as compared to Q1 due largely to higher FX-related non-cash revaluations of the balance sheet, and mark-to-market of interest rate swaps. |
|
• |
Basic shares outstanding at the end of Q2 were approximately 167 million. |
Cash Flow and Liquidity
|
|
Three Months Ended |
|
|
Change |
|
|||||||||||||
|
|
June 30, |
|
|
March 31, |
|
|
June 30, |
|
|
|
|
|
|
|
|
|||
|
($000) |
2017 |
|
|
2017 |
|
|
2016 |
|
|
QoQ |
|
YoY |
|
|||||
|
Cash flows (used in) provided by operating activities |
$ |
(200,172 |
) |
|
$ |
(69,811 |
) |
|
$ |
150,336 |
|
|
|
-187 |
% |
|
-233 |
% |
|
Change in collateralized lease borrowing |
|
149,320 |
|
|
|
186,355 |
|
|
|
142,762 |
|
|
|
-20 |
% |
|
5 |
% |
|
Operating cash flows plus change in collateralized lease borrowing |
$ |
(50,852 |
) |
|
$ |
116,544 |
|
|
$ |
293,098 |
|
|
|
144 |
% |
|
-117 |
% |
|
• |
Cash consumed in operating activities during Q2 was higher than Q1 primarily due to higher inventory and receivables. Including the cash received for vehicle sales to our leasing partners that is classified in the financing section of our statement of cash flows, we consumed $51 million of cash in Q2. |
|
• |
Capital expenditures were $959 million in Q2, as we invested in Model 3 capacity in Fremont, in Gigafactory 1, and in the expansion of our customer support infrastructure. Total capital expenditures of $1.5 billion in the first half of 2017 were lower than expected primarily due to the timing of milestone-based cash payments. |
|
• |
Cash balance of slightly over $3.0 billion at the end of Q2, plus expected cash generated from operations in the second half of 2017, provide sufficient liquidity to fund our capex projections, and provide flexibility through the Model 3 ramp. |
|
• |
During Q2, we increased the capacity of our revolving asset-backed credit line by $625 million to $1.83 billion (with the ability to expand capacity by another $175 million to $2 billion). |
OUTLOOK
In addition to the 2017 Model 3 production guidance provided above, we expect Model S and Model X deliveries to increase in the second half of 2017, as compared to the first half of the year.
Several factors will influence our non-GAAP automotive gross margin for the rest of this year. The combined non-GAAP gross margin for Model S and Model X in Q3 will decline slightly from Q2, driven primarily by mix shift. Additionally, during the initial phase of the Model 3 ramp in Q3, the volume produced will be tiny relative to the installed production capacity. As a result, Model 3 gross margin in Q3 will be temporarily impacted by the excessive allocation of labor and overhead costs and depreciation over this tiny volume. In the absence of these one-time elevated cost allocations, Model 3 gross margin in Q3 would already be positive, resulting in a positive cash contribution. As capacity utilization improves, Model 3 non-GAAP gross margin is expected to be positive in Q4, and should improve rapidly in 2018 to our target of 25%. Consequently, we expect non-GAAP automotive gross margin to temporarily dip below 20% in Q3, before recovering in Q4 and beyond.
For the second half of 2017, we expect strong improvement in operating leverage as revenue should significantly increase in the second half of the year as compared to the first half, while operating expenses should remain essentially flat. Capital expenditures should be about $2 billion during the second half of 2017, as we make milestone-based payments for Model 3 equipment, continue with Gigafactory 1 construction, and expand our Supercharger, store, delivery hub, and service networks.
While delivering the first Model 3 cars was a major company milestone, we are now focused on the critical steps to ramp Model 3 production. We remain confident in our plans and look forward to the upcoming unveiling of the next exciting addition to our portfolio of electric vehicles – Semi Truck.
|
|
|
|
|
Elon Musk, Chairman & CEO |
|
Deepak Ahuja, Chief Financial Officer |


Tesla will provide a live webcast of its second quarter 2017 financial results conference call beginning at 2:30 p.m. PT on August 2, 2017, at ir.tesla.com. This webcast will also be available for replay for approximately one year thereafter.
NON-GAAP FINANCIAL INFORMATION
Consolidated financial information has been presented in accordance with GAAP as well as on a non-GAAP basis to supplement our consolidated financial results. Our non-GAAP financial measures include non-GAAP gross margin, non-GAAP net income (loss) attributable to common stockholders, non-GAAP net income (loss) attributable to common stockholders on a per share basis, and operating cash flows plus change in collateralized lease borrowing. Management believes that it is useful to supplement its GAAP financial statements with this non-GAAP information because management uses such information internally for its operating, budgeting and financial planning purposes. These non-GAAP financial measures also facilitate management’s internal comparisons to Tesla’s historical performance as well as comparisons to the operating results of other companies. Management also believes that presentation of the non-GAAP financial measures provides useful information to our investors regarding our financial condition and results of operations because it allows investors greater transparency to the information used by Tesla management in its financial and operational decision-making so that investors can see through the eyes of Tesla management regarding important financial metrics that Tesla management uses to run the business as well as allows investors to better understand Tesla’s performance. Non-GAAP information is not prepared under a comprehensive set of accounting rules and therefore, should only be read in conjunction with financial information reported under U.S. GAAP when understanding Tesla’s operating performance. A reconciliation between GAAP and non-GAAP financial information is provided below.
FORWARD-LOOKING STATEMENTS
Certain statements in this shareholder letter, including statements in the “Outlook” section; statements relating to the progress Tesla is making with respect to product development, such as Model 3 and Solar Roof; statements regarding growth in the number of Tesla store, service center, delivery hub, Supercharger and destination charger locations and in other service and repair capabilities; statements relating to the production, production rate and delivery timing of products such as Model 3 and Solar Roof and completion of energy generation and storage projects; statements regarding growth of our energy business and means to achieve such growth; growth in demand and orders for Tesla products and the catalysts for that growth; the ability to achieve product demand, volume, production, delivery, deployment, revenue, cash generation, cash flow, leasing, gross margin, spending, capital expenditure and profitability targets; productivity improvements and capacity expansion plans, such as for Gigafactory 1; and statements regarding Gigafactory 1 and Gigafactory 2 timing, plans and output expectations, including those related to battery and photovoltaic cell and other production, are “forward-looking statements” that are subject to risks and uncertainties. These forward-looking statements are based on management’s current expectations, and as a result of certain risks and uncertainties, actual results may differ materially from those projected. The following important factors, without limitation, could cause actual results to differ materially from those in the forward-looking statements: the risk of delays in the manufacture, production, delivery and/or completion of our vehicles and energy products, particularly Model 3; the ability to design and achieve and grow simultaneous and separate market acceptance of Model S, Model X and their variants, as well as new vehicle models, specifically Model 3; the ability of suppliers to meet quality and part delivery expectations at increasing volumes, especially with respect to Model 3 parts; adverse foreign exchange movements; any failures by Tesla products to perform as expected or if product recalls occur; Tesla’s ability to continue to reduce or control manufacturing and other costs; consumers’ willingness to adopt electric vehicles; competition in the automotive and energy product markets generally and the alternative fuel vehicle market and the premium sedan, premium SUV and small to medium-sized sedan markets in particular; Tesla’s ability to establish, maintain and strengthen the Tesla brand; Tesla’s ability to manage future growth effectively as we rapidly grow, especially internationally; the unavailability, reduction or elimination of government and economic incentives for electric vehicles and energy products; Tesla’s ability to establish, maintain and strengthen its relationships with strategic partners such as Panasonic; potential difficulties in finalizing, performing and realizing potential benefits under definitive agreements for Gigafactory 1 and Gigafactory 2, maintaining Gigafactory 1 and Gigafactory 2 implementation schedules, output and cost estimates; and Tesla’s ability to execute on its strategy for new store, delivery hub, service center, Supercharger and other locations and capabilities. More information on potential factors that could affect our financial results is included from time to time in our Securities and Exchange Commission filings and reports, including the risks identified under the section captioned “Risk Factors” in our quarterly report on Form 10-Q filed with the SEC on May 10, 2017. Tesla disclaims any obligation to update information contained in these forward-looking statements whether as a result of new information, future events, or otherwise.
|
Investor Relations Contact: Jeff Evanson Investor Relations ir@tesla.com |
|
|
|
Press Contact: David Arnold Communications press@tesla.com |
Condensed Consolidated Statements of Operations
(Unaudited)
(In thousands, except per share data)
|
|
|
Three Months Ended |
|
|
Six Months Ended |
|
||||||||||||||
|
|
|
June 30, |
|
|
March 31, |
|
|
June 30, |
|
|
June 30, |
|
|
June 30, |
|
|||||
|
|
|
2017 |
|
|
2017 |
|
|
2016 |
|
|
2017 |
|
|
2016 |
|
|||||
|
Revenues |
|
|
|
|
|
|
|
|
|
|
|
|
|
|
|
|
|
|
|
|
|
Automotive sales |
|
$ |
2,013,852 |
|
|
$ |
2,035,060 |
|
|
$ |
1,030,224 |
|
|
$ |
4,048,912 |
|
|
$ |
1,932,116 |
|
|
Automotive leasing |
|
|
272,764 |
|
|
|
254,540 |
|
|
|
151,628 |
|
|
|
527,304 |
|
|
|
275,800 |
|
|
Total automotive revenue |
|
|
2,286,616 |
|
|
|
2,289,600 |
|
|
|
1,181,852 |
|
|
|
4,576,216 |
|
|
|
2,207,916 |
|
|
Energy generation and storage |
|
|
286,780 |
|
|
|
213,944 |
|
|
|
3,947 |
|
|
|
500,724 |
|
|
|
26,675 |
|
|
Services and other |
|
|
216,161 |
|
|
|
192,726 |
|
|
|
84,218 |
|
|
|
408,887 |
|
|
|
182,474 |
|
|
Total revenues |
|
|
2,789,557 |
|
|
|
2,696,270 |
|
|
|
1,270,017 |
|
|
|
5,485,827 |
|
|
|
2,417,065 |
|
|
Cost of revenues |
|
|
|
|
|
|
|
|
|
|
|
|
|
|
|
|
|
|
|
|
|
Automotive sales |
|
|
1,472,578 |
|
|
|
1,496,649 |
|
|
|
827,231 |
|
|
|
2,969,227 |
|
|
|
1,540,380 |
|
|
Automotive leasing |
|
|
175,433 |
|
|
|
166,026 |
|
|
|
82,051 |
|
|
|
341,459 |
|
|
|
148,218 |
|
|
Total automotive cost of revenues |
|
|
1,648,011 |
|
|
|
1,662,675 |
|
|
|
909,282 |
|
|
|
3,310,686 |
|
|
|
1,688,598 |
|
|
Energy generation and storage |
|
|
203,762 |
|
|
|
151,773 |
|
|
|
8,159 |
|
|
|
355,535 |
|
|
|
26,272 |
|
|
Services and other |
|
|
271,169 |
|
|
|
213,876 |
|
|
|
77,800 |
|
|
|
485,045 |
|
|
|
174,951 |
|
|
Total cost of revenues (1) |
|
|
2,122,942 |
|
|
|
2,028,324 |
|
|
|
995,241 |
|
|
|
4,151,266 |
|
|
|
1,889,821 |
|
|
Gross profit |
|
|
666,615 |
|
|
|
667,946 |
|
|
|
274,776 |
|
|
|
1,334,561 |
|
|
|
527,244 |
|
|
Operating expenses |
|
|
|
|
|
|
|
|
|
|
|
|
|
|
|
|
|
|
|
|
|
Research and development (1) |
|
|
369,774 |
|
|
|
322,040 |
|
|
|
191,664 |
|
|
|
691,814 |
|
|
|
374,146 |
|
|
Selling, general and administrative (1) |
|
|
537,757 |
|
|
|
603,455 |
|
|
|
321,152 |
|
|
|
1,141,212 |
|
|
|
639,362 |
|
|
Total operating expenses |
|
|
907,531 |
|
|
|
925,495 |
|
|
|
512,816 |
|
|
|
1,833,026 |
|
|
|
1,013,508 |
|
|
Loss from operations |
|
|
(240,916 |
) |
|
|
(257,549 |
) |
|
|
(238,040 |
) |
|
|
(498,465 |
) |
|
|
(486,264 |
) |
|
Interest income |
|
|
4,785 |
|
|
|
3,090 |
|
|
|
2,242 |
|
|
|
7,875 |
|
|
|
3,493 |
|
|
Interest expense (2)(3) |
|
|
(108,441 |
) |
|
|
(99,346 |
) |
|
|
(46,368 |
) |
|
|
(207,787 |
) |
|
|
(86,993 |
) |
|
Other (expense) income, net |
|
|
(41,208 |
) |
|
|
(18,098 |
) |
|
|
(7,373 |
) |
|
|
(59,306 |
) |
|
|
1,804 |
|
|
Loss before income taxes |
|
|
(385,780 |
) |
|
|
(371,903 |
) |
|
|
(289,539 |
) |
|
|
(757,683 |
) |
|
|
(567,960 |
) |
|
Provision for income taxes |
|
|
15,647 |
|
|
|
25,278 |
|
|
|
3,649 |
|
|
|
40,925 |
|
|
|
7,495 |
|
|
Net loss |
|
|
(401,427 |
) |
|
|
(397,181 |
) |
|
|
(293,188 |
) |
|
|
(798,608 |
) |
|
|
(575,455 |
) |
|
Net loss attributable to noncontrolling interests and redeemable noncontrolling interests |
|
|
(65,030 |
) |
|
|
(66,904 |
) |
|
|
— |
|
|
|
(131,934 |
) |
|
|
— |
|
|
Net loss attributable to common stockholders |
|
$ |
(336,397 |
) |
|
$ |
(330,277 |
) |
|
$ |
(293,188 |
) |
|
$ |
(666,674 |
) |
|
$ |
(575,455 |
) |
|
Net loss per share of common stock attributable to common stockholders - basic and diluted |
|
$ |
(2.04 |
) |
|
$ |
(2.04 |
) |
|
$ |
(2.09 |
) |
|
$ |
(4.07 |
) |
|
$ |
(4.22 |
) |
|
Weighted average shares used in computing net loss per share of common stock - basic and diluted |
|
|
165,212 |
|
|
|
162,129 |
|
|
|
139,983 |
|
|
|
163,679 |
|
|
|
136,330 |
|
|
|
|
|
|
|
|
|
|
|
|
|
|
|
|
|
|
|
|
|
|
|
|
Notes: |
|
|
|
|
|
|
|
|
|
|
|
|
|
|
|
|
|
|
|
|
|
|
|
|
|
|
|
|
|
|
|
|
|
|
|
|
|
|
|
|
|
|
|
(1) Includes stock-based compensation expense of the following for the periods presented: |
|
|
|
|
|
|
|
|
|
|
|
|
|
|
|
|
|
|
|
|
|
Cost of revenue |
|
$ |
7,466 |
|
|
$ |
10,031 |
|
|
$ |
6,495 |
|
|
$ |
17,497 |
|
|
$ |
12,898 |
|
|
Research and development |
|
|
57,794 |
|
|
|
49,192 |
|
|
|
33,506 |
|
|
|
106,986 |
|
|
|
73,108 |
|
|
Selling, general and administrative |
|
|
50,782 |
|
|
|
44,494 |
|
|
|
27,311 |
|
|
|
95,276 |
|
|
|
70,963 |
|
|
Total stock-based compensation expense |
|
$ |
116,042 |
|
|
$ |
103,717 |
|
|
$ |
67,312 |
|
|
$ |
219,759 |
|
|
$ |
156,969 |
|
|
|
|
|
|
|
|
|
|
|
|
|
|
|
|
|
|
|
|
|
|
|
|
(2) Interest expense includes non-cash interest expense related to convertible notes and other borrowing for the periods presented: |
|
$ |
65,682 |
|
|
$ |
51,196 |
|
|
$ |
31,823 |
|
|
$ |
116,878 |
|
|
$ |
60,725 |
|
|
|
|
|
|
|
|
|
|
|
|
|
|
|
|
|
|
|
|
|
|
|
|
(3) Interest expense includes the following as a result of the assumed debt from SolarCity: |
|
|
|
|
|
|
|
|
|
|
|
|
|
|
|
|
|
|
|
|
|
Interest expense (excluding amortization of debt discount and fees) - recourse debt |
|
$ |
12,093 |
|
|
$ |
12,183 |
|
|
$ |
— |
|
|
$ |
24,276 |
|
|
$ |
— |
|
|
Interest expense (excluding amortization of debt discount and fees) - non-recourse debt |
|
|
23,694 |
|
|
|
24,084 |
|
|
|
— |
|
|
|
47,778 |
|
|
|
— |
|
|
|
|
$ |
35,787 |
|
|
$ |
36,267 |
|
|
$ |
— |
|
|
$ |
72,054 |
|
|
$ |
— |
|
Condensed Consolidated Balance Sheets
(Unaudited)
(In thousands)
|
|
|
June 30, |
|
|
December 31, |
|
||
|
|
|
2017 |
|
|
2016 |
|
||
|
Assets |
|
|
|
|
|
|
|
|
|
Current assets |
|
|
|
|
|
|
|
|
|
Cash and cash equivalents |
|
$ |
3,035,924 |
|
|
$ |
3,393,216 |
|
|
Restricted cash |
|
|
118,369 |
|
|
|
105,519 |
|
|
Accounts receivable, net |
|
|
453,539 |
|
|
|
499,142 |
|
|
Inventory |
|
|
2,438,111 |
|
|
|
2,067,454 |
|
|
Prepaid expenses and other current assets |
|
|
313,501 |
|
|
|
194,465 |
|
|
Total current assets |
|
|
6,359,444 |
|
|
|
6,259,796 |
|
|
Operating lease vehicles, net |
|
|
3,600,821 |
|
|
|
3,134,080 |
|
|
Solar energy systems, leased and to be leased, net |
|
|
6,218,504 |
|
|
|
5,919,880 |
|
|
Property, plant and equipment, net |
|
|
8,399,229 |
|
|
|
5,982,957 |
|
|
Goodwill and intangible assets, net |
|
|
424,613 |
|
|
|
376,145 |
|
|
MyPower customer notes receivable, net of current portion |
|
|
472,663 |
|
|
|
506,302 |
|
|
Restricted cash, net of current portion |
|
|
358,445 |
|
|
|
268,165 |
|
|
Other assets |
|
|
209,986 |
|
|
|
216,751 |
|
|
Total assets |
|
$ |
26,043,705 |
|
|
$ |
22,664,076 |
|
|
Liabilities and Equity |
|
|
|
|
|
|
|
|
|
Current liabilities |
|
|
|
|
|
|
|
|
|
Accounts payable |
|
$ |
2,359,316 |
|
|
$ |
1,860,341 |
|
|
Accrued liabilities and other |
|
|
1,510,744 |
|
|
|
1,210,028 |
|
|
Deferred revenue |
|
|
913,398 |
|
|
|
763,126 |
|
|
Resale value guarantees |
|
|
342,824 |
|
|
|
179,504 |
|
|
Customer deposits |
|
|
603,540 |
|
|
|
663,859 |
|
|
Current portion of long-term debt and capital leases (1) |
|
|
816,533 |
|
|
|
1,150,147 |
|
|
Total current liabilities |
|
|
6,546,355 |
|
|
|
5,827,005 |
|
|
Long-term debt and capital leases, net of current portion (1) |
|
|
7,125,406 |
|
|
|
5,969,500 |
|
|
Deferred revenue, net of current portion |
|
|
1,035,579 |
|
|
|
851,790 |
|
|
Resale value guarantees, net of current portion |
|
|
2,493,024 |
|
|
|
2,210,423 |
|
|
Other long-term liabilities |
|
|
2,259,538 |
|
|
|
1,891,449 |
|
|
Total liabilities |
|
|
19,459,902 |
|
|
|
16,750,167 |
|
|
Redeemable noncontrolling interests in subsidiaries |
|
|
367,377 |
|
|
|
367,039 |
|
|
Convertible senior notes (1)(2) |
|
|
1,688 |
|
|
|
8,784 |
|
|
Total stockholders' equity |
|
|
5,105,752 |
|
|
|
4,752,911 |
|
|
Noncontrolling interests in subsidiaries |
|
|
1,108,986 |
|
|
|
785,175 |
|
|
Total liabilities and equity |
|
$ |
26,043,705 |
|
|
$ |
22,664,076 |
|
|
|
|
|
|
|
|
|
|
|
|
(1)Breakdown of our debt is as follows: |
|
|
|
|
|
|
|
|
|
Recourse debt |
|
$ |
5,062,399 |
|
|
$ |
4,630,886 |
|
|
Non-recourse debt |
|
$ |
2,453,448 |
|
|
$ |
2,375,782 |
|
|
(2) |
Our common stock price exceeded the conversion threshold price of our convertible senior notes due 2018 (2018 Notes) issued in May 2013; therefore, the 2018 Notes are convertible at the holder’s option during the second quarter of 2017. As such, the carrying value of the 2018 Notes was classified as a current liability as of June 30, 2017 and the difference between the principal amount and the carrying value of the 2018 Notes was reflected as convertible debt in mezzanine equity on our condensed consolidated balance sheet as of June 30, 2017. |
Condensed Consolidated Statement of Cash Flows
(Unaudited)
(In thousands)
|
|
|
Three Months Ended |
|
|
Six Months Ended |
|
||||||||||||||
|
|
|
June 30, |
|
|
March 31, |
|
|
June 30, |
|
|
June 30, |
|
|
June 30, |
|
|||||
|
|
|
2017 |
|
|
2017 |
|
|
2016 |
|
|
2017 |
|
|
2016 |
|
|||||
|
Cash Flows From Operating Activities |
|
|
|
|
|
|
|
|
|
|
|
|
|
|
|
|
|
|
|
|
|
Net loss |
|
$ |
(401,427 |
) |
|
$ |
(397,181 |
) |
|
$ |
(293,188 |
) |
|
$ |
(798,608 |
) |
|
$ |
(575,455 |
) |
|
Adjustments to reconcile net loss to net cash used in operating activities: |
|
|
|
|
|
|
|
|
|
|
|
|
|
|
|
|
|
|
|
|
|
Depreciation and amortization |
|
|
389,171 |
|
|
|
376,602 |
|
|
|
183,232 |
|
|
|
765,773 |
|
|
|
339,692 |
|
|
Stock-based compensation |
|
|
116,042 |
|
|
|
103,717 |
|
|
|
67,311 |
|
|
|
219,759 |
|
|
|
156,969 |
|
|
Losses related to the SolarCity acquisition |
|
|
- |
|
|
|
11,571 |
|
|
|
- |
|
|
|
11,571 |
|
|
|
- |
|
|
Other |
|
|
177,135 |
|
|
|
98,260 |
|
|
|
33,497 |
|
|
|
275,395 |
|
|
|
91,070 |
|
|
Changes in operating assets and liabilities, net of effect of business combinations |
|
|
(481,093 |
) |
|
|
(262,780 |
) |
|
|
159,484 |
|
|
|
(743,873 |
) |
|
|
(111,545 |
) |
|
Net cash (used in) provided by operating activities |
|
|
(200,172 |
) |
|
|
(69,811 |
) |
|
|
150,336 |
|
|
|
(269,983 |
) |
|
|
(99,269 |
) |
|
Cash Flows From Investing Activities |
|
|
|
|
|
|
|
|
|
|
|
|
|
|
|
|
|
|
|
|
|
Capital expenditures |
|
|
(959,068 |
) |
|
|
(552,624 |
) |
|
|
(294,720 |
) |
|
|
(1,511,692 |
) |
|
|
(511,579 |
) |
|
Payments for the cost of solar energy systems, leased and to be leased |
|
|
(198,844 |
) |
|
|
(219,948 |
) |
|
|
- |
|
|
|
(418,792 |
) |
|
|
- |
|
|
Business combinations, net of cash acquired |
|
|
- |
|
|
|
(109,147 |
) |
|
|
- |
|
|
|
(109,147 |
) |
|
|
- |
|
|
Maturities of short-term marketable securities |
|
|
- |
|
|
|
- |
|
|
|
16,667 |
|
|
|
- |
|
|
|
16,667 |
|
|
Change in restricted cash and other |
|
|
(57,304 |
) |
|
|
(45,224 |
) |
|
|
(41,801 |
) |
|
|
(102,528 |
) |
|
|
(58,761 |
) |
|
Net cash used in investing activities |
|
|
(1,215,216 |
) |
|
|
(926,943 |
) |
|
|
(319,854 |
) |
|
|
(2,142,159 |
) |
|
|
(553,673 |
) |
|
Cash Flows From Financing Activities |
|
|
|
|
|
|
|
|
|
|
|
|
|
|
|
|
|
|
|
|
|
Proceeds from debt activities, net |
|
|
(203,412 |
) |
|
|
858,547 |
|
|
|
99,317 |
|
|
|
655,135 |
|
|
|
529,317 |
|
|
Collateralized borrowing |
|
|
149,320 |
|
|
|
186,355 |
|
|
|
142,762 |
|
|
|
335,675 |
|
|
|
384,525 |
|
|
Net cash flows from noncontrolling interests |
|
|
381,253 |
|
|
|
78,307 |
|
|
|
- |
|
|
|
459,560 |
|
|
|
- |
|
|
Proceeds from issuance of common stock in a public offering, net of underwriting fees |
|
|
- |
|
|
|
400,175 |
|
|
|
1,701,734 |
|
|
|
400,175 |
|
|
|
1,701,734 |
|
|
Other |
|
|
101,606 |
|
|
|
75,365 |
|
|
|
32,771 |
|
|
|
176,971 |
|
|
|
76,443 |
|
|
Net cash provided by financing activities |
|
|
428,767 |
|
|
|
1,598,749 |
|
|
|
1,976,584 |
|
|
|
2,027,516 |
|
|
|
2,692,019 |
|
|
Effect of exchange rate changes on cash and cash equivalents |
|
|
15,952 |
|
|
|
11,382 |
|
|
|
(2,554 |
) |
|
|
27,334 |
|
|
|
10,316 |
|
|
Net (decrease) increase in cash and cash equivalents |
|
|
(970,669 |
) |
|
|
613,377 |
|
|
|
1,804,512 |
|
|
|
(357,292 |
) |
|
|
2,049,393 |
|
|
Cash and cash equivalents at beginning of period |
|
|
4,006,593 |
|
|
|
3,393,216 |
|
|
|
1,441,789 |
|
|
|
3,393,216 |
|
|
|
1,196,908 |
|
|
Cash and cash equivalents at end of period |
|
$ |
3,035,924 |
|
|
$ |
4,006,593 |
|
|
$ |
3,246,301 |
|
|
$ |
3,035,924 |
|
|
$ |
3,246,301 |
|
Supplemental Consolidated Financial Information
|
|
|
Three Months Ended |
|
|
Six Months Ended |
|
||||||||||||||
|
|
|
June 30, |
|
|
March 31, |
|
|
June 30, |
|
|
June 30, |
|
|
June 30, |
|
|||||
|
Free Cash Flow ($000) |
|
2017 |
|
|
2017 |
|
|
2016 |
|
|
2017 |
|
|
2016 |
|
|||||
|
Cash flows (used in) provided by operating activities |
|
$ |
(200,172 |
) |
|
$ |
(69,811 |
) |
|
$ |
150,336 |
|
|
$ |
(269,983 |
) |
|
$ |
(99,269 |
) |
|
Capital expenditures |
|
|
(959,068 |
) |
|
|
(552,624 |
) |
|
|
(294,720 |
) |
|
|
(1,511,692 |
) |
|
|
(511,579 |
) |
|
Free cash flow |
|
$ |
(1,159,240 |
) |
|
$ |
(622,435 |
) |
|
$ |
(144,384 |
) |
|
$ |
(1,781,675 |
) |
|
$ |
(610,848 |
) |
Reconciliation of GAAP to Non-GAAP Financial Information
(Unaudited)
(In thousands, except per share data)
|
|
|
Three Months Ended |
|
|
Six Months Ended |
|
||||||||||||||
|
|
|
June 30, |
|
|
March 31, |
|
|
June 30, |
|
|
June 30, |
|
|
June 30, |
|
|||||
|
|
|
2017 |
|
|
2017 |
|
|
2016 |
|
|
2017 |
|
|
2016 |
|
|||||
|
Automotive gross profit - GAAP |
|
$ |
638,605 |
|
|
$ |
626,925 |
|
|
$ |
272,570 |
|
|
$ |
1,265,530 |
|
|
$ |
519,318 |
|
|
Stock-based compensation expense |
|
|
7,466 |
|
|
|
10,031 |
|
|
|
6,495 |
|
|
|
17,497 |
|
|
|
12,898 |
|
|
ZEV credit revenue recognized |
|
|
(100,000 |
) |
|
|
— |
|
|
|
(64 |
) |
|
|
(100,000 |
) |
|
|
(57,051 |
) |
|
Automotive gross profit excluding SBC and ZEV credit - Non-GAAP |
|
$ |
546,071 |
|
|
$ |
636,956 |
|
|
$ |
279,001 |
|
|
$ |
1,183,027 |
|
|
$ |
475,165 |
|
|
|
|
|
|
|
|
|
|
|
|
|
|
|
|
|
|
|
|
|
|
|
|
Automotive gross margin - GAAP |
|
|
27.9 |
% |
|
|
27.4 |
% |
|
|
23.1 |
% |
|
|
27.7 |
% |
|
|
23.5 |
% |
|
Stock-based compensation expense |
|
|
0.3 |
% |
|
|
0.4 |
% |
|
|
0.5 |
% |
|
|
0.4 |
% |
|
|
0.6 |
% |
|
ZEV credit revenue recognized |
|
|
-3.3 |
% |
|
|
0.0 |
% |
|
|
0.0 |
% |
|
|
-1.6 |
% |
|
|
-2.0 |
% |
|
Automotive gross margin excluding SBC and ZEV credit - Non-GAAP |
|
|
25.0 |
% |
|
|
27.8 |
% |
|
|
23.6 |
% |
|
|
26.4 |
% |
|
|
22.1 |
% |
|
|
|
|
|
|
|
|
|
|
|
|
|
|
|
|
|
|
|
|
|
|
|
Net loss attributable to common stockholders - GAAP |
|
$ |
(336,397 |
) |
|
$ |
(330,277 |
) |
|
$ |
(293,188 |
) |
|
$ |
(666,674 |
) |
|
$ |
(575,455 |
) |
|
Stock-based compensation expense |
|
|
116,042 |
|
|
|
103,717 |
|
|
|
67,312 |
|
|
|
219,759 |
|
|
|
156,969 |
|
|
Acquisition related transaction costs |
|
|
— |
|
|
|
— |
|
|
|
— |
|
|
|
— |
|
|
|
— |
|
|
Gains related to the acquisition of SolarCity |
|
|
— |
|
|
|
11,571 |
|
|
|
— |
|
|
|
11,571 |
|
|
|
— |
|
|
Net loss attributable to common stockholders - Non-GAAP |
|
$ |
(220,355 |
) |
|
$ |
(214,989 |
) |
|
$ |
(225,876 |
) |
|
$ |
(435,344 |
) |
|
$ |
(418,486 |
) |
|
|
|
|
|
|
|
|
|
|
|
|
|
|
|
|
|
|
|
|
|
|
|
Net loss per share attributable to common stockholders, basic and diluted - GAAP |
|
$ |
(2.04 |
) |
|
$ |
(2.04 |
) |
|
$ |
(2.09 |
) |
|
$ |
(4.07 |
) |
|
$ |
(4.22 |
) |
|
Stock-based compensation expense |
|
|
0.71 |
|
|
|
0.64 |
|
|
|
0.48 |
|
|
|
1.34 |
|
|
|
1.15 |
|
|
Acquisition related transaction costs |
|
|
|
|
|
|
— |
|
|
|
— |
|
|
|
— |
|
|
|
— |
|
|
Gains related to the acquisition of SolarCity |
|
|
— |
|
|
|
0.07 |
|
|
|
— |
|
|
|
0.07 |
|
|
|
— |
|
|
Net loss per share attributable to common stockholders, basic and diluted - Non-GAAP |
|
$ |
(1.33 |
) |
|
$ |
(1.33 |
) |
|
$ |
(1.61 |
) |
|
$ |
(2.66 |
) |
|
$ |
(3.07 |
) |
|
Shares used in per share calculation, basic and dilutive - GAAP and Non-GAAP |
|
|
165,212 |
|
|
|
162,129 |
|
|
|
139,983 |
|
|
|
163,679 |
|
|
|
136,330 |
|