Attached files
| file | filename |
|---|---|
| EX-99.1 - EXHIBIT 99.1 - Hi-Crush Inc. | exhibit991-earningsrelease.htm |
| 8-K - 8-K - Hi-Crush Inc. | q22017-earningsrelease8xk.htm |
INVESTOR PRESENTATION
AUGUST 2017
Forward Looking Statements
Some of the information included herein may contain forward-looking statements within the meaning of the federal securities
laws. Forward-looking statements give our current expectations and may contain projections of results of operations or of
financial condition, or forecasts of future events. Words such as ―may,‖ ―assume,‖ ―forecast,‖ ―position,‖ ―predict,‖ ―strategy,‖
―expect,‖ ―intend,‖ ―plan,‖ ―estimate,‖ ―anticipate,‖ ―could,‖ ―believe,‖ ―project,‖ ―budget,‖ ―potential,‖ or ―continue,‖ and similar
expressions are used to identify forward-looking statements. They can be affected by assumptions used or by known or
unknown risks or uncertainties. Consequently, no expected results of operations or financial condition or other forward-looking
statements can be guaranteed. When considering these forward-looking statements, you should keep in mind the risk factors
and other cautionary statements in Hi-Crush Partners LP’s (―Hi-Crush‖) reports filed with the Securities and Exchange
Commission (―SEC‖), including those described under Item 1A, ―Risk Factors‖ of Hi-Crush’s Annual Report on Form 10-K for the
fiscal year ended December 31, 2016. Actual results may vary materially. You are cautioned not to place undue reliance on any
forward-looking statements. You should also understand that it is not possible to predict or identify all such factors and should
not consider the risk factors in our reports filed with the SEC or the following list to be a complete statement of all potential risks
and uncertainties. Factors that could cause our actual results to differ materially from the results contemplated by such forward-
looking statements include: whether we are able to complete the Blair acquisition, the volume of frac sand we are able to sell;
the price at which we are able to sell frac sand; the outcome of any litigation, claims or assessments, including unasserted
claims; changes in the price and availability of natural gas or electricity; changes in prevailing economic conditions; and difficulty
collecting receivables. All forward-looking statements are expressly qualified in their entirety by the foregoing cautionary
statements. Hi-Crush’s forward-looking statements speak only as of the date made and Hi-Crush undertakes no obligation to
update or revise its forward-looking statements, whether as a result of new information, future events or otherwise.
2
Strategic Update
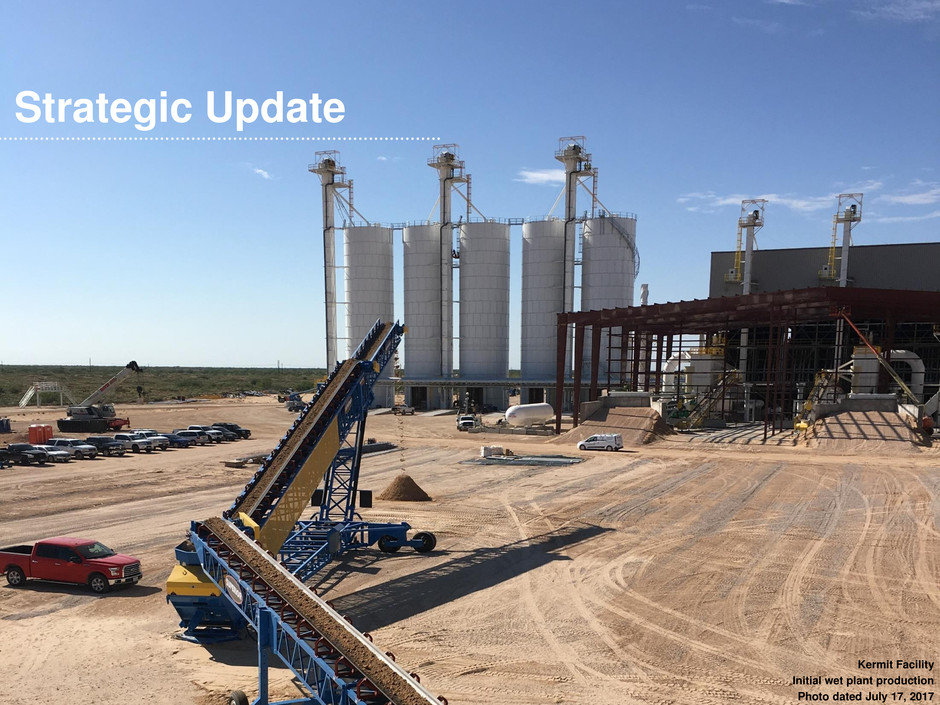
Kermit Facility
Initial wet plant production
Photo dated July 17, 2017
Continued Execution & Strategically Positioned
4
Asset Base
Well-Aligned
with
Demands
• Kermit completion: Completed construction of purpose-built 3mm TPY in-basin Kermit
facility two months ahead of schedule and under budget; first delivery in July 2017
• Customer contracts: Contracts for more than 75% of nameplate capacity with long-term
agreements from quality customers
• Capacity ramp: Achieved near full utilization of 10.4mm TPY of Northern White capacity
during Q2 2017; expect full utilization of 3mm TPY in-basin facility exiting Q3 2017
Continued &
Focused
Execution
• Best-in-class production assets: Scale and efficiency of our combined production
portfolio represents a meaningful strategic advantage relative to competitors
• Attractive mesh mix: Producing 65%+ fine mesh in 2017; up to 75% with minimal
increase in production cost; well-positioned to serve growing and evolving demand
• Leading logistics: Developing Pecos unit train capable terminal in core of Delaware Basin
to augment Permian service offering; PropStreamTM expanding to nine or more crews by
end of 2017
Financial
Flexibility
• Strong liquidity: Total liquidity as of 6/30/17 of ~$86 million; creates meaningful flexibility
to pursue potential growth opportunities
• All railcars active: Increasing unit train utilization drives additional cost savings; better
railcar efficiency limits need to lease additional cars to support volume growth
• Maintaining flexibility: 2017 transformative transactions financed with no new debt issued
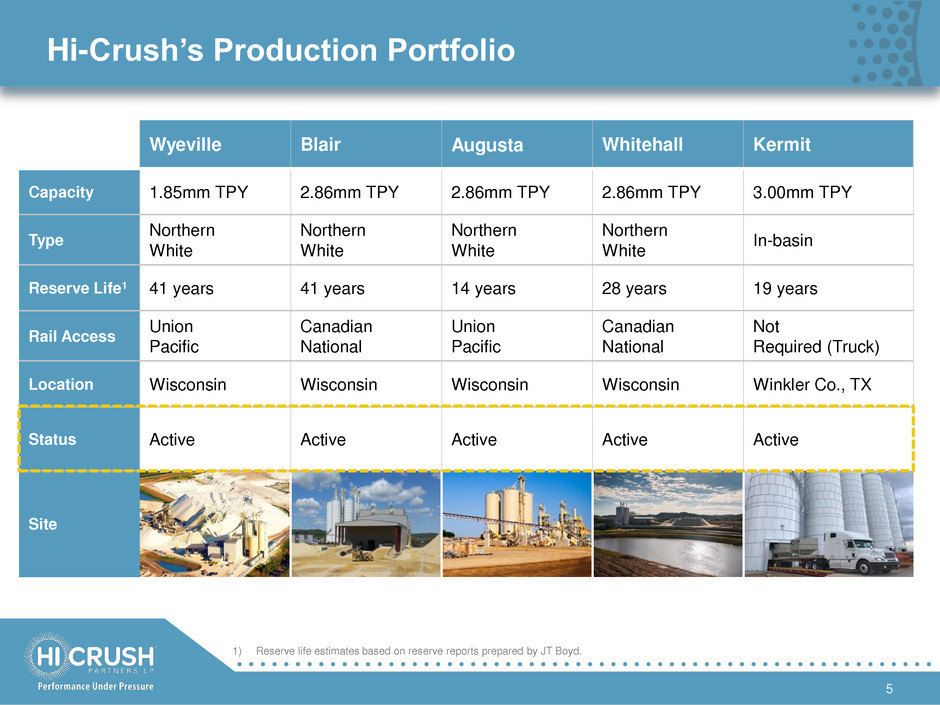
Hi-Crush’s Production Portfolio
5
1) Reserve life estimates based on reserve reports prepared by JT Boyd.
Wyeville Blair Augusta Whitehall Kermit
Capacity 1.85mm TPY 2.86mm TPY 2.86mm TPY 2.86mm TPY 3.00mm TPY
Type
Northern
White
Northern
White
Northern
White
Northern
White
In-basin
Reserve Life1 41 years 41 years 14 years 28 years 19 years
Rail Access
Union
Pacific
Canadian
National
Union
Pacific
Canadian
National
Not
Required (Truck)
Location Wisconsin Wisconsin Wisconsin Wisconsin Winkler Co., TX
Status Active Active Active Active Active
Site
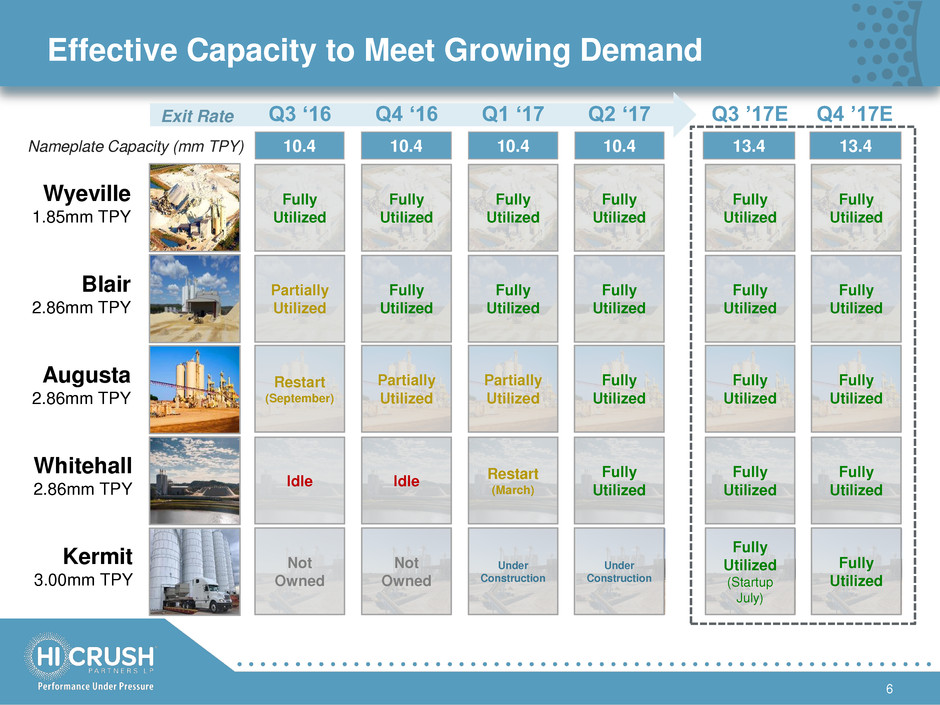
Not
Owned
Not
Owned
Under
Construction
Under
Construction
Fully
Utilized
(Startup
July)
Fully
Utilized
Effective Capacity to Meet Growing Demand
Q3 ‘16
10.4
Fully
Utilized
Partially
Utilized
Restart
(September)
Idle
Q4 ‘16
10.4
Fully
Utilized
Fully
Utilized
Partially
Utilized
Idle
Q1 ‘17
10.4
Fully
Utilized
Fully
Utilized
Partially
Utilized
Restart
(March)
Q2 ‘17
10.4
Fully
Utilized
Fully
Utilized
Fully
Utilized
Fully
Utilized
Q3 ’17E
13.4
Fully
Utilized
Fully
Utilized
Fully
Utilized
Fully
Utilized
Q4 ’17E
13.4
Fully
Utilized
Fully
Utilized
Fully
Utilized
Fully
Utilized
Blair
2.86mm TPY
Wyeville
1.85mm TPY
Augusta
2.86mm TPY
Whitehall
2.86mm TPY
Kermit
3.00mm TPY
Nameplate Capacity (mm TPY)
6
Exit Rate
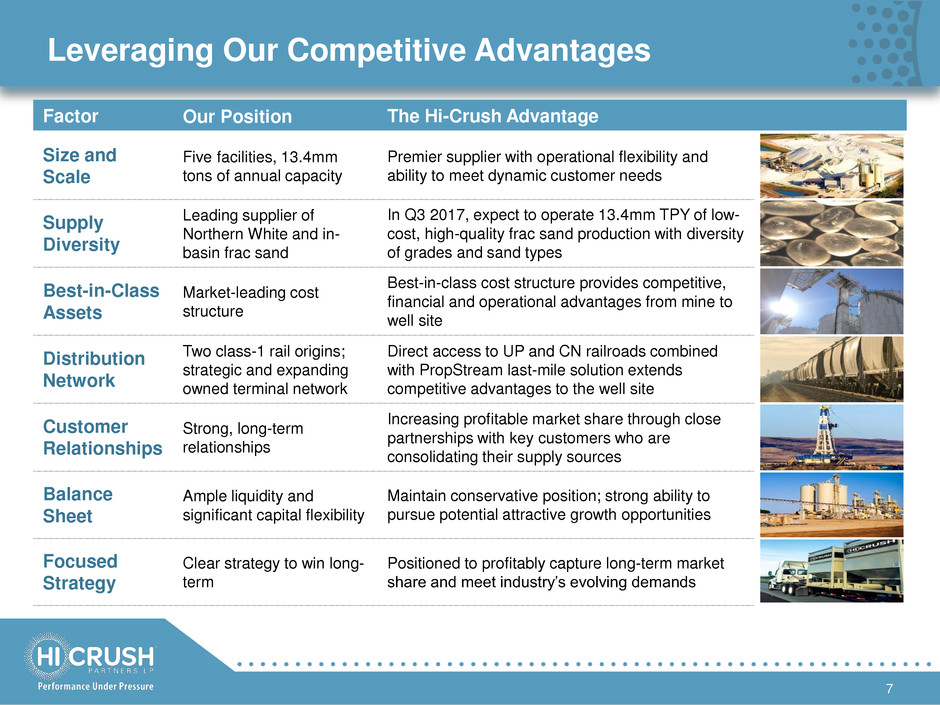
Leveraging Our Competitive Advantages
7
Factor Our Position The Hi-Crush Advantage
Size and
Scale
Five facilities, 13.4mm
tons of annual capacity
Premier supplier with operational flexibility and
ability to meet dynamic customer needs
Supply
Diversity
Leading supplier of
Northern White and in-
basin frac sand
In Q3 2017, expect to operate 13.4mm TPY of low-
cost, high-quality frac sand production with diversity
of grades and sand types
Best-in-Class
Assets
Market-leading cost
structure
Best-in-class cost structure provides competitive,
financial and operational advantages from mine to
well site
Distribution
Network
Two class-1 rail origins;
strategic and expanding
owned terminal network
Direct access to UP and CN railroads combined
with PropStream last-mile solution extends
competitive advantages to the well site
Customer
Relationships
Strong, long-term
relationships
Increasing profitable market share through close
partnerships with key customers who are
consolidating their supply sources
Balance
Sheet
Ample liquidity and
significant capital flexibility
Maintain conservative position; strong ability to
pursue potential attractive growth opportunities
Focused
Strategy
Clear strategy to win long-
term
Positioned to profitably capture long-term market
share and meet industry’s evolving demands
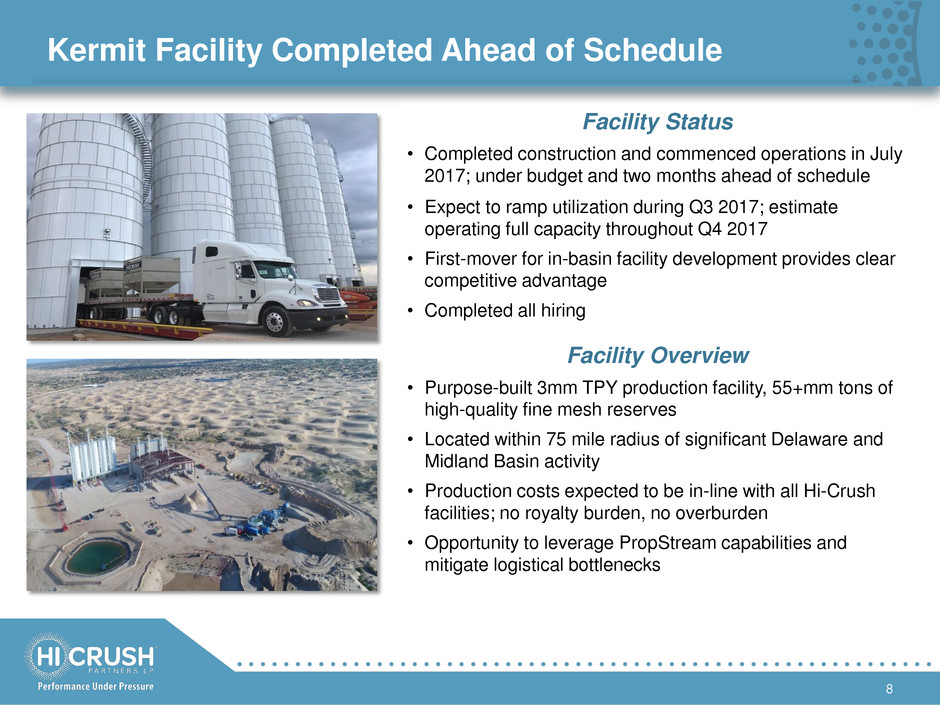
Facility Status
• Completed construction and commenced operations in July
2017; under budget and two months ahead of schedule
• Expect to ramp utilization during Q3 2017; estimate
operating full capacity throughout Q4 2017
• First-mover for in-basin facility development provides clear
competitive advantage
• Completed all hiring
Facility Overview
• Purpose-built 3mm TPY production facility, 55+mm tons of
high-quality fine mesh reserves
• Located within 75 mile radius of significant Delaware and
Midland Basin activity
• Production costs expected to be in-line with all Hi-Crush
facilities; no royalty burden, no overburden
• Opportunity to leverage PropStream capabilities and
mitigate logistical bottlenecks
Kermit Facility Completed Ahead of Schedule
8
Pecos Terminal Further Enhances Permian Position
9
Terminal Overview
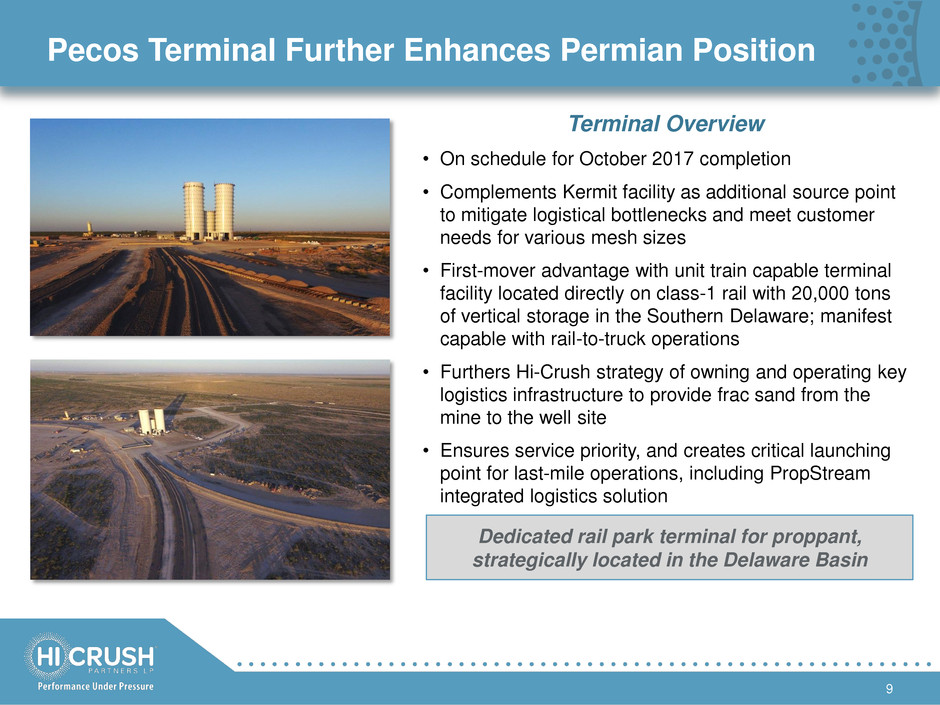
• On schedule for October 2017 completion
• Complements Kermit facility as additional source point
to mitigate logistical bottlenecks and meet customer
needs for various mesh sizes
• First-mover advantage with unit train capable terminal
facility located directly on class-1 rail with 20,000 tons
of vertical storage in the Southern Delaware; manifest
capable with rail-to-truck operations
• Furthers Hi-Crush strategy of owning and operating key
logistics infrastructure to provide frac sand from the
mine to the well site
• Ensures service priority, and creates critical launching
point for last-mile operations, including PropStream
integrated logistics solution
Dedicated rail park terminal for proppant,
strategically located in the Delaware Basin
10
PropStream: Success in the Market
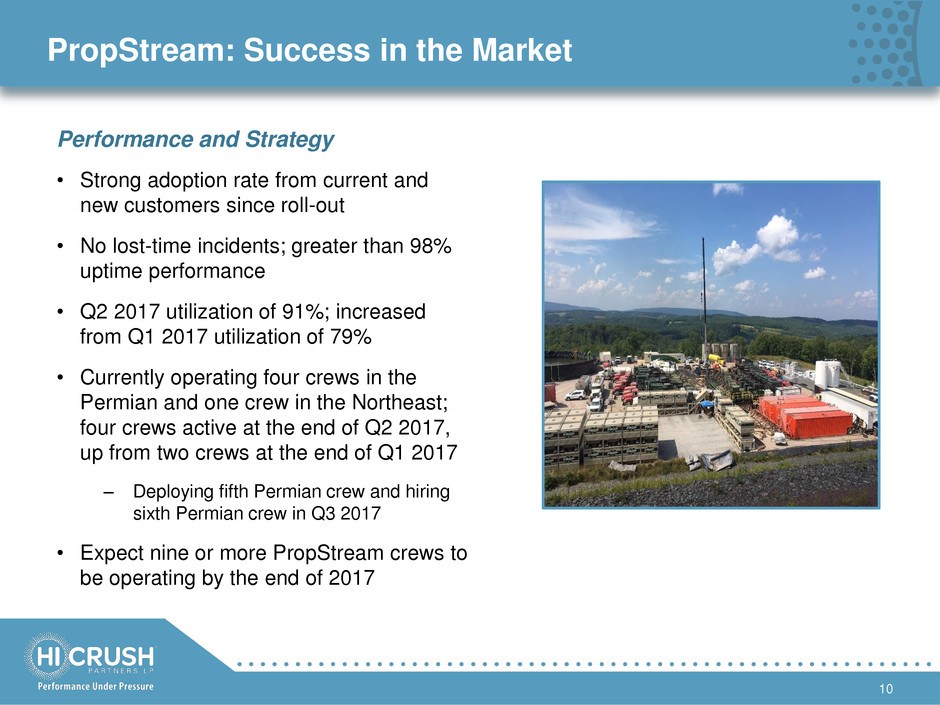
• Strong adoption rate from current and
new customers since roll-out
• No lost-time incidents; greater than 98%
uptime performance
• Q2 2017 utilization of 91%; increased
from Q1 2017 utilization of 79%
• Currently operating four crews in the
Permian and one crew in the Northeast;
four crews active at the end of Q2 2017,
up from two crews at the end of Q1 2017
‒ Deploying fifth Permian crew and hiring
sixth Permian crew in Q3 2017
• Expect nine or more PropStream crews to
be operating by the end of 2017
Performance and Strategy
Outlook
Volumes Increasing with Utilization to Meet Demand
12
898
1,024
1,181
1,482
1,195 1,190
1,409
1,209
963
849
1,083
1,359 1,385
2,113
0
500
1,000
1,500
2,000
2,500
3,000
3,500
Q1 '14 Q2 '14 Q3 '14 Q4 '14 Q1 '15 Q2 '15 Q3 '15 Q4 '15 Q1 '16 Q2 '16 Q3 '16 Q4 '16 Q1 '17 Q2 '17 Q3 '17E
000s tons
Quarterly Volumes Sold
Quarterly Nameplate Capacity
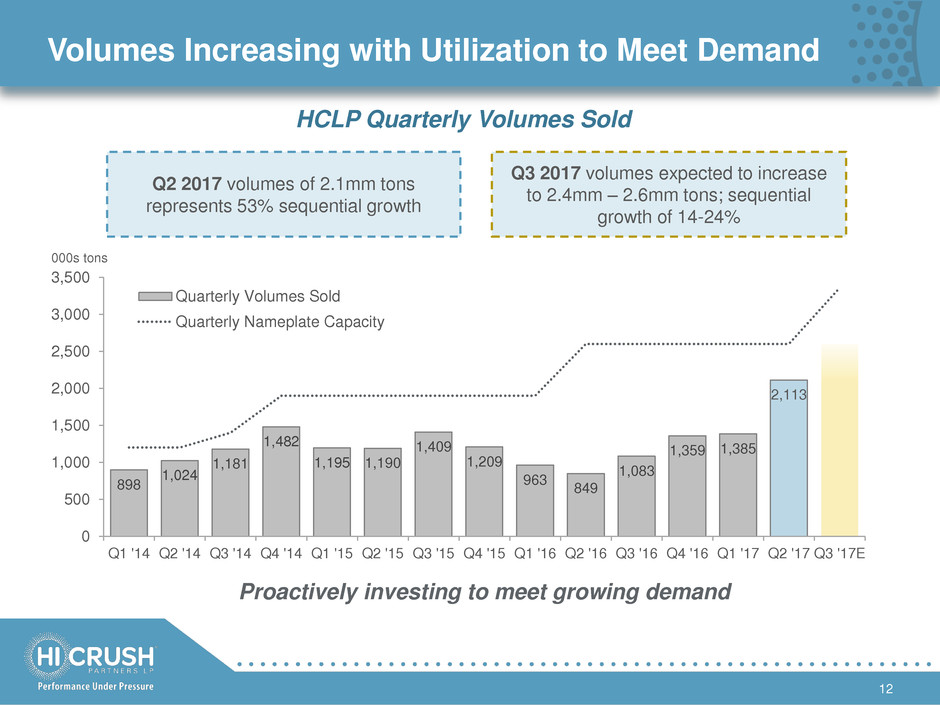
Q3 2017 volumes expected to increase
to 2.4mm – 2.6mm tons; sequential
growth of 14-24%
Q2 2017 volumes of 2.1mm tons
represents 53% sequential growth
HCLP Quarterly Volumes Sold
Proactively investing to meet growing demand
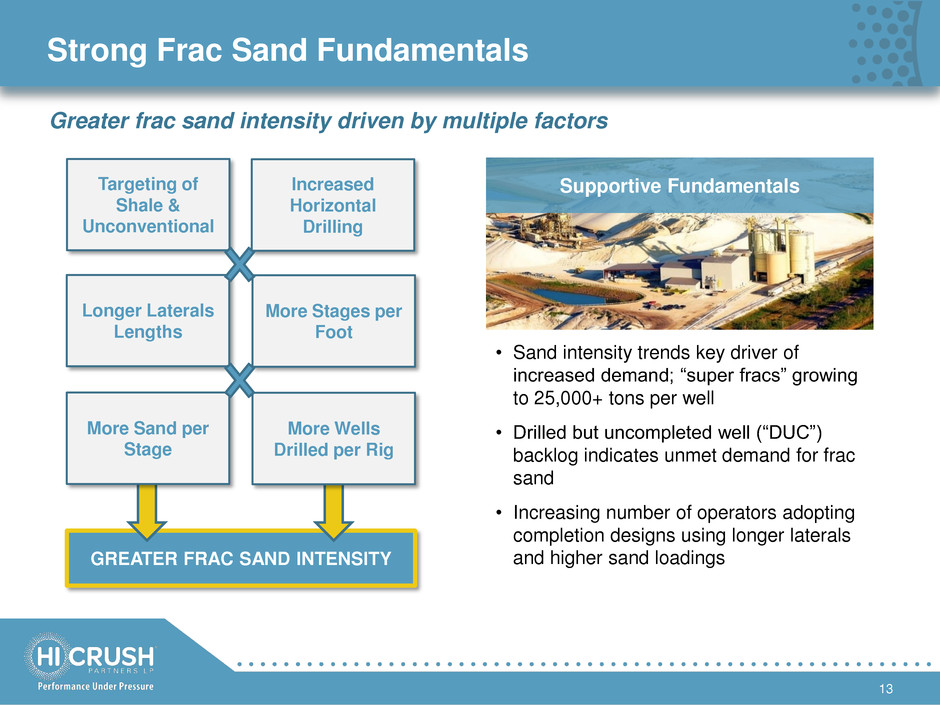
Strong Frac Sand Fundamentals
13
Supportive Fundamentals
GREATER FRAC SAND INTENSITY
Targeting of
Shale &
Unconventional
Increased
Horizontal
Drilling
Longer Laterals
Lengths
More Stages per
Foot
More Sand per
Stage
More Wells
Drilled per Rig
Greater frac sand intensity driven by multiple factors
• Sand intensity trends key driver of
increased demand; ―super fracs‖ growing
to 25,000+ tons per well
• Drilled but uncompleted well (―DUC‖)
backlog indicates unmet demand for frac
sand
• Increasing number of operators adopting
completion designs using longer laterals
and higher sand loadings
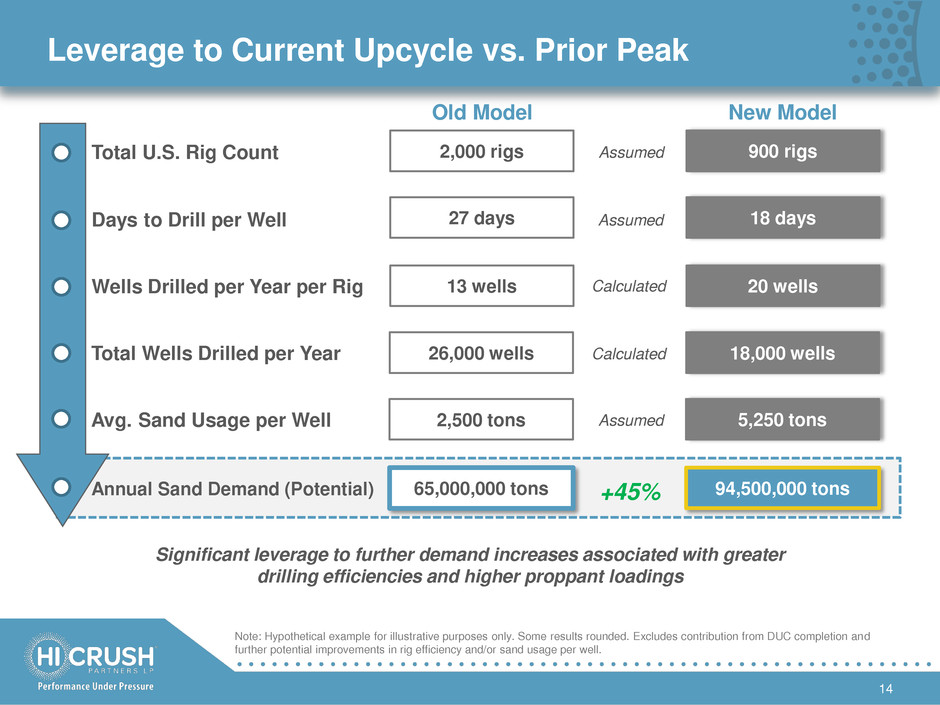
Leverage to Current Upcycle vs. Prior Peak
14
2,000 rigs
27 days
13 wells
26,000 wells
2,500 tons
65,000,000 tons
Total U.S. Rig Count
Days to Drill per Well
Wells Drilled per Year per Rig
Total Wells Drilled per Year
Avg. Sand Usage per Well
Annual Sand Demand (Potential)
Old Model
Note: Hypothetical example for illustrative purposes only. Some results rounded. Excludes contribution from DUC completion and
further potential improvements in rig efficiency and/or sand usage per well.
900 rigs
18 days
20 wells
18,000 wells
5,250 tons
94,500,000 tons
New Model
+45%
Calculated
Calculated
Assumed
Assumed
Assumed
Significant leverage to further demand increases associated with greater
drilling efficiencies and higher proppant loadings
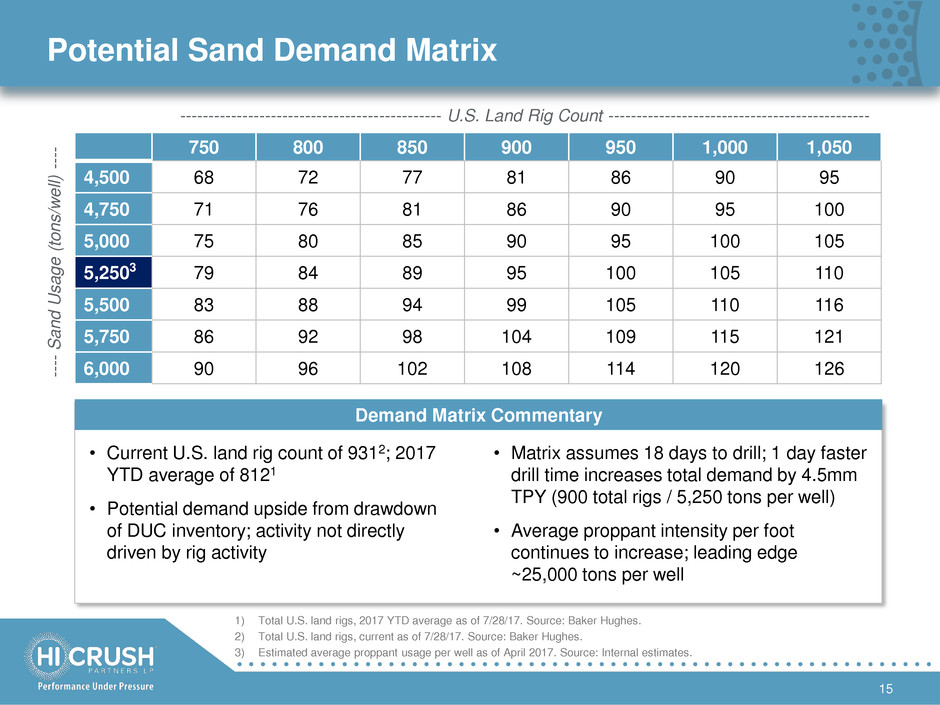
Potential Sand Demand Matrix
15
1) Total U.S. land rigs, 2017 YTD average as of 7/28/17. Source: Baker Hughes.
2) Total U.S. land rigs, current as of 7/28/17. Source: Baker Hughes.
3) Estimated average proppant usage per well as of April 2017. Source: Internal estimates.
750 800 850 900 950 1,000 1,050
4,500 68 72 77 81 86 90 95
4,750 71 76 81 86 90 95 100
5,000 75 80 85 90 95 100 105
5,2503 79 84 89 95 100 105 110
5,500 83 88 94 99 105 110 116
5,750 86 92 98 104 109 115 121
6,000 90 96 102 108 114 120 126
---------------------------------------------- U.S. Land Rig Count ----------------------------------------------
--
--
Sand
Usage
(tons/
w
ell)
-
--
-
• Current U.S. land rig count of 9312; 2017
YTD average of 8121
• Potential demand upside from drawdown
of DUC inventory; activity not directly
driven by rig activity
Demand Matrix Commentary
• Matrix assumes 18 days to drill; 1 day faster
drill time increases total demand by 4.5mm
TPY (900 total rigs / 5,250 tons per well)
• Average proppant intensity per foot
continues to increase; leading edge
~25,000 tons per well
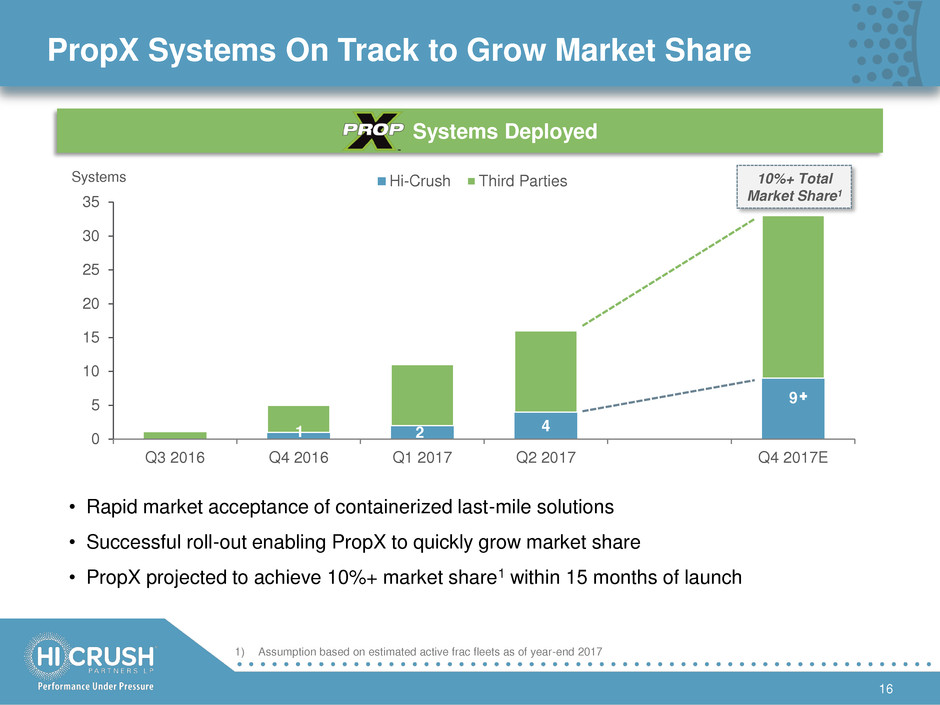
PropX Systems On Track to Grow Market Share
16
• Rapid market acceptance of containerized last-mile solutions
• Successful roll-out enabling PropX to quickly grow market share
• PropX projected to achieve 10%+ market share1 within 15 months of launch
Systems Deployed
1 2 4
9
0
5
10
15
20
25
30
35
Q3 2016 Q4 2016 Q1 2017 Q2 2017 Q4 2017E
Systems Hi-Crush Third Parties 10%+ Total
Market Share1
1) Assumption based on estimated active frac fleets as of year-end 2017
Business Update
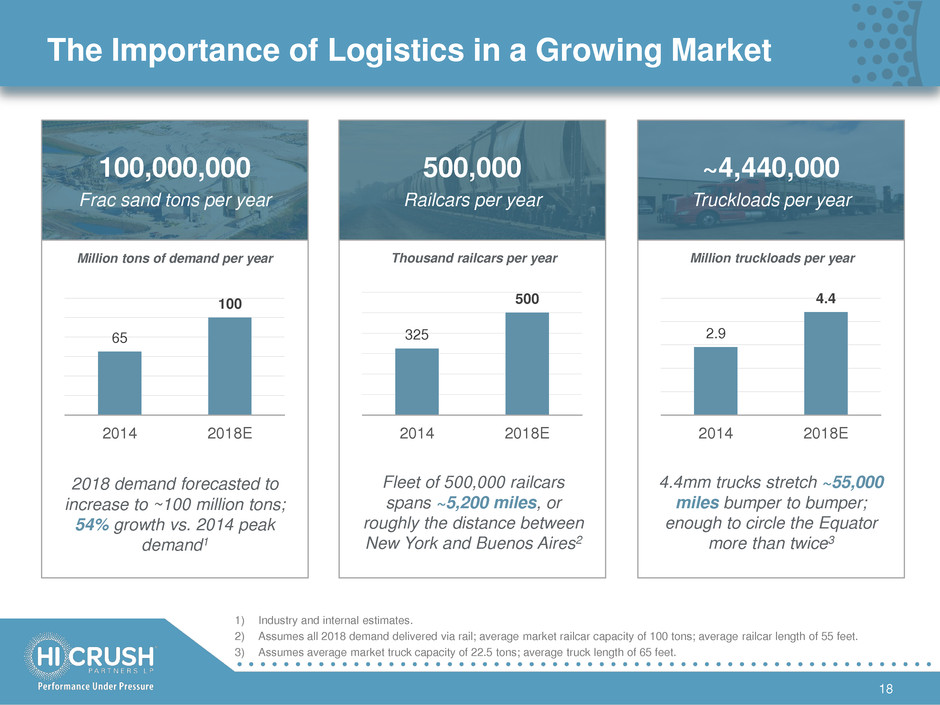
325
500
2014 2018E
The Importance of Logistics in a Growing Market
18
100,000,000
Frac sand tons per year
~4,440,000
Truckloads per year
500,000
Railcars per year
65
100
2014 2018E
2.9
4.4
2014 2018E
Million tons of demand per year Million truckloads per year Thousand railcars per year
2018 demand forecasted to
increase to ~100 million tons;
54% growth vs. 2014 peak
demand1
4.4mm trucks stretch ~55,000
miles bumper to bumper;
enough to circle the Equator
more than twice3
Fleet of 500,000 railcars
spans ~5,200 miles, or
roughly the distance between
New York and Buenos Aires2
1) Industry and internal estimates.
2) Assumes all 2018 demand delivered via rail; average market railcar capacity of 100 tons; average railcar length of 55 feet.
3) Assumes average market truck capacity of 22.5 tons; average truck length of 65 feet.
Network Ownership Establishes Logistics Flexibility
19
Note: Map does not reflect all third party terminals utilized by Hi-Crush to deliver sand to customers.
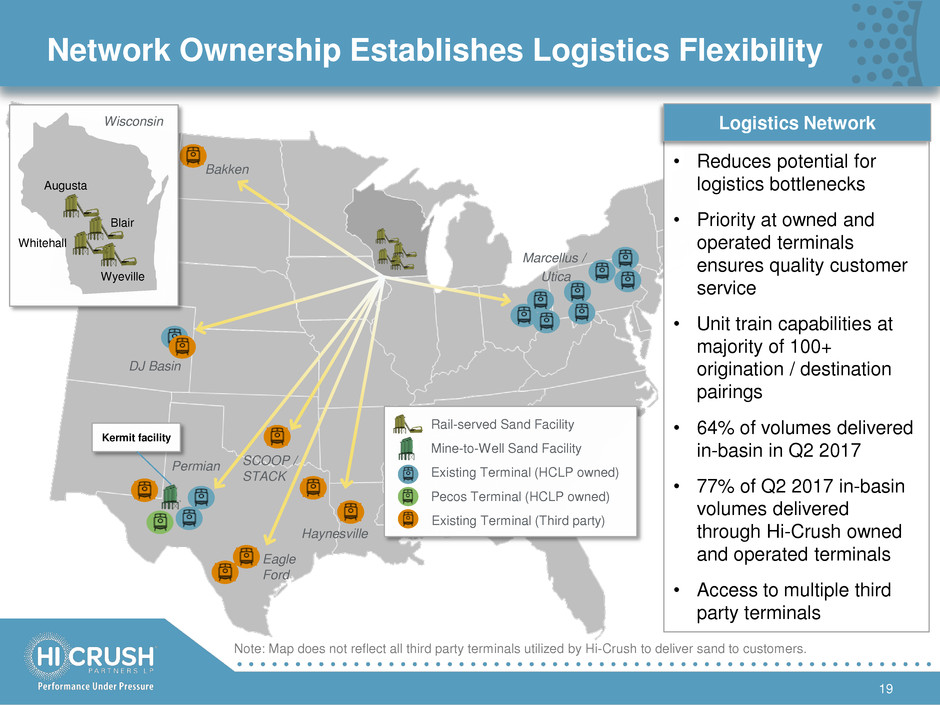
• Reduces potential for
logistics bottlenecks
• Priority at owned and
operated terminals
ensures quality customer
service
• Unit train capabilities at
majority of 100+
origination / destination
pairings
• 64% of volumes delivered
in-basin in Q2 2017
• 77% of Q2 2017 in-basin
volumes delivered
through Hi-Crush owned
and operated terminals
• Access to multiple third
party terminals
Bakken
DJ Basin
Permian SCOOP /
STACK
Eagle
Ford
Marcellus /
Utica
Logistics Network
Kermit facility
Rail-served Sand Facility
Existing Terminal (HCLP owned)
Pecos Terminal (HCLP owned)
Mine-to-Well Sand Facility
Existing Terminal (Third party)
Wisconsin
Augusta
Wyeville
Whitehall
Blair
Haynesville
Hi-Crush Logistics in the Permian
20
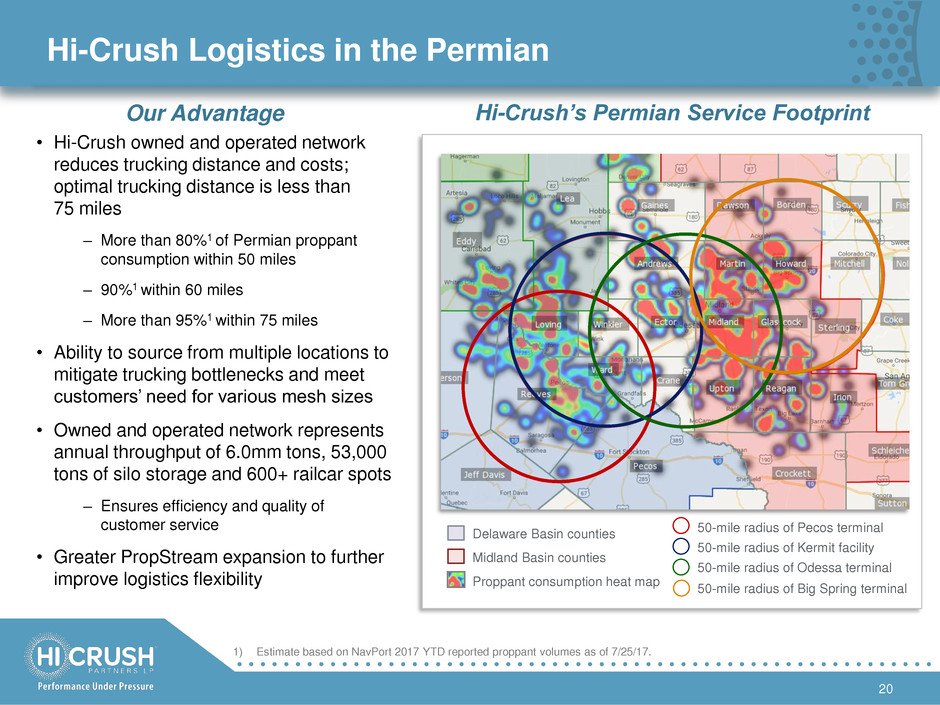
• Hi-Crush owned and operated network
reduces trucking distance and costs;
optimal trucking distance is less than
75 miles
‒ More than 80%1 of Permian proppant
consumption within 50 miles
‒ 90%1 within 60 miles
‒ More than 95%1 within 75 miles
• Ability to source from multiple locations to
mitigate trucking bottlenecks and meet
customers’ need for various mesh sizes
• Owned and operated network represents
annual throughput of 6.0mm tons, 53,000
tons of silo storage and 600+ railcar spots
‒ Ensures efficiency and quality of
customer service
• Greater PropStream expansion to further
improve logistics flexibility
1) Estimate based on NavPort 2017 YTD reported proppant volumes as of 7/25/17.
50-mile radius of Pecos terminal Delaware Basin counties
Midland Basin counties
Proppant consumption heat map
50-mile radius of Kermit facility
50-mile radius of Odessa terminal
50-mile radius of Big Spring terminal
Our Advantage Hi-Crush’s Permian Service Footprint
PropStream: Simplifying the Supply Chain
21
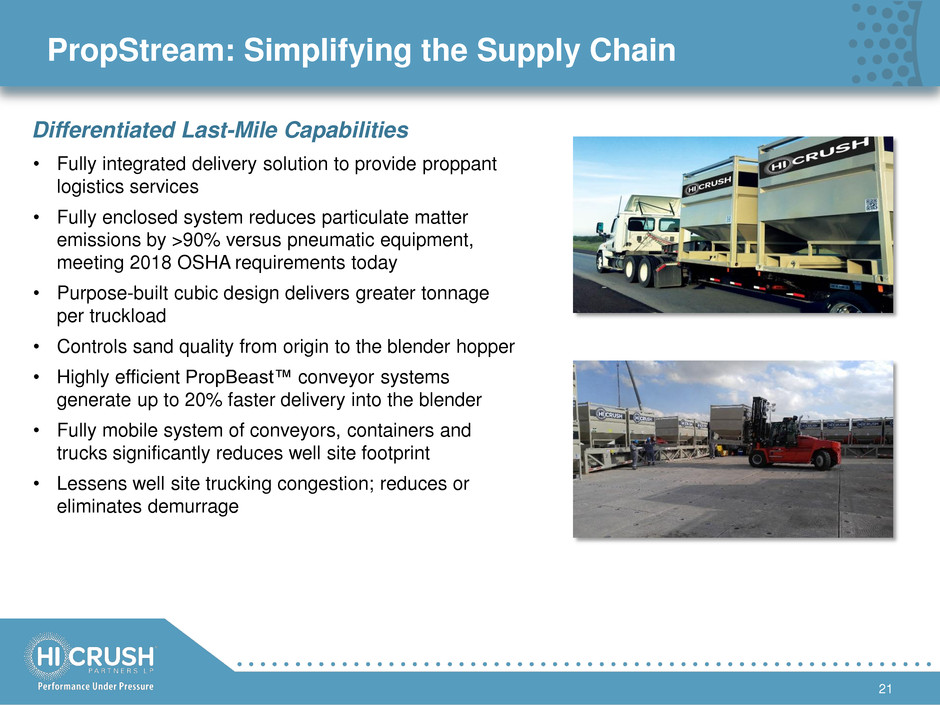
Differentiated Last-Mile Capabilities
• Fully integrated delivery solution to provide proppant
logistics services
• Fully enclosed system reduces particulate matter
emissions by >90% versus pneumatic equipment,
meeting 2018 OSHA requirements today
• Purpose-built cubic design delivers greater tonnage
per truckload
• Controls sand quality from origin to the blender hopper
• Highly efficient PropBeast™ conveyor systems
generate up to 20% faster delivery into the blender
• Fully mobile system of conveyors, containers and
trucks significantly reduces well site footprint
• Lessens well site trucking congestion; reduces or
eliminates demurrage
Financial Results
Key Financial Metrics
23
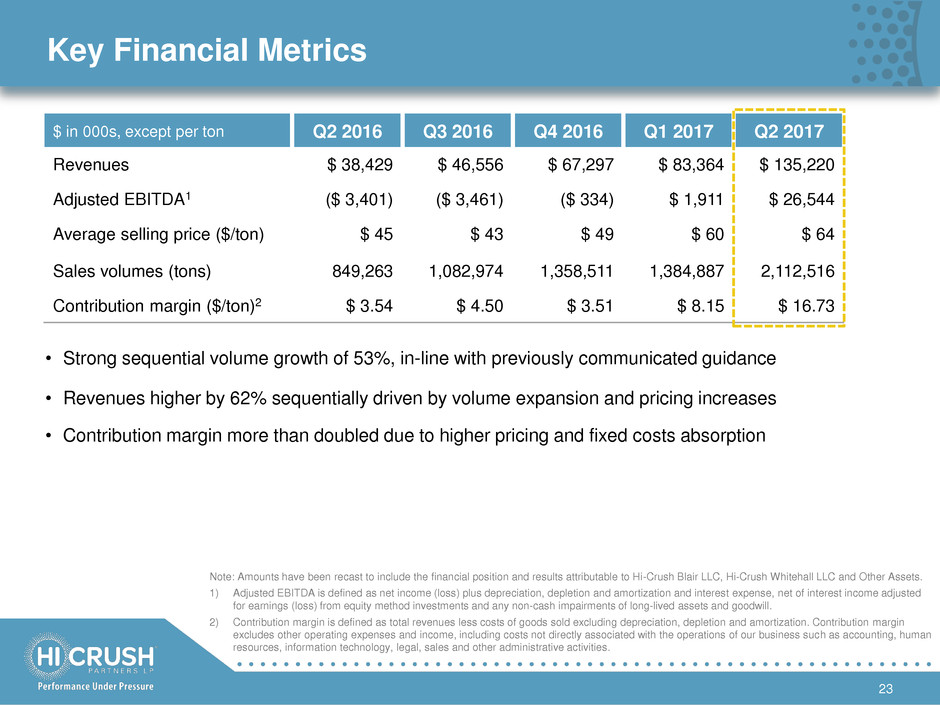
$ in 000s, except per ton Q2 2016 Q3 2016 Q4 2016 Q1 2017 Q2 2017
Revenues $ 38,429 $ 46,556 $ 67,297 $ 83,364 $ 135,220
Adjusted EBITDA1 ($ 3,401) ($ 3,461) ($ 334) $ 1,911 $ 26,544
Average selling price ($/ton) $ 45 $ 43 $ 49 $ 60 $ 64
Sales volumes (tons) 849,263 1,082,974 1,358,511 1,384,887 2,112,516
Contribution margin ($/ton)2 $ 3.54 $ 4.50 $ 3.51 $ 8.15 $ 16.73
Note: Amounts have been recast to include the financial position and results attributable to Hi-Crush Blair LLC, Hi-Crush Whitehall LLC and Other Assets.
1) Adjusted EBITDA is defined as net income (loss) plus depreciation, depletion and amortization and interest expense, net of interest income adjusted
for earnings (loss) from equity method investments and any non-cash impairments of long-lived assets and goodwill.
2) Contribution margin is defined as total revenues less costs of goods sold excluding depreciation, depletion and amortization. Contribution margin
excludes other operating expenses and income, including costs not directly associated with the operations of our business such as accounting, human
resources, information technology, legal, sales and other administrative activities.
• Strong sequential volume growth of 53%, in-line with previously communicated guidance
• Revenues higher by 62% sequentially driven by volume expansion and pricing increases
• Contribution margin more than doubled due to higher pricing and fixed costs absorption

Improved Liquidity and Financial Flexibility
24
$ in 000s December 31, 2016 June 30, 2017
Cash $ 4,521 $ 27,490
Revolver $ - $ -
Term loan1 189,715 189,265
Other notes payable 6,705 5,223
Total debt $ 196,420 $ 194,488
Net debt $ 191,899 $ 166,998
Revolver availability2 $ 66,368 $ 58,231
Available liquidity3 $ 70,889 $ 85,721
1) Senior secured term loan: $200mm original face value at L+3.75%; rated Caa1 and B by Moody’s and Standard & Poor’s,
respectively; includes accordion feature to increase capacity to $300mm. Presented net of discounts and issuance costs.
2) Revolving credit agreement at 6/30/17: $58.2mm available at L+4.50% ($75mm capacity less $16.8mm of LCs); includes
accordion feature to increase capacity to $125mm.
3) Revolver availability plus cash.
Credit Facility Provides Liquidity and Flexibility
25
1) Leverage and interest coverage ratios for Q2 2017 – Q4 2017 based on annualized figures beginning April 1, 2017. Equity
cure provision available to address any potential EBITDA covenant shortfalls.
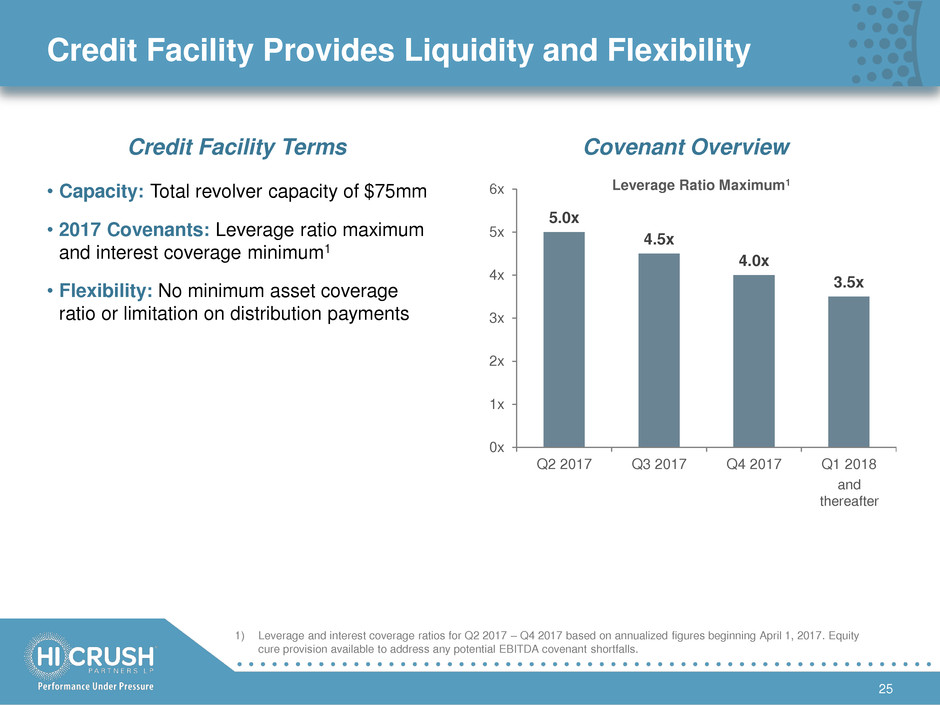
• Capacity: Total revolver capacity of $75mm
• 2017 Covenants: Leverage ratio maximum
and interest coverage minimum1
• Flexibility: No minimum asset coverage
ratio or limitation on distribution payments
5.0x
4.5x
4.0x
3.5x
0x
1x
2x
3x
4x
5x
6x
Q2 2017 Q3 2017 Q4 2017 Q1 2018
$mm Leverage Ratio Maximum1
and
thereafter
Credit Facility Terms Covenant Overview
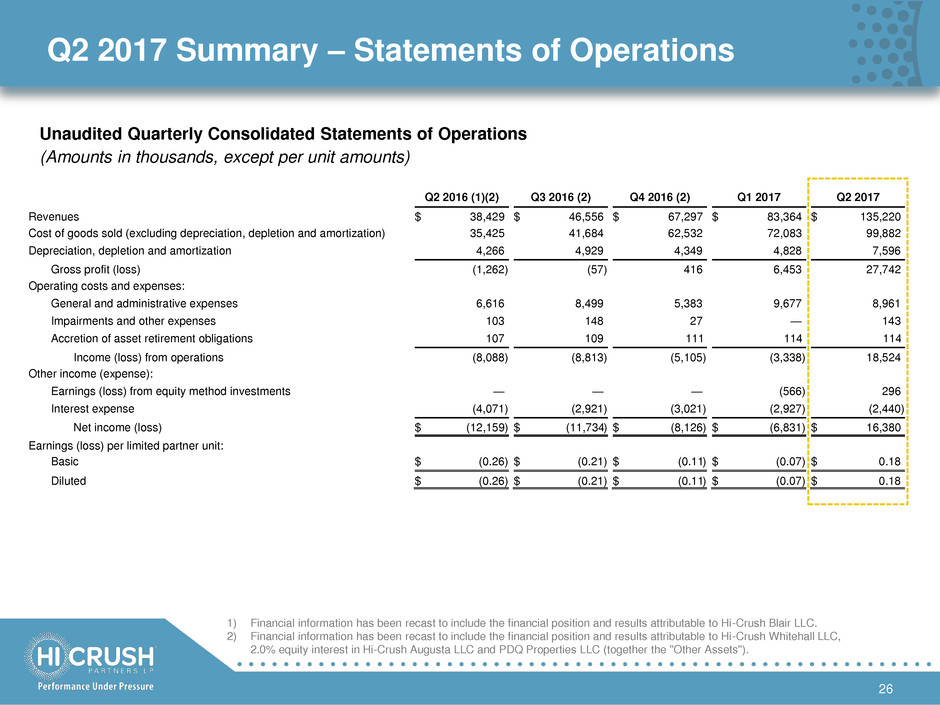
Q2 2017 Summary – Statements of Operations
26
1) Financial information has been recast to include the financial position and results attributable to Hi-Crush Blair LLC.
2) Financial information has been recast to include the financial position and results attributable to Hi-Crush Whitehall LLC,
2.0% equity interest in Hi-Crush Augusta LLC and PDQ Properties LLC (together the "Other Assets").
Unaudited Quarterly Consolidated Statements of Operations
(Amounts in thousands, except per unit amounts)
Q2 2016 (1)(2) Q3 2016 (2) Q4 2016 (2) Q1 2017 Q2 2017
Revenues $ 38,429 $ 46,556 $ 67,297 $ 83,364 $ 135,220
Cost of goods sold (excluding depreciation, depletion and amortization) 35,425 41,684 62,532 72,083 99,882
Depreciation, depletion and amortization 4,266 4,929 4,349 4,828 7,596
Gross profit (loss) (1,262 ) (57 ) 416 6,453 27,742
Operating costs and expenses:
General and administrative expenses 6,616 8,499 5,383 9,677 8,961
Impairments and other expenses 103 148 27 — 143
Accretion of asset retirement obligations 107 109 111 114 114
Income (loss) from operations (8,088 ) (8,813 ) (5,105 ) (3,338 ) 18,524
Other income (expense):
E rnings (loss) from equity method investments — — — (566 ) 296
Interest expense (4,071 ) (2,921 ) (3,021 ) (2,927 ) (2,440 )
Net income (loss) $ (12,159 ) $ (11,734 ) $ (8,126 ) $ (6,831 ) $ 16,380
Earnings (loss) per limited partner unit:
Basic $ (0.26 ) $ (0.21 ) $ (0.11 ) $ (0.07 ) $ 0.18
Diluted $ (0.26 ) $ (0.21 ) $ (0.11 ) $ (0.07 ) $ 0.18

27
Q2 2017 Summary – EBITDA, Adjusted EBITDA, DCF
Unaudited EBITDA, Adjusted EBITDA and Distributable Cash Flow
(Amounts in thousands)
1) Maintenance and replacement capital expenditures, including accrual for reserve replacement, were determined based on an estimated
reserve replacement cost of $1.35 per ton produced and delivered during the period. Such expenditures include those associated with
the replacement of equipment and sand reserves, to the extent that such expenditures are made to maintain our long-term operating
capacity. The amount presented does not represent an actual reserve account or requirement to spend the capital.
2) The Partnership's historical financial information has been recast to consolidate Hi-Crush Blair LLC, Hi-Crush Whitehall LLC and Other
Assets for the periods leading up to their contribution into the Partnership. For purposes of calculating distributable cash flow
attributable to Hi-Crush Partners LP, the Partnership excludes the incremental amount of recast distributable cash flow earned during
the periods prior to the contributions.
Q2 2016 Q3 2016 Q4 2016 Q1 2017 Q2 2017
Reconciliation of distributable cash flow to net income (loss):
Net income (loss) $ (12,159 ) $ (11,734 ) $ (8,126 ) $ (6,831 ) $ 16,380
Depreciation and depletion expense 4,266 4,932 4,350 4,829 7,599
Amortization expense 421 420 421 420 421
Interest expense 4,071 2,921 3,021 2,927 2,440
EBITDA (3,401 ) (3,461 ) (334 ) 1,345 26,840
(Earnings) loss from equity method investments — — — 566 (296 )
Adjusted EBITDA (3,401 ) (3,461 ) (334 ) 1,911 26,544
Less: Cash interest paid (3,344 ) (2,548 ) (2,649 ) (2,554 ) (2,068 )
Less: Maintenance and replacement capital expenditures, including
accrual for reserve replacement (1) (1,164 ) (1,554 ) (1,717 ) (1,845 ) (2,945 )
Add: Accretion of asset retirement obligations 107 109 111 114 114
Add: Unit-based compensation 930 1,155 (395 ) 1,178 1,219
Distributable cash flow (6,872 ) (6,299 ) (4,984 ) (1,196 ) 22,864
Adjusted for: Distributable cash flow attributable to assets contributed by
the sponsor, prior to the period in which the contribution occurred (2) 627
(400 ) 579
1,247
—
Distributable cash flow attributable to Hi-Crush Partners LP (6,245 ) (6,699 ) (4,405 ) 51 22,864
Less: Distributable cash flow attributable to holders of incentive
distribution rights —
—
—
—
—
Distributable cash flow attributable to limited partner unitholders $ (6,245 ) $ (6,699 ) $ (4,405 ) $ 51 $ 22,864
APPENDIX
Investor Presentation | September, 2013 28
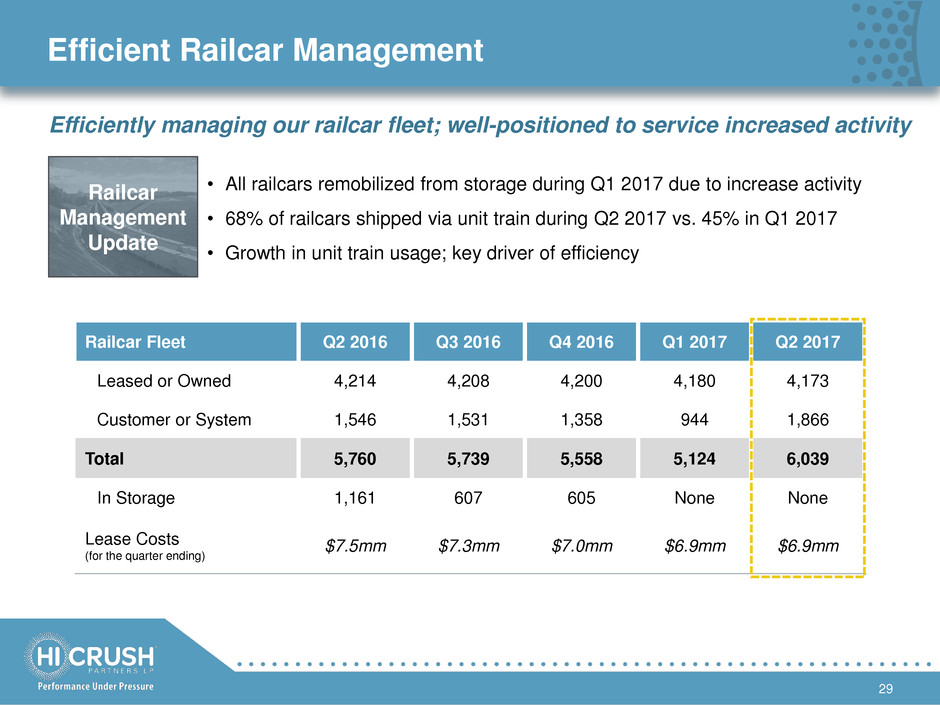
Efficient Railcar Management
29
Railcar Fleet Q2 2016 Q3 2016 Q4 2016 Q1 2017 Q2 2017
Leased or Owned 4,214 4,208 4,200 4,180 4,173
Customer or System 1,546 1,531 1,358 944 1,866
Total 5,760 5,739 5,558 5,124 6,039
In Storage 1,161 607 605 None None
Lease Costs
(for the quarter ending)
$7.5mm $7.3mm $7.0mm $6.9mm $6.9mm
• All railcars remobilized from storage during Q1 2017 due to increase activity
• 68% of railcars shipped via unit train during Q2 2017 vs. 45% in Q1 2017
• Growth in unit train usage; key driver of efficiency
Railcar
Management
Update
Efficiently managing our railcar fleet; well-positioned to service increased activity
30
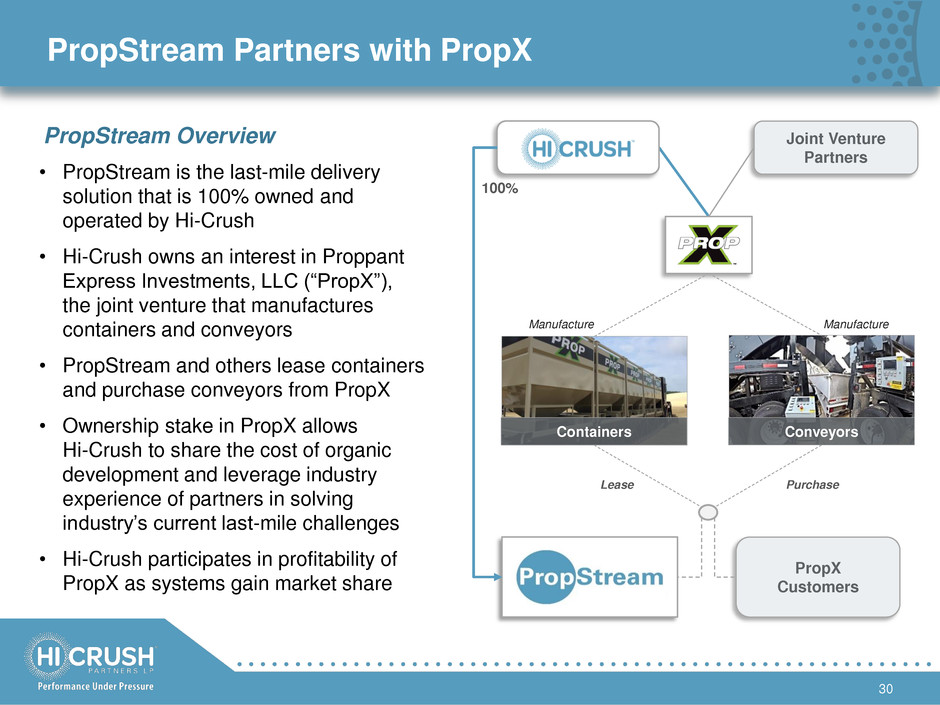
PropStream Partners with PropX
• PropStream is the last-mile delivery
solution that is 100% owned and
operated by Hi-Crush
• Hi-Crush owns an interest in Proppant
Express Investments, LLC (―PropX‖),
the joint venture that manufactures
containers and conveyors
• PropStream and others lease containers
and purchase conveyors from PropX
• Ownership stake in PropX allows
Hi-Crush to share the cost of organic
development and leverage industry
experience of partners in solving
industry’s current last-mile challenges
• Hi-Crush participates in profitability of
PropX as systems gain market share
Joint Venture
Partners
100%
Conveyors Containers
Manufacture Manufacture
Lease Purchase
PropX
Customers
PropStream Overview
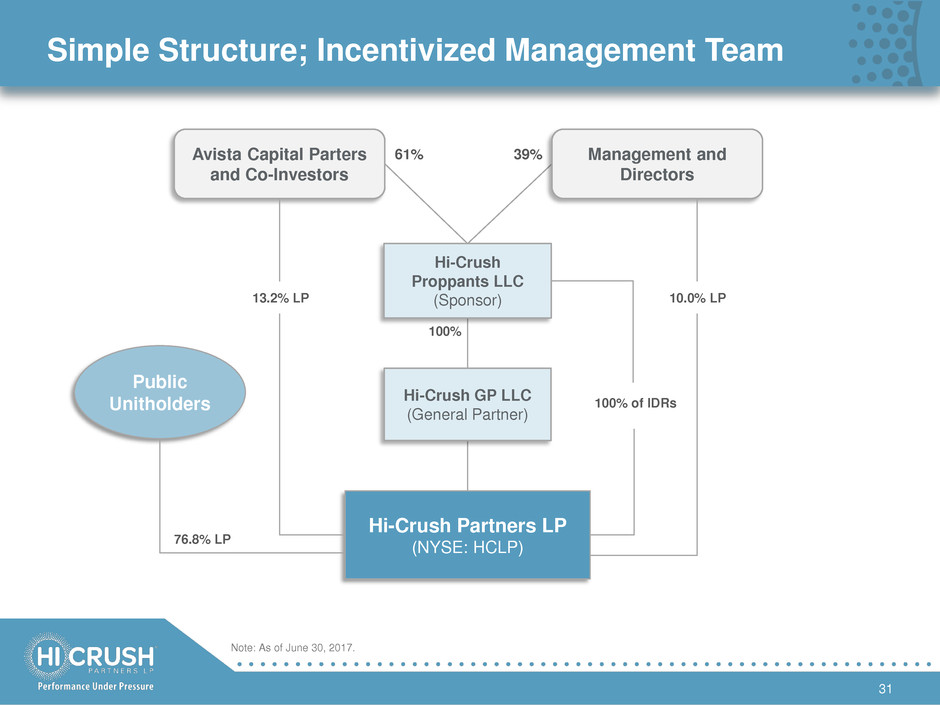
Simple Structure; Incentivized Management Team
31
39% 61%
100%
76.8% LP
100% of IDRs
Hi-Crush
Proppants LLC
(Sponsor)
Avista Capital Parters
and Co-Investors
Management and
Directors
Hi-Crush Partners LP
(NYSE: HCLP)
Public
Unitholders
Hi-Crush GP LLC
(General Partner)
13.2% LP 10.0% LP
Note: As of June 30, 2017.
