Attached files
| file | filename |
|---|---|
| EX-32.2 - EX-32.2 - Zynerba Pharmaceuticals, Inc. | zyne-20170630ex322cf7843.htm |
| EX-32.1 - EX-32.1 - Zynerba Pharmaceuticals, Inc. | zyne-20170630ex3211c29b9.htm |
| EX-31.2 - EX-31.2 - Zynerba Pharmaceuticals, Inc. | zyne-20170630ex312c3fd20.htm |
| EX-31.1 - EX-31.1 - Zynerba Pharmaceuticals, Inc. | zyne-20170630ex311ea8de7.htm |
UNITED STATES
SECURITIES AND EXCHANGE COMMISSION
Washington, D.C. 20549
FORM 10-Q
(Mark One)
☒ QUARTERLY REPORT PURSUANT TO SECTION 13 OR 15(d) OF THE SECURITIES EXCHANGE ACT OF 1934
For the quarterly period ended June 30, 2017
OR
☐ TRANSITION REPORT PURSUANT TO SECTION 13 OR 15(d) OF THE SECURITIES EXCHANGE ACT OF 1934
For the transition period from to
Commission file number: 001-37526
Zynerba Pharmaceuticals, Inc.
(Exact name of registrant as specified in its charter)
|
Delaware |
|
26-0389433 |
|
|
|
|
|
80 W. Lancaster Avenue, Suite 300 |
|
19333 |
(484) 581-7505
(Registrant’s telephone number, including area code)
Indicate by check mark whether the registrant (1) has filed all reports required to be filed by Section 13 or 15(d) of the Securities Exchange Act of 1934 during the preceding 12 months (or for such shorter period that the registrant was required to file such reports), and (2) has been subject to such filing requirements for the past 90 days. Yes ☒ No ☐
Indicate by check mark whether the registrant has submitted electronically and posted on its corporate Web site, if any, every Interactive Data File required to be submitted and posted pursuant to Rule 405 of Regulation S-T (§232.405 of this chapter) during the preceding 12 months (or for such shorter period that the registrant was required to submit and post such files). Yes ☒ No ☐
Indicate by check mark whether the registrant is a large accelerated filer, an accelerated filer, a non-accelerated filer, a smaller reporting company, or an emerging growth company. See the definitions of “large accelerated filer,” “accelerated filer,” “smaller reporting company,” and “emerging growth company” in Rule 12b-2 of the Exchange Act.
|
Large accelerated filer ☐ |
|
Accelerated filer ☐ |
|
|
|
|
|
Non-accelerated filer ☐ |
Smaller reporting company ☒ |
|
|
Emerging growth company ☒ |
If an emerging growth company, indicate by check mark if the registrant has elected not to use the extended transition period for complying with any new or revised financial accounting standards provided pursuant to Section 13(a) of the Exchange Act. ☒
Indicate by check mark whether the registrant is a shell company (as defined in Rule 12b-2 of the Exchange Act). Yes ☐ No ☒
As of July 28, 2017, there were 13,257,279 shares of Common Stock, $0.001 par value per share, outstanding.
2
CAUTIONARY NOTE REGARDING FORWARD-LOOKING STATEMENTS
Statements made in this Quarterly Report that are not statements of historical or current facts, such as those under the heading “Management’s Discussion and Analysis of Financial Condition and Results of Operations,” are “forward-looking statements” within the meaning of the Private Securities Litigation Reform Act of 1995. Forward-looking statements discuss our current expectations and projections relating to our financial condition, results of operations, plans, objectives, future performance and business. These statements may be preceded by, followed by or include the words “aim,” “anticipate,” “believe,” “estimate,” “expect,” “forecast,” “intend,” “outlook,” “plan,” “potential,” “project,” “projection,” “seek,” “may,” “could,” “would,” “will,” “should,” “can,” “can have,” “likely,” the negatives thereof and other words and terms of similar meaning.
Forward-looking statements are inherently subject to risks, uncertainties and assumptions; they are not guarantees of performance. You should not place undue reliance on these statements. We have based these forward-looking statements on our current expectations and projections about future events. Although we believe that our assumptions made in connection with the forward-looking statements are reasonable, we cannot assure you that the assumptions and expectations will prove to be correct.
You should understand that the following important factors could affect our future results and could cause those results or other outcomes to differ materially from those expressed or implied in our forward-looking statements:
|
· |
our estimates regarding expenses, future revenue, capital requirements and timing and availability of and the need for additional financing; |
|
· |
the success and timing of our preclinical studies and clinical trials; |
|
· |
the potential results of preclinical studies and clinical trials for ZYN002 and ZYN001; |
|
· |
our dependence on third parties in the conduct of our preclinical studies and clinical trials; |
|
· |
the difficulties and expenses associated with obtaining and maintaining regulatory approval of ZYN002 and ZYN001; |
|
· |
our plans and ability to develop and commercialize ZYN002 and ZYN001; |
|
· |
the successful development of our commercialization capabilities, including sales and marketing capabilities; |
|
· |
the size and growth of the potential markets for ZYN002 and ZYN001, the rate and degree of market acceptance of ZYN002 and ZYN001 and our ability to serve those markets; |
|
· |
legal and regulatory developments in the United States and foreign countries; |
|
· |
the success of competing therapies and products that are or become available; |
|
· |
our ability to limit our exposure under product liability lawsuits; |
|
· |
our use of the proceeds from our initial public offering, or IPO, and any subsequent offerings, including our “at-the-market,” or ATM, offerings and our recent follow-on offering; |
|
· |
our ability to obtain and maintain intellectual property protection for ZYN002 and ZYN001; |
|
· |
recently enacted and future legislation regarding the healthcare system, including changes to the Affordable Care Act that may be made in the 115th United States Congress; |
|
· |
our ability to obtain and maintain third-party manufacturing for our product candidates on commercially reasonable terms; |
|
· |
the performance of third parties upon which we depend, including third-party contract research organizations, or CROs, and third-party manufacturers; |
|
· |
our ability to recruit or retain key scientific or management personnel or to retain our executive officers; and |
|
· |
the other risks, uncertainties and factors discussed in our Annual Report on Form 10-K for the fiscal year ended December 31, 2016, or our 2016 Annual Report, under the caption “Item 1.A Risk Factors”. |
In light of these risks and uncertainties, expected results or other anticipated events or circumstances discussed in this Form 10-Q (including the exhibits hereto) might not occur. We undertake no obligation, and specifically decline any obligation, to publicly update or revise any forward-looking statements, even if experience or future developments make it clear that projected results expressed or implied in such statements will not be realized, except as may be required by law.
3
PART I – FINANCIAL INFORMATION
Item 1. Consolidated Financial Statements (Unaudited)
ZYNERBA PHARMACEUTICALS, INC.
CONSOLIDATED BALANCE SHEETS
(UNAUDITED)
|
|
|
June 30, |
|
December 31, |
|
||
|
|
|
2017 |
|
2016 |
|
||
|
Assets |
|
|
|
|
|
|
|
|
Current assets: |
|
|
|
|
|
|
|
|
Cash and cash equivalents |
|
$ |
70,179,199 |
|
$ |
30,965,791 |
|
|
Incentive and tax receivables |
|
|
3,971,828 |
|
|
3,613,943 |
|
|
Prepaid expenses and other current assets |
|
|
2,307,466 |
|
|
1,830,958 |
|
|
Total current assets |
|
|
76,458,493 |
|
|
36,410,692 |
|
|
Property and equipment, net |
|
|
177,994 |
|
|
143,382 |
|
|
Incentive and tax receivables |
|
|
2,456,286 |
|
|
— |
|
|
Other assets |
|
|
200 |
|
|
200 |
|
|
Total assets |
|
$ |
79,092,973 |
|
$ |
36,554,274 |
|
|
Liabilities and Stockholders' Equity |
|
|
|
|
|
|
|
|
Current liabilities: |
|
|
|
|
|
|
|
|
Accounts payable |
|
$ |
2,024,991 |
|
$ |
1,848,084 |
|
|
Accrued expenses |
|
|
5,004,856 |
|
|
4,284,907 |
|
|
Deferred grant revenue |
|
|
833,975 |
|
|
833,975 |
|
|
Total current liabilities |
|
|
7,863,822 |
|
|
6,966,966 |
|
|
Stockholders' equity: |
|
|
|
|
|
|
|
|
Preferred stock, $0.001 par value; 10,000,000 shares authorized; no shares issued or outstanding |
|
|
— |
|
|
— |
|
|
Common stock, $0.001 par value; 200,000,000 shares authorized; 13,257,279 shares issued and outstanding at June 30, 2017 and 9,994,825 shares issued and outstanding at December 31, 2016 |
|
|
13,257 |
|
|
9,995 |
|
|
Additional paid-in capital |
|
|
132,766,956 |
|
|
75,545,875 |
|
|
Accumulated deficit |
|
|
(61,551,062) |
|
|
(45,968,562) |
|
|
Total stockholders' equity |
|
|
71,229,151 |
|
|
29,587,308 |
|
|
Total liabilities and stockholders' equity |
|
$ |
79,092,973 |
|
$ |
36,554,274 |
|
See accompanying notes to unaudited consolidated financial statements.
4
ZYNERBA PHARMACEUTICALS, INC.
CONSOLIDATED STATEMENTS OF OPERATIONS
(UNAUDITED)
|
|
|
Three months ended |
|
Six months ended |
||||||||
|
|
|
June 30, |
|
June 30, |
||||||||
|
|
|
2017 |
|
2016 |
|
2017 |
|
2016 |
||||
|
Revenue |
|
$ |
— |
|
$ |
— |
|
$ |
— |
|
$ |
7,250 |
|
Operating expenses: |
|
|
|
|
|
|
|
|
|
|
|
|
|
Research and development |
|
|
5,732,797 |
|
|
4,807,177 |
|
|
11,224,252 |
|
|
7,376,167 |
|
General and administrative |
|
|
2,632,857 |
|
|
1,476,357 |
|
|
4,844,650 |
|
|
3,156,487 |
|
Total operating expenses |
|
|
8,365,654 |
|
|
6,283,534 |
|
|
16,068,902 |
|
|
10,532,654 |
|
Loss from operations |
|
|
(8,365,654) |
|
|
(6,283,534) |
|
|
(16,068,902) |
|
|
(10,525,404) |
|
Other income (expense): |
|
|
|
|
|
|
|
|
|
|
|
|
|
Interest income |
|
|
124,535 |
|
|
18,118 |
|
|
201,420 |
|
|
30,496 |
|
Foreign exchange (loss) gain |
|
|
(82,360) |
|
|
(20,250) |
|
|
284,982 |
|
|
(43,398) |
|
Total other income (expense) |
|
|
42,175 |
|
|
(2,132) |
|
|
486,402 |
|
|
(12,902) |
|
Loss before income taxes |
|
|
(8,323,479) |
|
|
(6,285,666) |
|
|
(15,582,500) |
|
|
(10,538,306) |
|
Income tax expense |
|
|
— |
|
|
(56,277) |
|
|
— |
|
|
(27,543) |
|
Net loss |
|
$ |
(8,323,479) |
|
$ |
(6,229,389) |
|
$ |
(15,582,500) |
|
$ |
(10,510,763) |
|
|
|
|
|
|
|
|
|
|
|
|
|
|
|
Net loss per share basic and diluted |
|
$ |
(0.64) |
|
$ |
(0.70) |
|
$ |
(1.24) |
|
$ |
(1.19) |
|
Basic and diluted weighted average shares outstanding |
|
|
13,052,294 |
|
|
8,860,592 |
|
|
12,562,594 |
|
|
8,842,271 |
See accompanying notes to unaudited consolidated financial statements.
5
ZYNERBA PHARMACEUTICALS, INC.
CONSOLIDATED STATEMENT OF STOCKHOLDERS’ EQUITY
|
|
Stockholders' equity |
||||||||||||
|
|
|
|
|
|
|
|
|
|
|
|
|
Total |
|
|
|
Common stock |
|
Additional |
|
Accumulated |
|
stockholders' |
||||||
|
|
Shares |
|
Amount |
|
paid-capital |
|
deficit |
|
equity |
||||
|
Balance at December 31, 2016 |
9,994,825 |
|
$ |
9,995 |
|
$ |
75,545,875 |
|
$ |
(45,968,562) |
|
$ |
29,587,308 |
|
Issuance of common stock, net of issuance costs |
3,220,000 |
|
|
3,220 |
|
|
54,242,359 |
|
|
— |
|
|
54,245,579 |
|
Exercise of stock options |
42,454 |
|
|
42 |
|
|
434,649 |
|
|
— |
|
|
434,691 |
|
Stock-based compensation expense |
— |
|
|
— |
|
|
2,544,073 |
|
|
— |
|
|
2,544,073 |
|
Net loss |
— |
|
|
— |
|
|
— |
|
|
(15,582,500) |
|
|
(15,582,500) |
|
Balance at June 30, 2017 |
13,257,279 |
|
$ |
13,257 |
|
$ |
132,766,956 |
|
$ |
(61,551,062) |
|
$ |
71,229,151 |
See accompanying notes to unaudited consolidated financial statements.
6
ZYNERBA PHARMACEUTICALS, INC.
CONSOLIDATED STATEMENTS OF CASH FLOWS
(UNAUDITED)
|
|
|
Six months ended June 30, |
|||||
|
|
|
2017 |
|
2016 |
|
||
|
Cash flows from operating activities: |
|
|
|
|
|
|
|
|
Net loss |
|
$ |
(15,582,500) |
|
$ |
(10,510,763) |
|
|
Adjustments to reconcile net loss to net cash used in operating activities: |
|
|
|
|
|
|
|
|
Depreciation |
|
|
43,595 |
|
|
27,450 |
|
|
Stock-based compensation |
|
|
2,544,073 |
|
|
1,576,538 |
|
|
Changes in operating assets and liabilities: |
|
|
|
|
|
|
|
|
Incentive and tax receivables |
|
|
(2,814,171) |
|
|
(1,335,597) |
|
|
Prepaid expenses and other assets |
|
|
(249,995) |
|
|
(223,077) |
|
|
Deferred grant revenue |
|
|
— |
|
|
(7,250) |
|
|
Accounts payable |
|
|
122,445 |
|
|
1,877,165 |
|
|
Accrued expenses |
|
|
615,123 |
|
|
(755,943) |
|
|
Net cash used in operating activities |
|
|
(15,321,430) |
|
|
(9,351,477) |
|
|
Cash flows from investing activities: |
|
|
|
|
|
|
|
|
Purchases of property and equipment |
|
|
(78,207) |
|
|
(28,535) |
|
|
Net cash used in investing activities |
|
|
(78,207) |
|
|
(28,535) |
|
|
Cash flows from financing activities: |
|
|
|
|
|
|
|
|
Proceeds from the issuance of common stock, net of offering costs |
|
|
54,245,579 |
|
|
— |
|
|
Payment of financing costs |
|
|
(67,225) |
|
|
— |
|
|
Proceeds from the exercise of stock options |
|
|
434,691 |
|
|
— |
|
|
Net cash provided by financing activities |
|
|
54,613,045 |
|
|
— |
|
|
Net increase (decrease) in cash and cash equivalents |
|
|
39,213,408 |
|
|
(9,380,012) |
|
|
Cash and cash equivalents at beginning of period |
|
|
30,965,791 |
|
|
41,513,060 |
|
|
Cash and cash equivalents at end of period |
|
$ |
70,179,199 |
|
$ |
32,133,048 |
|
|
|
|
|
|
|
|
|
|
|
Supplemental disclosures of cash flow information: |
|
|
|
|
|
|
|
|
Deferred financing costs included in accounts payable and accrued expenses |
|
|
159,288 |
|
|
— |
|
See accompanying notes to unaudited consolidated financial statements
7
ZYNERBA PHARMACEUTICALS, INC.
NOTES TO UNAUDITED CONSOLIDATED FINANCIAL STATEMENTS
(1) Nature of Business and Liquidity
Zynerba Pharmaceuticals, Inc., together with its subsidiary, Zynerba Pharmaceuticals Pty Ltd (the “Company”, “we”), is a clinical stage specialty pharmaceutical company dedicated to developing and commercializing innovative transdermal cannabinoid treatments for patients with high unmet needs. The Company was incorporated on January 31, 2007 under the laws of the State of Delaware as AllTranz, Inc. and changed its name to Zynerba Pharmaceuticals, Inc. in August 2014. The Company operated in Lexington, Kentucky until October 2014 when it moved its operations to Pennsylvania.
The Company has incurred losses and negative cash flows from operations since inception and has an accumulated deficit of $61.6 million as of June 30, 2017. The Company anticipates incurring additional losses until such time, if ever, that it can generate significant revenue from its product candidates currently in development. The Company's primary source of liquidity has been the issuance of equity securities and convertible promissory notes.
In the first quarter of 2017, the Company completed a follow-on public offering, selling 3,220,000 shares at an offering price of $18.00 per share resulting in gross proceeds of $58.0 million. Net proceeds received after deducting underwriting and commissions and offering expenses were $54.2 million.
On June 9, 2017, the Company entered into an Open Market Sales Agreement (the “Sales Agreement”) with Jefferies LLC (“Jefferies”) pursuant to which the Company may sell, from time to time, up to $50 million of its common stock. As of June 30, 2017, no sales have been made under the Sales Agreement. The Sales Agreement replaced the Company’s prior Open Market Sales Agreement with Jefferies, dated as of September 1, 2016, under which the Company sold 794,906 shares of its common stock in the open market at a weighted average selling price of $13.39 per share, for gross proceeds of $10.6 million during 2016.
Management believes that cash and cash equivalents as of June 30, 2017 are sufficient to develop five Phase 3-ready programs and, assuming feedback from the U.S. Food and Drug Administration supports a decision to proceed, initiate at least one Phase 3 program and fund operations and capital requirements into 2019. Substantial additional financings will be needed by the Company to fund its operations, to complete clinical development of and to commercially develop its product candidates. There is no assurance that such financing will be available when needed or on acceptable terms.
The Company is subject to those risks associated with any clinical stage pharmaceutical company that has substantial expenditures for research and development. There can be no assurance that the Company's research and development projects will be successful, that products developed will obtain necessary regulatory approval, or that any approved product will be commercially viable. In addition, the Company operates in an environment of rapid technological change and is largely dependent on the services of its employees and consultants.
(2) Summary of Significant Accounting Policies
a. Basis of Presentation
The accompanying unaudited interim consolidated financial statements of the Company has been prepared in accordance with U.S. generally accepted accounting principles (“GAAP”) for interim financial information and with the instructions to Form 10-Q and Article 10 of Regulation S-X. The interim unaudited consolidated financial statements have been prepared on the same basis as the consolidated financial statements as of and for the year ended December 31, 2016 included in the Company’s Annual Report on Form 10-K for the year ended December 31, 2016 (“2016 Annual Report”), filed with the Securities and Exchange Commission (“SEC”). In the opinion of management, the accompanying consolidated financial statements of the Company include all normal and recurring adjustments (which consist primarily of accruals, estimates and assumptions that impact the financial statements) considered necessary to present fairly the Company's financial position as of June 30, 2017 and its results of operations and cash flows for the six months ended June 30, 2017 and 2016. Operating results for any interim period are not necessarily indicative of results for any future interim period or for the entire year. The accompanying unaudited interim consolidated financial statements should be read in conjunction with the consolidated financial statements and related notes included in the Company’s 2016 Annual Report.
8
ZYNERBA PHARMACEUTICALS, INC.
NOTES TO UNAUDITED CONSOLIDATED FINANCIAL STATEMENTS (Continued)
b. Use of Estimates
The preparation of financial statements in conformity with GAAP requires management to make estimates and assumptions that affect the reported amounts of assets and liabilities and disclosures of contingent assets and liabilities at the date of the financial statements and reported amounts of revenue and expenses during the reporting period. Actual results could differ from such estimates.
c. Incentive and Tax Receivables
The Company’s subsidiary, Zynerba Pharmaceuticals Pty Ltd (the “Subsidiary”), is incorporated in Australia. The Subsidiary is eligible to participate in an Australian research and development tax incentive program. As part of this program, the Subsidiary is eligible to receive a cash refund from the Australian Taxation Office for a percentage of the research and development costs expended by the Subsidiary in Australia. The cash refund is available to eligible companies with an annual aggregate revenue of less than $20.0 million (Australian) during the reimbursable period. The Company’s estimate of the amount of cash refund it expects to receive related to the Australian research and development tax incentive program is included in “Incentive and tax receivables” in the accompanying consolidated balance sheets. As of June 30, 2017, the Company’s estimate of the amount of cash refund it expects to receive in 2017 for 2016 eligible spending as part of this incentive program was $3.5 million and was recorded as a current asset. The Company’s estimate of the amount of cash refund it expects to receive for 2017 eligible spending through June 30, 2017 was $2.5 million and was recorded as a non-current asset.
In addition, the Subsidiary incurs Goods and Services Tax (“GST”) on services provided by Australian vendors. As an Australian entity, the Subsidiary is entitled to a refund of the GST paid. The Company’s estimate of the amount of cash refund it expects to receive related to GST incurred is included in “Incentive and tax receivables” in the accompanying consolidated balance sheets. As of June 30, 2017, the current portion of incentive and tax receivables included $0.5 million for GST on expenses incurred with Australian vendors during the three months ended June 30, 2017.
d. Research and Development
Research and development costs are expensed as incurred and are primarily comprised of external research and development expenses incurred under arrangements with third parties, such as contract research organizations (“CROs”), consultants and employee-related expenses including salaries and benefits. At the end of each reporting period, the Company compares the payments made to each service provider to the estimated progress towards completion of the related project. Factors that the Company considers in preparing these estimates include the number of patients enrolled in studies, milestones achieved and other criteria related to the efforts of its vendors. These estimates will be subject to change as additional information becomes available. Depending on the timing of payments to vendors and estimated services provided, the Company will record net prepaid or accrued expenses related to these costs. Research and development expenses are recorded net of expected refunds of eligible research and development costs paid to Australian vendors pursuant to the Australian research and development tax incentive program and GST incurred on services provided by Australian vendors.
e. Net Loss per Share
Basic net loss per share is determined using the weighted average number of shares of common stock outstanding during each period. Diluted net income per share includes the effect, if any, from the potential exercise or conversion of securities, such as convertible preferred stock, restricted stock, and stock options, which would result in the issuance of incremental shares of common stock. Basic and dilutive computations of net loss per share are the same in periods in which a net loss exists as the dilutive effects of convertible preferred stock, restricted stock and stock options would be anti-dilutive.
9
ZYNERBA PHARMACEUTICALS, INC.
NOTES TO UNAUDITED CONSOLIDATED FINANCIAL STATEMENTS (Continued)
The following potentially dilutive securities outstanding as of June 30, 2017 and 2016 have been excluded from the computation of diluted weighted average shares outstanding, as their effects on net loss per share for the periods presented would be anti-dilutive:
|
|
|
June 30, |
|||
|
|
|
2017 |
|
2016 |
|
|
Stock options |
|
2,366,345 |
|
1,757,399 |
|
|
Unvested restricted stock |
|
181,214 |
|
326,185 |
|
|
|
|
2,547,559 |
|
2,083,584 |
|
f. Recent Accounting Pronouncements
In February 2016, the Financial Accounting Standards Board (“FASB”) issued Accounting Standards Update (“ASU”) No. 2016-02, Leases, which requires that lease arrangements longer than 12 months result in an entity recognizing an asset and liability. The pronouncement is effective for interim and annual periods beginning after December 15, 2018 with early adoption permitted. The adoption of this guidance is not expected to have a material impact on the Company’s consolidated financial statements.
In March 2016, the FASB issued ASU No. 2016-09, Improvements to Employee Share-Based Payment Accounting, which is intended to simplify the accounting and reporting for employee share-based payment transactions. The pronouncement is effective for interim and annual periods beginning after December 31, 2016 with early adoption permitted. The adoption of the guidance in ASU No. 2016-09 in the first quarter of 2017 did not have a material impact on the Company’s consolidated financial statements.
In August 2016, the FASB issued ASU No. 2016-15, Classification of Certain Cash Receipts and Cash Payments, which provides specific guidance related to eight cash flow classification issues. The pronouncement is effective for interim and annual periods beginning after December 15, 2017 with early adoption permitted. The adoption of this guidance is not expected to have a material impact on the Company’s consolidated financial statements.
In November 2016, the FASB issued ASU No. 2016-18, Restricted Cash, which requires changes in restricted cash and restricted cash equivalents to be explained on the statement of cash flows by including restricted cash and restricted cash equivalents in the beginning-of-period and end-of-period total cash and cash equivalents shown on the statement of cash flows. The pronouncement is effective for interim and annual periods beginning after December 15, 2017 with early adoption permitted. The adoption of this guidance is not expected to have a material impact on the Company’s consolidated financial statements.
(3) Fair Value Measurements
The Company measures certain assets and liabilities at fair value in accordance with Accounting Standards
Codification (“ASC”) 820, Fair Value Measurements and Disclosures. ASC 820 defines fair value as the price that would be received to sell an asset or paid to transfer a liability (the exit price) in an orderly transaction between market participants at the measurement date. The guidance in ASC 820 outlines a valuation framework and creates a fair value hierarchy that serves to increase the consistency and comparability of fair value measurements and the related disclosures. In determining fair value, the Company maximizes the use of quoted prices and observable inputs. Observable inputs are inputs that market participants would use in pricing the asset or liability based on market data obtained from independent sources. The fair value hierarchy is broken down into three levels based on the source of inputs as follows:
Level 1 — Valuations based on unadjusted quoted prices in active markets for identical assets or liabilities.
Level 2 — Valuations based on observable inputs and quoted prices in active markets for similar assets and liabilities.
10
ZYNERBA PHARMACEUTICALS, INC.
NOTES TO UNAUDITED CONSOLIDATED FINANCIAL STATEMENTS (Continued)
Level 3 — Valuations based on unobservable inputs and models that are supported by little or no market activity.
The following fair value hierarchy tables present information about each major category of financial assets measured at fair value on a recurring basis as of June 30, 2017 and December 31, 2016:
|
|
|
|
|
|
|
|
|
|
|
|
|
|
|
|
|
|
|
|
|
Fair Value Measurement |
|
|||||||
|
|
|
Carrying amount |
|
as of June 30, 2017 |
|
||||||||
|
|
|
as of June 30, 2017 |
|
Level 1 |
|
Level 2 |
|
Level 3 |
|
||||
|
Cash equivalents (money market accounts) |
|
$ |
69,541,286 |
|
$ |
69,541,286 |
|
$ |
— |
|
$ |
— |
|
|
Certificate of deposit (included in prepaid expenses and other current assets) |
|
|
20,000 |
|
|
20,000 |
|
|
— |
|
|
— |
|
|
|
|
$ |
69,561,286 |
|
$ |
69,561,286 |
|
$ |
— |
|
$ |
— |
|
|
|
|
|
|
|
|
|
|
|
|
|
|
|
|
|
|
|
|
|
|
Fair Value Measurement |
|
|||||||
|
|
|
Carrying amount |
|
as of December 31, 2016 |
|
||||||||
|
|
|
as of December 31, 2016 |
|
Level 1 |
|
Level 2 |
|
Level 3 |
|
||||
|
Cash equivalents (money market accounts) |
|
$ |
30,485,212 |
|
$ |
30,485,212 |
|
$ |
— |
|
$ |
— |
|
|
Certificate of deposit (included in prepaid expenses and other current assets) |
|
|
20,000 |
|
|
20,000 |
|
|
— |
|
|
— |
|
|
|
|
$ |
30,505,212 |
|
$ |
30,505,212 |
|
$ |
— |
|
$ |
— |
|
(4) Prepaid Expenses and Other Current Assets
Prepaid expenses and other current assets consisted of the following as June 30, 2017 and December 31, 2016:
|
|
|
June 30, |
|
December 31, |
|
||
|
|
|
2017 |
|
2016 |
|
||
|
Prepaid development expenses |
|
$ |
1,793,042 |
|
$ |
1,473,402 |
|
|
Prepaid insurance |
|
|
79,642 |
|
|
321,463 |
|
|
Deferred financing costs |
|
|
226,513 |
|
|
— |
|
|
Other current assets |
|
|
208,269 |
|
|
36,093 |
|
|
Total prepaid expenses and other current assets |
|
$ |
2,307,466 |
|
$ |
1,830,958 |
|
Included in prepaid development expenses above is research and grant funding received that was remitted to third-party research organizations of $0.8 million as June 30, 2017 and December 31, 2016, respectively, that will be recognized as research projects progress and expenses are incurred.
(5) Property and Equipment
Property and equipment consisted of the following as of June 30, 2017 and December 31, 2016:
|
|
|
Estimated |
|
|
|
|
|
|
|
|
|
|
useful life |
|
June 30, |
|
December 31, |
|
||
|
|
|
(in years) |
|
2017 |
|
2016 |
|
||
|
Equipment |
|
2-5 |
|
$ |
85,417 |
|
$ |
85,417 |
|
|
Computer equipment |
|
3-5 |
|
|
30,319 |
|
|
27,111 |
|
|
Furniture and fixtures |
|
5 |
|
|
174,730 |
|
|
99,731 |
|
|
Total cost |
|
|
|
|
290,466 |
|
|
212,259 |
|
|
Less accumulated depreciation |
|
|
|
|
(112,472) |
|
|
(68,877) |
|
|
Property and equipment, net |
|
|
|
$ |
177,994 |
|
$ |
143,382 |
|
Depreciation expense was $23,176 and $13,892 for the three months ended June 30, 2017 and 2016, respectively, and
11
ZYNERBA PHARMACEUTICALS, INC.
NOTES TO UNAUDITED CONSOLIDATED FINANCIAL STATEMENTS (Continued)
$43,595 and $27,450 for the six months ended June 30, 2017 and 2016, respectively.
(6) Accrued Expenses
Accrued expenses consisted of the following as of June 30, 2017 and December 31, 2016:
|
June 30, |
December 31, |
||||||
|
|
|
2017 |
|
2016 |
|
||
|
Accrued compensation |
|
$ |
930,418 |
|
$ |
1,349,108 |
|
|
Accrued research and development |
|
|
3,610,979 |
|
|
2,628,681 |
|
|
Other |
|
|
463,459 |
|
|
307,118 |
|
|
Total accrued expenses |
|
$ |
5,004,856 |
|
$ |
4,284,907 |
|
(7) Common Stock
In the first quarter of 2017, the Company completed an additional follow-on public offering, selling 3,220,000 shares at an offering price of $18.00 per share resulting in gross proceeds of $58.0 million. Net proceeds received after deducting underwriting and commissions and offering expenses were $54.2 million.
On June 9, 2017, the Company entered into the Sales Agreement with Jefferies pursuant to which the Company may sell, from time to time, up to $50.0 million of its common stock. As of June 30, 2017, no sales have been made under the Sales Agreement. The Sales Agreement replaced the Company’s prior Open Market Sales Agreement with Jefferies, dated as of September 1, 2016, under which the Company sold 794,906 shares of its common stock in the open market at a weighted average selling price of $13.39 per share, for gross proceeds of $10.6 million during 2016.
(8) Stock-Based Compensation
The Company maintains the Amended and Restated 2014 Omnibus Incentive Compensation Plan, as amended (“2014 Plan”), which allows for the granting of incentive stock options, nonqualified stock options, stock appreciation rights, stock awards, stock units, performance units and other stock-based awards to employees, officers, non-employee directors, consultants, and advisors. In addition, the 2014 Plan provides selected executive employees with the opportunity to receive bonus awards that are considered qualified performance-based compensation. The 2014 Plan is subject to automatic annual increases in the number of shares authorized for issuance under the 2014 Plan on the first trading day of January each year, commencing on January 1, 2017, equal to the lesser of 1.5 million shares or 10% of the number of shares of common stock outstanding on the last trading day of December of the preceding year. As of January 1, 2017, the number of shares of common stock that may be issued under the 2014 Plan was automatically increased by 999,482 shares, increasing the number of shares of common stock available for issuance under the 2014 Plan to 3,449,482 shares. As of June 30, 2017, 594,844 shares are available for issuance under the 2014 Plan.
Options issued under the 2014 Plan have a contractual life of 10 years and may be exercisable in cash or as otherwise determined by the board of directors. The Company has granted options to employees and non-employee directors. Stock options granted to employees vest 25% upon the first anniversary of the grant date and the balance of unvested options vests in quarterly installments over the remaining three years. Stock options granted annually to non-employee directors vest on the earlier of the one-year anniversary of the grant date, or the date of the Company’s next annual stockholders’ meeting that occurs after the grant date. Effective April 1, 2017, the Company revised its non-employee director compensation policy to enable directors to receive stock options in lieu of quarterly cash payments. Any option granted to the directors in lieu of cash compensation vests in full on the date of grant.
12
ZYNERBA PHARMACEUTICALS, INC.
NOTES TO UNAUDITED CONSOLIDATED FINANCIAL STATEMENTS (Continued)
For the six months ended June 30, 2017 and 2016, the Company recorded stock-based compensation expense related to its stock option grants and restricted stock awards, as follows:
|
|
|
Six Months Ended June 30, 2017 |
|
Six Months Ended June 30, 2016 |
|
||||||||||||||
|
|
|
Research and |
|
General and |
|
Total |
|
Research and |
|
General and |
|
Total |
|
||||||
|
Stock option grants |
|
$ |
1,051,818 |
|
$ |
1,372,335 |
|
$ |
2,424,153 |
|
$ |
558,922 |
|
$ |
897,696 |
|
$ |
1,456,618 |
|
|
Restricted stock awards |
|
|
78,740 |
|
|
41,180 |
|
|
119,920 |
|
|
64,729 |
|
|
55,191 |
|
|
119,920 |
|
|
|
|
$ |
1,130,558 |
|
$ |
1,413,515 |
|
$ |
2,544,073 |
|
$ |
623,651 |
|
$ |
952,887 |
|
$ |
1,576,538 |
|
The following table summarizes the stock option activity for the six months ended June 30, 2017:
|
|
|
|
|
Weighted- |
|
Weighted- |
|
|
|
|
|
|
|
|
|
Average |
|
Average |
|
Aggregate |
||
|
|
|
Number |
|
Exercise |
|
Contractual |
|
Intrinsic |
||
|
|
|
of Shares |
|
Price |
|
Life (in Years) |
|
Value |
||
|
Outstanding as of December 31, 2016 |
|
1,808,493 |
|
$ |
10.22 |
|
|
|
|
|
|
Granted |
|
619,406 |
|
$ |
19.21 |
|
|
|
|
|
|
Exercised |
|
(42,454) |
|
$ |
10.24 |
|
|
|
|
|
|
Forfeited |
|
(19,100) |
|
$ |
15.48 |
|
|
|
|
|
|
Outstanding as of June 30, 2017 |
|
2,366,345 |
|
$ |
12.53 |
|
8.43 |
|
$ |
11,886,212 |
|
Exercisable as of June 30, 2017 |
|
854,998 |
|
$ |
8.95 |
|
7.82 |
|
$ |
6,858,011 |
|
Vested and expected to vest as of June 30, 2017 |
|
2,366,345 |
|
$ |
12.53 |
|
|
|
|
|
During the six months ended June 30, 2017, the Company granted 619,406 stock options to employees and the Company’s Board of Directors, including 2,456 stock options that were granted to certain members of the Board of Directors, at their election, in lieu of quarterly cash payments. The weighted-average grant date fair value of options granted during the six months ended June 30, 2017 and 2016 was $13.09 and $5.50, respectively.
The fair values of stock options granted were calculated using the Black-Scholes option pricing model with the following weighted-average assumptions:
|
|
|
Six months ended June 30, |
||
|
|
|
2017 |
|
2016 |
|
Weighted-average risk-free interest rate |
|
2.11% |
|
1.57% |
|
Expected term of options (in years) |
|
6.14 |
|
5.69 |
|
Expected stock price volatility |
|
77.00% |
|
77.00% |
|
Expected dividend yield |
|
0% |
|
0% |
As of June 30, 2017, there was $12.7 million of unrecognized stock-based compensation expense related to stock options, which is expected to be recognized over a weighted-average period of 2.78 years.
The following table summarizes the restricted stock award activity under the 2014 Plan for the six months ended June 30, 2017:
|
|
|
|
|
Weighted |
|
|
|
|
|
|
|
Average |
|
|
|
|
|
|
|
Grant Date |
|
|
|
|
|
Shares |
|
Fair Value |
|
|
|
Unvested as of December 31, 2016 |
|
253,702 |
|
$ |
1.65 |
|
|
Vested |
|
(72,488) |
|
$ |
1.65 |
|
|
Unvested as of June 30, 2017 |
|
181,214 |
|
$ |
1.65 |
|
|
|
|
|
|
|
|
|
As of June 30, 2017, there was $0.3 million of unrecognized stock-based compensation expense related to unvested restricted stock awards, which is expected to be recognized over a weighted-average period of 1.10 years. The Company expects all 181,214 unvested restricted stock awards to vest.
13
Item 2. Management's Discussion and Analysis of Financial Condition and Results of Operations
You should read the following discussion and analysis of our financial condition and results of operations together with our consolidated financial statements and related notes appearing elsewhere in this Quarterly Report and the audited financial statements and notes thereto for the year ended December 31, 2016 and the related Management’s Discussion and Analysis of Financial Condition and Results of Operations, both of which are contained in our 2016 Annual Report. The following discussion contains forward-looking statements that involve risks, uncertainties and assumptions. Our actual results and the timing of certain events could differ materially from those anticipated in these forward-looking statements as a result of many factors. We discuss factors that we believe could cause or contribute to these differences below and elsewhere in this Quarterly Report, including those set forth under “Cautionary Note Regarding Forward-looking Statements” and “Risk Factors” in this Quarterly Report and our 2016 Annual Report.
Overview
Company Overview
We are a clinical stage specialty pharmaceutical company dedicated to developing and commercializing innovative transdermal synthetic cannabinoid treatments for patients with high unmet needs. We are evaluating two patent protected product candidates, ZYN002 and ZYN001, in five indications. We believe these product candidates will provide new treatment options for patients, as well as additional treatment options for patients not currently receiving adequate relief from current treatment regimens.
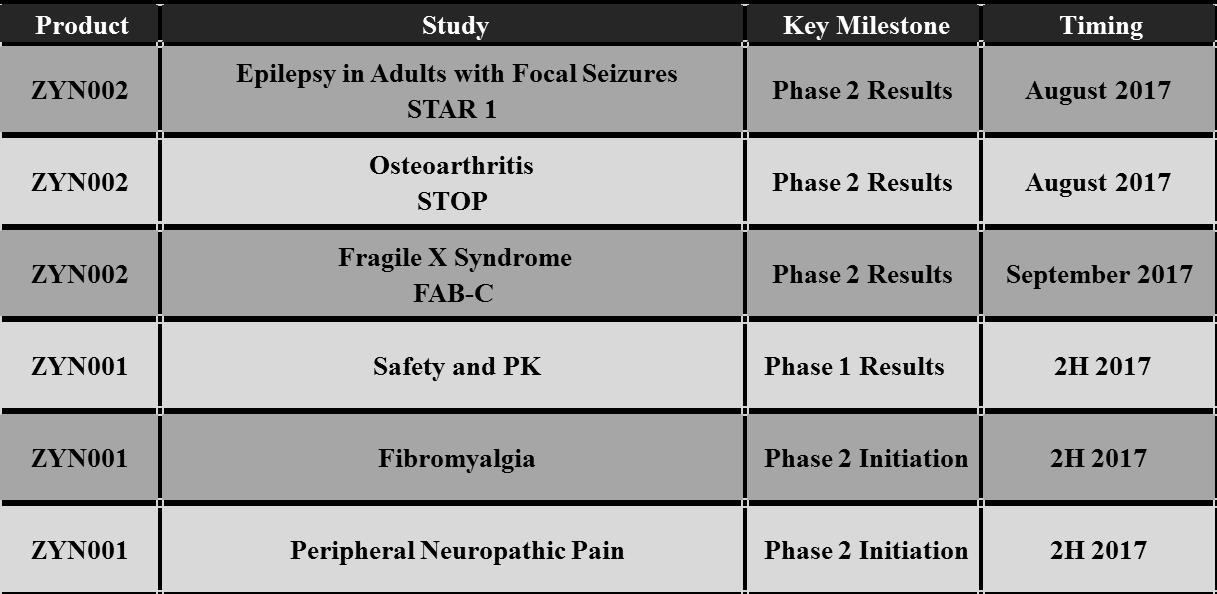
We are studying ZYN002 in adult patients with refractory epileptic focal seizures (formerly known as complex partial seizures) and osteoarthritis, or OA, and in pediatric patients with fragile X syndrome, or FXS. In 2016, we completed a Phase 1 program for ZYN002 in which it was demonstrated to be safe and well tolerated in both healthy volunteers and patients with epilepsy. We recently completed dosing in our Phase 2 STAR 1 clinical trial for ZYN002 in adult epilepsy patients and our Phase 2 STOP clinical trial for ZYN002 in adult osteoporosis patients. We have completed enrollment in our FAB-C Phase 2 clinical trial for ZYN002 in Pediatric FXS patients.
We intend to study ZYN001 in patients with fibromyalgia and peripheral neuropathic pain. We initiated Phase 1 clinical trials for ZYN001 in June of 2017.
Cannabinoids are a class of compounds derived from Cannabis plants. The two primary cannabinoids contained in Cannabis are cannabidiol, or CBD, and ∆9-tetrahydrocannabinol, or THC. Clinical and preclinical data suggest that CBD has positive effects on treating epilepsy, arthritis and FXS, and THC has positive effects on treating pain. We believe ZYN002 may potentially offer first‑line therapies to patients suffering from epilepsy, OA and FXS, and ZYN001 may potentially offer first-line therapies to patients suffering from fibromyalgia and peripheral neuropathic pain.
ZYN002 is the first and only synthetic CBD formulated as a permeation‑enhanced gel for transdermal delivery, and is patent‑protected through 2030. CBD is the primary non‑psychoactive component of Cannabis. In preclinical animal studies, ZYN002’s permeation enhancer increased delivery of CBD through the layers of the skin and into the circulatory system. These preclinical studies suggest increased bioavailability, consistent plasma levels and the avoidance of first‑pass liver metabolism of CBD when delivered transdermally. In addition, an in vitro study published in Cannabis and Cannabinoid Research in April 2016 demonstrated that CBD is degraded to THC in an acidic environment such as the stomach. We believe such degradation may lead to increased psychoactive effects if CBD is delivered orally and may be avoided with the transdermal delivery of ZYN002, which maintains CBD in a neutral pH. ZYN002, which is being developed as a clear gel with once- or twice-daily dosing, is targeting treatment of epilepsy, OA and FXS, which collectively affect millions of patients using treatments that currently comprise a multi‑billion dollar market. We have been granted orphan drug designation from the U.S. Food and Drug Administration, or FDA, for ZYN002 for the treatment of FXS.
ZYN001 is a pro‑drug of THC that enables effective transdermal delivery of THC via a patch and is patent‑protected through 2031. A pro‑drug is a drug administered in an inactive or less active form and designed to enable more effective delivery, which is then converted into an active form through a normal metabolic process. In addition, we expect that ZYN001 will be classified by the FDA as a new chemical entity. We are working with a development partner, LTS LOHMANN Therapie-Systeme AG, to optimize the formulation of ZYN001 into a state of the art drug-adhesive matrix transdermal patch to be used in clinical studies.
14
In our preclinical animal studies, ZYN001 demonstrated effective skin permeation with sustained delivery and rapid conversion of ZYN001 to THC. These preclinical studies suggest increased bioavailability, consistent plasma levels and the avoidance of first‑pass liver metabolism of ZYN001. In addition, preclinical testing has shown no genotoxicity findings and safety pharmacology findings consistent with those seen with THC. ZYN001 is targeting two pain indications, fibromyalgia and peripheral neuropathic pain, which collectively currently represent multi-billion dollar markets.
Our key development programs and expected timelines for the development of ZYN002 and ZYN001 are shown in the chart below:
We have never been profitable and have incurred net losses since inception. Our net losses were $15.6 million and $10.5 million for the six months ended June 30, 2017 and 2016, respectively. As of June 30, 2017, our accumulated deficit was $61.6 million. We expect to incur losses for the foreseeable future, and we expect these losses to increase as we continue our development of, and seek regulatory approvals for, our product candidates. Because of the numerous risks and uncertainties associated with product development, we are unable to predict the timing or amount of increased expenses or when, or if, we will be able to achieve or maintain profitability.
Financial Operations Overview
The following discussion sets forth certain components of our consolidated statements of operations as well as factors that impact those items.
Revenue
Historically, our revenue consisted of state and federal research grants and fees received from research services for third-party product development. We recognize revenue when persuasive evidence of an arrangement exists, delivery has occurred or services have been rendered, the price is fixed or determinable and collectability is reasonably assured.
Research and Development Expenses
Our research and development expenses relating to our product candidates consist of the following:
|
· |
expenses associated with preclinical development and clinical trials; |
|
· |
personnel-related expenses, such as salaries, benefits, travel and other related expenses, including stock-based |
15
compensation; |
|
· |
payments to third-party CROs, contractor laboratories and independent contractors; and |
|
· |
depreciation, maintenance and other facility-related expenses. |
We expense all research and development costs as incurred. Clinical development expenses for our product candidates are a significant component of our research and development expenses. Expenses associated with clinical trials will increase as our clinical trials progress. Product candidates in later stage clinical development generally have higher research and development expenses than those in earlier stages of development, primarily due to increased size and duration of the clinical trials. We track and record information regarding external research and development expenses for each grant, study or trial that we conduct. We use third-party CROs, contractor laboratories and independent contractors in preclinical studies and clinical trials. We recognize the expenses associated with third parties performing these services for us in our preclinical studies and clinical trials based on the percentage of each study completed at the end of each reporting period.
For the six months ended June 30, 2017 and 2016, we recognized research and development expenses of $11.2 million and $7.4 million, respectively, which were net of $2.4 million and $1.1 million, respectively, associated with the Australian research and development tax incentive program. As part of this program, we are eligible to receive a cash refund from the Australian Taxation Office for a percentage of our research and development costs expended by Zynerba Pharmaceuticals Pty Ltd., our Australian subsidiary.
We expect research and development expenses in future years to continue to increase as we continue our clinical trials and begin new phases for each of our product candidates. These expenditures are subject to numerous uncertainties regarding timing and cost to completion. Completion of our preclinical development and clinical trials may take several years or more and the length of time generally varies according to the type, complexity, novelty and intended use of a product candidate. The cost of clinical trials may vary significantly over the life of a project as a result of differences arising during clinical development, including, among others:
|
· |
the number of sites included in the clinical trials; |
|
· |
the length of time required to enroll suitable patients; |
|
· |
the size of patient populations participating in the clinical trials; |
|
· |
the duration of patient follow-ups; |
|
· |
the development stage of the product candidates; and |
|
· |
the efficacy and safety profile of the product candidates. |
Due to the early stages of our research and development, we are unable to determine the duration or completion costs of our development of ZYN002 and ZYN001. As a result of the difficulties of forecasting research and development costs of ZYN002 and ZYN001 as well as the other uncertainties discussed above, we are unable to determine when and to what extent we will generate revenue from the commercialization and sale of an approved product candidate.
General and Administrative Expenses
General and administrative expenses consist primarily of salaries, benefits and other related costs, including stock-based compensation, for personnel serving in our executive, finance, legal, human resource, investor relations and commercial functions. Our general and administrative expenses also include facility and related costs not included in research and development expenses, professional fees for legal services, including patent-related expenses, consulting, tax and accounting services, insurance, market research and general corporate expenses. We expect that our general and administrative expenses will increase with the continued development and potential commercialization of our product candidates.
We expect that our general and administrative expenses in 2017 and for the next several years will be higher than in past
16
years as we increase our headcount. We also anticipate increased expenses relating to our operations as a public reporting company, including increased costs for the hiring of additional personnel, and for payment to outside consultants, including lawyers and accountants, to comply with additional regulations, corporate governance, internal controls and similar requirements applicable to public reporting companies, as well as increased costs for insurance.
Interest Income
Interest income consists primarily of interest earned on balances maintained in our money market bank account.
Foreign Exchange Gain (Loss)
Foreign exchange gain (loss) relates to the effect of exchange rates on transactions incurred by our Australian subsidiary.
Critical Accounting Estimates
Our management’s discussion and analysis of our financial condition and results of operations is based on our consolidated financial statements, which have been prepared in accordance with U.S. generally accepted accounting principles, or GAAP. The preparation of these financial statements requires us to make estimates and judgments that affect the reported amounts of assets and liabilities, disclosure of contingent assets and liabilities at the date of the financial statements, and the reported amounts of revenues and expenses during the reported period. In accordance with GAAP, we base our estimates on historical experience, known trends and events and various other factors that we believe to be reasonable under the circumstances, the results of which form the basis for making judgments about the carrying amounts of assets and liabilities that are not readily apparent from other sources. Actual results may differ from these estimates under different assumptions or conditions.
We define our critical accounting policies as those accounting principles generally accepted in the United States that require us to make subjective estimates and judgments about matters that are uncertain and are likely to have a material impact on our financial condition and results of operations as well as the specific manner in which we apply those principles. Critical accounting estimates and the accounting policies critical to the process of making significant judgments and estimates in the preparation of our consolidated financial statements are discussed in our 2016 Annual Report under Part I, Item 7, “Critical Accounting Policies and Use of Estimates”. During the six months ended June 30, 2017, there have been no material changes to the critical accounting estimates or critical accounting policies discussed in our 2016 Annual Report.
Results of Operations
Comparison of the Three Months Ended June 30, 2017 and 2016
Research and Development Expenses
Research and development expenses increased by $0.9 million or 19%, to $5.7 million for the three months ended June 30, 2017 from $4.8 million for the three months ended June 30, 2016. The increase was primarily related to increases in the number and size of our non-clinical studies and clinical trials for ZYN002 and ZYN001 and personnel costs, including stock-based compensation expense.
General and Administrative Expenses
General and administrative expenses increased by $1.1 million, or 78%, to $2.6 million for the three months ended June 30, 2017 from $1.5 million for the three months ended June 30, 2016. The increase was primarily related to increases in expenses associated with the development of commercialization plans for our products and personnel costs, including stock-based compensation expense.
Other Income (Expense)
During the three months ended June 30, 2017 and 2016, we recognized $124,535 and $18,118, respectively, in interest income. The increase in interest income was primarily related to a higher amount of invested cash resulting from the receipt of $54.2 million from our public follow-on offering in the first quarter of 2017. During the three months ended
17
June 30, 2017 and 2016, we recognized a foreign currency loss of $82,360 and $20,250, respectively. Foreign currency gains and losses are due primarily to the remeasurement of our Australian subsidiary’s assets and liabilities that are denominated in the local currency to the subsidiary’s functional currency, which is the U.S. dollar.
Income Tax Benefit
During the three months ended June 30, 2016, we reversed $56,277 of income tax expense associated with our Australian subsidiary.
Comparison of the Six Months Ended June 30, 2017 and 2016
Revenue
Revenue for the six months ended June 30, 2016 was related to work performed in connection with grants received prior to 2016. Grants received were recorded as deferred revenue and recognized as revenue as the designated preclinical study progressed and amounts were earned. No additional grants were received in 2016 or 2017.
Research and Development Expenses
Research and development expenses increased by $3.8 million, or 52%, to $11.2 million for the six months ended June 30, 2017 from $7.4 million for the six months ended June 30, 2016. The increase was primarily related to increases in the number and size of our non-clinical studies and clinical trials for ZYN002 and ZYN001 and personnel costs, including stock-based compensation expense.
General and Administrative Expenses
General and administrative expenses increased by $1.6 million, or 53%, to $4.8 million for the six months ended June 30, 2017 from $3.2 million for the six months ended June 30, 2016. The increase was primarily related to increases in expenses associated with the development of commercialization plans for our products, public company reporting and compliance expenses and personnel costs, including stock-based compensation expense.
Other Income (Expense)
For the six months ended June 30, 2017 and 2016, we recognized $201,420 and $30,496, respectively, in interest income. The increase in interest income was primarily related to a higher amount of invested cash resulting from the receipt of $54.2 million from our public follow-on offering in the first quarter of 2017. During the six months ended June 30, 2017 and 2016, we recognized a foreign currency gain of $284,982 and a foreign currency loss of $43,398, respectively. Foreign currency gains and losses are due primarily to the remeasurement of our Australian subsidiary’s assets and liabilities that are denominated in the local currency to the subsidiary’s functional currency, which is the U.S. dollar.
Liquidity and Capital Resources
Since our inception in 2007, we have devoted most of our cash resources to research and development and general and administrative activities. We have financed our operations primarily with the proceeds from the sale of equity securities (most notably our IPO in 2015, sales under our “at-the-market” offering in 2016, and our follow-on public offering in the first quarter of 2017, which are described below under Recent Equity Financings) and convertible promissory notes, state and federal grants and research services.
To date, we have not generated any revenue from the sale of products, and we do not anticipate generating any revenue from the sales of products for the foreseeable future. We have incurred losses and generated negative cash flows from operations since inception. As of June 30, 2017, our principal source of liquidity was our cash and cash equivalents, which totaled $70.2 million. Our working capital was $68.6 million as of June 30, 2017.
Management believes that cash and cash equivalents as of June 30, 2017 is sufficient to develop five Phase 3-ready programs and, assuming feedback from the FDA supports a decision to proceed, initiate at least one Phase 3 program and fund operations and capital requirements into 2019. However, it is difficult to predict our spending for our product
18
candidates prior to obtaining FDA approval. Moreover, changing circumstances beyond our control may cause us to expend more cash than currently expected or expend cash significantly faster than we currently anticipate.
Recent Equity Financings
In June 2017, we entered into an Open Market Sales Agreement, or Sales Agreement, with Jefferies LLC, or Jefferies, pursuant to which we may sell, from time to time, up to $50 million of our common stock. As of June 30, 2017, no sales have been made under the Sales Agreement. The Sales Agreement replaced our prior Open Market Sales Agreement with Jefferies, dated as of September 1, 2016, under which we sold 794,906 shares of our common stock in the open market at a weighted average selling price of $13.39 per share, for gross proceeds of $10.6 million during 2016.
In the first quarter of 2017, we completed an additional follow-on public offering, selling 3,220,000 shares of our common stock at an offering price of $18.00 per share, resulting in gross proceeds of $58.0 million. Net proceeds received after deducting underwriting and commissions and offering expenses were $54.2 million.
Debt
We had no debt outstanding as of June 30, 2017 or December 31, 2016.
Future Capital Requirements
During the six months ended June 30, 2017, net cash used in operating activities was $15.3 million, and our accumulated deficit as of June 30, 2017 was $61.6 million. Our expectations regarding future cash requirements do not reflect the potential impact of any future acquisitions, mergers, dispositions, joint ventures or investments that we may make in the future. To the extent that we enter into any of those types of transactions, we may need to raise substantial additional capital.
We expect to continue to incur substantial additional operating losses for at least the next several years as we continue to develop our product candidates and seek marketing approval and, subject to obtaining such approval, the eventual commercialization of our product candidates. If we obtain marketing approval for either of our product candidates, we will incur significant sales, marketing and manufacturing expenses. In addition, we expect to incur additional expenses to add operational, financial and information systems and personnel, including personnel to support our planned product commercialization efforts. We also expect to continue to incur significant costs to comply with corporate governance, internal controls and similar requirements associated with operating as a public reporting company.
Our future use of operating cash and capital requirements will depend on many forward-looking factors, including the following:
|
· |
the initiation, progress, timing, costs and results of preclinical studies and clinical trials for our product candidates; |
|
· |
the clinical development plans we establish for these product candidates; |
|
· |
the number and characteristics of product candidates that we develop or may in-license; |
|
· |
the terms of any collaboration agreements we may choose to execute; |
|
· |
the outcome, timing and cost of meeting regulatory requirements established by the United States Drug Enforcement Agency, the FDA, the European Medicines Agency or other comparable foreign regulatory authorities; |
|
· |
the cost of filing, prosecuting, defending and enforcing our patent claims and other intellectual property rights; |
|
· |
the cost of defending intellectual property disputes, including patent infringement actions brought by third parties against us; |
|
· |
costs and timing of the implementation of commercial scale manufacturing activities; and |
19
|
· |
the cost of establishing, or outsourcing, sales, marketing and distribution capabilities for any product candidates for which we may receive regulatory approval in regions where we choose to commercialize our products on our own. |
To the extent that our capital resources are insufficient to meet our future operating and capital requirements, we will need to finance our cash needs through public or private equity offerings, debt financings, collaboration and licensing arrangements or other financing alternatives. We have no committed external sources of funds. Additional equity or debt financing or collaboration and licensing arrangements may not be available on acceptable terms, if at all.
If we raise additional funds by issuing equity securities, our stockholders will experience dilution.
Cash Flows
The following table summarizes our cash flows from operating, investing and financing activities for the six months ended June 30, 2017 and 2016.
|
|
|
Six Months Ended June 30, |
|
||||
|
|
|
2017 |
|
2016 |
|
||
|
Statement of Cash Flows Data: |
|
|
|
|
|
|
|
|
Total net cash (used in) provided by: |
|
|
|
|
|
|
|
|
Operating activities |
|
$ |
(15,321,430) |
|
$ |
(9,351,477) |
|
|
Investing activities |
|
|
(78,207) |
|
|
(28,535) |
|
|
Financing activities |
|
|
54,613,045 |
|
|
— |
|
|
Net increase (decrease) in cash and cash equivalents |
|
$ |
39,213,408 |
|
$ |
(9,380,012) |
|
Operating Activities
For the six months ended June 30, 2017, cash used in operating activities was $15.3 million compared to $9.4 million for the six months ended June 30, 2016. The increase from the comparable 2016 period was primarily the result of increased research and development activities related to the non-clinical studies and clinical trials of ZYN002 and ZYN001, as well as an increase in the number of employees hired to support our research and development and general and administrative activities, and an increase in receivables, related to an incentive associated with research and development costs in Australia and the expected refund of GST incurred with Australian vendors.
We expect cash used in operating activities to continue to increase throughout the remainder 2017 as compared to 2016 due to an expected increase in our operating losses associated with ongoing development of our product candidates.
Investing Activities
For the six months ended June 30, 2017 and 2016 cash used in investing activities primarily represented the cost of computer equipment and furniture and fixtures associated with our corporate headquarters.
Financing Activities
Cash provided by financing activities for the six months ended June 30, 2017 primarily consisted of $54.2 million in proceeds from sales of our shares of common stock under a follow-on public offering, net of related offering costs and $0.4 million in proceeds from the exercise of employee stock options.
Contractual Obligations
Our material contractual obligations consist of commitments under operating lease agreements and the related amounts of our obligations as of December 31, 2016 were disclosed in “Contractual Obligations” in Part I, Item 7 in our 2016 Annual Report. Since December 31, 2016, no material changes in our contractual obligations have occurred.
Off-Balance Sheet Arrangements
We do not have any off-balance sheet arrangements, except for operating leases, or relationships with unconsolidated
20
entities or financial partnerships, such as entities often referred to as structured finance or special purpose entities.
Recent Accounting Pronouncements
In February 2016, the Financial Accounting Standards Board, or FASB, issued Accounting Standards Update, or ASU, No. 2016-02, Leases, which requires that lease arrangements longer than 12 months result in an entity recognizing an asset and liability. The pronouncement is effective for interim and annual periods beginning after December 15, 2018 with early adoption permitted. The adoption of this guidance is not expected to have a material impact on our consolidated financial statements.
In March 2016, the FASB issued ASU No. 2016-09, Improvements to Employee Share-Based Payment Accounting, which is intended to simplify the accounting and reporting for employee share-based payment transactions. The pronouncement is effective for interim and annual periods beginning after December 31, 2016. Our adoption of the guidance in ASU No. 2016-09 in the first quarter of 2017 did not have a material impact on our consolidated financial statements.
In August 2016, the FASB issued ASU No. 2016-15, Classification of Certain Cash Receipts and Cash Payments, which provides specific guidance related to eight cash flow classification issues. The pronouncement is effective for interim and annual periods beginning after December 15, 2017 with early adoption permitted. The adoption of this guidance is not expected to have a material impact on our consolidated financial statements.
In November 2016, the FASB issued ASU No. 2016-18, Restricted Cash, which requires changes in restricted cash and restricted cash equivalents to be explained on the statement of cash flows by including restricted cash and restricted cash equivalents in the beginning-of-period and end-of-period total cash and cash equivalents shown on the statement of cash flows. The pronouncement is effective for interim and annual periods beginning after December 15, 2017 with early adoption permitted. The adoption of this guidance is not expected to have a material impact on our consolidated financial statements.
JOBS Act
We are an “emerging growth company” as defined under the Jumpstart Our Business Startups Act of 2012, or JOBS Act. The JOBS Act contains provisions that, among other things, reduce certain reporting requirements for an "emerging growth company." As an "emerging growth company," we have elected not to take advantage of the extended transition period afforded by the JOBS Act for the implementation of new or revised accounting standards, and as a result, we will comply with new or revised accounting standards on the relevant dates on which adoption of such standards is required for non-emerging growth companies. Section 107 of the JOBS Act provides that our decision not to take advantage of the extended transition period is irrevocable.
Subject to certain conditions set forth in the JOBS Act, as an "emerging growth company," we are not required to, among other things, (i) provide an auditor's attestation report on our system of internal controls over financial reporting pursuant to Section 404, (ii) provide all of the compensation disclosure that may be required of non-emerging growth public companies under the Dodd-Frank Wall Street Reform and Consumer Protection Act, (iii) comply with any requirement that may be adopted by the Public Company Accounting Oversight Board regarding mandatory audit firm rotation or a supplement to the auditor's report providing additional information about the audit and the financial statements (auditor discussion and analysis), and (iv) disclose certain executive compensation-related items such as the correlation between executive compensation and performance and comparisons of the chief executive officer’s compensation to median employee compensation. These exemptions will apply until December 31, 2020 or until we no longer meet the requirements for being and “emerging growth company,” whichever occurs first.
Item 3. Quantitative and Qualitative Disclosures About Market Risk
We are exposed to various market risks, which may result in potential losses arising from adverse changes in market rates, such as interest rates and foreign exchange rates. We do not enter into derivative instruments or other financial instruments for trading or speculative purposes nor do we engage in any hedging activities. As of June 30, 2017, we had cash and cash equivalents of $70.2 million consisting primarily of cash and money market account balances. Because of the short-term maturities of our cash and cash equivalents, we do not believe that an immediate 10% increase in interest rates would have any significant impact on the realized value of our investments. Accordingly, we do not believe we are
21
exposed to material market risk with respect to our cash and cash equivalents.
We have engaged third parties to manufacture our product candidates in Canada and Europe and to conduct clinical trials for our product candidates in Australia. Manufacturing and research costs related to these operations are paid for in a combination of U.S. dollars and local currencies, limiting our foreign currency exchange rate risk. Accordingly, we do not believe our foreign currency exchange rate risk is a significant risk; however, if we conduct additional clinical trials and seek to manufacture a more significant portion of our product candidates outside of the United States in the future, we could incur significant foreign currency exchange rate risk.
Item 4. Controls and Procedures.
Evaluation of Disclosure Controls and Procedures
Our management, with the participation of our Chief Executive Officer and Chief Financial Officer, evaluated the effectiveness of our disclosure controls and procedures as of June 30, 2017. The term “disclosure controls and procedures,” as defined in Rules 13a-15(e) and 15d-15(e) under the Securities Exchange Act of 1934, as amended, or the Exchange Act, means controls and other procedures of a company that are designed to ensure that information required to be disclosed by a company in the reports that it files or submits under the Exchange Act is recorded, processed, summarized and reported, within the time periods specified in the rules and forms, promulgated by the Securities and Exchange Commission. Management recognizes that any controls and procedures, no matter how well designed and operated, can provide only reasonable assurance of achieving their objectives and management necessarily applies its judgment in evaluating the cost-benefit relationship of possible controls and procedures. Based on the evaluation of the effectiveness of the design and operation of our disclosure controls and procedures as of June 30, 2017, our Chief Executive Officer and Chief Financial Officer concluded that, as of such date, our disclosure controls and procedures were effective at the reasonable assurance level.
Changes in Internal Control Over Financial Reporting
There were no changes in our internal control over financial reporting (as defined in Rules 13a-15(f) and 15(d)-15(f) under the Exchange Act) that occurred during the six months ended June 30, 2017 that have materially affected, or are reasonably likely to materially affect, our internal control over financial reporting.
We are not currently a party to any legal proceedings.
You should carefully consider the risk factors described in our 2016 Annual Report, under the caption “Item 1.A “Risk Factors”. There have been no material changes to the risk factors disclosed in our 2016 Annual Report.
Item 2. Unregistered Sales of Equity Securities and Use of Proceeds.
Recent Sales of Unregistered Securities
None.
Use of Proceeds
Our IPO was effected through a Registration Statement on Form S-1 (File No. 333-205355) that was declared effective by the SEC on August 4, 2015, which registered an aggregate of 3,450,000 shares of our common stock. On August 10, 2015, we received net proceeds from the IPO of $42.1 million.
22
As of June 30, 2017, we have used approximately $36.6 million of the net offering proceeds from our IPO to fund the development efforts of ZYN002 (including funding of our Phase 1 and Phase 2 clinical trials), development efforts of ZYN001, working capital, research and development and general corporate purposes. None of the net proceeds have been paid directly or indirectly to (i) our directors, officers or any of their associates; (ii) persons owning 10% or more of our common stock; or (iii) our affiliates, other than payments in the ordinary course of business to our wholly-owned subsidiary, to officers for salaries and bonuses and to non-employee directors as compensation for board service.
Our use of the net proceeds to date is consistent with the use of proceeds described in our prospectus filed with the SEC pursuant to Rule 424(b)(4) on August 5, 2015, or the Prospectus, and there has been no material change in our planned use of the balance of the net proceeds from the IPO described in the Prospectus.
Purchase of Equity Securities
We did not purchase any of our registered equity securities during the period covered by this Quarterly Report on Form 10-Q.
Item 3. Defaults Upon Senior Securities.
None.
Item 4. Mine Safety Disclosures.
None.
Not applicable
The exhibits filed as part of this Quarterly Report on Form 10-Q are set forth on the Exhibit Index, which Exhibit Index is incorporated herein by reference.
Pursuant to the requirements of the Securities Exchange Act of 1934, the registrant has duly caused this report to be signed on its behalf by the undersigned thereunto duly authorized.
|
|
ZYNERBA PHARMACEUTICALS, INC. |
|
|
|
|
|
|
Date: August 1, 2017 |
By: |
/s/ ARMANDO ANIDO |
|
|
|
Armando Anido |
|
|
|
Chief Executive Officer |
|
|
|
(Principal executive officer) |
|
|
|
|
|
Date: August 1, 2017 |
By: |
/s/ JAMES E. FICKENSCHER |
|
|
|
James E. Fickenscher |
|
|
|
Chief Financial Officer |
|
|
|
(Principal financial and accounting officer) |
23
EXHIBIT INDEX
|
10.1
|
|
|
| 10.2 |
|
|
|
31.1
|
|
|
|
31.2
|
|
|
|
32.1
|
|
|
|
32.2
|
|
|
|
101 INS |
|
XBRL Instance Document (filed herewith). |
|
101 SCH |
|
XBRL Taxonomy Extension Schema Document (filed herewith). |
|
101 CAL |
|
XBRL Taxonomy Extension Calculation Linkbase Document (filed herewith). |
|
101 DEF |
|
XBRL Taxonomy Extension Definition Linkbase Document (filed herewith). |
|
101 LAB |
|
XBRL Taxonomy Extension Label Linkbase Document (filed herewith). |
|
101 PRE |
|
XBRL Taxonomy Extension Presentation Linkbase Document (filed herewith). |
|
|
|
|
|
* |
|
Indicates management contract or compensatory plan or arrangement. |
24