Attached files
| file | filename |
|---|---|
| EX-99.1 - EXHIBIT 99.1 - Rexford Industrial Realty, Inc. | rexrex991q217.htm |
| 8-K - 8-K - Rexford Industrial Realty, Inc. | rexr8-kq217earningsrelease.htm |
Exhibit 99.2
Table of Contents. | ||
Section | Page |
Corporate Data: | |
Investor Company Summary | 3 |
Financial and Portfolio Highlights and Common Stock Data | 4 |
Consolidated Financial Results: | |
Consolidated Balance Sheets | 5 |
Consolidated Statements of Operations | 6-7 |
Non-GAAP FFO, Core FFO and AFFO Reconciliations | 8-9 |
Statement of Operations Reconciliations | 10 |
Same Property Portfolio Performance | 11 |
Capitalization Summary | 12 |
Debt Summary | 13 |
Portfolio Data: | |
Portfolio Overview | 14 |
Occupancy and Leasing Trends | 15 |
Leasing Statistics | 16-17 |
Top Tenants and Lease Segmentation | 18 |
Capital Expenditure Summary | 19 |
Properties and Space Under Repositioning | 20-21 |
Current Year Acquisitions and Dispositions Summary | 22 |
Guidance | 23 |
Net Asset Value Components | 24 |
Notes and Definitions | 25-28 |
Disclosures:
Forward Looking Statements: This supplemental package contains “forward-looking statements” within the meaning of the Private Securities Litigation Reform Act of 1995. We caution investors that any forward-looking statements presented herein are based on management’s beliefs and assumptions and information currently available to management. Such statements are subject to risks, uncertainties and assumptions and may be affected by known and unknown risks, trends, uncertainties and factors that are beyond our control. Should one or more of these risks or uncertainties materialize, or should underlying assumptions prove incorrect, actual results may vary materially from those anticipated, estimated or projected. These risks and uncertainties include, without limitation: general risks affecting the real estate industry (including, without limitation, the market value of our properties, the inability to enter into or renew leases at favorable rates, dependence on tenants’ financial condition, and competition from other developers, owners and operators of real estate); risks associated with the disruption of credit markets or a global economic slowdown; risks associated with the potential loss of key personnel (most importantly, members of senior management); risks associated with our failure to maintain our status as a Real Estate Investment Trust under the Internal Revenue Code of 1986, as amended; possible adverse changes in tax and environmental laws; litigation, including costs associated with prosecuting or defending pending or threatened claims and any adverse outcomes, and potential liability for uninsured losses and environmental contamination.
For a further discussion of these and other factors that could cause our future results to differ materially from any forward-looking statements, see Item 1A. Risk Factors in our 2016 Annual Report on Form 10-K, which was filed with the Securities and Exchange Commission (“SEC”) on February 23, 2017. We disclaim any obligation to publicly update or revise any forward-looking statement to reflect changes in underlying assumptions or factors, of new information, data or methods, future events or other changes.
Second Quarter 2017 Supplemental Financial Reporting Package | Page 2 |  | |
Investor Company Summary. | ||
Executive Management Team | ||
Howard Schwimmer | Co-Chief Executive Officer, Director | |
Michael S. Frankel | Co-Chief Executive Officer, Director | |
Adeel Khan | Chief Financial Officer | |
David Lanzer | General Counsel and Corporate Secretary | |
Board of Directors | ||
Richard Ziman | Chairman | |
Howard Schwimmer | Co-Chief Executive Officer, Director | |
Michael S. Frankel | Co-Chief Executive Officer, Director | |
Robert L. Antin | Director | |
Steven C. Good | Director | |
Peter Schwab | Director | |
Tyler H. Rose | Director | |
Investor Relations Information | ||
ICR | ||
Stephen Swett | ||
www.icrinc.com | ||
212-849-3882 | ||
Equity Research Coverage | ||||
Bank of America Merrill Lynch | James Feldman | (646) 855-5808 | ||
Capital One | Chris Lucas | (571) 633-8151 | ||
Citigroup Investment Research | Emmanuel Korchman | (212) 816-1382 | ||
D.A Davidson | Barry Oxford | (212) 240-9871 | ||
J.P. Morgan | Michael W. Mueller, CFA | (212) 622-6689 | ||
Jefferies LLC | Jonathan Petersen | (212) 284-1705 | ||
National Securities Corporation | John R. Benda | (212) 417-8127 | ||
Stifel Nicolaus & Co. | John W. Guinee | (443) 224-1307 | ||
Wells Fargo Securities | Blaine Heck | (443) 263-6529 | ||
FBR & Co. | Craig Kucera | (540) 277-3366 | ||
Disclaimer: This list may not be complete and is subject to change as firms add or delete coverage of our company. Please note that any opinions, estimates, forecasts or predictions regarding our historical or predicted performance made by these analysts are theirs alone and do not represent opinions, estimates, forecasts or predictions of Rexford Industrial Realty, Inc. or its management. We are providing this listing as a service to our stockholders and do not by listing these firms imply our endorsement of, or concurrence with, such information, conclusions or recommendations. Interested persons may obtain copies of analysts’ reports on their own; we do not distribute these reports.
Second Quarter 2017 Supplemental Financial Reporting Package | Page 3 | | |
Financial and Portfolio Highlights and Common Stock Data. (1) | ||
(in thousands except share and per share data and portfolio statistics) | ||
Three Months Ended | |||||||||||||||||||
June 30, 2017 | March 31, 2017 | December 31, 2016 | September 30, 2016 | June 30, 2016 | |||||||||||||||
Financial Results: | |||||||||||||||||||
Total rental revenues | $ | 36,419 | $ | 35,001 | $ | 34,449 | $ | 32,944 | $ | 30,497 | |||||||||
Net income | $ | 19,855 | $ | 5,721 | $ | 8,546 | $ | 3,061 | $ | 12,792 | |||||||||
Net Operating Income (NOI) | $ | 26,883 | $ | 25,779 | $ | 25,310 | $ | 23,966 | $ | 22,538 | |||||||||
Company share of Core FFO | $ | 15,893 | $ | 15,104 | $ | 15,048 | $ | 14,240 | $ | 13,920 | |||||||||
Core FFO per common share - diluted | $ | 0.23 | $ | 0.23 | $ | 0.23 | $ | 0.22 | $ | 0.22 | |||||||||
Company share of FFO | $ | 15,873 | $ | 14,733 | $ | 15,071 | $ | 13,874 | $ | 13,309 | |||||||||
FFO per common share - diluted | $ | 0.23 | $ | 0.22 | $ | 0.23 | $ | 0.21 | $ | 0.21 | |||||||||
Adjusted EBITDA | $ | 25,360 | $ | 22,292 | $ | 22,388 | $ | 20,622 | $ | 19,679 | |||||||||
Dividend declared per common share | $ | 0.145 | $ | 0.145 | $ | 0.135 | $ | 0.135 | $ | 0.135 | |||||||||
Portfolio Statistics: | |||||||||||||||||||
Portfolio SF - consolidated | 16,221,646 | 15,069,122 | 15,020,336 | 14,588,101 | 13,640,820 | ||||||||||||||
Ending occupancy - consolidated portfolio | 91.4 | % | 88.9 | % | 91.7 | % | 89.7 | % | 90.1 | % | |||||||||
Stabilized occupancy - consolidated portfolio | 96.5 | % | 96.4 | % | 96.8 | % | 95.8 | % | 96.5 | % | |||||||||
Leasing spreads - GAAP | 20.4 | % | 23.3 | % | 16.1 | % | 15.6 | % | 23.5 | % | |||||||||
Leasing spreads - cash | 10.6 | % | 13.7 | % | 5.9 | % | 7.0 | % | 11.0 | % | |||||||||
Same Property Performance: | |||||||||||||||||||
Same Property Portfolio SF | 11,211,536 | 11,211,536 | 11,211,536 | 11,211,536 | 11,211,536 | ||||||||||||||
Same Property Portfolio ending occupancy | 93.5 | % | 93.1 | % | 94.9 | % | 93.0 | % | 91.5 | % | |||||||||
Stabilized Same Property Portfolio ending occupancy | 96.0 | % | 96.0 | % | 96.9 | % | 96.5 | % | 96.0 | % | |||||||||
NOI growth(2) | 6.6 | % | 8.3 | % | n/a | n/a | n/a | ||||||||||||
Cash NOI growth(2) | 5.1 | % | 10.1 | % | n/a | n/a | n/a | ||||||||||||
Capitalization: | |||||||||||||||||||
Common stock price at quarter end | $ | 27.44 | $ | 22.52 | $ | 23.19 | $ | 22.89 | $ | 21.09 | |||||||||
Common shares issued and outstanding | 70,810,523 | 66,375,624 | 66,166,548 | 65,725,504 | 65,679,483 | ||||||||||||||
Total shares and units issued and outstanding at period end (3) | 72,785,007 | 68,365,436 | 68,175,212 | 67,704,346 | 67,679,046 | ||||||||||||||
Weighted average shares outstanding - diluted | 68,331,234 | 66,626,239 | 66,079,935 | 67,985,177 | 64,304,713 | ||||||||||||||
5.875% Series A Cumulative Redeemable Preferred Stock | 90,000 | 90,000 | 90,000 | 90,000 | — | ||||||||||||||
Total equity market capitalization | $ | 2,087,221 | $ | 1,629,590 | $ | 1,670,983 | $ | 1,639,752 | $ | 1,427,351 | |||||||||
Total consolidated debt | $ | 564,242 | $ | 512,504 | $ | 502,476 | $ | 502,776 | $ | 503,009 | |||||||||
Total combined market capitalization (net debt plus equity) | $ | 2,638,345 | $ | 2,130,418 | $ | 2,157,934 | $ | 2,087,265 | $ | 1,901,183 | |||||||||
Ratios: | |||||||||||||||||||
Net debt to total combined market capitalization | 20.9 | % | 23.5 | % | 22.6 | % | 21.4 | % | 24.9 | % | |||||||||
Net debt to Adjusted EBITDA (quarterly results annualized) | 5.4x | 5.6x | 5.4x | 5.4x | 6.0x | ||||||||||||||
(1) | For definition/discussion of non-GAAP financial measures and reconciliations to their nearest GAAP equivalents, see the definitions section and reconciliation section beginning on page 25 and page 8 of this report, respectively. |
(2) | Represents the year over year percentage change in NOI and Cash NOI for the Same Property Portfolio. For comparability, NOI growth and Cash NOI growth for Q1’17 has been restated to remove the results of 2535 Midway Drive, which was sold during Q2’17. See page 22 for a list of dispositions completed during 2017. |
(3) | Includes the following number of OP Units held by noncontrolling interests: 1,932,816 (Jun 30, 2017), 1,948,144 (Mar 31, 2017), 1,966,996 (Dec 31, 2016), 1,978,842 (Sep 30, 2016) and 1,999,563 (Jun 30, 2016). Excludes the following number of shares of unvested restricted stock: 312,379 (Jun 30, 2017), 333,128 (Mar 31, 2017), 287,827 (Dec 31, 2016), 322,837 (Sep 30, 2016) and 356,249 (Jun 30, 2016). Current period excludes 241,691 unvested LTIP units and 514,998 unvested performance units granted during Q4-15 and Q4-16. |
Second Quarter 2017 Supplemental Financial Reporting Package | Page 4 | | |
Consolidated Balance Sheets. | ||
(unaudited and in thousands) | ||
June 30, 2017 | March 31, 2017 | December 31, 2016 | September 30, 2016 | June 30, 2016 | |||||||||||||||
Assets | |||||||||||||||||||
Land | $ | 763,622 | $ | 692,731 | $ | 683,919 | $ | 659,641 | $ | 605,694 | |||||||||
Buildings and improvements | 923,760 | 816,912 | 811,614 | 778,066 | 745,968 | ||||||||||||||
Tenant improvements | 43,717 | 39,595 | 38,644 | 36,687 | 33,873 | ||||||||||||||
Furniture, fixtures, and equipment | 167 | 167 | 174 | 175 | 175 | ||||||||||||||
Construction in progress | 25,792 | 21,792 | 17,778 | 23,300 | 23,714 | ||||||||||||||
Total real estate held for investment | 1,757,058 | 1,571,197 | 1,552,129 | 1,497,869 | 1,409,424 | ||||||||||||||
Accumulated depreciation | (153,163 | ) | (143,199 | ) | (135,140 | ) | (126,601 | ) | (117,590 | ) | |||||||||
Investments in real estate, net | 1,603,895 | 1,427,998 | 1,416,989 | 1,371,268 | 1,291,834 | ||||||||||||||
Cash and cash equivalents | 13,118 | 11,676 | 15,525 | 55,263 | 29,177 | ||||||||||||||
Restricted cash | — | 6,537 | — | — | 17,979 | ||||||||||||||
Notes receivable | — | 6,090 | 5,934 | 5,817 | — | ||||||||||||||
Rents and other receivables, net | 2,644 | 2,921 | 2,749 | 2,633 | 3,010 | ||||||||||||||
Deferred rent receivable | 13,628 | 12,793 | 11,873 | 10,913 | 9,585 | ||||||||||||||
Deferred leasing costs, net | 9,448 | 9,279 | 8,672 | 8,064 | 6,531 | ||||||||||||||
Deferred loan costs, net | 2,239 | 2,352 | 847 | 996 | 1,146 | ||||||||||||||
Acquired lease intangible assets, net(1) | 41,087 | 33,050 | 36,365 | 38,093 | 37,789 | ||||||||||||||
Indefinite-lived intangible | 5,156 | 5,156 | 5,170 | 5,215 | 5,271 | ||||||||||||||
Interest rate swap asset | 4,399 | 5,657 | 5,594 | — | — | ||||||||||||||
Other assets | 7,388 | 5,944 | 5,290 | 5,522 | 5,589 | ||||||||||||||
Acquisition related deposits | 2,250 | 500 | — | 400 | 400 | ||||||||||||||
Investment in unconsolidated real estate entities | — | — | — | — | 4,203 | ||||||||||||||
Total Assets | $ | 1,705,252 | $ | 1,529,953 | $ | 1,515,008 | $ | 1,504,184 | $ | 1,412,514 | |||||||||
Liabilities | |||||||||||||||||||
Notes payable | $ | 561,530 | $ | 509,693 | $ | 500,184 | $ | 500,428 | $ | 500,608 | |||||||||
Interest rate swap liability | 1,094 | 1,356 | 2,045 | 5,938 | 7,551 | ||||||||||||||
Accounts payable and accrued expenses | 14,298 | 18,005 | 13,585 | 18,433 | 10,877 | ||||||||||||||
Dividends and distributions payable | 10,642 | 10,008 | 9,282 | 9,214 | 9,212 | ||||||||||||||
Acquired lease intangible liabilities, net(2) | 10,785 | 8,653 | 9,130 | 5,722 | 4,346 | ||||||||||||||
Tenant security deposits | 16,721 | 15,311 | 15,187 | 14,946 | 13,769 | ||||||||||||||
Prepaid rents | 5,204 | 4,785 | 3,455 | 3,945 | 3,367 | ||||||||||||||
Total Liabilities | 620,274 | 567,811 | 552,868 | 558,626 | 549,730 | ||||||||||||||
Equity | |||||||||||||||||||
Preferred stock, net ($90,000 liquidation preference) | 86,651 | 86,651 | 86,651 | 86,664 | — | ||||||||||||||
Common stock | 708 | 664 | 662 | 658 | 657 | ||||||||||||||
Additional paid in capital | 1,027,282 | 912,047 | 907,834 | 898,354 | 897,991 | ||||||||||||||
Cumulative distributions in excess of earnings | (56,992 | ) | (64,682 | ) | (59,277 | ) | (56,651 | ) | (50,733 | ) | |||||||||
Accumulated other comprehensive income (loss) | 3,216 | 4,176 | 3,445 | (5,764 | ) | (7,328 | ) | ||||||||||||
Total stockholders’ equity | 1,060,865 | 938,856 | 939,315 | 923,261 | 840,587 | ||||||||||||||
Noncontrolling interests | 24,113 | 23,286 | 22,825 | 22,297 | 22,197 | ||||||||||||||
Total Equity | 1,084,978 | 962,142 | 962,140 | 945,558 | 862,784 | ||||||||||||||
Total Liabilities and Equity | $ | 1,705,252 | $ | 1,529,953 | $ | 1,515,008 | $ | 1,504,184 | $ | 1,412,514 | |||||||||
(1) | Includes net above-market tenant lease intangibles of $5,640 (June 30, 2017), $5,420 (March 31, 2017), $5,779 (December 31, 2016), $6,204 (September 30, 2016) and $6,348 (June 30, 2016). |
(2) | Includes net below-market tenant lease intangibles of $10,102 (June 30, 2017), $8,479 (March 31, 2017), 8,949 (December 31, 2016), $5,533 (September 30, 2016) and $4,149 (June 30, 2016). |
Second Quarter 2017 Supplemental Financial Reporting Package | Page 5 | | |
Consolidated Statements of Operations. | ||
Quarterly Results | (unaudited and in thousands, except share and per share data) | |
Three Months Ended | |||||||||||||||||||
June 30, 2017 | March 31, 2017 | December 31, 2016 | September 30, 2016 | June 30, 2016 | |||||||||||||||
Revenues | |||||||||||||||||||
Rental income | $ | 31,132 | $ | 29,614 | $ | 29,691 | $ | 28,285 | $ | 26,119 | |||||||||
Tenant reimbursements | 5,172 | 5,155 | 4,579 | 4,467 | 4,119 | ||||||||||||||
Other income | 115 | 232 | 179 | 192 | 259 | ||||||||||||||
Total Rental Revenues | 36,419 | 35,001 | 34,449 | 32,944 | 30,497 | ||||||||||||||
Management, leasing, and development services | 145 | 126 | 97 | 131 | 111 | ||||||||||||||
Interest income | 218 | 227 | 231 | 228 | — | ||||||||||||||
Total Revenues | 36,782 | 35,354 | 34,777 | 33,303 | 30,608 | ||||||||||||||
Operating Expenses | |||||||||||||||||||
Property expenses | 9,536 | 9,222 | 9,139 | 8,978 | 7,959 | ||||||||||||||
General and administrative | 5,123 | 5,086 | 4,225 | 5,067 | 4,521 | ||||||||||||||
Depreciation and amortization | 14,515 | 13,599 | 14,242 | 13,341 | 12,610 | ||||||||||||||
Total Operating Expenses | 29,174 | 27,907 | 27,606 | 27,386 | 25,090 | ||||||||||||||
Other Expenses | |||||||||||||||||||
Acquisition expenses | 20 | 385 | 365 | 380 | 635 | ||||||||||||||
Interest expense | 4,302 | 3,998 | 4,074 | 3,804 | 3,716 | ||||||||||||||
Total Other Expenses | 4,322 | 4,383 | 4,439 | 4,184 | 4,351 | ||||||||||||||
Total Expenses | 33,496 | 32,290 | 32,045 | 31,570 | 29,441 | ||||||||||||||
Equity in income from unconsolidated real estate entities | — | 11 | — | 1,328 | 62 | ||||||||||||||
Loss on extinguishment of debt | — | (22 | ) | — | — | — | |||||||||||||
Gains on sale of real estate | 16,569 | 2,668 | 5,814 | — | 11,563 | ||||||||||||||
Net Income | 19,855 | 5,721 | 8,546 | 3,061 | 12,792 | ||||||||||||||
Less: net income attributable to noncontrolling interest | (531 | ) | (132 | ) | (217 | ) | (63 | ) | (418 | ) | |||||||||
Net income attributable to Rexford Industrial Realty, Inc. | 19,324 | 5,589 | 8,329 | 2,998 | 12,374 | ||||||||||||||
Less: preferred stock dividends | (1,322 | ) | (1,322 | ) | (1,322 | ) | (661 | ) | — | ||||||||||
Less: earnings allocated to participating securities | (156 | ) | (91 | ) | (79 | ) | (70 | ) | (75 | ) | |||||||||
Net income attributable to common stockholders | $ | 17,846 | $ | 4,176 | $ | 6,928 | $ | 2,267 | $ | 12,299 | |||||||||
Earnings per Common Share | |||||||||||||||||||
Net income attributable to common stockholders per share - basic | $ | 0.26 | $ | 0.06 | $ | 0.11 | $ | 0.03 | $ | 0.19 | |||||||||
Net income attributable to common stockholders per share - diluted | $ | 0.26 | $ | 0.06 | $ | 0.10 | $ | 0.03 | $ | 0.19 | |||||||||
Weighted average shares outstanding - basic | 67,920,773 | 66,341,138 | 65,785,226 | 65,707,476 | 64,063,337 | ||||||||||||||
Weighted average shares outstanding - diluted | 68,331,234 | 66,626,239 | 66,079,935 | 67,985,177 | 64,304,713 | ||||||||||||||
Second Quarter 2017 Supplemental Financial Reporting Package | Page 6 | | |
Consolidated Statements of Operations. | ||
Quarterly Results | (unaudited and in thousands) | |
Three Months Ended June 30, | Six months ended June 30, | ||||||||||||||
2017 | 2016 | 2017 | 2016 | ||||||||||||
Rental Revenues | |||||||||||||||
Rental income | $ | 31,132 | $ | 26,119 | $ | 60,746 | $ | 49,618 | |||||||
Tenant reimbursements | 5,172 | 4,119 | 10,327 | 7,677 | |||||||||||
Other income | 115 | 259 | 347 | 572 | |||||||||||
Total Rental Revenues | 36,419 | 30,497 | 71,420 | 57,867 | |||||||||||
Management, leasing, and development services | 145 | 111 | 271 | 245 | |||||||||||
Interest income | 218 | — | 445 | — | |||||||||||
Total Revenues | 36,782 | 30,608 | 72,136 | 58,112 | |||||||||||
Operating Expenses | |||||||||||||||
Property expenses | 9,536 | 7,959 | 18,758 | 15,502 | |||||||||||
General and administrative | 5,123 | 4,521 | 10,209 | 8,123 | |||||||||||
Depreciation and amortization | 14,515 | 12,610 | 28,114 | 23,824 | |||||||||||
Total Operating Expenses | 29,174 | 25,090 | 57,081 | 47,449 | |||||||||||
Other Expenses | |||||||||||||||
Acquisition expenses | 20 | 635 | 405 | 1,110 | |||||||||||
Interest expense | 4,302 | 3,716 | 8,300 | 6,970 | |||||||||||
Total Other Expenses | 4,322 | 4,351 | 8,705 | 8,080 | |||||||||||
Total Expenses | 33,496 | 29,441 | 65,786 | 55,529 | |||||||||||
Equity in income from unconsolidated real estate entities | — | 62 | 11 | 123 | |||||||||||
Loss on extinguishment of debt | — | — | (22 | ) | — | ||||||||||
Gains on sale of real estate | 16,569 | 11,563 | 19,237 | 11,563 | |||||||||||
Net Income | 19,855 | 12,792 | 25,576 | 14,269 | |||||||||||
Less: net income attributable to noncontrolling interest | (531 | ) | (418 | ) | (663 | ) | (470 | ) | |||||||
Net income attributable to Rexford Industrial Realty, Inc. | 19,324 | 12,374 | 24,913 | 13,799 | |||||||||||
Less: preferred stock dividends | (1,322 | ) | — | (2,644 | ) | — | |||||||||
Less: earnings allocated to participating securities | (156 | ) | (75 | ) | (247 | ) | (153 | ) | |||||||
Net income attributable to common stockholders | $ | 17,846 | $ | 12,299 | $ | 22,022 | $ | 13,646 | |||||||
Second Quarter 2017 Supplemental Financial Reporting Package | Page 7 | | |
Non-GAAP FFO and Core FFO Reconciliations. (1) | ||
(unaudited and in thousands, except share and per share data) | ||
Three Months Ended | |||||||||||||||||||
June 30, 2017 | March 31, 2017 | December 31, 2016 | September 30, 2016 | June 30, 2016 | |||||||||||||||
Net Income | $ | 19,855 | $ | 5,721 | $ | 8,546 | $ | 3,061 | $ | 12,792 | |||||||||
Add: | |||||||||||||||||||
Depreciation and amortization | 14,515 | 13,599 | 14,242 | 13,341 | 12,610 | ||||||||||||||
Depreciation and amortization from unconsolidated joint ventures | — | — | — | — | 5 | ||||||||||||||
Deduct: | |||||||||||||||||||
Gains on sale of real estate | 16,569 | 2,668 | 5,814 | — | 11,563 | ||||||||||||||
Gain on acquisition of unconsolidated joint venture property | — | 11 | — | 1,332 | — | ||||||||||||||
Funds From Operations (FFO) | 17,801 | 16,641 | 16,974 | 15,070 | 13,844 | ||||||||||||||
Less: preferred stock dividends | (1,322 | ) | (1,322 | ) | (1,322 | ) | (661 | ) | — | ||||||||||
Less: FFO attributable to noncontrolling interests(2) | (468 | ) | (449 | ) | (457 | ) | (424 | ) | (421 | ) | |||||||||
Less: FFO attributable to participating securities(3) | (138 | ) | (137 | ) | (124 | ) | (111 | ) | (114 | ) | |||||||||
Company share of FFO | $ | 15,873 | $ | 14,733 | $ | 15,071 | $ | 13,874 | $ | 13,309 | |||||||||
FFO per common share‐basic | $ | 0.23 | $ | 0.22 | $ | 0.23 | $ | 0.21 | $ | 0.21 | |||||||||
FFO per common share‐diluted | $ | 0.23 | $ | 0.22 | $ | 0.23 | $ | 0.21 | $ | 0.21 | |||||||||
FFO | $ | 17,801 | $ | 16,641 | $ | 16,974 | $ | 15,070 | $ | 13,844 | |||||||||
Adjust: | |||||||||||||||||||
Legal fee reimbursements(4) | — | — | (389 | ) | — | — | |||||||||||||
Acquisition expenses | 20 | 385 | 365 | 380 | 635 | ||||||||||||||
Core FFO | 17,821 | 17,026 | 16,950 | 15,450 | 14,479 | ||||||||||||||
Less: preferred stock dividends | (1,322 | ) | (1,322 | ) | (1,322 | ) | (661 | ) | — | ||||||||||
Less: Core FFO attributable to noncontrolling interests(2) | (468 | ) | (460 | ) | (456 | ) | (435 | ) | (440 | ) | |||||||||
Less: Core FFO attributable to participating securities(3) | (138 | ) | (140 | ) | (124 | ) | (114 | ) | (119 | ) | |||||||||
Company share of Core FFO | $ | 15,893 | $ | 15,104 | $ | 15,048 | $ | 14,240 | $ | 13,920 | |||||||||
Core FFO per common share‐basic | $ | 0.23 | $ | 0.23 | $ | 0.23 | $ | 0.22 | $ | 0.22 | |||||||||
Core FFO per common share‐diluted | $ | 0.23 | $ | 0.23 | $ | 0.23 | $ | 0.22 | $ | 0.22 | |||||||||
Weighted-average shares outstanding-basic | 67,920,773 | 66,341,138 | 65,785,226 | 65,707,476 | 64,063,337 | ||||||||||||||
Weighted-average shares outstanding-diluted(5) | 68,331,234 | 66,626,239 | 66,079,935 | 65,994,173 | 64,304,713 | ||||||||||||||
(1) | For a definition and discussion of non-GAAP financial measures, see the definitions section beginning on page 25 of this report. |
(2) | Noncontrolling interests represent holders of outstanding common units of the Company’s operating partnership that are owned by unit holders other than us. |
(3) | Participating securities include unvested shares of restricted stock, unvested LTIP units and unvested performance units. |
(4) | Legal fee reimbursements relate to prior litigation of the Company. For more information, see Item 3. Legal Proceedings in our 2014 Annual Report on Form 10-K. |
(5) | Weighted-average shares outstanding-diluted includes adjustments for unvested performance units and operating partnership units if their effect is dilutive for the reported period. |
Second Quarter 2017 Supplemental Financial Reporting Package | Page 8 | | |
Non-GAAP AFFO Reconciliation. (1) | ||
(unaudited and in thousands, except share and per share data) | ||
Three Months Ended | |||||||||||||||||||
June 30, 2017 | March 31, 2017 | December 31, 2016 | September 30, 2016 | June 30, 2016 | |||||||||||||||
Funds From Operations(2) | $ | 17,801 | $ | 16,641 | $ | 16,974 | $ | 15,070 | $ | 13,844 | |||||||||
Add: | |||||||||||||||||||
Amortization of deferred financing costs | 288 | 275 | 266 | 263 | 264 | ||||||||||||||
Net fair value lease revenue (expense) | (201 | ) | (117 | ) | (95 | ) | (39 | ) | 60 | ||||||||||
Non-cash stock compensation | 1,394 | 1,346 | 956 | 992 | 953 | ||||||||||||||
Straight line corporate office rent expense adjustment | (36 | ) | (36 | ) | (50 | ) | (12 | ) | (11 | ) | |||||||||
Loss on extinguishment of debt | — | 22 | — | — | — | ||||||||||||||
Deduct: | |||||||||||||||||||
Preferred stock dividends | 1,322 | 1,322 | 1,322 | 661 | — | ||||||||||||||
Straight line rental revenue adjustment(3) | 996 | 956 | 1,095 | 1,395 | 922 | ||||||||||||||
Capitalized payments(4) | 1,021 | 976 | 726 | 833 | 735 | ||||||||||||||
Note payable premium amortization | 36 | 58 | 60 | 60 | 59 | ||||||||||||||
Recurring capital expenditures(5) | 857 | 390 | 667 | 691 | 848 | ||||||||||||||
2nd generation tenant improvements and leasing commissions(6) | 1,621 | 1,545 | 1,311 | 1,988 | 1,483 | ||||||||||||||
Unconsolidated joint venture AFFO adjustments | — | — | — | 2 | 9 | ||||||||||||||
Adjusted Funds From Operations (AFFO) | $ | 13,393 | $ | 12,884 | $ | 12,870 | $ | 10,644 | $ | 11,054 | |||||||||
(1) | For a definition and discussion of non-GAAP financial measures, see the definitions section beginning on page 25 of this report. |
(2) | A reconciliation of net income to Funds From Operations is set forth on page 8 of this report. |
(3) | The straight line rental revenue adjustment includes concessions of $851, $612, $873, $1,072, and $767 for the three months ended June 30, 2017, March 31, 2017, December 31, 2016, September 30, 2016 and June 30, 2016, respectively. |
(4) | Includes capitalized interest, and leasing and construction development compensation. |
(5) | Excludes nonrecurring capital expenditures of $8,282, $5,388, $4,494, $7,030, and $5,430 for the three months ended June 30, 2017, March 31, 2017, December 31, 2016, September 30, 2016 and June 30, 2016, respectively. |
(6) | Excludes 1st generation tenant improvements/space preparation and leasing commissions of $375, $569, $636, $1,407 and $1,064 for the three months ended June 30, 2017, March 31, 2017, December 31, 2016, September 30, 2016 and June 30, 2016, respectively. |
Second Quarter 2017 Supplemental Financial Reporting Package | Page 9 | | |
Statement of Operations Reconciliations - NOI, Cash NOI, EBITDA and Adjusted EBITDA. (1) | ||
(unaudited and in thousands) | ||
NOI and Cash NOI | ||||||||||||||||||||
Three Months Ended | ||||||||||||||||||||
June 30, 2017 | March 31, 2017 | December 31, 2016 | September 30, 2016 | June 30, 2016 | ||||||||||||||||
Rental income | $ | 31,132 | $ | 29,614 | $ | 29,691 | $ | 28,285 | $ | 26,119 | ||||||||||
Tenant reimbursements | 5,172 | 5,155 | 4,579 | 4,467 | 4,119 | |||||||||||||||
Other income | 115 | 232 | 179 | 192 | 259 | |||||||||||||||
Total Rental Revenues | 36,419 | 35,001 | 34,449 | 32,944 | 30,497 | |||||||||||||||
Property Expenses | 9,536 | 9,222 | 9,139 | 8,978 | 7,959 | |||||||||||||||
Net Operating Income (NOI) | $ | 26,883 | $ | 25,779 | $ | 25,310 | $ | 23,966 | $ | 22,538 | ||||||||||
Net fair value lease revenue (expense) | (201 | ) | (117 | ) | (95 | ) | (39 | ) | 60 | |||||||||||
Straight line rental revenue adjustment | (996 | ) | (956 | ) | (1,095 | ) | (1,395 | ) | (922 | ) | ||||||||||
Cash NOI | $ | 25,686 | $ | 24,706 | $ | 24,120 | $ | 22,532 | $ | 21,676 | ||||||||||
EBITDA and Adjusted EBITDA | |||||||||||||||||||
Three Months Ended | |||||||||||||||||||
June 30, 2017 | March 31, 2017 | December 31, 2016 | September 30, 2016 | June 30, 2016 | |||||||||||||||
Net income | $ | 19,855 | $ | 5,721 | $ | 8,546 | $ | 3,061 | $ | 12,792 | |||||||||
Interest expense | 4,302 | 3,998 | 4,074 | 3,804 | 3,716 | ||||||||||||||
Depreciation and amortization | 14,515 | 13,599 | 14,242 | 13,341 | 12,610 | ||||||||||||||
Proportionate share of real estate related depreciation and amortization from unconsolidated joint ventures | — | — | — | — | 5 | ||||||||||||||
EBITDA | $ | 38,672 | $ | 23,318 | $ | 26,862 | $ | 20,206 | $ | 29,123 | |||||||||
Stock-based compensation amortization | 1,394 | 1,346 | 956 | 992 | 953 | ||||||||||||||
Gains on sale of real estate | (16,569 | ) | (2,668 | ) | (5,814 | ) | — | (11,563 | ) | ||||||||||
Gain on sale of real estate from unconsolidated joint ventures | — | (11 | ) | — | (1,332 | ) | — | ||||||||||||
Loss on extinguishment of debt | — | 22 | — | — | — | ||||||||||||||
Legal fee reimbursements(2) | — | — | (389 | ) | — | — | |||||||||||||
Acquisition expenses | 20 | 385 | 365 | 380 | 635 | ||||||||||||||
Pro forma effect of acquisitions(3) | 2,000 | (15 | ) | 521 | 376 | 567 | |||||||||||||
Pro forma effect of dispositions(4) | (157 | ) | (85 | ) | (113 | ) | — | (36 | ) | ||||||||||
Adjusted EBITDA | $ | 25,360 | $ | 22,292 | $ | 22,388 | $ | 20,622 | $ | 19,679 | |||||||||
(1) | For a definition and discussion of non-GAAP financial measures, see the definitions section beginning on page 25 of this report. |
(2) | Legal fee reimbursements relate to prior litigation of the Company. For more information, see Item 3. Legal Proceedings in our 2014 Annual Report on Form 10-K. |
(3) | Represents the estimated impact on Q2’17 EBITDA of Q2’17 acquisitions as if they had been acquired April 1, 2017, the impact on Q1’17 EBITDA of Q1’17 acquisitions as if they had been acquired January 1, 2017, the impact on Q4’16 EBITDA of Q4’16 acquisitions as if they had been acquired October 1, 2016, the impact on Q3’16 EBITDA of Q3’16 acquisitions as if they had been acquired July 1, 2016 and the impact on Q2’16 EBITDA of Q2’16 acquisitions as if they had been acquired April 1, 2016. We have made a number of assumptions in such estimates and there can be no assurance that we would have generated the projected levels of EBITDA had we owned the acquired entities as of the beginning of each period. |
(4) | Represents the impact on Q2’17 EBITDA of Q2’17 dispositions as if they had been sold as of April 1, 2017, the impact on Q1’17 EBITDA of Q1’17 dispositions as if they had been sold as of January 1, 2017, the impact on Q4’16 EBITDA of Q4’16 dispositions as if they had been sold as of October 1, 2016, and the impact on Q2’16 EBITDA of Q2’16 dispositions as if they had been sold as of April 1, 2016. See page 22 for a detail of current year disposition properties. |
Second Quarter 2017 Supplemental Financial Reporting Package | Page 10 | | |
Same Property Portfolio Performance. (1) | ||
(unaudited and dollars in thousands) | ||
Same Property Portfolio NOI and Cash NOI: | ||||||||||||||||||||||||||||
Three Months Ended June 30, | Six months ended June 30, | |||||||||||||||||||||||||||
2017 | 2016 | $ Change | % Change | 2017 | 2016 | $ Change | % Change | |||||||||||||||||||||
Rental income | $ | 24,551 | $ | 22,647 | $ | 1,904 | 8.4% | $ | 48,527 | $ | 45,183 | $ | 3,344 | 7.4% | ||||||||||||||
Tenant reimbursements | 3,752 | 3,368 | 384 | 11.4% | 7,702 | 6,886 | 816 | 11.9% | ||||||||||||||||||||
Other income | 93 | 241 | (148 | ) | (61.4)% | 302 | 420 | (118 | ) | (28.1)% | ||||||||||||||||||
Total rental revenues | 28,396 | 26,256 | 2,140 | 8.2% | 56,531 | 52,489 | 4,042 | 7.7% | ||||||||||||||||||||
Property expenses | 7,640 | 6,778 | 862 | 12.7% | 15,136 | 13,957 | 1,179 | 8.4% | ||||||||||||||||||||
Same property portfolio NOI | $ | 20,756 | $ | 19,478 | $ | 1,278 | 6.6% | (2) | $ | 41,395 | $ | 38,532 | $ | 2,863 | 7.4% | (2) | ||||||||||||
Straight-line rents | (738 | ) | (436 | ) | (302) | 69.3% | (1,421 | ) | (1,290 | ) | (131 | ) | 10.2% | |||||||||||||||
Amort. above/below market leases | 92 | 90 | 2 | 2.2% | 173 | 83 | 90 | 108.4% | ||||||||||||||||||||
Same property portfolio Cash NOI | $ | 20,110 | $ | 19,132 | $ | 978 | 5.1% | $ | 40,147 | $ | 37,325 | $ | 2,822 | 7.6% | ||||||||||||||
Same Property Portfolio Summary: | |||||||||||
Same Property Portfolio | |||||||||||
Number of properties | 114 | ||||||||||
Square Feet | 11,211,536 | ||||||||||
Same Property Portfolio Occupancy: | |||||||||||
June 30, 2017 | June 30, 2016 | Change (basis points) | |||||||||
Same Property Portfolio | Stabilized Same Property Portfolio(3) | Same Property Portfolio | Stabilized Same Property Portfolio(4) | Same Property Portfolio | Stabilized Same Property Portfolio | ||||||
Occupancy: | |||||||||||
Los Angeles County | 93.8% | 98.4% | 89.7% | 95.7% | 410 bps | 270 bps | |||||
Orange County | 95.1% | 96.2% | 87.5% | 98.9% | 760 bps | (270) bps | |||||
San Bernardino County | 89.7% | 89.7% | 97.3% | 97.3% | (760) bps | (760) bps | |||||
San Diego County | 95.3% | 95.3% | 97.0% | 97.0% | (170) bps | (170) bps | |||||
Ventura County | 91.5% | 91.5% | 91.8% | 91.8% | (30) bps | (30) bps | |||||
Total/Weighted Average | 93.5% | 96.0% | 91.5% | 96.0% | 200 bps | 0 bps | |||||
(1) | For a definition and discussion of non-GAAP financial measures, see the definitions section beginning on page 25 of this report. |
(2) | Excluding the three and six months operating results of properties under repositioning in 2016 and 2017, Same Property Portfolio NOI increased by approximately 4.0% and 4.7% during the three and six months ended June 30, 2017 compared to the three and six months ended June 30, 2016, respectively. |
(3) | Reflects the occupancy of our Same Property Portfolio as of June 30, 2017, adjusted for space aggregating 298,442 rentable square feet at four of our properties that were classified as repositioning or lease-up as of June 30, 2017. For additional details, refer to pages 20-21 of this report. |
(4) | Reflects the occupancy of our Same Property Portfolio as of June 30, 2016, adjusted for space aggregating 531,964 rentable square feet at six of our properties that were classified as repositioning or lease-up as of June 30, 2016. |
Second Quarter 2017 Supplemental Financial Reporting Package | Page 11 | | |
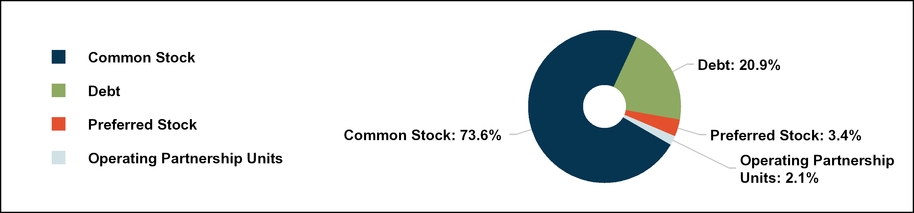
Capitalization Summary. | ||
(unaudited and in thousands, except share and per share data) | ||
Capitalization as of June 30, 2017 | ||
Description | June 30, 2017 | March 31, 2017 | December 31, 2016 | September 30, 2016 | June 30, 2016 | |||||||||||||||
Common shares outstanding(1) | 70,810,523 | 66,375,624 | 66,166,548 | 65,725,504 | 65,679,483 | |||||||||||||||
Operating partnership units outstanding(2) | 1,974,484 | 1,989,812 | 2,008,664 | 1,978,842 | 1,999,563 | |||||||||||||||
Total shares and units outstanding at period end | 72,785,007 | 68,365,436 | 68,175,212 | 67,704,346 | 67,679,046 | |||||||||||||||
Share price at end of quarter | $ | 27.44 | $ | 22.52 | $ | 23.19 | $ | 22.89 | $ | 21.09 | ||||||||||
Common Stock and Operating Partnership Units - Capitalization | $ | 1,997,221 | $ | 1,539,590 | $ | 1,580,983 | $ | 1,549,752 | $ | 1,427,351 | ||||||||||
5.875% Series A Cumulative Redeemable Preferred Stock(3) | 90,000 | 90,000 | 90,000 | 90,000 | — | |||||||||||||||
Total Equity Market Capitalization | $ | 2,087,221 | $ | 1,629,590 | $ | 1,670,983 | $ | 1,639,752 | $ | 1,427,351 | ||||||||||
Total Debt | $ | 564,242 | $ | 512,504 | $ | 502,476 | $ | 502,776 | $ | 503,009 | ||||||||||
Less: Cash and cash equivalents | (13,118 | ) | (11,676 | ) | (15,525 | ) | (55,263 | ) | (29,177 | ) | ||||||||||
Net Debt | $ | 551,124 | $ | 500,828 | $ | 486,951 | $ | 447,513 | $ | 473,832 | ||||||||||
Total Combined Market Capitalization (Net Debt plus Equity) | $ | 2,638,345 | $ | 2,130,418 | $ | 2,157,934 | $ | 2,087,265 | $ | 1,901,183 | ||||||||||
Net debt to total combined market capitalization | 20.9 | % | 23.5 | % | 22.6 | % | 21.4 | % | 24.9 | % | ||||||||||
Net debt to Adjusted EBITDA (quarterly results annualized)(4) | 5.4x | 5.6x | 5.4x | 5.4x | 6.0x | |||||||||||||||
(1) | Excludes the following number of shares of unvested restricted stock: 312,379 (Jun 30, 2017), 333,128 (Mar 31, 2017), 287,827 (Dec 31, 2016), 322,837 (Sep 30, 2016) and 356,249 (Jun 30, 2016). |
(2) | Represents outstanding common units of the Company’s operating partnership, Rexford Industrial Realty, LP, that are owned by unit holders other than Rexford Industrial Realty, Inc. Represents the noncontrolling interest in our operating partnership. Includes 41,668 vested LTIP Units and excludes 241,691 unvested LTIP Units and 514,998 unvested performance units. |
(3) | Value based on 3,600,000 outstanding shares of preferred stock at a liquidation preference of $25.00 per share. |
(4) | For a definition and discussion of non-GAAP financial measures, see the definitions section beginning on page 25 of this report. |
Second Quarter 2017 Supplemental Financial Reporting Package | Page 12 | | |
-
Debt Summary. | ||
(unaudited and dollars in thousands) | ||
Debt Detail: | ||
As of June 30, 2017 | ||
Debt Description | Maturity Date | Stated Interest Rate | Effective Interest Rate(1) | Principal Balance | Maturity Date of Effective Swaps | |||||
Secured Debt: | ||||||||||
$60M Term Loan | 8/1/2019(2) | LIBOR + 1.90% | 3.817% | $59,282 | 2/15/2019 | |||||
Gilbert/La Palma | 3/1/2031 | 5.125% | 5.125% | 2,839 | -- | |||||
12907 Imperial Highway | 4/1/2018 | 5.95% | 5.950% | 5,121 | -- | |||||
Unsecured Debt: | ||||||||||
$100M Term Loan Facility | 2/14/2022 | LIBOR +1.20%(4) | 3.098% | 100,000 | 12/14/2018 | |||||
$350M Revolving Credit Facility(5) | 2/12/2021(3) | LIBOR +1.10%(4) | 2.324% | 72,000 | -- | |||||
$225M Term Loan Facility(6) | 1/14/2023 | LIBOR +1.50%(4) | 2.724% | 225,000 | -- | |||||
$100M Senior Notes | 8/6/2025 | 4.29% | 4.290% | 100,000 | -- | |||||
Total Consolidated: | 3.173% | $564,242 | ||||||||
(1) | Includes the effect of interest rate swaps effective as of June 30, 2017, and excludes the effect of discounts/premiums, deferred loan costs and the facility fee. |
(2) | One additional one-year extension is available, provided that certain conditions are satisfied. |
(3) | Two additional six-month extensions are available, provided that certain conditions are satisfied. |
(4) | The applicable LIBOR margin will range from 1.10% to 1.50% for the revolving credit facility, 1.20% to 1.70% for the $100M term loan facility and 1.50% to 2.25% for the $225M term loan facility depending on the ratio of our outstanding consolidated indebtedness to the value of our consolidated gross asset value, which is measured on a quarterly basis. As a result, the effective interest rate will fluctuate from period to period. |
(5) | The credit facility is subject to a facility fee which is calculated as a percentage of the total commitment amount, regardless of usage. The facility fee ranges from 0.15% to 0.30% depending on the ratio of our outstanding consolidated indebtedness to the value of our consolidated gross asset value, which is measured on a quarterly basis. |
(6) | We have two interest rate swaps that will effectively fix this $225M term loan as follows: (i) $125M at 1.349% + an applicable LIBOR margin from 2/14/18 to 1/14/22 and (ii) $100M at 1.406% + an applicable LIBOR margin from 8/14/18 to 1/14/22. |
Debt Composition: | ||||||||||
Category | Avg. Term Remaining (yrs)(1) | Stated Interest Rate | Effective Interest Rate | Balance | % of Total | |||||
Fixed(2) | 5.4 | 3.78% | 3.78% | $267,242 | 47% | |||||
Variable(2) | 5.1 | LIBOR + 1.40% | 2.63% | $297,000 | 53% | |||||
Secured | 2.5 | 4.03% | $67,242 | 12% | ||||||
Unsecured | 5.6 | 3.06% | $497,000 | 88% | ||||||
(1) | The weighted average remaining term to maturity of our consolidated debt is 5.2 years. |
(2) | If all of our interest rate swaps were effective as of June 30, 2017, our consolidated debt would be 87% fixed and 13% variable. See footnote (6) above. |
Debt Maturity Schedule: | ||||||||||||||||||
Year | Secured(1) | Unsecured | Total | % Total | Effective Interest Rate | |||||||||||||
2017 | $ | — | $ | — | $ | — | — | % | — | % | ||||||||
2018 | 5,121 | — | 5,121 | 1 | % | 5.950 | % | |||||||||||
2019 | 59,282 | — | 59,282 | 10 | % | 3.817 | % | |||||||||||
2020 | — | — | — | — | % | — | % | |||||||||||
2021 | — | 72,000 | 72,000 | 13 | % | 2.324 | % | |||||||||||
Thereafter | 2,839 | 425,000 | 427,839 | 76 | % | 3.193 | % | |||||||||||
Total | $ | 67,242 | $ | 497,000 | $ | 564,242 | 100 | % | 3.173 | % | ||||||||
(1) | Excludes the effect of scheduled monthly principal payments on amortizing loans. |
Second Quarter 2017 Supplemental Financial Reporting Package | Page 13 | | |
Portfolio Overview. | ||
at 6/30/17 | (unaudited results) | |
Consolidated Portfolio: | ||
Rentable Square Feet | Occupancy % | Annualized Base Rent | |||||||||||||||||||||||||||
Market | # Properties | Same Properties Portfolio | Non-Same Properties Portfolio | Total Portfolio | Same Properties Portfolio | Non-Same Properties Portfolio | Total Portfolio | Total Portfolio Excluding Repositioning(1) | Total (in 000’s)(2) | per SF | |||||||||||||||||||
Central LA | 4 | 387,310 | — | 387,310 | 100.0 | % | — | % | 100.0 | % | 100.0 | % | $ | 4,121 | $10.64 | ||||||||||||||
Greater San Fernando Valley | 26 | 2,601,477 | 309,036 | 2,910,513 | 92.0 | % | 64.0 | % | 89.0 | % | 97.8 | % | 25,299 | $9.76 | |||||||||||||||
Mid-Counties | 10 | 672,090 | 198,062 | 870,152 | 99.3 | % | 100.0 | % | 99.4 | % | 99.4 | % | 7,991 | $9.24 | |||||||||||||||
San Gabriel Valley | 15 | 1,329,214 | 552,210 | 1,881,424 | 91.3 | % | 71.4 | % | 85.5 | % | 99.0 | % | 12,396 | $7.71 | |||||||||||||||
South Bay | 14 | 961,479 | 276,518 | 1,237,997 | 95.4 | % | 82.2 | % | 92.5 | % | 98.3 | % | 11,183 | $9.77 | |||||||||||||||
Los Angeles County | 69 | 5,951,570 | 1,335,826 | 7,287,396 | 93.8 | % | 76.2 | % | 90.5 | % | 98.5 | % | 60,990 | $9.24 | |||||||||||||||
North Orange County | 6 | 528,256 | 345,756 | 874,012 | 95.1 | % | 95.7 | % | 95.3 | % | 95.3 | % | 7,004 | $8.41 | |||||||||||||||
OC Airport | 7 | 511,692 | 116,575 | 628,267 | 92.1 | % | 100.0 | % | 93.5 | % | 95.8 | % | 5,867 | $9.98 | |||||||||||||||
South Orange County | 3 | 46,178 | 283,280 | 329,458 | 100.0 | % | 100.0 | % | 100.0 | % | 100.0 | % | 2,954 | $8.97 | |||||||||||||||
West Orange County | 4 | 285,777 | 243,274 | 529,051 | 100.0 | % | 55.6 | % | 79.6 | % | 100.0 | % | 3,220 | $7.65 | |||||||||||||||
Orange County | 20 | 1,371,903 | 988,885 | 2,360,788 | 95.1 | % | 87.6 | % | 92.0 | % | 97.0 | % | 19,045 | $8.77 | |||||||||||||||
Inland Empire East | 2 | 85,282 | — | 85,282 | 90.2 | % | — | % | 90.2 | % | 90.2 | % | 511 | $6.65 | |||||||||||||||
Inland Empire West | 14 | 1,108,197 | 1,781,176 | 2,889,373 | 89.6 | % | 99.0 | % | 95.4 | % | 95.4 | % | 19,543 | $7.09 | |||||||||||||||
San Bernardino County | 16 | 1,193,479 | 1,781,176 | 2,974,655 | 89.7 | % | 99.0 | % | 95.2 | % | 95.2 | % | 20,054 | $7.08 | |||||||||||||||
Ventura | 13 | 1,144,575 | 594,564 | 1,739,139 | 91.5 | % | 66.7 | % | 83.1 | % | 90.9 | % | 12,309 | $8.52 | |||||||||||||||
Ventura County | 13 | 1,144,575 | 594,564 | 1,739,139 | 91.5 | % | 66.7 | % | 83.1 | % | 90.9 | % | 12,309 | $8.52 | |||||||||||||||
Central San Diego | 13 | 889,050 | 254,919 | 1,143,969 | 94.5 | % | 97.3 | % | 95.2 | % | 95.2 | % | 12,445 | $11.43 | |||||||||||||||
North County San Diego | 7 | 584,258 | 54,740 | 638,998 | 96.5 | % | 100.0 | % | 96.8 | % | 96.8 | % | 6,103 | $9.87 | |||||||||||||||
South County San Diego | 1 | 76,701 | — | 76,701 | 95.1 | % | — | % | 95.1 | % | 95.1 | % | 676 | $9.26 | |||||||||||||||
San Diego County | 21 | 1,550,009 | 309,659 | 1,859,668 | 95.3 | % | 97.8 | % | 95.7 | % | 95.7 | % | 19,224 | $10.80 | |||||||||||||||
CONSOLIDATED TOTAL / WTD AVG | 139 | 11,211,536 | 5,010,110 | 16,221,646 | 93.5 | % | 86.7 | % | 91.4 | % | 96.5 | % | $ | 131,622 | $8.88 | ||||||||||||||
(1) | Excludes space aggregating 864,447 square feet at nine of our properties that were in various stages of repositioning or lease-up as of June 30, 2017. See pages 20-21 for additional details on these properties. |
(2) | Calculated for each property as monthly contracted base rent per the terms of the lease(s) at such property, as of June 30, 2017, multiplied by 12 and then aggregated by market. Excludes billboard and antenna revenue and rent abatements. |
Second Quarter 2017 Supplemental Financial Reporting Package | Page 14 | | |
Occupancy and Leasing Trends. | ||
(unaudited results, data represents consolidated portfolio only) | ||
Occupancy by County: | ||
Jun 30, 2017 | Mar 31, 2017 | Dec 31, 2016 | Sep 30, 2016 | June 30, 2016 | ||||||
Occupancy:(1) | ||||||||||
Los Angeles County | 90.5% | 89.8% | 92.1% | 91.2% | 90.6% | |||||
Orange County | 92.0% | 92.7% | 96.1% | 92.3% | 91.8% | |||||
San Bernardino County | 95.2% | 92.0% | 96.4% | 96.1% | 97.9% | |||||
Ventura County | 83.1% | 88.1% | 92.3% | 86.2% | 91.8% | |||||
San Diego County | 95.7% | 79.8% | 81.0% | 79.5% | 79.9% | |||||
Total/Weighted Average | 91.4% | 88.9% | 91.7% | 89.7% | 90.1% | |||||
Consolidated Portfolio SF | 16,221,646 | 15,069,122 | 15,020,336 | 14,588,101 | 13,640,820 | |||||
Leasing Activity: | ||||||||||
Three Months Ended | ||||||||||
Jun 30, 2017 | Mar 31, 2017 | Dec 31, 2016 | Sep 30, 2016 | June 30, 2016 | ||||||
Leasing Activity (SF):(2) | ||||||||||
New leases(3) | 310,950 | 423,766 | 401,081 | 519,212 | 476,858 | |||||
Renewal leases(3) | 469,766 | 439,602 | 363,601 | 318,179 | 598,301 | |||||
Gross leasing | 780,716 | 863,368 | 764,682 | 837,391 | 1,075,159 | |||||
Expiring leases | 663,128 | 914,098 | 477,966 | 619,461 | 936,655 | |||||
Expiring leases - placed into repositioning | 107,965 | 334,689 | — | — | — | |||||
Net absorption | 9,623 | (385,419) | 286,716 | 217,930 | 138,504 | |||||
Retention rate(4) | 71% | 57% | 76% | 51% | 64% | |||||
Weighted Average New / Renewal Leasing Spreads: | ||||||||||
Three Months Ended | ||||||||||
Jun 30, 2017 | Mar 31, 2017 | Dec 31, 2016 | Sep 30, 2016 | June 30, 2016 | ||||||
GAAP Rent Change | 20.4% | 23.3% | 16.1% | 15.6% | 23.5% | |||||
Cash Rent Change | 10.6% | 13.7% | 5.9% | 7.0% | 11.0% | |||||
(1) | See page 14 for the occupancy by County of our total consolidated portfolio excluding repositioning space. |
(2) | Excludes month-to-month tenants. |
(3) | Renewal leasing activity for Q1’17 excludes relocation/expansions within Rexford’s portfolio totaling 77,738 rentable square feet, which are included as part of new leasing activity. |
(4) | Retention rate is calculated as renewal lease square footage plus relocation/expansion square footage noted in (3) above, divided by expiring lease square footage (excluding expiring lease square footage placed into repositioning). |
Second Quarter 2017 Supplemental Financial Reporting Package | Page 15 | | |
Leasing Statistics. | ||
(unaudited results, data represents consolidated portfolio only) | ||
Leasing Activity: | ||
# Leases Signed | SF of Leasing | Weighted Average Lease Term (Years) | ||||
Second Quarter 2017: | ||||||
New | 52 | 310,950 | 4.0 | |||
Renewal | 87 | 469,766 | 3.5 | |||
Total/Weighted Average | 139 | 780,716 | 3.7 | |||
Change in Annual Rental Rates for Current Quarter Leases: | ||||||||||||||
GAAP Rent | Cash Rent | |||||||||||||
Second Quarter 2017: | Current Lease | Prior Lease | Rent Change - GAAP | Weighted Average Abatement (Months) | Starting Cash Rent - Current Lease | Expiring Cash Rent - Prior Lease | Rent Change - Cash | |||||||
New(1) | $9.51 | $7.25 | 31.3% | 1.2 | $9.32 | $7.51 | 24.2% | |||||||
Renewal(2) | $10.61 | $9.11 | 16.5% | 0.7 | $10.44 | $9.86 | 5.9% | |||||||
Total/Weighted Average | $10.27 | $8.53 | 20.4% | 0.9 | $10.09 | $9.12 | 10.6% | |||||||
Uncommenced Leases by County: | ||||||||||
Market | Leased SF | Uncommenced Leases Annualized Base Rent (in thousands) | Total Pro Forma Annualized Base Rent (in thousands) | Leased Percentage | Pro Forma Annualized Base Rent per SF | |||||
Los Angeles County | 11,484 | $121 | $61,111 | 90.7% | $9.25 | |||||
Orange County | 1,800 | 23 | 19,068 | 92.0% | $8.77 | |||||
San Bernardino County | 88,613 | 633 | 20,687 | 98.2% | $7.08 | |||||
San Diego County | 6,689 | 114 | 19,338 | 96.1% | $10.82 | |||||
Ventura County | — | — | 12,309 | 83.1% | $8.52 | |||||
Total/Weighted Average | 108,586 | $891 | $132,513 | 92.1% | $8.87 | |||||
(1) | GAAP and cash rent statistics for new leases exclude 15 leases aggregating 105,430 rentable square feet for which there was no comparable lease data. Of these 15 excluded leases, one lease with 18,033 rentable square feet relates to a recently completed repositioning project. Comparable leases generally exclude: (i) space that has never been occupied under our ownership, (ii) repositioned/redeveloped space, (iii) space that has been vacant for over one year, (iv) space with different lease structures (for example a change from a gross lease to a modified gross lease or an increase or decrease in the leased square footage) or (v) lease terms shorter than six months. |
(2) | GAAP and cash rent statistics for renewal leases exclude 3 leases aggregating 16,499 rentable square feet for which there was no comparable lease data, due to either (i) space with different lease structures or (ii) lease terms shorter than six months. |
Second Quarter 2017 Supplemental Financial Reporting Package | Page 16 | | |
Leasing Statistics (Continued). | ||
(unaudited results, data represents consolidated portfolio only) | ||
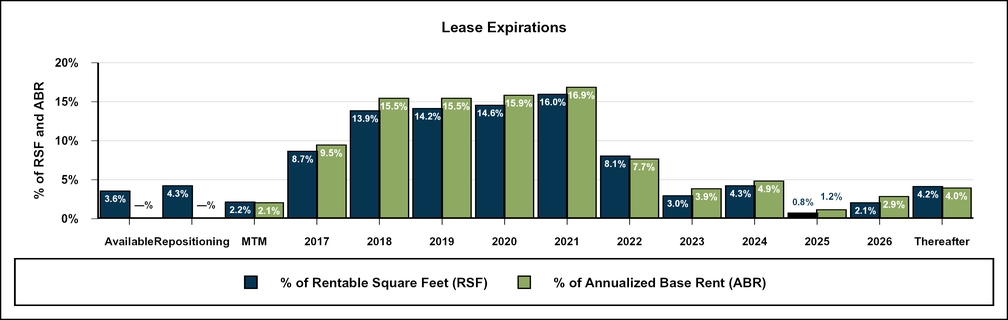
Lease Expiration Schedule for Leases in Place as of June 30, 2017: | ||
Year of Lease Expiration | # of Leases Expiring | Total Rentable SF | Annualized Base Rent (in thousands) | Annualized Base Rent per SF | ||||||
Available | — | 588,757 | $ | — | $— | |||||
Current Repositioning(1) | — | 698,457 | — | $— | ||||||
MTM Tenants | 99 | 351,183 | 2,794 | $7.95 | ||||||
2017 | 186 | 1,419,038 | 12,602 | $8.88 | ||||||
2018 | 352 | 2,252,875 | 20,559 | $9.13 | ||||||
2019 | 276 | 2,296,725 | 20,587 | $8.96 | ||||||
2020 | 202 | 2,374,376 | 21,079 | $8.88 | ||||||
2021 | 103 | 2,592,387 | 22,371 | $8.63 | ||||||
2022 | 63 | 1,313,605 | 10,148 | $7.73 | ||||||
2023 | 15 | 488,229 | 5,225 | $10.70 | ||||||
2024 | 11 | 695,500 | 6,421 | $9.23 | ||||||
2025 | 3 | 133,671 | 1,563 | $11.69 | ||||||
2026 | 7 | 338,904 | 3,857 | $11.38 | ||||||
Thereafter | 7 | 677,939 | 5,307 | $7.83 | ||||||
Total Portfolio | 1,324 | 16,221,646 | $ | 132,513 | $8.87 | |||||
(1) | Represents space at seven of our properties that were classified as current repositioning as of June 30, 2017. Excludes completed repositioning properties and properties in lease-up. See pages 20-21 for additional details on these properties. |
Second Quarter 2017 Supplemental Financial Reporting Package | Page 17 | | |
Top Tenants and Lease Segmentation. | ||
(unaudited results, data represents consolidated portfolio only) | ||
Top 10 Tenants: | ||
Tenant | Submarket | Leased SF | % of Total Annualized Base Rent | Annualized Base Rent per SF | Lease Expiration | |||||
32 Cold, LLC | Central LA | 149,157 | 1.6% | $14.21 | 3/31/2026(1) | |||||
Cosmetic Laboratories of America, LLC | Greater San Fernando Valley | 319,348 | 1.4% | $5.95 | 6/30/2020 | |||||
Triscenic Production Services, Inc. | Greater San Fernando Valley | 255,303 | 1.4% | $7.44 | 3/31/2022(2) | |||||
Universal Technical Institute of Southern California, LLC | South Bay | 142,593 | 1.4% | $12.90 | 8/31/2030 | |||||
Dendreon Corporation | West Orange County | 170,865 | 1.1% | $8.24 | 12/31/2019 | |||||
Triumph Processing, Inc. | South Bay | 164,662 | 1.1% | $8.47 | 5/31/2030 | |||||
Elliott Auto Supply Co., Inc. | North Orange County | 228,379 | 1.0% | $5.95 | 12/31/2021(3) | |||||
Heritage Bag Company | Inland Empire West | 284,676 | 0.9% | $4.34 | 11/27/2030 | |||||
Senior Operations, Inc. | Greater San Fernando Valley | 130,800 | 0.9% | $9.41 | 11/30/2024 | |||||
Cox Communications California, LLC | South Orange County | 102,299 | 0.9% | $11.49 | 9/30/2021 | |||||
Top 10 Total / Weighted Average | 1,948,082 | 11.7% | $7.99 | |||||||
(1) | Includes (i) 78,280 rentable square feet expiring September 30, 2025, and (ii) 70,877 rentable square feet expiring March 31, 2026. |
(2) | Includes (i) 38,766 rentable square feet expiring November 30, 2019, (ii) 147,318 rentable square feet expiring September 30, 2021, and (iii) 69,219 rentable square feet expiring March 31, 2022. |
(3) | Includes (i) 28,217 rentable square feet expiring October 31, 2021, and (ii) 200,162 rentable square feet expiring December 31, 2021. |
Lease Segmentation by Size: | ||||||||||||||||||
Square Feet | Number of Leases | Leased Rentable SF | Rentable SF | Leased % | Leased % Excluding Repositioning | Annualized Base Rent (in thousands) | % of Total Annualized Base Rent | Annualized Base Rent per SF | ||||||||||
<4,999 | 813 | 1,708,063 | 1,827,353 | 93.5% | 93.9% | $ | 19,510 | 14.7% | $11.42 | |||||||||
5,000 - 9,999 | 182 | 1,267,097 | 1,375,810 | 92.1% | 95.8% | 13,012 | 9.8% | $10.27 | ||||||||||
10,000 - 24,999 | 207 | 3,310,999 | 3,668,592 | 90.3% | 94.8% | 30,596 | 23.1% | $9.24 | ||||||||||
25,000 - 49,999 | 57 | 2,043,674 | 2,158,494 | 94.7% | 96.6% | 19,166 | 14.5% | $9.38 | ||||||||||
>50,000 | 65 | 6,604,599 | 7,191,397 | 91.8% | 100.0% | 50,229 | 37.9% | $7.61 | ||||||||||
Total / Weighted Average | 1,324 | 14,934,432 | 16,221,646 | 92.1% | 97.2% | $ | 132,513 | 100.0% | $8.87 | |||||||||
Second Quarter 2017 Supplemental Financial Reporting Package | Page 18 | | |
Capital Expenditure Summary. | ||
(unaudited results, in thousands, except square feet and per square foot data) | ||
Six months ended June 30, 2017 | ||
Year to Date | ||||||||||||||||||
Q2-2017 | Q1-2017 | Total | SF(1) | PSF | ||||||||||||||
Tenant Improvements and Space Preparation: | ||||||||||||||||||
New Leases‐1st Generation | $ | 272 | $ | 453 | $ | 725 | 339,843 | $ | 2.13 | |||||||||
New Leases‐2nd Generation | $ | 640 | $ | 483 | $ | 1,123 | 518,385 | $ | 2.17 | |||||||||
Renewals | $ | 404 | $ | 65 | $ | 469 | 319,135 | $ | 1.47 | |||||||||
Leasing Commissions & Lease Costs: | ||||||||||||||||||
New Leases‐1st Generation | $ | 103 | $ | 116 | $ | 219 | 78,909 | $ | 2.78 | |||||||||
New Leases‐2nd Generation | $ | 448 | $ | 835 | $ | 1,283 | 544,599 | $ | 2.36 | |||||||||
Renewals | $ | 129 | $ | 162 | $ | 291 | 310,374 | $ | 0.94 | |||||||||
Total Recurring Capex: | ||||||||||||||||||
Recurring Capex | $ | 857 | $ | 390 | $ | 1,247 | 15,281,893 | $ | 0.08 | |||||||||
Recurring Capex % of NOI | 3.2 | % | 1.5 | % | 4.6 | % | ||||||||||||
Recurring Capex % of Operating Revenue | 2.4 | % | 1.1 | % | 3.4 | % | ||||||||||||
Nonrecurring Capex | $ | 8,282 | $ | 5,388 | $ | 13,670 | 9,142,696 | $ | 1.50 | |||||||||
(1) | For tenant improvements and leasing commissions, reflects the aggregate square footage of the leases in which we incurred such costs, excluding new/renewal leases in which there were no tenant improvements and/or leasing commissions. For recurring capex, reflects the weighted average square footage of our consolidated portfolio for the period. For nonrecurring capex, reflects the aggregate square footage of the properties in which we incurred such capital expenditures. |
Second Quarter 2017 Supplemental Financial Reporting Package | Page 19 | | |
Properties and Space Under Repositioning. (1) | ||
As of June 30, 2017 | (unaudited results, in thousands, except square feet) | |
Estimated Construction Period | |||||||||||||||||||||||||||||||||||||||
Property (Submarket) | Total Property Rentable Square Feet | Space Under Repositioning/ Lease-Up | Total Property Leased % 6/30/17 | Same Property Portfolio | Start | Target Completion | Est. Period until Stabilized (months)(2) | Purchase Price | Projected Repositioning Costs | Projected Total Investment(3) | Cumulative Investment to Date(4) | Actual Quarterly Cash NOI 2Q-2017(5) | Est. Annual Stabilized Cash NOI(6) | ||||||||||||||||||||||||||
CURRENT REPOSITIONING: | |||||||||||||||||||||||||||||||||||||||
14750 Nelson (San Gabriel Valley) | 147,360 | 147,360 | (7) | 0% | N | 3Q-2016 | 1Q-2018 | 14 - 20 | $ | 15,000 | $ | 12,103 | $ | 27,103 | $ | 15,321 | $ | (24 | ) | $ | 1,774 | ||||||||||||||||||
301-445 Figueroa Street (South Bay)(8) | 133,925 | 49,346 | 63% | N | 4Q-2016 | 3Q-2017 | 9 - 12 | $ | 13,000 | $ | 3,872 | $ | 16,872 | $ | 13,604 | $ | 86 | $ | 1,128 | ||||||||||||||||||||
3880 Valley Blvd. (San Gabriel Valley) | 108,703 | 108,703 | 0% | Y | 1Q-2017 | 3Q-2017 | 6 - 9 | $ | 9,631 | $ | 3,082 | $ | 12,713 | $ | 11,565 | $ | (24 | ) | $ | 813 | |||||||||||||||||||
12131 Western Avenue (West OC) | 207,953 | 107,953 | 48% | N | 1Q-2017 | 3Q-2017 | 6 - 12 | $ | 27,000 | $ | 3,515 | $ | 30,515 | $ | 29,242 | $ | 75 | $ | 1,758 | ||||||||||||||||||||
28903 Avenue Paine - Repositioning | 111,346 | 111,346 | 0% | 1Q-2017 | 1Q-2018 | 8 - 11 | $ | 17,060 | $ | 2,631 | $ | 19,691 | $ | 17,319 | $ | (56 | ) | $ | 849 | ||||||||||||||||||||
28903 Avenue Paine - Development | — | — | 0% | 1Q-2017 | 4Q-2018 | 21 - 24 | $ | — | $ | 9,275 | $ | 9,275 | $ | 2 | $ | — | $ | 966 | |||||||||||||||||||||
28903 Avenue Paine (SF Valley) | 111,346 | 111,346 | (9) | 0% | N | 1Q-2017 | 4Q-2018 | 8 - 24 | $ | 17,060 | $ | 11,906 | $ | 28,966 | $ | 17,321 | $ | (56 | ) | $ | 1,815 | ||||||||||||||||||
TOTAL/WEIGHTED AVERAGE | 709,287 | 524,708 | 26% | $ | 81,691 | $ | 34,478 | $ | 116,169 | $ | 87,053 | $ | 57 | (10) | $ | 7,288 | |||||||||||||||||||||||
LEASE-UP: | |||||||||||||||||||||||||||||||||||||||
1601 Alton Pkwy. (OC Airport) | 124,273 | 15,159 | 88% | Y | 4Q-2014 | 3Q-2017 | 3 - 6 | $ | 13,276 | $ | 6,187 | $ | 19,463 | $ | 19,213 | $ | 209 | $ | 1,330 | ||||||||||||||||||||
9401 De Soto Avenue (SF Valley) | 150,831 | 150,831 | 0% | Y | 2Q-2015 | 1Q-2016 | 0 - 7 | $ | 14,075 | $ | 2,917 | $ | 16,992 | $ | 16,771 | $ | (97 | ) | $ | 1,165 | |||||||||||||||||||
TOTAL/WEIGHTED AVERAGE | 275,104 | 165,990 | 40% | $ | 27,351 | $ | 9,104 | $ | 36,455 | $ | 35,984 | $ | 112 | (10) | $ | 2,495 | |||||||||||||||||||||||
FUTURE REPOSITIONING: | |||||||||||||||||||||||||||||||||||||||
9615 Norwalk Blvd. (Mid-Counties) (11) | 38,362 | — | 100% | Y | 1Q-2018 | 1Q-2019 | TBD | $ | 9,642 | $ | 14,803 | $ | 24,445 | $ | 10,011 | $ | 193 | $ | 1,556 | ||||||||||||||||||||
COMPLETED AND LEASED-UP: | |||||||||||||||||||||||||||||||||||||||
679-691 S. Anderson St. (Central LA) | 47,490 | — | 100% | Y | N/A | N/A | -- | $ | 6,490 | $ | 635 | $ | 7,125 | $ | 7,125 | $ | 60 | $ | 449 | ||||||||||||||||||||
(1) | See page 27 for a definition of Properties and Space Under Repositioning. |
(2) | Represents the estimated remaining number of months, as of June 30, 2017, for the property to reach stabilization. Includes time to complete construction and lease-up the property. Actual number of months required to reach stabilization may vary materially from our estimates. |
(3) | Projected total investment includes the purchase price of the property and an estimate of total expected nonrecurring capital expenditures to be incurred on each repositioning project to reach completion. |
(4) | Cumulative investment-to-date includes the purchase price of the property and subsequent costs incurred for nonrecurring capital expenditures. |
(5) | Represents the actual cash NOI for each property for the three months ended June 30, 2017. For a definition and discussion of non-GAAP financial measures, see the definitions section beginning on page 25 of this report. |
(6) | Represents management’s estimate of each property’s cash NOI upon stabilization. Actual results may vary materially from our estimates. The Company does not provide a reconciliation to net income on a consolidated basis, because it is unable to provide a meaningful or accurate estimation of reconciling items due to the inherent difficulty of forecasting the timing and/or amount of various items that would impact net income. |
(7) | Represents the RSF of the existing acquired building. Upon completion, the property will be approximately 200,000 RSF, which reflects an increase in RSF due to the construction of two additional buildings on the excess land. |
(8) | The property located at 301-445 Figueroa has 14 units, all of which will be repositioned in various phases, beginning with the four units aggregating 49,346 RSF that are currently vacant. The estimated construction and stabilization periods presented above reflect the completion of these four units as well as planned exterior work. The projected total investment and estimated annual stabilized Cash NOI presented above reflect the repositioning of all 14 units and exterior work. |
(9) | Represents the RSF of the existing acquired building. Upon completion, the property will be approximately 224,000 RSF, which reflects an increase in RSF due to the construction of one additional building on the excess land. |
(10) | Actual NOI for the three months ended June 30, 2017, reflects the capitalization of $241 thousand of real estate property taxes and insurance for current repositioning and $5 thousand for lease-up properties, respectively. We will continue to capitalize real estate property taxes and insurance during the period in which construction is taking place to get each repositioning property ready for its intended use. |
(11) | 9615 Norwalk includes 10.26 acres of partially paved storage yard/industrial land that is currently under a MTM lease and generating $85 thousand per month in short term base rent. The current projected total investment and estimated stabilized cash NOI reflects the construction and lease-up of a new approximately 200,000 RSF building. |
Second Quarter 2017 Supplemental Financial Reporting Package | Page 20 | | |
Properties and Space Under Repositioning (Continued). (1) | ||
As of June 30, 2017 | (unaudited results, in thousands, except square feet) | |
Repositioning Space | |||||||||||||||||||||||||||||||
Estimated Construction Period | |||||||||||||||||||||||||||||||
Property (Submarket) | Property Rentable Square Feet | Space Under Repositioning/Lease-Up | Same Property Portfolio | Start | Target Completion | Est. Period until Stabilized (months)(2) | Projected Total Investment(3) | Repositioning Costs Incurred to Date | Total Property Leased % 6/30/17 | Actual Quarterly Cash NOI 2Q-2017(4) | Estimated Annual Stabilized Cash NOI(5) | ||||||||||||||||||||
CURRENT REPOSITIONING: | |||||||||||||||||||||||||||||||
228th Street (South Bay)(6) | 89,236 | 23,749 | Y | 1Q-2016 | 4Q-2017 | 1 - 5 | $ | 2,038 | $ | 1,205 | 66% | $ | (3 | ) | $ | 231 | |||||||||||||||
3233 Mission Oaks Blvd. (Ventura)(7): | |||||||||||||||||||||||||||||||
Unit 3233-H | 455,864 | 42,035 | N | 1Q-2017 | 3Q-2017 | 5 - 8 | $ | 947 | $ | 320 | 57% | $ | (4 | ) | $ | 249 | |||||||||||||||
Unit 3233 | 455,864 | 107,965 | N | 2Q-2017 | 2Q-2018 | 18 - 24 | $ | 5,414 | $ | 280 | 57% | $ | 138 | $ | 852 | ||||||||||||||||
TOTAL | 173,749 | $ | 8,399 | $ | 1,805 | $ | 131 | (8) | $ | 1,332 | |||||||||||||||||||||
COMPLETED AND LEASED-UP: | |||||||||||||||||||||||||||||||
18118 - 18120 S. Broadway St. (South Bay) | 78,183 | — | Y | N/A | N/A | -- | $ | 411 | $ | 280 | 100% | $ | (4 | ) | (8) | $ | 138 | ||||||||||||||
Completed and Leased Repositionings: Properties and Space | |||||||||||||||||||||||||||||||
Property (Submarket) | Rentable Square Feet | Stabilized Period | Stabilized Yield | ||||||||||||||||||||||||||||
7110 Rosecrans Ave. (South Bay) | 73,439 | 2Q-2015 | 7.9% | ||||||||||||||||||||||||||||
7900 Nelson Rd. (SF Valley) | 202,905 | 4Q-2015 | 6.6% | ||||||||||||||||||||||||||||
605 8th Street (SF Valley) | 55,715 | 4Q-2015 | 6.8% | ||||||||||||||||||||||||||||
24105 Frampton Ave. (South Bay) | 49,841 | 3Q-2016 | 7.0% | ||||||||||||||||||||||||||||
12247 Lakeland Rd. (Mid-Counties) | 24,875 | 3Q-2016 | 6.4% | ||||||||||||||||||||||||||||
2610 & 2701 S. Birch St. (OC Airport) | 98,230 | 4Q-2016 | 7.1% | ||||||||||||||||||||||||||||
15140 & 15148 Bledsoe St. (SF Valley) | 72,000 | 4Q-2016 | N/A(9) | ||||||||||||||||||||||||||||
679-691 S. Anderson St. (Central LA) | 47,490 | 2Q-2017 | 6.3% | ||||||||||||||||||||||||||||
18118 - 18120 S. Broadway St. (South Bay) | 18,033 | 2Q-2017 | N/A(9) | ||||||||||||||||||||||||||||
TOTAL/WEIGHTED AVERAGE | 642,528 | 6.8% | |||||||||||||||||||||||||||||
(1) | See page 27 for a definition of Properties and Space Under Repositioning. |
(2) | Represents the estimated remaining number of months, as of June 30, 2017, for the space to reach stabilization. Includes time to complete construction and lease-up the space. Actual number of months required to reach stabilization may vary materially from our estimates. |
(3) | Projected total investment represents the estimated nonrecurring capital expenditures to be incurred on each repositioning project to reach completion. |
(4) | Represents the actual cash NOI of repositioning space for the three months ended June 30, 2017. For a definition and discussion of non-GAAP financial measures, see the definitions section beginning on page 25 of this report. |
(5) | Based on current management estimates. Actual results may vary materially from our estimates. The Company does not provide a reconciliation to net income on a consolidated basis, because it is unable to provide a meaningful or accurate estimation of reconciling items due to the inherent difficulty of forecasting the timing and/or amount of various items that would impact net income. |
(6) | The property located at 228th Street includes eight buildings, of which three buildings aggregating 23,749 RSF are under repositioning as of June 30, 2017. The amounts presented on this page represent the actual and projected construction costs and the actual and estimated stabilized cash NOI of only these three buildings. |
(7) | As of June 30, 2017, we are repositioning two spaces aggregating 150,000 RSF at 3233 Mission Oaks. The amounts presented on this page represent the actual and projected construction costs and the actual and estimated stabilized cash NOI of only these two spaces. |
(8) | Actual NOI for the three months ended June 30, 2017, reflects the capitalization of $19 thousand of real estate property taxes and insurance for repositioning space. We will continue to capitalize real estate property taxes and insurance during the period in which construction is taking place to get each repositioning space ready for its intended use. |
(9) | We are unable to provide a meaningful stabilized yield for these completed projects as these were partial repositionings of larger properties. |
Second Quarter 2017 Supplemental Financial Reporting Package | Page 21 | | |
Current Year Acquisitions and Dispositions Summary. | ||
As of June 30, 2017 | (unaudited results, data represents consolidated portfolio only) | |
2017 Acquisitions | ||||||||||||||
Acquisition Date | Property Address | County | Submarket | Rentable Square Feet | Acquisition Price ($ in MM) | Occ. % at Acquisition | Occ.% at June 30, 2017 | |||||||
2/17/2017 | 28903 Avenue Paine | Los Angeles | Greater San Fernando Valley | 111,346 | $17.06 | —% | —% | |||||||
4/28/2017 | 2390 Ward Avenue | Ventura | Ventura | 138,700 | $16.50 | 100% | 100% | |||||||
5/24/2017 | Safari Business Center | San Bernardino | Inland Empire West | 1,138,090 | $141.20 | 97% | 98% | |||||||
6/14/2017 | 4175 Conant Street | Los Angeles | South Bay | 142,593 | $30.60 | 100% | 100% | |||||||
6/15/2017 | 5421 Argosy Avenue | Orange County | Orange County West | 35,321 | $5.30 | 100% | 100% | |||||||
6/30/2017 | 14820-14830 Carmenita Road | Los Angeles | Mid-Counties | 198,062 | $30.65 | 100% | 100% | |||||||
1,764,112 | $241.31 | |||||||||||||
2017 Dispositions | ||||||||||||||
Disposition Date | Property Address | County | Submarket | Rentable Square Feet | Sale Price ($ in MM) | Reason for Selling | ||||||||
3/31/2017 | 9375 Archibald Avenue | San Bernardino | Inland Empire West | 62,677 | $6.88 | Investor Sale | ||||||||
5/17/2017 | 2535 Midway Drive | San Diego | Central San Diego | 373,744 | $40.05 | Opportunistic Sale | ||||||||
6/28/2017 | 2811 Harbor Boulevard | Orange County | Airport | 126,796 | $18.70 | Tenant Exercise of Purchase Option | ||||||||
563,217 | $65.63 | |||||||||||||
Second Quarter 2017 Supplemental Financial Reporting Package | Page 22 | | |
Guidance. | ||
2017 OUTLOOK
METRIC | 2017 GUIDANCE / ASSUMPTIONS |
Core FFO (1) | $0.93 to $0.96 per share (2) |
Same Property Portfolio NOI Growth | 6.0% to 8.0% (3) |
Year-End 2017 Same Property Portfolio Occupancy (4) | 94.0% to 96.0% (5) |
Year-End 2017 Stabilized Same Property Portfolio Occupancy (4) | 96.0% to 98.0% (5) |
General and Administrative Expenses | $20.0 million to $20.5 million (6) |
(1) | Our Core FFO guidance refers to the Company's in-place portfolio as of August 1, 2017, and does not include any assumptions for acquisitions, dispositions or balance sheet activities that may or may not occur later during the year. |
(2) | The Company does not provide a reconciliation for its guidance range of Core FFO per diluted share to net income attributable to common stockholders per diluted share, the most directly comparable forward-looking GAAP financial measure, because it is impractical to provide a meaningful or accurate estimation of reconciling items and the information is not available without unreasonable effort. This is due to the inherent difficulty of forecasting the timing and/or amount of various items that would impact net income available to common stockholders per diluted share, including, for example, acquisition costs, gains on sales of depreciable real estate and other items that have not yet occurred and are out of the Company’s control. For the same reasons, the Company is unable to address the probable significance of the unavailable information and believes that providing a reconciliation for its guidance range of Core FFO per diluted share would imply a degree of precision as to its forward-looking net income available to common stockholders per diluted share that would be confusing or misleading to investors. |
(3) | Our 2017 guidance for Same Property Portfolio NOI growth includes an estimated $2.0 million impact on NOI from the completion and lease-up of the 2017 Same Property Portfolio repositioning properties identified on pages 20-21. |
(4) | Our 2017 Same Property Portfolio is a subset of our consolidated portfolio and consists of 114 properties aggregating 11,211,536 rentable square feet that were wholly-owned by us as of January 1, 2016, and still owned by us as of June 30, 2017. Our 2017 Stabilized Same Property Portfolio represents the properties included in our Same Property Portfolio, adjusted to exclude space at four of our properties aggregating 298,442 rentable square feet that will be in various stages of repositioning (current and future) and lease-up in connection with completed repositioning during 2017. See pages 20-21 for additional details on these four properties. |
(5) | As of December 31, 2016, the occupancy of our 2017 Same Property Portfolio was 94.9% and the occupancy of our 2017 Stabilized Same Property Portfolio was 96.9%. |
(6) | Our general and administrative expense guidance includes estimated non-cash equity compensation expense of $5.1 million. |
Second Quarter 2017 Supplemental Financial Reporting Package | Page 23 | | |
Net Asset Value Components. | ||
At 6/30/2017 | (unaudited and in thousands, except share data) | |
Net Operating Income | ||
Pro Forma Net Operating Income (NOI)(1) | Three Months Ended June 30, 2017 | |
Total operating revenues | $36,419 | |
Property operating expenses | (9,536) | |
Pro forma effect of uncommenced leases(2) | 209 | |
Pro forma effect of acquisitions(3) | 2,000 | |
Pro forma effect of dispositions(4) | (157) | |
Pro forma NOI effect of properties and space under repositioning(5) | 2,765 | |
Pro Forma NOI | 31,700 | |
Fair value lease revenue | (201) | |
Straight line rental revenue adjustment | (996) | |
Pro Forma Cash NOI | $30,503 | |
Balance Sheet Items | ||
Other assets and liabilities | June 30, 2017 | |
Cash and cash equivalents | $13,118 | |
Rents and other receivables, net | 2,644 | |
Other assets | 7,388 | |
Acquisition related deposits | 2,250 | |
Accounts payable, accrued expenses and other liabilities | (14,298) | |
Dividends payable | (10,642) | |
Tenant security deposits | (16,721) | |
Prepaid rents | (5,204) | |
Estimated remaining cost to complete repositioning projects | (50,748) | |
Total other assets and liabilities | $(72,213) | |
Debt and Shares Outstanding | ||
Total consolidated debt(6) | $564,242 | |
Preferred stock - liquidation preference | $90,000 | |
Common shares outstanding(7) | 70,810,523 | |
Operating partnership units outstanding(8) | 1,974,484 | |
Total common shares and operating partnership units outstanding | 72,785,007 | |
(1) | For a definition and discussion of non-GAAP financial measures, see the notes and definitions section beginning on page 25 of this report. |
(2) | Represents the estimated incremental base rent from uncommenced leases as if they had commenced as of April 1, 2017. |
(3) | Represents the estimated incremental NOI from Q2’17 acquisitions as if they had been acquired on April 1, 2017. We have made a number of assumptions in such estimates and there can be no assurance that we would have generated the projected levels of NOI had we actually owned the acquired entities as of April 1, 2017. |
(4) | Represents the actual Q2’17 NOI for properties sold during the current quarter. See page 22 for a detail of current year disposition properties. |
(5) | Represents the estimated incremental NOI from the properties that were classified as current or future repositioning or lease-up during the three months ended June 30, 2017, assuming that all repositioning work had been completed and all of the properties/space were fully stabilized as of April 1, 2017. See pages 20-21 for the properties included. We have made a number of assumptions in such estimates and there can be no assurance that we would have generated the projected levels of NOI had these properties actually been stabilized as of April 1, 2017. |
(6) | Excludes net deferred loan fees and net loan premium aggregating $2.7 million. |
(7) | Represents outstanding shares of common stock of the Company, which excludes 312,379 shares of unvested restricted stock. |
(8) | Represents outstanding common units of the Company’s operating partnership, Rexford Industrial Realty, L.P., that are owned by unit holders other than Rexford Industrial Realty, Inc. Includes 41,668 vested LTIP Units. |
Second Quarter 2017 Supplemental Financial Reporting Package | Page 24 | | |
Notes and Definitions. | ||
Adjusted Funds from Operations (AFFO): We calculate adjusted funds from operations, or AFFO, by adding to or subtracting from FFO, as defined below, the following items: (i) certain non-cash operating revenues and expenses, (ii) capitalized operating expenditures such as leasing and construction payroll, (iii) recurring capital expenditures required to maintain and re-tenant our properties, (iv) capitalized interest costs resulting from the repositioning/redevelopment of certain of our properties, (v) 2nd generation tenant improvements and leasing commissions and (vi) gain (loss) on extinguishment of debt. Management uses AFFO as a supplemental performance measure because it provides a performance measure that, when compared year over year, captures trends in portfolio operating results. We also believe that, as a widely recognized measure of the performance of REITs, AFFO will be used by investors as a basis to assess our performance in comparison to other REITs. However, because AFFO may exclude certain non-recurring capital expenditures and leasing costs, the utility of AFFO as a measure of our performance is limited. Additionally, other Equity REITs may not calculate AFFO using the method we do. As a result, our AFFO may not be comparable to such other Equity REITs’ AFFO. AFFO should be considered only as a supplement to net income (as computed in accordance with GAAP) as a measure of our performance.
Annualized Base Rent: Calculated for each lease as the latest monthly contracted base rent per the terms of such lease multiplied by 12. Excludes billboard and antenna revenue and rent abatements.
Capital Expenditures, Non-recurring: Expenditures made in respect of a property for improvement to the appearance of such property or any other major upgrade or renovation of such property, and further includes capital expenditures for seismic upgrades, and capital expenditures for deferred maintenance existing at the time such property was acquired.
Capital Expenditures, Recurring: Expenditures made in respect of a property for maintenance of such property and replacement of items due to ordinary wear and tear including, but not limited to, expenditures made for maintenance or replacement of parking lot, roofing materials, mechanical systems, HVAC systems and other structural systems. Recurring capital expenditures shall not include any of the following: (a) improvements to the appearance of such property or any other major upgrade or renovation of such property not necessary for proper maintenance or marketability of such property; (b) capital expenditures for seismic upgrades; or (c) capital expenditures for deferred maintenance for such property existing at the time such property was acquired.
Capital Expenditures, First Generation: Capital expenditures for newly acquired space, newly developed or redeveloped space, or change in use.
Cash NOI: Cash basis NOI is a non-GAAP measure, which we calculate by adding or subtracting from NOI (i) fair value lease revenue and (ii) straight-line rent adjustment. We use Cash NOI, together with NOI, as a supplemental performance measure. Cash NOI should not be used as a measure of our liquidity, nor is it indicative of funds available to fund our cash needs. Cash NOI should not be used as a substitute for cash flow from operating activities computed in accordance with GAAP. We use Cash NOI to help evaluate the performance of the Company as a whole, as well as the performance of our Same Property Portfolio.
Core Funds From Operations (Core FFO): We calculate Core FFO by adjusting FFO, as defined below, to exclude the impact of certain items that we do not consider reflective of our core revenue or
expense streams. These adjustments consist of acquisition expenses and legal expenses or reimbursements related to prior litigation. For more information on prior litigation, see Item 3. Legal Proceedings in our 2014 Annual Report on Form 10-K. Management believes that Core FFO is a useful supplemental measure as it provides a more meaningful and consistent comparison of operating performance and allows investors to more easily compare the Company's operating results. Because certain of these adjustments have a real economic impact on our financial condition and results from operations, the utility of core FFO as a measure of our performance is limited. Other REITs may not calculate core FFO in a consistent manner. Accordingly, our core FFO may not be comparable to other REITs' core FFO. Core FFO should be considered only as a supplement to net income computed in accordance with GAAP as a measure of our performance.
Debt Covenants ($ in thousands):
Jun 30, 2017 | Mar 31, 2017 | ||||||||
Covenant | Amended Credit Facility and $225M Term Loan | $100M Senior Notes | Amended Credit Facility and $225M Term Loan | $100M Senior Notes | |||||
Maximum Leverage Ratio | less than 60% | 29.9% | 29.9% | 30.6% | 38.0% | ||||
Maximum Secured Leverage Ratio | less than 45% | 3.5% | n/a | 4.0% | 4.2% | ||||
Maximum Secured Leverage Ratio | less than 40% | n/a | 3.5% | n/a | n/a | ||||
Maximum Secured Recourse Debt | less than 15% | —% | —% | —% | —% | ||||
Minimum Tangible Net Worth | $856,665 | $1,202,683 | $1,202,683 | $1,075,788 | n/a | ||||
Minimum Tangible Net Worth | $789,104 | n/a | n/a | n/a | $1,075,788 | ||||
Minimum Fixed Charge Coverage Ratio | at least 1.50 to 1.00 | 4.1 to 1.00 | 4.1 to 1.00 | 3.90 to 1.00 | 3.70 to 1.00 | ||||
Unencumbered Leverage Ratio | less than 60% | 28.9% | 28.9% | 29.7% | 31.5% | ||||
Unencumbered Interest Coverage Ratio | at least 1.75 to 1.00 | 7.02 to 1.00 | 7.02 to 1.00 | 6.75 to 1.00 | 3.53 to 1.00 | ||||
Our actual performance for each covenant is calculated based on the definitions set forth in each loan agreement.
EBITDA and Adjusted EBITDA: EBITDA is calculated as earnings (net income) before interest expense, tax expense and depreciation and amortization, including our proportionate share from our unconsolidated joint venture. We calculate Adjusted EBITDA by adding or subtracting from EBITDA the following items: (i) non-cash stock based compensation expense, (ii) gains on sale of real estate (including our proportionate share from our unconsolidated joint venture), (iii) gain (loss) on extinguishment of debt, (iv) legal fee reimbursements related to prior litigation, (v) acquisition expenses and (vi) the pro-forma effects of acquisitions and dispositions. We believe that EBITDA and Adjusted EBITDA are helpful to investors as a supplemental measure of our operating performance as a real estate company because it is a direct measure of the actual operating results of our industrial properties. We also use these measures in ratios to compare our performance to that of our industry peers. In addition, we believe EBITDA and Adjusted EBITDA are frequently used by securities analysts, investors and other interested parties in the evaluation of Equity REITs. However, because EBITDA and Adjusted EBITDA are calculated before recurring cash charges including interest expense and income taxes, and are not adjusted for capital expenditures or other recurring cash requirements of our business, their utility as a measure of our liquidity is limited. Accordingly, EBITDA and Adjusted EBITDA should not be considered alternatives to cash flow from operating activities (as computed in accordance with GAAP) as a measure of our liquidity. EBITDA and Adjusted EBITDA should not be considered as alternatives to net income or loss
Second Quarter 2017 Supplemental Financial Reporting Package | Page 25 | | |
Notes and Definitions. | ||
as an indicator of our operating performance. Other Equity REITs may calculate EBITDA and Adjusted EBITDA differently than we do; accordingly, our EBITDA and Adjusted EBITDA may not be comparable to such other Equity REITs’ EBITDA and Adjusted EBITDA. EBITDA and Adjusted EBITDA should be considered only as supplements to net income (as computed in accordance with GAAP) as a measure of our performance.
Fixed Charge Coverage Ratio:
For the Three Months Ended | |||||||||||||||||||
Jun 30, 2017 | Mar 31, 2017 | Dec 31, 2016 | Sep 30, 2016 | Jun 30, 2016 | |||||||||||||||
EBITDA | $ | 38,672 | $ | 23,318 | $ | 26,862 | $ | 20,206 | $ | 29,123 | |||||||||
Cash distributions from unconsolidated joint ventures | — | — | (8 | ) | (4 | ) | 75 | ||||||||||||
Fair value lease expense | (201 | ) | (117 | ) | (95 | ) | (39 | ) | 60 | ||||||||||
Non-cash stock compensation | 1,394 | 1,346 | 956 | 992 | 953 | ||||||||||||||
Straight line corporate office rent expense adjustment | (36 | ) | (36 | ) | (50 | ) | (12 | ) | (11 | ) | |||||||||
Gains on sale of real estate | (16,569 | ) | (2,668 | ) | (5,814 | ) | — | (11,563 | ) | ||||||||||
Loss on extinguishment of debt | — | 22 | — | — | — | ||||||||||||||
Straight line rental revenue adjustment | (996 | ) | (956 | ) | (1,095 | ) | (1,395 | ) | (922 | ) | |||||||||
Capitalized payments | (563 | ) | (510 | ) | (388 | ) | (400 | ) | (292 | ) | |||||||||
Recurring capital expenditures | (857 | ) | (390 | ) | (667 | ) | (691 | ) | (848 | ) | |||||||||
2nd generation tenant improvements and leasing commissions | (1,621 | ) | (1,545 | ) | (1,311 | ) | (1,988 | ) | (1,483 | ) | |||||||||
Unconsolidated joint venture AFFO adjustments | — | — | — | (2 | ) | (9 | ) | ||||||||||||
Cash flow for fixed charge coverage calculation | 19,223 | 18,464 | 18,390 | 16,667 | 15,083 | ||||||||||||||
Cash interest expense calculation detail: | |||||||||||||||||||
Interest expense | 4,302 | 3,998 | 4,074 | 3,804 | 3,716 | ||||||||||||||
Capitalized interest | 458 | 466 | 338 | 433 | 443 | ||||||||||||||
Note payable premium amort. | 36 | 58 | 60 | 60 | 59 | ||||||||||||||
Amortization of deferred financing costs | (288 | ) | (275 | ) | (266 | ) | (263 | ) | (264 | ) | |||||||||
Cash interest expense | 4,508 | 4,247 | 4,206 | 4,034 | 3,954 | ||||||||||||||
Scheduled principal payments | 222 | 301 | 300 | 234 | 102 | ||||||||||||||
Preferred stock dividends | 1,322 | 1,322 | 1,322 | 661 | — | ||||||||||||||
Fixed charges | $ | 6,052 | $ | 5,870 | $ | 5,828 | $ | 4,929 | $ | 4,056 | |||||||||
Fixed Charge Coverage Ratio | 3.2 | x | 3.1 | x | 3.2 | x | 3.4 | x | 3.7 | x | |||||||||
Funds from Operations (FFO): We calculate FFO in accordance with the standards established by the National Association of Real Estate Investment Trusts (“NAREIT”). FFO represents net income (loss) (computed in accordance with GAAP), excluding gains (or losses) from sales of depreciable operating property, impairment losses, real estate related depreciation and amortization (excluding amortization of deferred financing costs) and after adjustments for unconsolidated partnerships and joint ventures. Management uses FFO as a supplemental performance measure because, in excluding real estate related depreciation and amortization, gains and losses from property dispositions, other than temporary impairments of unconsolidated real estate entities, and impairment on our investment in real estate, it provides a performance measure that, when compared year over year, captures trends in occupancy rates, rental rates and operating costs. We also believe that, as a widely recognized measure of performance used by other REITs, FFO may be used by investors as a basis to compare our operating performance with that of other REITs. However, because FFO excludes depreciation and amortization and captures neither the changes in the value of our properties that result from use or market conditions nor the level of capital expenditures and leasing commissions necessary to maintain the operating performance of our properties, all of which have real economic effects and could materially impact our results from operations, the utility of FFO as a measure of our performance is limited. Other equity REITs may not calculate or interpret FFO in accordance with the NAREIT definition as we do, and, accordingly, our FFO may not be comparable to such other REITs’ FFO. FFO should not be used as a measure of our liquidity, and is not indicative of funds available for our cash needs, including our ability to pay dividends. FFO should be considered only as a supplement to net income computed in accordance with GAAP as a measure of our performance.
Net Operating Income (NOI): NOI is a non-GAAP measure which includes the revenue and expense directly attributable to our real estate properties. NOI is calculated as total revenue from real estate operations including i) rental income, ii) tenant reimbursements, and iii) other income less property expenses. We use NOI as a supplemental performance measure because, in excluding real estate depreciation and amortization expense, general and administrative expenses, interest expense, gains (or losses) on sale of real estate and other non-operating items, it provides a performance measure that, when compared year over year, captures trends in occupancy rates, rental rates and operating costs. We also believe that NOI will be useful to investors as a basis to compare our operating performance with that of other REITs. However, because NOI excludes depreciation and amortization expense and captures neither the changes in the value of our properties that result from use or market conditions, nor the level of capital expenditures and leasing commissions necessary to maintain the operating performance of our properties (all of which have real economic effect and could materially impact our results from operations), the utility of NOI as a measure of our performance is limited. Other equity REITs may not calculate NOI in a similar manner and, accordingly, our NOI may not be comparable to such other REITs’ NOI. Accordingly, NOI should be considered only as a supplement to net income as a measure of our performance. NOI should not be used as a measure of our liquidity, nor is it indicative of funds available to fund our cash needs. NOI should not be used as a substitute for cash flow from operating activities in accordance with GAAP. We use NOI to help evaluate the performance of the Company as a whole, as well as the performance of our Same Property Portfolio.
Proforma NOI: Proforma NOI is calculated by adding to NOI the following adjustments: (i) the estimated impact on NOI of uncommenced leases as if they had commenced at the beginning of the reportable period, (ii) the estimated impact on NOI of current period acquisitions as if they had been acquired at the beginning of the reportable period, (iii) the actual NOI of properties sold during the current period and (iv) the estimated incremental NOI from properties that were classified as repositioning/lease-up properties as of the end of the reporting period, assuming that all repositioning work had been completed and the properties/space were fully stabilized as of the beginning of the reportable period. These
Second Quarter 2017 Supplemental Financial Reporting Package | Page 26 | | |
Notes and Definitions. | ||
estimates do not purport to be indicative of what operating results would have been had the acquisitions actually occurred at the beginning of the reportable period and may not be indicative of future operating results.
Properties and Space Under Repositioning: Typically defined as properties or units where a significant amount of space is held vacant in order to implement capital improvements that improve the functionality (not including basic refurbishments, i.e., paint and carpet), cash flow and value of that space. We define a significant amount of space in a building as the lower of (i) 20,000 square feet of space or (ii) 50% of a building’s square footage. Typically, we would include properties or space where the repositioning and lease-up time frame is estimated to be greater than six months. A repositioning is considered complete once the investment is fully or nearly fully deployed and the property is marketable for leasing. We consider a property to be stabilized once it reaches 95% occupancy.
Rent Change - Cash: Compares the first month cash rent excluding any abatement on new leases to the last month rent for the most recent expiring lease. Data included for comparable leases only. Comparable leases generally exclude: (i) space that has never been occupied under our ownership, (ii) repositioned/redeveloped space, (iii) space that has been vacant for over one year, (iv) space with different lease structures (for example a change from a gross lease to a modified gross lease or an increase or decrease in the leased square footage) or (v) lease terms shorter than six months.
Rent Change - GAAP: Compares GAAP rent, which straightlines rental rate increases and abatement, on new leases to GAAP rent for the most recent expiring lease. Data included for comparable leases only. Comparable leases generally exclude: (i) space that has never been occupied under our ownership, (ii) repositioned/redeveloped space, (iii) space that has been vacant for over one year, (iv) space with different lease structures (for example a change from a gross lease to a modified gross lease or an increase or decrease in the leased square footage) or (v) lease terms shorter than six months.
Same Property Portfolio: Our Same Property Portfolio is a subset of our consolidated portfolio and includes properties that were wholly-owned by us as of January 1, 2016, and still owned by us as of June 30, 2017. The Company’s computation of same property performance may not be comparable to other REITs.
Stabilized Same Property Portfolio: Our Stabilized Same Property Portfolio represents the properties included in our Same Property Portfolio, adjusted to exclude space at properties that were in various stages of repositioning or lease-up in connection with a completed repositioning.
Uncommenced Leases: Reflects signed leases that have not yet commenced as of the reporting date.
Second Quarter 2017 Supplemental Financial Reporting Package | Page 27 | | |
Notes and Definitions. | ||
Reconciliation of Net Income to NOI and Cash NOI (in thousands):
Three Months Ended | |||||||||||||||||||
Jun 30, 2017 | Mar 31, 2017 | Dec 31, 2016 | Sep 30, 2016 | Jun 30, 2016 | |||||||||||||||
Net Income | $ | 19,855 | $ | 5,721 | $ | 8,546 | $ | 3,061 | $ | 12,792 | |||||||||
Add: | |||||||||||||||||||
General and administrative | 5,123 | 5,086 | 4,225 | 5,067 | 4,521 | ||||||||||||||
Depreciation and amortization | 14,515 | 13,599 | 14,242 | 13,341 | 12,610 | ||||||||||||||
Acquisition expenses | 20 | 385 | 365 | 380 | 635 | ||||||||||||||
Interest expense | 4,302 | 3,998 | 4,074 | 3,804 | 3,716 | ||||||||||||||
Loss on extinguishment of debt | — | 22 | — | — | — | ||||||||||||||
Subtract: | |||||||||||||||||||
Management, leasing, and development services | 145 | 126 | 97 | 131 | 111 | ||||||||||||||
Interest income | 218 | 227 | 231 | 228 | — | ||||||||||||||
Equity in income from unconsolidated real estate entities | — | 11 | — | 1,328 | 62 | ||||||||||||||
Gains on sale of real estate | 16,569 | 2,668 | 5,814 | — | 11,563 | ||||||||||||||
NOI | $ | 26,883 | $ | 25,779 | $ | 25,310 | $ | 23,966 | $ | 22,538 | |||||||||
Straight line rental revenue adjustment | (996 | ) | (956 | ) | (1,095 | ) | (1,395 | ) | (922 | ) | |||||||||
Net fair value lease revenue (expense) | (201 | ) | (117 | ) | (95 | ) | (39 | ) | 60 | ||||||||||
Cash NOI | $ | 25,686 | $ | 24,706 | $ | 24,120 | $ | 22,532 | $ | 21,676 | |||||||||
Reconciliation of Net Income to Same Property Portfolio NOI and Same Property Portfolio Cash NOI (in thousands):
Three Months Ended June 30, | Six months ended June 30, | ||||||||||
2017 | 2016 | 2017 | 2016 | ||||||||
Net income | 19,855 | 12,792 | 25,576 | 14,269 | |||||||
Add: | |||||||||||
General and administrative | 5,123 | 4,521 | 10,209 | 8,123 | |||||||
Depreciation and amortization | 14,515 | 12,610 | 28,114 | 23,824 | |||||||
Acquisition expenses | 20 | 635 | 405 | 1,110 | |||||||
Interest expense | 4,302 | 3,716 | 8,300 | 6,970 | |||||||
Loss on extinguishment of debt | — | — | 22 | — | |||||||
Deduct: | |||||||||||
Management, leasing and development services | 145 | 111 | 271 | 245 | |||||||
Interest income | 218 | — | 445 | — | |||||||
Equity in income from unconsolidated real estate entities | — | 62 | 11 | 123 | |||||||
Gains on sale of real estate | 16,569 | 11,563 | 19,237 | 11,563 | |||||||
NOI | 26,883 | 22,538 | 52,662 | 42,365 | |||||||
Non-Same Property Portfolio operating revenues | (8,023 | ) | (4,241 | ) | (14,889 | ) | (5,378 | ) | |||
Non-Same Property Portfolio property expenses | 1,896 | 1,181 | 3,622 | 1,545 | |||||||
Same Property Portfolio NOI | 20,756 | 19,478 | 41,395 | 38,532 | |||||||
Straight line rental revenue adjustment | (738 | ) | (436 | ) | (1,421 | ) | (1,290 | ) | |||
Amort. above/below market leases | 92 | 90 | 173 | 83 | |||||||
Same Property Portfolio Cash NOI | 20,110 | 19,132 | 40,147 | 37,325 | |||||||
Second Quarter 2017 Supplemental Financial Reporting Package | Page 28 | | |