Attached files
| file | filename |
|---|---|
| EX-99.1 - EX-99.1 - Frontier Communications Parent, Inc. | d431853dex991.htm |
| 8-K - FORM 8-K - Frontier Communications Parent, Inc. | d431853d8k.htm |

Investor Update Second Quarter 2017 August 1, 2017 Exhibit 99.2
Strategic and Operational Review Daniel McCarthy President & Chief Executive Officer
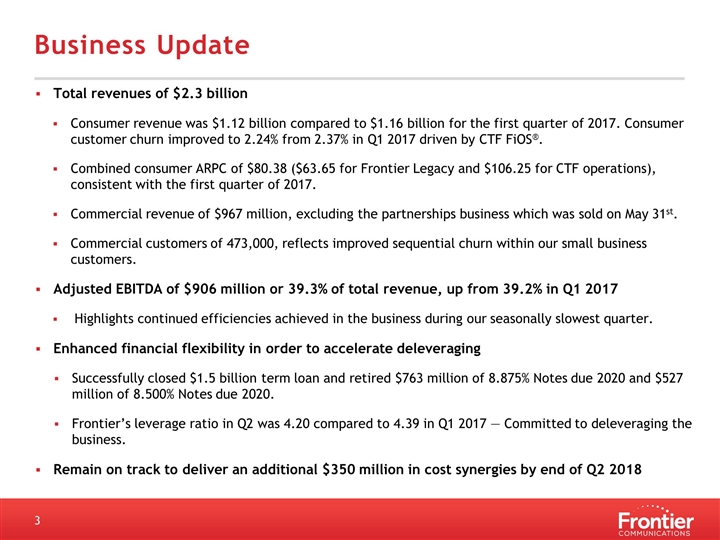
Business Update Total revenues of $2.3 billion Consumer revenue was $1.12 billion compared to $1.16 billion for the first quarter of 2017. Consumer customer churn improved to 2.24% from 2.37% in Q1 2017 driven by CTF FiOS®. Combined consumer ARPC of $80.38 ($63.65 for Frontier Legacy and $106.25 for CTF operations), consistent with the first quarter of 2017. Commercial revenue of $967 million, excluding the partnerships business which was sold on May 31st. Commercial customers of 473,000, reflects improved sequential churn within our small business customers. Adjusted EBITDA of $906 million or 39.3% of total revenue, up from 39.2% in Q1 2017 Highlights continued efficiencies achieved in the business during our seasonally slowest quarter. Enhanced financial flexibility in order to accelerate deleveraging Successfully closed $1.5 billion term loan and retired $763 million of 8.875% Notes due 2020 and $527 million of 8.500% Notes due 2020. Frontier’s leverage ratio in Q2 was 4.20 compared to 4.39 in Q1 2017 — Committed to deleveraging the business. Remain on track to deliver an additional $350 million in cost synergies by end of Q2 2018
Financial Review Perley McBride Executive Vice President & Chief Financial Officer
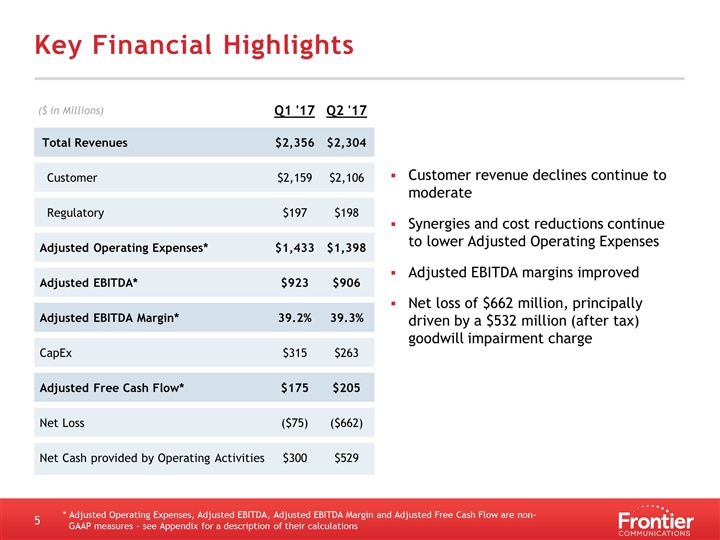
Key Financial Highlights * Adjusted Operating Expenses, Adjusted EBITDA, Adjusted EBITDA Margin and Adjusted Free Cash Flow are non-GAAP measures - see Appendix for a description of their calculations Customer revenue declines continue to moderate Synergies and cost reductions continue to lower Adjusted Operating Expenses Adjusted EBITDA margins improved Net loss of $662 million, principally driven by a $532 million (after tax) goodwill impairment charge ($ in Millions) Q1 '17 Q2 '17 Total Revenues $2,356 $2,304 Customer $2,159 $2,106 Regulatory $197 $198 Adjusted Operating Expenses* $1,433 $1,398 Adjusted EBITDA* $923 $906 Adjusted EBITDA Margin* 39.2% 39.3% CapEx $315 $263 Adjusted Free Cash Flow* $175 $205 Net Loss ($75) ($662) Net Cash provided by Operating Activities $300 $529
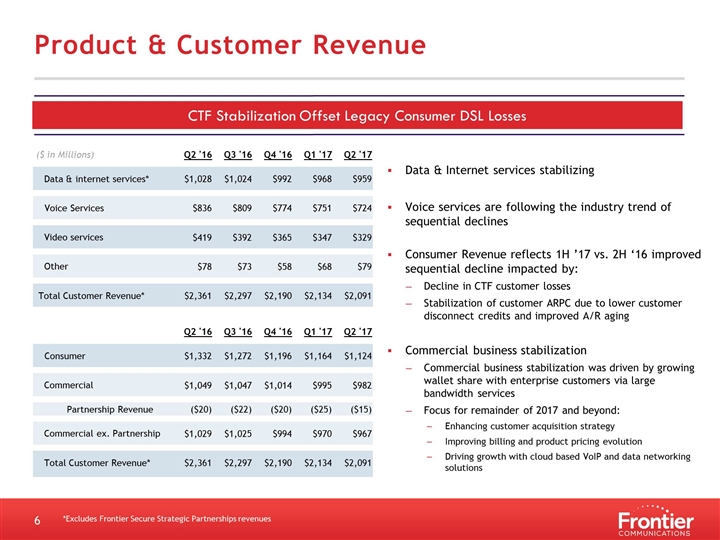
($ in Millions) Q2 '16 Q3 '16 Q4 '16 Q1 '17 Q2 '17 Data & internet services* $1,028 $1,024 $992 $968 $959 Voice Services $836 $809 $774 $751 $724 Video services $419 $392 $365 $347 $329 Other $78 $73 $58 $68 $79 Total Customer Revenue* $2,361 $2,297 $2,190 $2,134 $2,091 Q2 '16 Q3 '16 Q4 '16 Q1 '17 Q2 '17 Consumer $1,332 $1,272 $1,196 $1,164 $1,124 Commercial $1,049 $1,047 $1,014 $995 $982 Partnership Revenue ($20) ($22) ($20) ($25) ($15) Commercial ex. Partnership $1,029 $1,025 $994 $970 $967 Total Customer Revenue* $2,361 $2,297 $2,190 $2,134 $2,091 Product & Customer Revenue CTF Stabilization Offset Legacy Consumer DSL Losses Data & Internet services stabilizing Voice services are following the industry trend of sequential declines Consumer Revenue reflects 1H ’17 vs. 2H ‘16 improved sequential decline impacted by: Decline in CTF customer losses Stabilization of customer ARPC due to lower customer disconnect credits and improved A/R aging Commercial business stabilization Commercial business stabilization was driven by growing wallet share with enterprise customers via large bandwidth services Focus for remainder of 2017 and beyond: Enhancing customer acquisition strategy Improving billing and product pricing evolution Driving growth with cloud based VoIP and data networking solutions *Excludes Frontier Secure Strategic Partnerships revenues
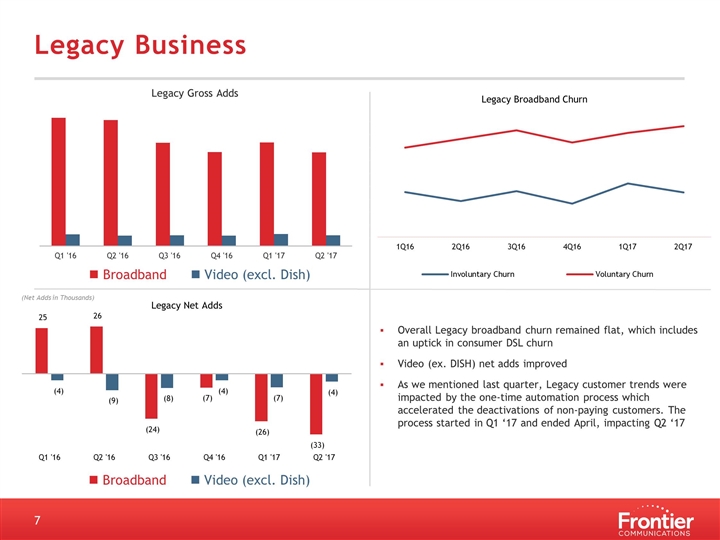
Legacy Business n Broadband n Video (excl. Dish) Overall Legacy broadband churn remained flat, which includes an uptick in consumer DSL churn Video (ex. DISH) net adds improved As we mentioned last quarter, Legacy customer trends were impacted by the one-time automation process which accelerated the deactivations of non-paying customers. The process started in Q1 ‘17 and ended April, impacting Q2 ‘17 n Broadband n Video (excl. Dish) (Net Adds in Thousands)
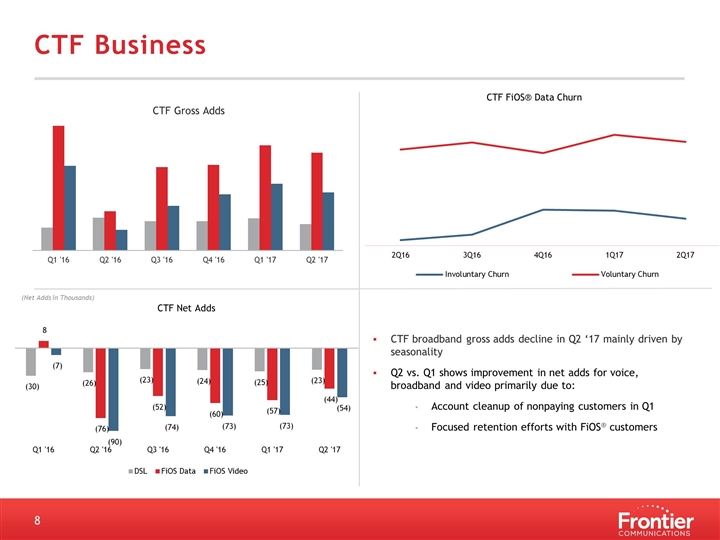
CTF Business CTF broadband gross adds decline in Q2 ‘17 mainly driven by seasonality Q2 vs. Q1 shows improvement in net adds for voice, broadband and video primarily due to: Account cleanup of nonpaying customers in Q1 Focused retention efforts with FiOS® customers (Net Adds in Thousands)
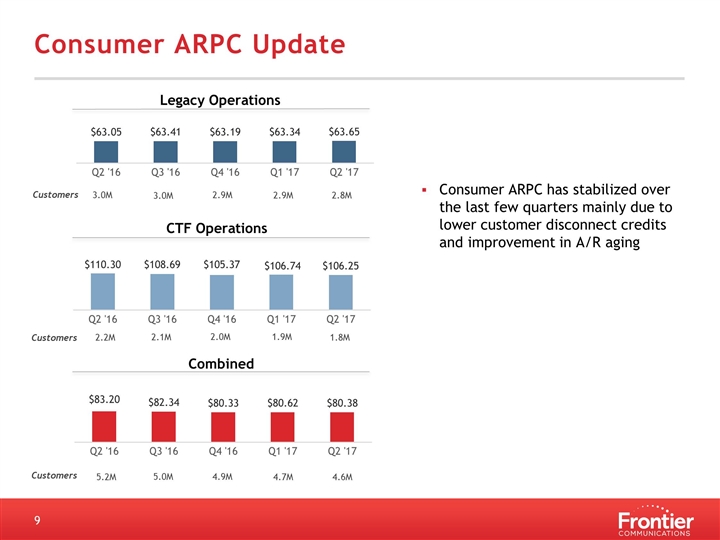
Consumer ARPC Update 3.0M 2.9M 2.8M Customers 2.9M 3.0M Legacy Operations CTF Operations 2.1M 1.9M 1.8M 2.0M Customers 5.0M 4.7M 4.6M Customers 4.9M Combined Consumer ARPC has stabilized over the last few quarters mainly due to lower customer disconnect credits and improvement in A/R aging 2.2M 5.2M
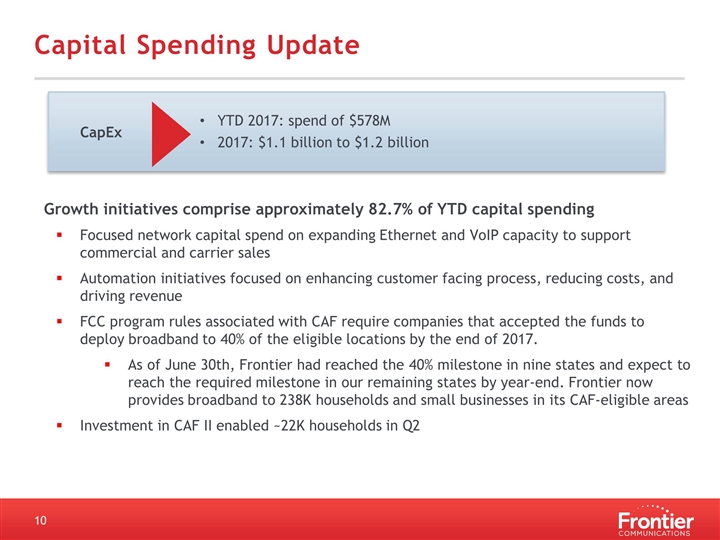
Capital Spending Update Growth initiatives comprise approximately 82.7% of YTD capital spending Focused network capital spend on expanding Ethernet and VoIP capacity to support commercial and carrier sales Automation initiatives focused on enhancing customer facing process, reducing costs, and driving revenue FCC program rules associated with CAF require companies that accepted the funds to deploy broadband to 40% of the eligible locations by the end of 2017. As of June 30th, Frontier had reached the 40% milestone in nine states and expect to reach the required milestone in our remaining states by year-end. Frontier now provides broadband to 238K households and small businesses in its CAF-eligible areas Investment in CAF II enabled ~22K households in Q2 YTD 2017: spend of $578M 2017: $1.1 billion to $1.2 billion CapEx
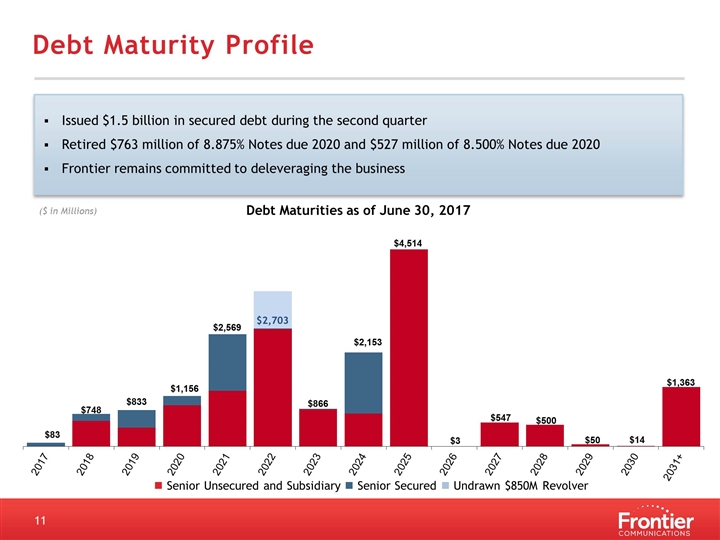
Debt Maturity Profile Issued $1.5 billion in secured debt during the second quarter Retired $763 million of 8.875% Notes due 2020 and $527 million of 8.500% Notes due 2020 Frontier remains committed to deleveraging the business Debt Maturities as of June 30, 2017 ($ in Millions) n Senior Unsecured and Subsidiary n Senior Secured n Undrawn $850M Revolver
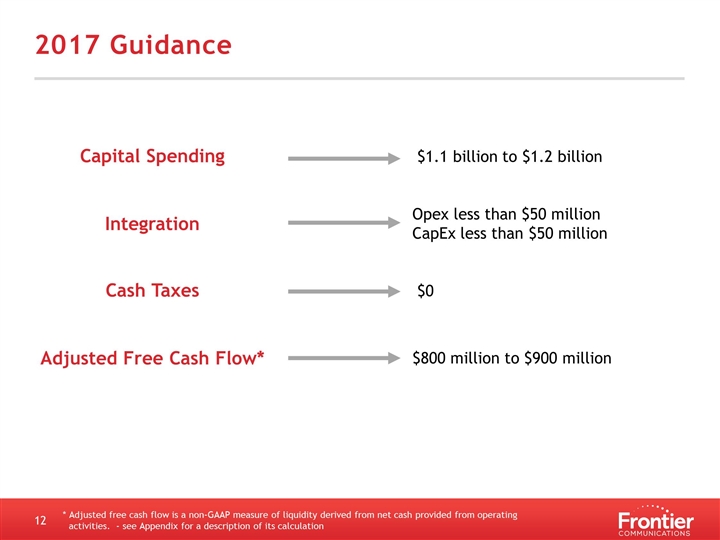
Capital Spending $1.1 billion to $1.2 billion Integration Opex less than $50 million CapEx less than $50 million Cash Taxes $0 Adjusted Free Cash Flow* $800 million to $900 million 2017 Guidance * Adjusted free cash flow is a non-GAAP measure of liquidity derived from net cash provided from operating activities. - see Appendix for a description of its calculation
Well Positioned to Deliver Significant Value Strong assets and significant market opportunities Fiber-rich network with substantial organic growth potential Approximately 4.5 million FTTH capable households Substantial FTTN capabilities: nearly 1 million households capable of 100 Mbps and nearly 6 million households capable of 25 Mbps or greater More than 180,000 fiber route-miles Opportunities in Commercial, including penetration of existing lit buildings Approximately 39,000 fiber connected commercial buildings Clear strategy to improve operational and financial performance Upgrading systems to improve customer experience and create efficiencies Exceeding synergy targets through additional efficiency opportunities over next two years Revenue trajectory improving and in line with second half stability guidance Strengthened Financial Flexibility Actively managing capital structure to reduce interest expense and extend maturities

Appendix
Safe Harbor Statement Forward-looking language This earnings release contains "forward-looking statements," related to future, not past, events. Forward-looking statements address our expected future business and financial performance and financial condition, and contain words such as "expect," "anticipate," "intend," "plan," "believe," "seek," "see," "will," "would," or "target." Forward-looking statements by their nature address matters that are, to different degrees, uncertain. For us, particular uncertainties that could cause our actual results to be materially different than those expressed in our forward-looking statements include: competition from cable, wireless and wireline carriers, satellite, and OTT companies, and the risk that we will not respond on a timely or profitable basis; our ability to successfully adjust to changes in the communications industry, including the effects of technological changes and competition on our capital expenditures, products and service offerings; our ability to implement successfully our organizational structure changes; risks related to the operation of properties acquired from Verizon, including our ability to retain or obtain customers in those markets, our ability to realize anticipated cost savings, and our ability to meet commitments made in connection with the acquisition; reductions in revenue from our voice customers that we cannot offset with increases in revenue from broadband and video subscribers and sales of other products and services; our ability to maintain relationships with customers, employees or suppliers; our ability to attract/retain key talent; the impact of regulation and regulatory, investigative and legal proceedings and legal compliance risks; continued reductions in switched access revenues as a result of regulation, competition or technology substitutions; the effects of changes in the availability of federal and state universal service funding or other subsidies to us and our competitors; our ability to effectively manage service quality in our territories and meet mandated service quality metrics; our ability to successfully introduce new product offerings; the effects of changes in accounting policies or practices, including potential future impairment charges with respect to our intangible assets; our ability to effectively manage our operations, operating expenses, capital expenditures, debt service requirements and cash paid for income taxes and liquidity, which may affect payment of dividends on our common and preferred shares; the effects of changes in both general and local economic conditions on the markets that we serve; the effects of increased medical expenses and pension and postemployment expenses; the effects of changes in income tax rates, tax laws, regulations or rulings, or federal or state tax assessments; our ability to successfully renegotiate union contracts; changes in pension plan assumptions, interest rates, regulatory rules and/or the value of our pension plan assets, which could require us to make increased contributions to the pension plan in 2017 and beyond; adverse changes in the credit markets; adverse changes in the ratings given to our debt securities by nationally accredited ratings organizations; the availability and cost of financing in the credit markets; covenants in our indentures and credit agreements that may limit our operational and financial flexibility; the effects of state regulatory cash management practices that could limit our ability to transfer cash among our subsidiaries or dividend funds up to the parent company; the effects of severe weather events or other natural or man-made disasters, which may increase our operating expenses or adversely impact customer revenue; the impact of potential information technology or data security breaches or other disruptions; and the risks and other factors contained in our filings with the U.S. Securities and Exchange Commission, including our reports on Forms 10-K and 10-Q. Any of the foregoing events, or other events, could cause our results to vary from management’s forward-looking statements included in this earnings release. These risks and uncertainties may cause our actual future results to be materially different than those expressed in our forward-looking statements. We have no obligation to update or revise these forward-looking statements and do not undertake to do so.
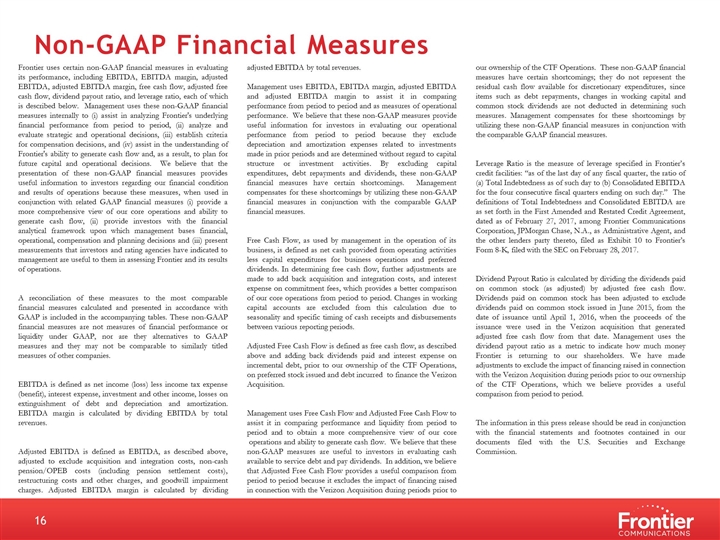
Non-GAAP Financial Measures Frontier uses certain non-GAAP financial measures in evaluating its performance, including EBITDA, EBITDA margin, adjusted EBITDA, adjusted EBITDA margin, free cash flow, adjusted free cash flow, dividend payout ratio, and leverage ratio, each of which is described below. Management uses these non-GAAP financial measures internally to (i) assist in analyzing Frontier's underlying financial performance from period to period, (ii) analyze and evaluate strategic and operational decisions, (iii) establish criteria for compensation decisions, and (iv) assist in the understanding of Frontier's ability to generate cash flow and, as a result, to plan for future capital and operational decisions. We believe that the presentation of these non-GAAP financial measures provides useful information to investors regarding our financial condition and results of operations because these measures, when used in conjunction with related GAAP financial measures (i) provide a more comprehensive view of our core operations and ability to generate cash flow, (ii) provide investors with the financial analytical framework upon which management bases financial, operational, compensation and planning decisions and (iii) present measurements that investors and rating agencies have indicated to management are useful to them in assessing Frontier and its results of operations. A reconciliation of these measures to the most comparable financial measures calculated and presented in accordance with GAAP is included in the accompanying tables. These non-GAAP financial measures are not measures of financial performance or liquidity under GAAP, nor are they alternatives to GAAP measures and they may not be comparable to similarly titled measures of other companies. EBITDA is defined as net income (loss) less income tax expense (benefit), interest expense, investment and other income, losses on extinguishment of debt and depreciation and amortization. EBITDA margin is calculated by dividing EBITDA by total revenues. Adjusted EBITDA is defined as EBITDA, as described above, adjusted to exclude acquisition and integration costs, non-cash pension/OPEB costs (including pension settlement costs), restructuring costs and other charges, and goodwill impairment charges. Adjusted EBITDA margin is calculated by dividing adjusted EBITDA by total revenues. Management uses EBITDA, EBITDA margin, adjusted EBITDA and adjusted EBITDA margin to assist it in comparing performance from period to period and as measures of operational performance. We believe that these non-GAAP measures provide useful information for investors in evaluating our operational performance from period to period because they exclude depreciation and amortization expenses related to investments made in prior periods and are determined without regard to capital structure or investment activities. By excluding capital expenditures, debt repayments and dividends, these non-GAAP financial measures have certain shortcomings. Management compensates for these shortcomings by utilizing these non-GAAP financial measures in conjunction with the comparable GAAP financial measures. Free Cash Flow, as used by management in the operation of its business, is defined as net cash provided from operating activities less capital expenditures for business operations and preferred dividends. In determining free cash flow, further adjustments are made to add back acquisition and integration costs, and interest expense on commitment fees, which provides a better comparison of our core operations from period to period. Changes in working capital accounts are excluded from this calculation due to seasonality and specific timing of cash receipts and disbursements between various reporting periods. Adjusted Free Cash Flow is defined as free cash flow, as described above and adding back dividends paid and interest expense on incremental debt, prior to our ownership of the CTF Operations, on preferred stock issued and debt incurred to finance the Verizon Acquisition. Management uses Free Cash Flow and Adjusted Free Cash Flow to assist it in comparing performance and liquidity from period to period and to obtain a more comprehensive view of our core operations and ability to generate cash flow. We believe that these non-GAAP measures are useful to investors in evaluating cash available to service debt and pay dividends. In addition, we believe that Adjusted Free Cash Flow provides a useful comparison from period to period because it excludes the impact of financing raised in connection with the Verizon Acquisition during periods prior to our ownership of the CTF Operations. These non-GAAP financial measures have certain shortcomings; they do not represent the residual cash flow available for discretionary expenditures, since items such as debt repayments, changes in working capital and common stock dividends are not deducted in determining such measures. Management compensates for these shortcomings by utilizing these non-GAAP financial measures in conjunction with the comparable GAAP financial measures. Leverage Ratio is the measure of leverage specified in Frontier’s credit facilities: “as of the last day of any fiscal quarter, the ratio of (a) Total Indebtedness as of such day to (b) Consolidated EBITDA for the four consecutive fiscal quarters ending on such day.” The definitions of Total Indebtedness and Consolidated EBITDA are as set forth in the First Amended and Restated Credit Agreement, dated as of February 27, 2017, among Frontier Communications Corporation, JPMorgan Chase, N.A., as Administrative Agent, and the other lenders party thereto, filed as Exhibit 10 to Frontier’s Form 8-K, filed with the SEC on February 28, 2017. Dividend Payout Ratio is calculated by dividing the dividends paid on common stock (as adjusted) by adjusted free cash flow. Dividends paid on common stock has been adjusted to exclude dividends paid on common stock issued in June 2015, from the date of issuance until April 1, 2016, when the proceeds of the issuance were used in the Verizon acquisition that generated adjusted free cash flow from that date. Management uses the dividend payout ratio as a metric to indicate how much money Frontier is returning to our shareholders. We have made adjustments to exclude the impact of financing raised in connection with the Verizon Acquisition during periods prior to our ownership of the CTF Operations, which we believe provides a useful comparison from period to period. The information in this press release should be read in conjunction with the financial statements and footnotes contained in our documents filed with the U.S. Securities and Exchange Commission.
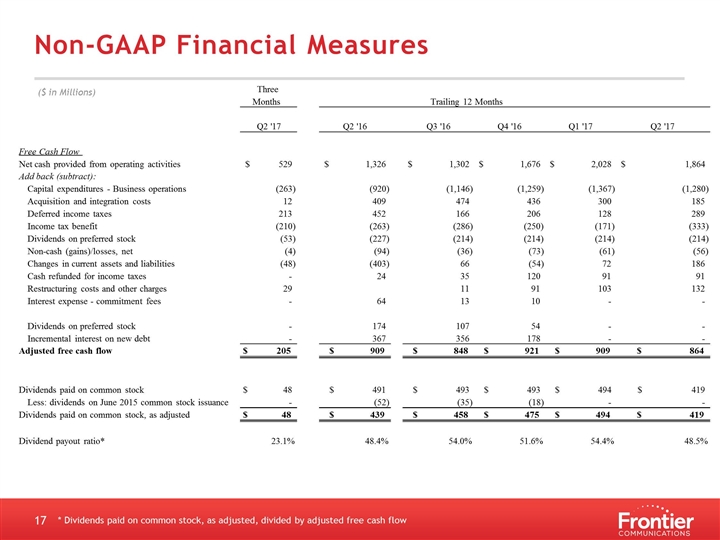
Non-GAAP Financial Measures * Dividends paid on common stock, as adjusted, divided by adjusted free cash flow ($ in Millions) Free Cash Flow Net cash provided from operating activities $ 529 $ 1,326 $ 1,302 $ 1,676 $ 2,028 $ 1,864 Add back (subtract): Capital expenditures - Business operations (263) (920) (1,146) (1,259) (1,367) (1,280) Acquisition and integration costs 12 409 474 436 300 185 Deferred income taxes 213 452 166 206 128 289 Income tax benefit (210) (263) (286) (250) (171) (333) Dividends on preferred stock (53) (227) (214) (214) (214) (214) Non-cash (gains)/losses, net (4) (94) (36) (73) (61) (56) Changes in current assets and liabilities (48) (403) 66 (54) 72 186 Cash refunded for income taxes - 24 35 120 91 91 Restructuring costs and other charges 29 11 91 103 132 Interest expense - commitment fees - 64 13 10 - - Dividends on preferred stock - 174 107 54 - - Incremental interest on new debt - 367 356 178 - - Adjusted free cash flow $ 205 $ 909 $ 848 $ 921 $ 909 $ 864 Dividends paid on common stock $ 48 $ 491 $ 493 $ 493 $ 494 $ 419 Less: dividends on June 2015 common stock issuance - (52) (35) (18) - - Dividends paid on common stock, as adjusted $ 48 $ 439 $ 458 $ 475 $ 494 $ 419 Dividend payout ratio* 23.1% 48.4% 54.0% 51.6% 54.4% 48.5% Q2 '17 Q1 '17 Trailing 12 Months Three Months Q2 '17 Q4 '16 Q3 '16 Q2 '16
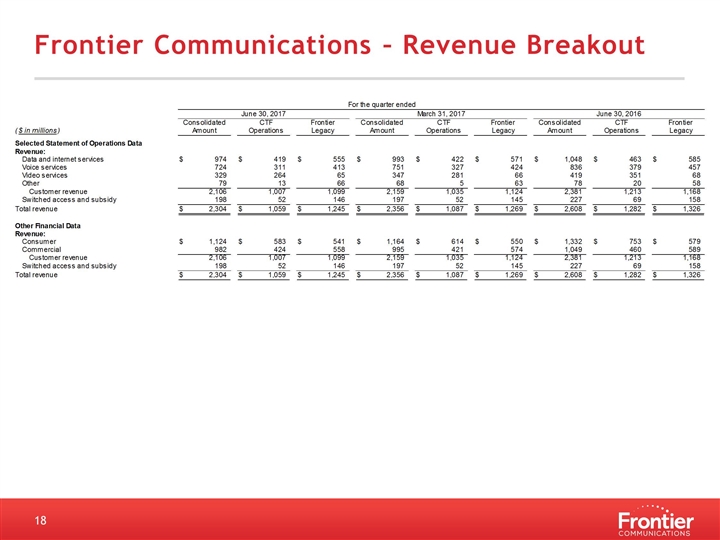
Frontier Communications – Revenue Breakout
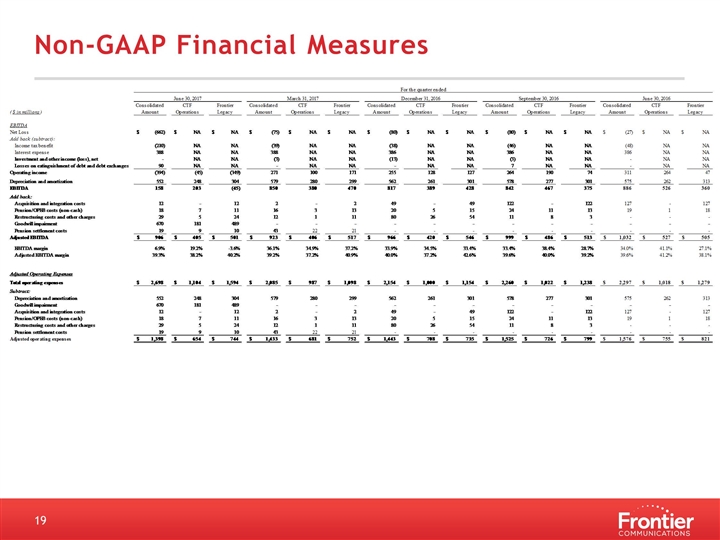
Non-GAAP Financial Measures
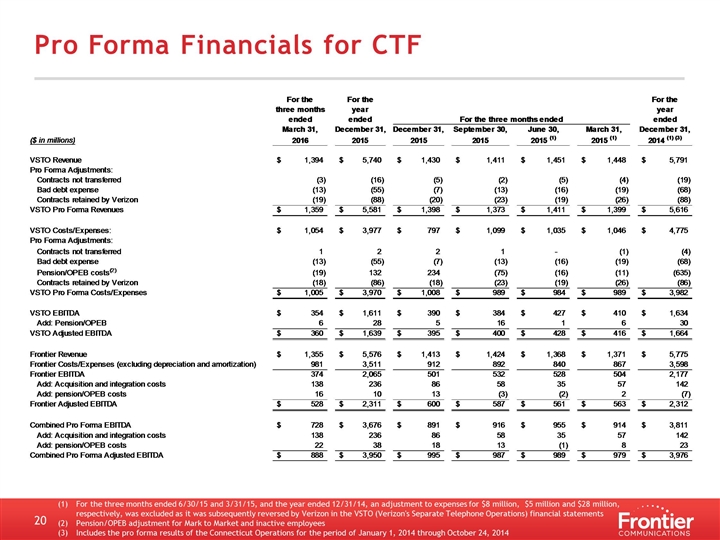
Pro Forma Financials for CTF For the three months ended 6/30/15 and 3/31/15, and the year ended 12/31/14, an adjustment to expenses for $8 million, $5 million and $28 million, respectively, was excluded as it was subsequently reversed by Verizon in the VSTO (Verizon's Separate Telephone Operations) financial statements Pension/OPEB adjustment for Mark to Market and inactive employees Includes the pro forma results of the Connecticut Operations for the period of January 1, 2014 through October 24, 2014
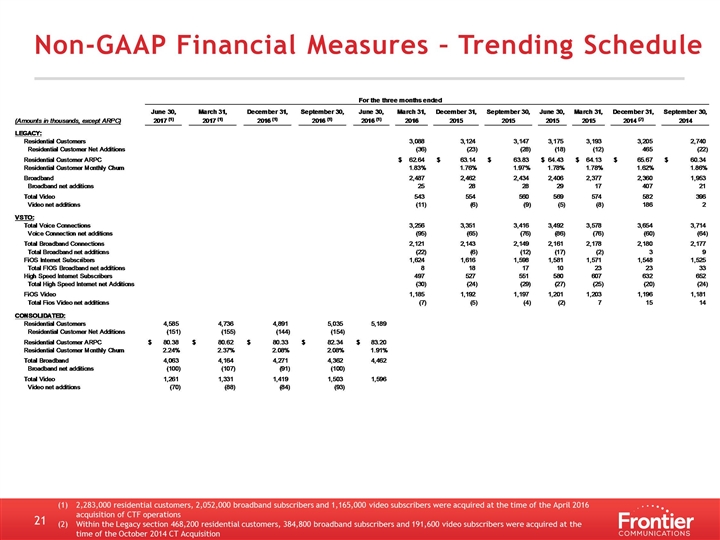
Non-GAAP Financial Measures – Trending Schedule 2,283,000 residential customers, 2,052,000 broadband subscribers and 1,165,000 video subscribers were acquired at the time of the April 2016 acquisition of CTF operations Within the Legacy section 468,200 residential customers, 384,800 broadband subscribers and 191,600 video subscribers were acquired at the time of the October 2014 CT Acquisition
