Attached files
| file | filename |
|---|---|
| EX-99.2 - EXHIBIT 99.2 - FEDERAL HOME LOAN MORTGAGE CORP | d426851dex992.htm |
| 8-K - 8-K - FEDERAL HOME LOAN MORTGAGE CORP | d426851d8k.htm |
Exhibit 99.1

|

|
Freddie Mac Reports Net Income of $1.7 Billion and
Comprehensive Income of $2.0 Billion for Second Quarter 2017
The Company is Focused on Effectively Delivering on its Mission and has Returned over $108 Billion to Taxpayers since 2008
| Second Quarter 2017 Financial Results
• Comprehensive income of $2.0 billion; Net income of $1.7 billion o GAAP net interest income of $3.4 billion; Adjusted net interest income(1) of $1.2 billion – both remained relatively stable when compared to the prior year, despite the mandated decline in the mortgage-related investments portfolio. o GAAP guarantee fee income of $0.2 billion; Adjusted guarantee fee income(1) of $1.7 billion – both increased from the prior year partly driven by continued growth in the guarantee portfolios. o Market-related impacts remained low as market spreads were relatively unchanged and the implementation of hedge accounting offset most net losses arising from changes in interest rates.
|
Comprehensive Income 2Q 2017 = $2.0B | |||
| Total Guarantee Portfolio Up 6% from 2Q 2016 | ||||
| Available PSPA Funding 2Q 2017 = $140.5B |
| Second Quarter 2017 Business Highlights |
||||||
|
|
Continued Solid Business Environment and Growing Guarantee Businesses • Total guarantee portfolio increased to $1,958 billion at June 30, 2017; up 6 percent from a year ago. • Total investments portfolio declined to $366 billion at June 30, 2017; down 11 percent from a year ago. o Total mortgage-related investments portfolio declined to $284 billion at June 30, 2017; down 12 percent from a year ago.
Delivering on Our Mission • Provided approximately $190 billion in liquidity to the mortgage market during the first six months of 2017. Expanded access to affordable housing: funding for first-time homebuyers, as a percentage of new purchases, continued at a 10-year high and nearly 85 percent of rentals funded were affordable to working families.
Providing Liquidity while Transforming U.S. Housing Finance • Guarantee portfolio increased to $1,784 billion at June 30, 2017; up 4 percent from a year ago.
• Core loan portfolio (after 2008) was 75 percent of the total guarantee portfolio; up 6 percentage points from a year ago. • Purchase volume of $73 billion declined 20 percent from a year ago, as refinancing volumes declined. • Serious delinquency rate of 0.85 percent, down 23 basis points from a year ago; at its lowest point since early 2008. • Transferred a significant portion of the credit risk on nearly $105 billion of loans; have now transferred a portion of the credit risk on nearly 33 percent of the total outstanding single-family credit guarantee portfolio; up from 26 percent a year ago.
Leading the Multifamily Finance Industry • Guarantee portfolio increased to $174 billion at June 30, 2017; up 23 percent from a year ago. • Purchase volume of $14.1 billion increased 50 percent from a year ago due to continued strong market demand. Outstanding loan commitments of $19 billion were also up significantly over the prior year. • Delinquency rate continues near zero at 0.01 percent and has remained below 0.05 percent since early 2014. • Transferred a large majority of the credit risk on $12.3 billion of loans in the second quarter of 2017 and over $200 billion of loans since the program’s inception in 2009. |
“Our continued very solid financial results and strong business fundamentals reflect the company’s transformation into a well-run commercial enterprise. This transformation is enabling us to better deliver on the mission that is our purpose – to provide liquidity, stability and affordability to the American primary mortgage market. We’re doing that by helping lenders of all sizes compete which, in turn, expands affordable housing opportunities for borrowers and renters nationwide. Additionally, through our award-winning credit risk transfer programs, we’re fulfilling our mission with much less risk to taxpayers than in the past.
“We at Freddie Mac are proud of the work we’re doing and proud of the success we’re having in making home possible for millions of Americans and in building a better housing finance system.”
Donald H. Layton Chief Executive Officer |


1See Non-GAAP Financial Measure Highlights on pages 5-6 and 15-16 of this press release for additional details and
reconciliations to the comparable amounts under GAAP.
Multifamily Single-family Guarantee Corporate
Freddie Mac Second Quarter 2017 Financial Results
August 1, 2017
Page 2
McLean, VA — Freddie Mac (OTCQB: FMCC) today reported net income of $1.7 billion for the second quarter of 2017, compared to net income of $2.2 billion for the first quarter of 2017. The company also reported comprehensive income of $2.0 billion for the second quarter of 2017, compared to comprehensive income of $2.2 billion for the first quarter of 2017.
Summary Consolidated Statements of Comprehensive Income
| ($ Millions) | 2Q 2017 | 1Q 2017 | Change | 2Q 2016 | Change | |||||||||||||||||
| 1 | Net interest income | $ | 3,379 | $ | 3,795 | $ | (416 | ) | $ | 3,443 | $ | (64 | ) | |||||||||
| 2 | Benefit (provision) for credit losses | 422 | 116 | 306 | 775 | (353 | ) | |||||||||||||||
| 3 | Derivative gains (losses) | (1,096 | ) | (302 | ) | (794 | ) | (2,058 | ) | 962 | ||||||||||||
| 4 | Other non-interest income (loss) (1) | 802 | 676 | 126 | 234 | 568 | ||||||||||||||||
|
|
|
|
|
|
|
|
|
|
|
|||||||||||||
| 5 | Non-interest income | (294 | ) | 374 | (668 | ) | (1,824 | ) | 1,530 | |||||||||||||
| 6 | Administrative expense | (513 | ) | (511 | ) | (2 | ) | (475 | ) | (38 | ) | |||||||||||
| 7 | Other non-interest expense | (493 | ) | (453 | ) | (40 | ) | (460 | ) | (33 | ) | |||||||||||
|
|
|
|
|
|
|
|
|
|
|
|||||||||||||
| 8 | Non-interest expense | (1,006 | ) | (964 | ) | (42 | ) | (935 | ) | (71 | ) | |||||||||||
| 9 | Pre-tax income | 2,501 | 3,321 | (820 | ) | 1,459 | 1,042 | |||||||||||||||
| 10 | Income tax expense | (837 | ) | (1,110 | ) | 273 | (466 | ) | (371 | ) | ||||||||||||
|
|
|
|
|
|
|
|
|
|
|
|||||||||||||
| 11 | Net income | $ | 1,664 | $ | 2,211 | $ | (547 | ) | $ | 993 | $ | 671 | ||||||||||
| 12 | Total other comprehensive income (loss) | 322 | 23 | 299 | 140 | 182 | ||||||||||||||||
|
|
|
|
|
|
|
|
|
|
|
|||||||||||||
| 13 | Comprehensive income | $ | 1,986 | $ | 2,234 | $ | (248 | ) | $ | 1,133 | $ | 853 | ||||||||||
|
|
|
|
|
|
|
|
|
|
|
|||||||||||||
| Memo Item | ||||||||||||||||||||||
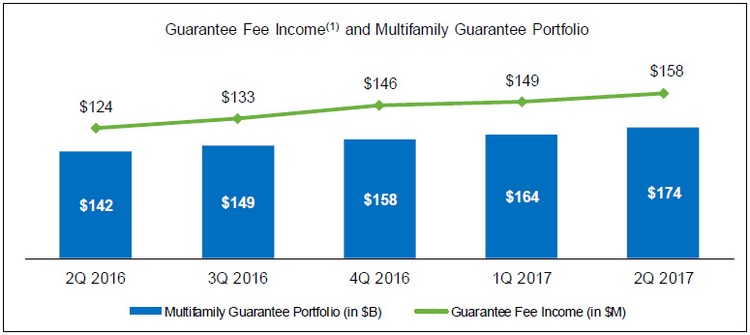
| 14 | Guarantee fee income(1) | $ | 158 | $ | 149 | $ | 9 | $ | 124 | $ | 34 | |||||||||||
| (1) | Guarantee fee income on a GAAP basis is primarily from the company’s multifamily business and is included in Other income (loss) on Freddie Mac’s condensed consolidated statements of comprehensive income. |
Financial Results Discussion
Freddie Mac’s second quarter 2017 net income of $1.7 billion and comprehensive income of $2.0 billion decreased $0.5 billion and $0.2 billion, respectively, from the first quarter of 2017. The company’s quarter-over-quarter earnings were relatively stable as market-related impacts remained low.
| ● | Net Interest Rate Effect: $0.1 billion (after-tax) estimated fair value loss for the second quarter of 2017 driven by slight decreases in interest rates, compared to near zero (after-tax) estimated fair value gain for the first quarter of 2017 driven by slight increases in interest rates. (See Net Interest Rate Effect table for additional details.) |
| ● | Spread Change Effect: $0.1 billion (after-tax) estimated gain for the second quarter of 2017, comparable to the $0.1 billion (after-tax) estimated gain for the first quarter of 2017, as market spreads were relatively unchanged from the first quarter of 2017. |
Freddie Mac Second Quarter 2017 Financial Results
August 1, 2017
Page 3
Net Interest Rate Effect
| ($ Billions) | 2Q 2017 | 1Q 2017 | Change | 2Q 2016 | Change | |||||||||||||||||
| 1 | Interest rate effect on derivative fair values | $ | (1.1 | ) | $ | 0.5 | $ | (1.6 | ) | $ | (1.7 | ) | $ | 0.6 | ||||||||
| 2 | Estimate of offsetting interest rate effect related to financial instruments measured at fair value(1) | 0.5 | (0.5 | ) | 1.0 | 1.0 | (0.5 | ) | ||||||||||||||
| 3 | Gains (losses) on mortgage loans in fair value hedge relationships | 0.4 | — | 0.4 | — | 0.4 | ||||||||||||||||
| 4 | Income tax (expense) benefit | 0.1 | — | 0.1 | 0.3 | (0.2 | ) | |||||||||||||||
|
|
|
|
|
|
|
|
|
|
|
|
||||||||||||
| 5 | Estimated net interest rate effect on comprehensive income (loss) | $ | (0.1 | ) | $ | 0.0 | $ | (0.1 | ) | $ | (0.4 | ) | $ | 0.3 | ||||||||
|
|
|
|
|
|
|
|
|
|
|
|
||||||||||||
| (1) | Includes the interest-rate effect on the company’s trading securities, available-for-sale securities, mortgage loans held-for-sale, and other assets and debt for which the company elected the fair value option, which is reflected in Other non-interest income (loss) and Total other comprehensive income (loss) on Freddie Mac’s condensed consolidated statements of comprehensive income. |
Selected Financial Measures
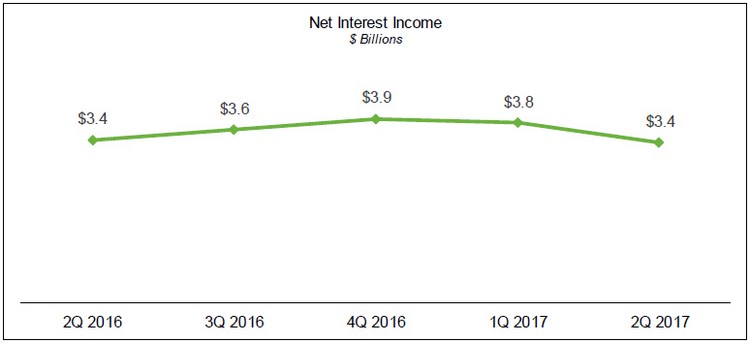
| ● | Net interest income was $3.4 billion for the second quarter of 2017, a decrease of $0.4 billion, or 11 percent, from the first quarter of 2017 and unchanged from the prior year. |
| ◾ | The decrease in net interest income from the prior quarter primarily reflected lower amortization income and a 2 percent decline in the balance of the mortgage-related investments portfolio. |
Freddie Mac Second Quarter 2017 Financial Results
August 1, 2017
Page 4
| (1) | Guarantee fee income on a GAAP basis is primarily from the company’s multifamily business and is included in Other income (loss) on Freddie Mac’s condensed consolidated statements of comprehensive income. |
| ● | Guarantee fee income, primarily from the company’s multifamily business, was $158 million for the second quarter of 2017, increasing $9 million, or 6 percent, from the first quarter of 2017 and $34 million from the prior year. |
| ◾ | The increases in guarantee fee income primarily reflected higher average multifamily guarantee portfolio balances. |
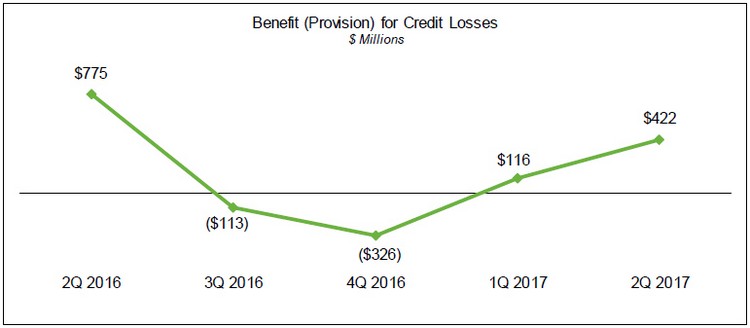
| ● | Benefit for credit losses was $422 million, an increase of $306 million from the first quarter of 2017 and a decrease of $353 million from the prior year. |
| ◾ | The increase in benefit for credit losses from the prior quarter primarily reflected a significant increase in the number of reperforming loans reclassified from held-for-investment to held-for-sale as the company continued to focus on reducing the balance of its less liquid assets. |
| ◾ | The decrease in benefit for credit losses from the prior year primarily resulted from smaller improvements in probability of default and estimated loss severity in the second quarter of 2017, |
Freddie Mac Second Quarter 2017 Financial Results
August 1, 2017
Page 5
compared to larger improvements in probability of default and estimated loss severity in the second quarter of 2016.
Non-GAAP Financial Measure Highlights
In addition to analyzing the company’s results on a GAAP basis, management reviews certain financial measures on an “adjusted”, or non-GAAP, basis. The adjusted, or non-GAAP, financial measures are calculated by reclassifying certain credit guarantee-related activities and investment-related activities between various line items on the company’s GAAP condensed consolidated statements of comprehensive income. Management believes the non-GAAP financial measures are useful because they more clearly explain the company’s sources of revenue. The company does not present adjusted measures for net income or comprehensive income.
| ● | The company’s GAAP net interest income includes the spread earned on its investments activities plus the guarantee fees earned by its single-family business. GAAP guarantee fees are primarily those generated by its multifamily business. |
| ◾ | Adjusted net interest income is the net spread earned on the company’s investments activities, including the cost of funds associated with using derivatives. |
| ◾ | Adjusted guarantee fee income consists of the revenues from guarantee fees from both the single-family and multifamily businesses, net of the 10 basis point guarantee fee remitted to Treasury as part of the Temporary Payroll Tax Cut Continuation Act of 2011. |
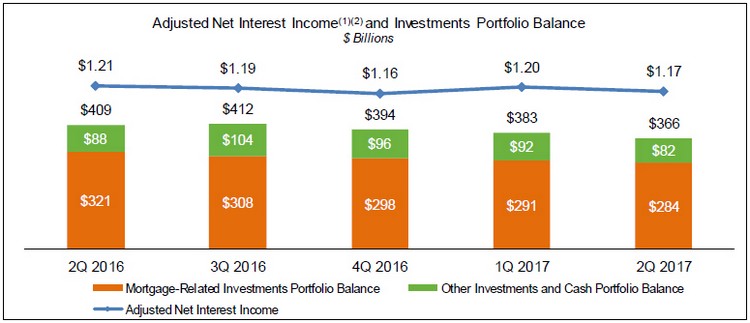
The two graphs that follow show the company’s non-GAAP financial measures – adjusted net interest income and adjusted guarantee fee income.
| (1) | Non-GAAP financial measure. For reconciliations to the comparable amounts under GAAP, see pages 15-16 of this press release. |
| (2) | During the first quarter of 2017, the company discontinued adjustments which reflected the reclassification of amortization of upfront cash paid and received upon acquisitions and issuances of swaptions and options from GAAP derivative gains (losses) to adjusted net interest income. Prior period results have been revised to conform to the current period presentation. |
Note: Amounts may not add due to rounding.
| ● | Adjusted net interest income was $1.17 billion, a decrease of $33 million from the first quarter of 2017 and $41 million from the prior year. |
| ◾ | Adjusted net interest income has remained relatively stable over the last year, despite the expectation of a decline over the long-term, primarily due to higher net interest yield on both other investments and mortgage-related investments. |
Freddie Mac Second Quarter 2017 Financial Results
August 1, 2017
Page 6
| ◾ | The expectation of a decline in adjusted net interest income over the long-term is primarily a result of the company’s ongoing reduction of its mortgage-related investments portfolio in accordance with the requirements of the Purchase Agreement and FHFA. |
| ● | The mortgage-related investments portfolio was $283.7 billion as of June 30, 2017, a decline of $7.5 billion from March 31, 2017. |
| ◾ | The company remains focused on reducing the balance of less liquid assets in this portfolio. The balance of less liquid assets was $109.2 billion as of June 30, 2017, a decline of $8 billion, or 7 percent, from March 31, 2017. |
| o | Less liquid assets include reperforming loans, single-family seriously delinquent loans, and mortgage-related securities not guaranteed by a GSE or the U.S. government. |
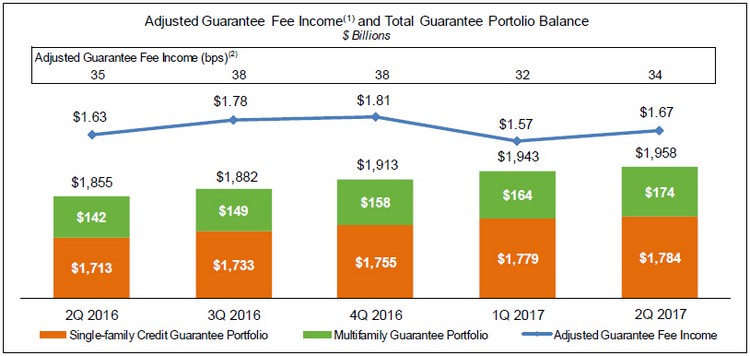
| (1) | Non-GAAP financial measure. For reconciliations to the comparable amounts under GAAP, see pages 15-16 of this press release. |
| (2) | Calculated as annualized quarterly adjusted guarantee fee income divided by the total guarantee portfolio balance. |
Note: Amounts may not add due to rounding.
| ● | Adjusted guarantee fee income was $1.67 billion, an increase of $99 million from the first quarter of 2017 and $43 million from the prior year. |
| ◾ | The increase in adjusted guarantee fee income from the prior quarter primarily reflected higher amortization of single-family upfront fees driven by an increase in loan prepayments during the second quarter of 2017. |
| ◾ | Adjusted guarantee fee income increased slightly when compared to the prior year driven by continued growth in the total guarantee portfolio. |
| o | Adjusted guarantee fee income from contractual guarantee fees is expected to increase over the long-term as guarantee fees on new single-family business are generally higher than the fees received on older vintages that continue to run off. |
| o | Changes in the rates of amortization of single-family upfront fees into income are driven by fluctuating levels of loan prepayments due to changes in interest rates. |
| ◾ | The total guarantee portfolio balance grew to $1,958 billion at June 30, 2017, an increase of $15 billion, or 1 percent, from March 31, 2017 and $103 billion, or 6 percent, from the prior year. |
Freddie Mac Second Quarter 2017 Financial Results
August 1, 2017
Page 7
Segment Financial Results and Business Highlights
Freddie Mac’s operations consist of three reportable segments, which are based on the types of business activities they perform – Single-family Guarantee, Multifamily and Capital Markets (formerly called “Investments”). The company presents Segment Earnings by reclassifying certain credit guarantee-related activities and investment-related activities between various line items on its GAAP condensed consolidated statements of comprehensive income and allocating certain revenues and expenses, including funding costs and administrative expenses, to its three reportable segments. For more information about Segment Earnings, see Note 11 to the financial statements included in the company’s Quarterly Report on Form 10-Q for the three months ended June 30, 2017 and page 16 of this press release.
Single-family Guarantee Segment
Providing liquidity to the U.S. housing market while continuing to transfer credit risk to the private market
Financial Results(1)
| ($ Millions) | 2Q 2017 | 1Q 2017 | Change | 2Q 2016 | Change | |||||||||||||||||
| 1 | Guarantee fee income | $ | 1,506 | $ | 1,418 | $ | 88 | $ | 1,501 | $ | 5 | |||||||||||
| 2 | Benefit (provision) for credit losses | 12 | 39 | (27 | ) | 121 | (109 | ) | ||||||||||||||
| 3 | Administrative expense | (332 | ) | (333 | ) | 1 | (314 | ) | (18 | ) | ||||||||||||
| 4 | Other | (17 | ) | (58 | ) | 41 | (398 | ) | 381 | |||||||||||||
| 5 | Income tax (expense) benefit | (391 | ) | (356 | ) | (35 | ) | (326 | ) | (65 | ) | |||||||||||
|
|
|
|
|
|
|
|
|
|
|
|||||||||||||
| 6 | Segment earnings, net of taxes | 778 | 710 | 68 | 584 | 194 | ||||||||||||||||
| 7 | Total other comprehensive income (loss), net of tax | — | (2 | ) | 2 | (1 | ) | 1 | ||||||||||||||
|
|
|
|
|
|
|
|
|
|
|
|||||||||||||
| 8 | Total comprehensive income | $ | 778 | $ | 708 | $ | 70 | $ | 583 | $ | 195 | |||||||||||
|
|
|
|
|
|
|
|
|
|
|
|||||||||||||
|
|
|
|
|
|
|
|
|
|
|
|||||||||||||
| (1) | The financial performance of the company’s Single-family Guarantee segment is measured based on its contribution to GAAP net income (loss). |
| ● | Single-family Guarantee segment earnings were $778 million for the second quarter of 2017, an increase of $68 million, or approximately 10 percent, from the first quarter of 2017 and $194 million, or 33 percent, from the prior year. |
| ◾ | The increase in segment earnings from the prior quarter primarily reflected higher amortization of upfront fees driven by an increase in loan prepayments during the second quarter of 2017. |
| ◾ | The increase in segment earnings from the prior year was primarily driven by gains due to price improvements on reperforming loans reclassified from held-for-investment to held-for-sale in the second quarter of 2017 compared to losses primarily on seriously delinquent loans reclassified during the second quarter of 2016. |
Business Highlights
| ● | Core loan portfolio (after 2008), which excludes HARP and other relief refinance loans, continued to grow and was 75 percent of the single-family credit guarantee portfolio at June 30, 2017. |
| ● | Average guarantee fees charged on new acquisitions were 43.6 basis points (net of the legislated 10 basis point guarantee fee remitted to Treasury as part of the Temporary Payroll Tax Cut Continuation Act of 2011) for the second quarter of 2017, down slightly from 44.2 basis points in the first quarter of 2017. |
| ◾ | Average guarantee fees on the single-family credit guarantee portfolio were 33.9 basis points, an increase of 1.8 basis points from the first quarter of 2017, primarily due to higher amortization of upfront fees driven by loan prepayments during the second quarter of 2017. |
Freddie Mac Second Quarter 2017 Financial Results
August 1, 2017
Page 8
| ● | Transferred a small portion of expected credit losses and a significant portion of the credit losses in a stressed economic environment on approximately $105.2 billion in UPB of mortgage loans in the Core loan portfolio during the second quarter of 2017. |
Multifamily Segment
Providing financing for workforce housing while continuing to transfer credit risk to the private market
Financial Results(1)
| ($ Millions) | 2Q 2017 | 1Q 2017 | Change | 2Q 2016 | Change | |||||||||||||||||
| 1 | Net interest income | $ | 292 | $ | 271 | $ | 21 | $ | 283 | $ | 9 | |||||||||||
| 2 | Guarantee fee income | 162 | 151 | 11 | 124 | 38 | ||||||||||||||||
| 3 | Gains (losses) on loans and other non-interest income | 412 | 236 | 176 | 378 | 34 | ||||||||||||||||
| 4 | Derivative gains (losses) | (180 | ) | 127 | (307 | ) | (296 | ) | 116 | |||||||||||||
| 5 | Administrative expense | (95 | ) | (95 | ) | — | (86 | ) | (9 | ) | ||||||||||||
| 6 | Other | (6 | ) | (15 | ) | 9 | (3 | ) | (3 | ) | ||||||||||||
| 7 | Income tax (expense) benefit | (196 | ) | (226 | ) | 30 | (136 | ) | (60 | ) | ||||||||||||
|
|
|
|
|
|
|
|
|
|
|
|||||||||||||
| 8 | Segment earnings, net of taxes | 389 | 449 | (60 | ) | 264 | 125 | |||||||||||||||
| 9 | Total other comprehensive income (loss), net of tax | 73 | (4 | ) | 77 | 7 | 66 | |||||||||||||||
|
|
|
|
|
|
|
|
|
|
|
|||||||||||||
| 10 | Total comprehensive income | $ | 462 | $ | 445 | $ | 17 | $ | 271 | $ | 191 | |||||||||||
|
|
|
|
|
|
|
|
|
|
|
|||||||||||||
|
|
|
|
|
|
|
|
|
|
|
|||||||||||||
| (1) | The financial performance of the company’s Multifamily segment is measured based on its contribution to GAAP comprehensive income (loss). |
| ● | Multifamily segment comprehensive income was $462 million for the second quarter of 2017, an increase of $17 million, or 4 percent, from the first quarter of 2017 and $191 million, or 70 percent, from the prior year. |
| ◾ | The increase in comprehensive income from the prior quarter was primarily driven by higher net interest income on certain multifamily securities and higher guarantee fee income, partially offset by lower mark-to-market gains in the second quarter of 2017. |
| ◾ | The increase in comprehensive income from the prior year was primarily driven by fair value gains and increased guarantee fee income. |
| ● | Derivative gains (losses) for the Multifamily segment are largely offset by interest rate-related fair value changes of the loans and investment securities being economically hedged. As a result, there is minimal net impact on total comprehensive income for the Multifamily segment from interest rate-related derivatives. |
Business Highlights
| ● | New purchase volume of $14.1 billion for the second quarter of 2017 increased 11 percent from the first quarter of 2017, while outstanding loan commitments increased $5 billion to $19 billion, reflecting continued strong market demand. |
| ◾ | The capped multifamily new business activity for the second quarter of 2017 was $6.7 billion. |
| o | The 2017 FHFA Scorecard goal is to maintain the dollar volume of annual multifamily new business activity at or below a production cap of $36.5 billion. |
| ● | Executed 12 K Certificate and 5 SB (Small Balance) Certificate transactions that transferred a large majority of expected and stress credit losses associated with $12.3 billion in UPB of loans during the second quarter of 2017. |
| ● | Provided financing for approximately 174,000 rental units in the second quarter of 2017. |
| ◾ | 84 percent of the eligible units financed in the first half of 2017 were affordable to families earning at or below area median incomes. |
Freddie Mac Second Quarter 2017 Financial Results
August 1, 2017
Page 9
Capital Markets Segment
Enhancing the liquidity of the company’s securities in the secondary mortgage market while reducing less liquid assets using an economically sensible approach
Financial Results(1)
| ($ Millions) | 2Q 2017 | 1Q 2017 | Change | 2Q 2016 | Change | |||||||||||||||||
| 1 | Net interest income | $ | 875 | $ | 929 | $ | (54 | ) | $ | 925 | $ | (50 | ) | |||||||||
| 2 | Derivative gains (losses) | (485 | ) | 52 | (537 | ) | (1,322 | ) | 837 | |||||||||||||
| 3 | Other non-interest income | 444 | 686 | (242 | ) | 622 | (178 | ) | ||||||||||||||
| 4 | Administrative expense | (86 | ) | (83 | ) | (3 | ) | (75 | ) | (11 | ) | |||||||||||
| 5 | Other | (1 | ) | (4 | ) | 3 | (1 | ) | — | |||||||||||||
| 6 | Income tax (expense) benefit | (250 | ) | (528 | ) | 278 | (4 | ) | (246 | ) | ||||||||||||
|
|
|
|
|
|
|
|
|
|
|
|||||||||||||
| 7 | Segment earnings, net of taxes | 497 | 1,052 | (555 | ) | 145 | 352 | |||||||||||||||
| 8 | Total other comprehensive income (loss), net of tax | 249 | 29 | 220 | 134 | 115 | ||||||||||||||||
|
|
|
|
|
|
|
|
|
|
|
|||||||||||||
| 9 | Total comprehensive income | $ | 746 | $ | 1,081 | $ | (335 | ) | $ | 279 | $ | 467 | ||||||||||
|
|
|
|
|
|
|
|
|
|
|
|||||||||||||
|
|
|
|
|
|
|
|
|
|
|
|||||||||||||
| (1) | The financial performance of the company’s Capital Markets segment is measured based on its contribution to GAAP comprehensive income (loss). |
| ● | Capital Markets segment comprehensive income was $746 million for the second quarter of 2017, a decrease of $335 million, or 31 percent, from the first quarter of 2017 and an increase of $467 million from the prior year. |
| ◾ | The decrease in comprehensive income from the prior quarter was primarily driven by lower amortization income and higher fair value losses as a result of decreases in longer-term interest rates during the second quarter of 2017. |
| ◾ | The increase in comprehensive income from the prior year was primarily driven by decreased losses due to the use of hedge accounting during the second quarter of 2017. |
| ● | On February 2, 2017, the company began using fair value hedge accounting for certain single-family mortgage loans, which reduced its GAAP earnings sensitivity to large interest rate movements by nearly 55 percent in the second quarter of 2017. |
Business Highlights
| ● | Continued to responsibly reduce the balance of the company’s mortgage-related investments portfolio, with a focus on reducing the balance of less liquid assets. The Capital Markets segment less liquid assets were $73.3 billion at June 30, 2017, down $2.7 billion, or 4 percent, from March 31, 2017, due primarily to sales of $1.1 billion of reperforming loans and $0.5 billion of non-agency mortgage-related securities and ongoing portfolio liquidations. |
| ● | The Capital Markets segment securitization pipeline assets, which represent performing single-family loans purchased for cash and held until securitized, were $12.1 billion at June 30, 2017, up $4.4 billion from March 31, 2017. |
| ● | Continued to maintain a presence in the agency mortgage-related securities market to strategically support the guarantee business. |
| ◾ | Liquid assets held by the Capital Markets segment were $137 billion at June 30, 2017, or 62 percent of the portfolio. |
Freddie Mac Second Quarter 2017 Financial Results
August 1, 2017
Page 10
Housing Market Support
Freddie Mac supports the U.S. housing market by executing its charter mission to ensure credit availability for new and refinanced mortgages as well as rental housing while also helping struggling homeowners avoid foreclosure.
Preventing Foreclosures – Freddie Mac continued to help struggling borrowers retain their homes or otherwise avoid foreclosure, completing approximately 35,000 single-family loan workouts in the six months ended June 30, 2017.
Mortgage Funding – Freddie Mac provided approximately $190 billion in liquidity to the market in the six months ended June 30, 2017, funding:
| ● | Nearly 692,000 single-family homes, approximately 343,000 of which were refinance loans; and |
| ● | Approximately 332,000 multifamily rental units. |
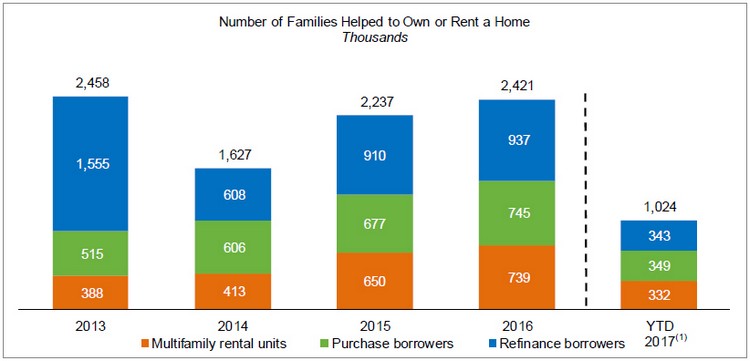
| (1) | As of June 30, 2017. |
Note: Amounts may not add due to rounding.
Freddie Mac Second Quarter 2017 Financial Results
August 1, 2017
Page 11
About Freddie Mac’s Conservatorship
Since September 2008, Freddie Mac has been operating under conservatorship, with FHFA as Conservator. The support provided by Treasury pursuant to the Purchase Agreement enables the company to maintain access to the debt markets and to have adequate liquidity to conduct its normal business operations.
Treasury Draw Requests and Dividend Payments
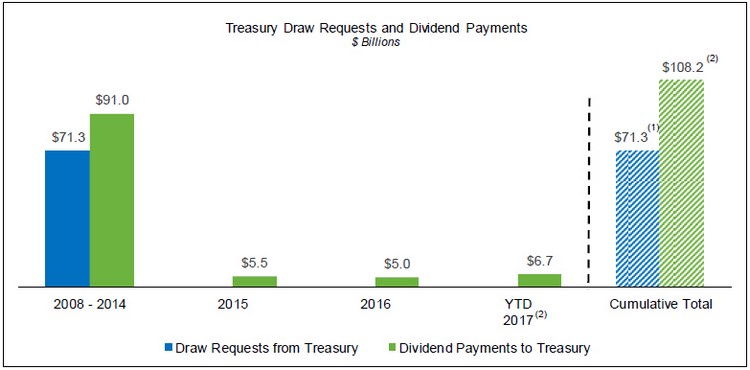
| (1) | Excludes the initial $1 billion liquidation preference of senior preferred stock issued to Treasury in September 2008 as consideration for Treasury’s funding commitment. The company received no cash proceeds as a result of issuing this initial $1 billion liquidation preference of senior preferred stock. |
| (2) | As of June 30, 2017. |
Note: Amounts may not add due to rounding.
| ● | Based on our Net Worth Amount of $2.6 billion as of June 30, 2017 and the Capital Reserve Amount of $600 million in 2017, our dividend requirement to Treasury in September 2017 will be $2.0 billion. If the Conservator declares a senior preferred stock dividend equal to our dividend requirement and directs us to pay it before September 30, 2017, we would expect to pay a dividend of $2.0 billion by September 30, 2017. |
| ◾ | The applicable capital reserve amount is $600 million for 2017 and will be zero beginning on January 1, 2018. |
| ◾ | The declining capital reserve required under the terms of the Purchase Agreement (ultimately reaching zero in 2018) increases the risk of Freddie Mac having a negative net worth and thus being required to draw from Treasury. |
| ● | Aggregate cash dividends paid to Treasury totaled $108.2 billion, $36.9 billion more than cumulative cash draws of $71.3 billion received from Treasury through June 30, 2017. |
| ● | The amount of funding available to Freddie Mac under the Purchase Agreement remains unchanged at $140.5 billion and will be reduced by any future draws. |
| ● | Treasury still maintains a liquidation preference of $72.3 billion on the company’s senior preferred stock as of June 30, 2017. |
| ◾ | The payment of dividends does not reduce the outstanding liquidation preference under the Purchase Agreement, although we are permitted to pay down the liquidation preference of the outstanding shares of senior preferred stock to the extent of accrued and unpaid dividends previously added to the liquidation preference and not previously paid down. |
| ◾ | Freddie Mac is not permitted to redeem the senior preferred stock prior to the termination of Treasury’s funding commitment under the Purchase Agreement. |
Freddie Mac Second Quarter 2017 Financial Results
August 1, 2017
Page 12
Additional Information
For more information, including that related to Freddie Mac’s financial results, conservatorship and related matters, see the company’s Quarterly Report on Form 10-Q for the quarter ended June 30, 2017, and the company’s Financial Results Supplement. These documents are available on the Investor Relations page of the company’s Web site at www.FreddieMac.com/investors.
Additional information about Freddie Mac and its business is also set forth in the company’s filings with the SEC, which are available on the Investor Relations page of the company’s Web site at www.FreddieMac.com/investors and the SEC’s Web site at www.sec.gov. Freddie Mac encourages all investors and interested members of the public to review these materials for a more complete understanding of the company’s financial results and related disclosures.
Webcast Announcement
Management will host a conference call at 9 a.m. Eastern Time on August 1, 2017 to discuss the company’s results with the media. The conference call will be concurrently webcast. To access the live audio webcast, use the following link: http://edge.media-server.com/m/p/gg52puix. The replay will be available on the company’s Web site at www.FreddieMac.com/investors for approximately 30 days. All materials related to the call will be available on the Investor Relations page of the company’s Web site at www.FreddieMac.com/investors.
| Media Contact: Lisa Gagnon (703) 903-3385 | Investor Contact: Laurie Garthune (571) 382-4732 | |
* * * *
This press release contains forward-looking statements, which may include statements pertaining to the conservatorship, the company’s current expectations and objectives for its Single-family Guarantee, Multifamily and Capital Markets segments, its efforts to assist the housing market, liquidity and capital management, economic and market conditions and trends, market share, the effect of legislative and regulatory developments and new accounting guidance, credit quality of loans the company owns or guarantees, the costs and benefits of the company’s credit risk transfer transactions, and results of operations and financial condition on a GAAP, Segment Earnings, non-GAAP and fair value basis. Forward-looking statements involve known and unknown risks and uncertainties, some of which are beyond the company’s control. Management’s expectations for the company’s future necessarily involve a number of assumptions, judgments and estimates, and various factors, including changes in market conditions, liquidity, mortgage spreads, credit outlook, actions by the U.S. government (including FHFA, Treasury and Congress), and the impacts of legislation or regulations and new or amended accounting guidance, could cause actual results to differ materially from these expectations. These assumptions, judgments, estimates and factors are discussed in the company’s Annual Report on Form 10-K for the year ended December 31, 2016, Quarterly Reports on Form 10-Q for the quarters ended March 31, 2017 and June 30, 2017 and Current Reports on Form 8-K, which are available on the Investor Relations page of the company’s Web site at www.FreddieMac.com/investors and the SEC’s Web site at www.sec.gov. The company undertakes no obligation to update forward-looking statements it makes to reflect events or circumstances occurring after the date of this press release.
Freddie Mac makes home possible for millions of families and individuals by providing mortgage capital to lenders. Since its creation by Congress in 1970, the company has made housing more accessible and affordable for homebuyers and renters in communities nationwide. The company is building a better housing finance system for homebuyers, renters, lenders and taxpayers. Learn more at FreddieMac.com, Twitter @FreddieMac and Freddie Mac’s blog FreddieMac.com/blog.
Freddie Mac Second Quarter 2017 Financial Results
August 1, 2017
Page 13
FREDDIE MAC
CONDENSED CONSOLIDATED STATEMENTS OF COMPREHENSIVE INCOME
(UNAUDITED)
| Three Months Ended | ||||||||||||
| June 30, 2017 | March 31, 2017 | June 30, 2016 | ||||||||||
| (in millions, except share-related amounts) | ||||||||||||
| Interest income |
||||||||||||
| Mortgage loans |
$ | 15,848 | $ | 15,965 | $ | 15,238 | ||||||
| Investments in securities |
902 | 914 | 978 | |||||||||
| Other |
150 | 101 | 56 | |||||||||
|
|
|
|
|
|
|
|||||||
| Total interest income |
16,900 | 16,980 | 16,272 | |||||||||
|
|
|
|
|
|
|
|||||||
| Interest expense |
(13,479 | ) | (13,142 | ) | (12,781 | ) | ||||||
| Expense related to derivatives |
(42 | ) | (43 | ) | (48 | ) | ||||||
|
|
|
|
|
|
|
|||||||
| Net interest income |
3,379 | 3,795 | 3,443 | |||||||||
| Benefit for credit losses |
422 | 116 | 775 | |||||||||
|
|
|
|
|
|
|
|||||||
| Net interest income after benefit for credit losses |
3,801 | 3,911 | 4,218 | |||||||||
|
|
|
|
|
|
|
|||||||
| Non-interest income (loss) |
||||||||||||
| Gains (losses) on extinguishment of debt |
50 | 218 | (119 | ) | ||||||||
| Derivative (losses) |
(1,096 | ) | (302 | ) | (2,058 | ) | ||||||
| Net impairment of available-for-sale securities recognized in earnings |
(3 | ) | (13 | ) | (72 | ) | ||||||
| Other gains on investment securities recognized in earnings |
61 | 56 | 450 | |||||||||
| Other income (loss) |
694 | 415 | (25 | ) | ||||||||
|
|
|
|
|
|
|
|||||||
| Non-interest income (loss) |
(294 | ) | 374 | (1,824 | ) | |||||||
|
|
|
|
|
|
|
|||||||
| Non-interest expense |
||||||||||||
| Salaries and employee benefits |
(266 | ) | (275 | ) | (240 | ) | ||||||
| Professional services |
(118 | ) | (112 | ) | (117 | ) | ||||||
| Occupancy expense |
(16 | ) | (13 | ) | (15 | ) | ||||||
| Other administrative expense |
(113 | ) | (111 | ) | (103 | ) | ||||||
|
|
|
|
|
|
|
|||||||
| Total administrative expense |
(513 | ) | (511 | ) | (475 | ) | ||||||
| Real estate owned operations expense |
(37 | ) | (56 | ) | (29 | ) | ||||||
| Temporary Payroll Tax Cut Continuation Act of 2011 expense |
(330 | ) | (321 | ) | (280 | ) | ||||||
| Other expense |
(126 | ) | (76 | ) | (151 | ) | ||||||
|
|
|
|
|
|
|
|||||||
| Non-interest expense |
(1,006 | ) | (964 | ) | (935 | ) | ||||||
|
|
|
|
|
|
|
|||||||
| Income before income tax (expense) |
2,501 | 3,321 | 1,459 | |||||||||
| Income tax (expense) |
(837 | ) | (1,110 | ) | (466 | ) | ||||||
|
|
|
|
|
|
|
|||||||
| Net income |
1,664 | 2,211 | 993 | |||||||||
|
|
|
|
|
|
|
|||||||
| Other comprehensive income (loss), net of taxes and reclassification adjustments: |
||||||||||||
| Changes in unrealized gains (losses) related to available-for-sale securities |
295 | (2 | ) | 109 | ||||||||
| Changes in unrealized gains related to cash flow hedge relationships |
27 | 28 | 32 | |||||||||
| Changes in defined benefit plans |
— | (3 | ) | (1 | ) | |||||||
|
|
|
|
|
|
|
|||||||
| Total other comprehensive income, net of taxes and reclassification adjustments |
322 | 23 | 140 | |||||||||
|
|
|
|
|
|
|
|||||||
| Comprehensive income |
$ | 1,986 | $ | 2,234 | $ | 1,133 | ||||||
|
|
|
|
|
|
|
|||||||
| Net income |
$ | 1,664 | $ | 2,211 | $ | 993 | ||||||
| Undistributed net worth sweep and senior preferred stock dividends |
(1,986 | ) | (2,234 | ) | (933 | ) | ||||||
|
|
|
|
|
|
|
|||||||
| Net income (loss) attributable to common stockholders |
$ | (322 | ) | $ | (23 | ) | $ | 60 | ||||
|
|
|
|
|
|
|
|||||||
| Net income (loss) per common share — basic and diluted |
$ | (0.10 | ) | $ | (0.01 | ) | $ | 0.02 | ||||
| Weighted average common shares outstanding (in millions) — basic and diluted |
3,234 | 3,234 | 3,234 | |||||||||
Freddie Mac Second Quarter 2017 Financial Results
August 1, 2017
Page 14
FREDDIE MAC
CONDENSED CONSOLIDATED BALANCE SHEETS
(UNAUDITED)
| June 30, 2017 | December 31, 2016 | |||||||
| (in millions, except share-related amounts) | ||||||||
| Assets |
||||||||
| Cash and cash equivalents |
$ | 6,666 | $ | 12,369 | ||||
| Restricted cash and cash equivalents |
4,464 | 9,851 | ||||||
| Securities purchased under agreements to resell |
47,791 | 51,548 | ||||||
| Investments in securities, at fair value |
98,799 | 111,547 | ||||||
| Mortgage loans held-for-sale (includes $17,982 and $16,255 at fair value) |
28,019 | 18,088 | ||||||
| Mortgage loans held-for-investment (net of allowance for loan losses of $10,311 and $13,431) |
1,804,123 | 1,784,915 | ||||||
| Accrued interest receivable |
6,237 | 6,135 | ||||||
| Derivative assets, net |
951 | 747 | ||||||
| Deferred tax assets, net |
14,751 | 15,818 | ||||||
| Other assets (includes $2,629 and $2,408 at fair value) |
10,956 | 12,358 | ||||||
|
|
|
|
|
|||||
| Total assets |
$ | 2,022,757 | $ | 2,023,376 | ||||
|
|
|
|
|
|||||
| Liabilities and equity |
||||||||
| Liabilities |
||||||||
| Accrued interest payable |
$ | 6,090 | $ | 6,015 | ||||
| Debt, net (includes $6,124 and $6,010 at fair value) |
2,009,166 | 2,002,004 | ||||||
| Derivative liabilities, net |
298 | 795 | ||||||
| Other liabilities |
4,617 | 9,487 | ||||||
|
|
|
|
|
|||||
| Total liabilities |
2,020,171 | 2,018,301 | ||||||
|
|
|
|
|
|||||
| Commitments and contingencies |
||||||||
| Equity |
||||||||
| Senior preferred stock |
72,336 | 72,336 | ||||||
| Preferred stock, at redemption value |
14,109 | 14,109 | ||||||
| Common stock, $0.00 par value, 4,000,000,000 shares authorized, 725,863,886 shares issued and 650,054,731 shares and 650,046,828 shares outstanding |
— | — | ||||||
| Additional paid-in capital |
— | — | ||||||
| Retained earnings (accumulated deficit) |
(80,777 | ) | (77,941 | ) | ||||
| AOCI, net of taxes, related to: |
||||||||
| Available-for-sale securities (includes $813 and $782, related to net unrealized gains on securities for which other-than-temporary impairment has been recognized in earnings) |
1,208 | 915 | ||||||
| Cash flow hedge relationships |
(425 | ) | (480 | ) | ||||
| Defined benefit plans |
18 | 21 | ||||||
|
|
|
|
|
|||||
| Total AOCI, net of taxes |
801 | 456 | ||||||
| Treasury stock, at cost, 75,809,155 shares and 75,817,058 shares |
(3,883 | ) | (3,885 | ) | ||||
|
|
|
|
|
|||||
| Total equity |
2,586 | 5,075 | ||||||
|
|
|
|
|
|||||
| Total liabilities and equity |
$ | 2,022,757 | $ | 2,023,376 | ||||
|
|
|
|
|
|||||
Freddie Mac Second Quarter 2017 Financial Results
August 1, 2017
Page 15
Freddie Mac
Non-GAAP Reconciliations
$ Millions, Pre-Tax
| Reconciliation of GAAP Net Interest Income to Adjusted Net Interest Income
|
||||||||||||||||||||||
| 2Q 2016 | 3Q 2016 | 4Q 2016 | 1Q 2017 | 2Q 2017 | ||||||||||||||||||
| 1 |
GAAP Net Interest Income | $ | 3,443 | $ | 3,646 | $ | 3,885 | $ | 3,795 | $ | 3,379 | |||||||||||
| Reclassifications: | ||||||||||||||||||||||
| 2 |
Guarantee fee income reclassified out of net interest income (1), (2) | (1,781 | ) | (1,935 | ) | (1,970 | ) | (1,741 | ) | (1,840 | ) | |||||||||||
| 3 |
Accrual of periodic cash settlements reclassified into net interest income (3) | (420 | ) | (416 | ) | (434 | ) | (467 | ) | (429 | ) | |||||||||||
| 4 |
Other reclassifications (4) | (34 | ) | (106 | ) | (325 | ) | (387 | ) | 58 | ||||||||||||
|
|
|
|
|
|
|
|
|
|
|
|||||||||||||
| 5 |
Total reclassifications | $ | (2,235 | ) | $ | (2,456 | ) | $ | (2,730 | ) | $ | (2,595 | ) | $ | (2,212 | ) | ||||||
|
|
|
|
|
|
|
|
|
|
|
|||||||||||||
| 6 |
Adjusted Net Interest Income | $ | 1,208 | $ | 1,190 | $ | 1,155 | $ | 1,200 | $ | 1,167 | |||||||||||
|
|
|
|
|
|
|
|
|
|
|
|||||||||||||
|
Reconciliation of GAAP Guarantee Fee Income* to Adjusted Guarantee Fee Income
|
||||||||||||||||||||||
| 2Q 2016 |
3Q 2016 |
4Q 2016 |
1Q 2017 |
2Q 2017 |
||||||||||||||||||
| 7 |
GAAP Guarantee Fee Income* | $ | 124 | $ | 133 | $ | 146 | $ | 149 | $ | 158 | |||||||||||
| Reclassifications: | ||||||||||||||||||||||
| 8 |
Guarantee fee income reclassified from net interest income (1), (2) | 1,781 | 1,935 | 1,970 | 1,741 | 1,840 | ||||||||||||||||
| 9 |
Temporary Payroll Tax Cut Continuation Act of 2011 expense reclassified from other non-interest expense (5) | (280 | ) | (293 | ) | (307 | ) | (321 | ) | (330 | ) | |||||||||||
|
|
|
|
|
|
|
|
|
|
|
|||||||||||||
| 10 |
Total reclassifications | 1,501 | 1,642 | 1,663 | 1,420 | 1,510 | ||||||||||||||||
|
|
|
|
|
|
|
|
|
|
|
|||||||||||||
| 11 |
Adjusted Guarantee Fee Income | $ | 1,625 | $ | 1,775 | $ | 1,809 | $ | 1,569 | $ | 1,668 | |||||||||||
|
|
|
|
|
|
|
|
|
|
|
|||||||||||||
* Guarantee fee income on a GAAP basis is included in Other income (loss) on Freddie Mac’s condensed consolidated statements of comprehensive income.
Note: Columns may not add due to rounding.
For notes on reclassifications, see page 16 of this press release.
Freddie Mac Second Quarter 2017 Financial Results
August 1, 2017
Page 16
During the first quarter of 2017, the company changed how it calculates certain components of its Segment Earnings for its Capital Markets segment. The purpose of this change is to simplify Segment Earnings results relative to GAAP results in order to better reflect how management evaluates the Capital Markets segment. Prior period results have been revised to conform to the current period presentation. The change to the calculation of net interest income for the Capital Markets segment is also reflected in the company’s calculation of adjusted net interest income.
The change includes:
| • | The discontinuation of adjustments which reflected the reclassification of amortization of upfront cash paid and received upon acquisitions and issuances of swaptions and options from derivative gains (losses) to net interest income for the Capital Markets segment. |
| o | The discontinuation of the adjustments resulted in an increase to adjusted net interest income of $281 million, $319 million, $402 million, and $347 million for the three months ended March 31, 2016, June 30, 2016, September 30, 2016, and December 31, 2016, respectively, to align with the current presentation. This change did not affect the calculation of adjusted guarantee fee income. |
Notes on Significant Reclassifications
(1) Net guarantee fees are reclassified from GAAP net interest income to adjusted guarantee fee income.
(2) Implied guarantee fee income related to unsecuritized loans held in the mortgage investments portfolio is reclassified from GAAP net interest income to adjusted guarantee fee income.
(3) The accrual of periodic cash settlements of all derivatives is reclassified from GAAP derivative gains (losses) into adjusted net interest income to fully reflect the periodic cost associated with the protection provided by these contracts.
(4) Other reclassifications primarily relate to items reclassified out of GAAP net interest income, including the amortization of premiums and discounts associated with the company’s PCs and the loans underlying those PCs, amortization of non-cash premiums on single-family loans in trusts and on consolidated PCs, amortization of discounts on loans purchased with deteriorated credit quality that are on accrual status, the accretion of other-than-temporary impairments on available-for-sale securities, STACR debt note expense and net float income or expense.
(5) The expense related to the Temporary Payroll Tax Cut Continuation Act of 2011 is reclassified from GAAP other non-interest expense to adjusted guarantee fee income. As a result of the reclassification, the revenue and expense related to the legislated 10 basis point increase are netted within adjusted guarantee fee income.