Attached files
| file | filename |
|---|---|
| EX-99.1 - EX-99.1 - Cotiviti Holdings, Inc. | ex-99d1.htm |
| 8-K - 8-K - Cotiviti Holdings, Inc. | f8-k.htm |
Exhibit 99.2
|
|
|
|
|
|
|
|
Cotiviti Holdings, Inc. 2017 Revenue by Segment Change Change Healthcare $ 86,627 $ 80,932 7 % $ 164,143 $ 146,202 12 % 62,020 56,989 9 % 121,737 112,399 8 % 2,912 3,122 (7) % 5,482 6,572 (17) % Total Healthcare 151,559 141,043 7 % 291,362 265,173 10 % Global Retail and Other 15,385 16,701 (8) % 35,059 34,691 1 % Other 667 547 22 % 1,323 1,145 16 % Total Global Retail and Other 16,052 17,248 (7) % 36,382 35,836 2 % $ 167,611 $ 158,291 6 % $ 327,744 $ 301,009 9 % Six Months Ended June 30, 2017 2016 2016 2017 (unaudited) Three Months Ended June 30, Consolidated Net Revenue ($ in thousands) Retrospective claims accuracy Prospective claims accuracy Transaction services Retrospective claims accuracy |
|
|
Cotiviti Holdings, Inc. 2017 Consolidated Statement of Operations (unaudited) Net revenue Cost of revenue Selling, general and administrative expenses Depreciation and amortization of property and equipment Amortization of intangible assets Transaction-related expenses $ 167,611 64,993 40,864 5,896 15,201 661 $ 158,291 60,560 38,121 4,811 15,208 653 6 7 7 23 - 1 % % % % % % 327,744 127,967 82,436 11,471 30,400 1,392 301,009 119,419 72,460 9,646 30,415 893 9 7 14 19 - 56 % % % % % % Operating income Other expense (income) Income tax expense 39,996 11,165 7,743 38,938 21,369 6,676 3 % 74,078 19,133 6,882 68,176 37,130 12,069 9 % (48) % (48) % (43) % 16 % Earnings per share: Basic Diluted $ 0.23 0.22 $ 0.13 0.13 $ 0.52 0.51 $ 0.24 0.24 Effective Tax Rate 26.9 % 38.0 % 12.5% 38.9% Stock-base d Compe nsa tion (included w ithin the line s show n a bove ) Cost of revenue Selling, general and administrative expenses $ 494 1,961 $ 296 3,132 67 (37) % % $ 960 3,578 $ 585 3,917 64 % (9) % 3 Total Stock-Based Compensation $ 2,455 $ 3,428 (28) % $ 4,538 $ 4,502 1 % $ 48,063 $ 18,977 153 % Net Income $ 21,088 $ 10,893 94 % 253,666 232,833 9 % Total Operating Expenses 127,615 119,353 7 % Six Months Ended June 30, 2017 2016 Change Three Months Ended June 30, ($ in thousands) 2017 2016 Change |
|
|
Cotiviti Holdings, Inc. 2017 Adjusted EBITDA (Non-GAAP) Represents other non-operating (income) expense that consists primarily of gains and losses on transactions settled in foreign currencies. Income received for certain sub-leases is included herein. Represents transaction-related expenses that consist primarily of certain expenses associated with our secondary offering and our Initial Public Offering and other offering costs in 2016 as well as certain corporate development activity, including the acquisition of RowdMap. Represents expense related to equity incentive awards granted to certain employees, officers and non‑employee directors as long‑term incentive compensation. We recognize the related expense for these awards ratably over the vesting period. Represents loss on extinguishment of debt that consists primarily of fees paid and write-offs of unamortized debt issuance costs and original issue discount in connection with the repricing of our First Lien Term B Loan in 2017 and the early repayment of a portion of our long-term debt in 2016. Change Change Net Income $ 21,088 $ 10,893 94 % $ 48,063 $ 18,977 153 % Adjustments to net income: Depreciation and amortization 21,097 20,019 5 % 41,871 40,061 5 % Interest expense 8,538 14,660 (42) % 16,959 30,720 (45) % Other non-operating (income) expense (a) (556) (359) 55 % (1,009) (658) 53 % Income tax expense 7,743 6,676 16 % 6,882 12,069 (43) % Transaction-related expenses and other (b) 661 653 1 % 1,392 893 56 % Stock-based compensation (c) 2,455 3,428 (28) % 4,538 4,502 1 % Loss on extinguishment of debt (d) 3,183 7,068 (55) % 3,183 7,068 (55) % Adjusted EBITDA $ 64,209 $ 63,038 2 % $ 121,879 $ 113,632 7 % % of revenue 38.3% 39.8% 37.2% 37.8% 2016 Six Months Ended June 30, (unaudited, $ in thousands) Three Months Ended June 30, 2017 2016 2017 |
|
|
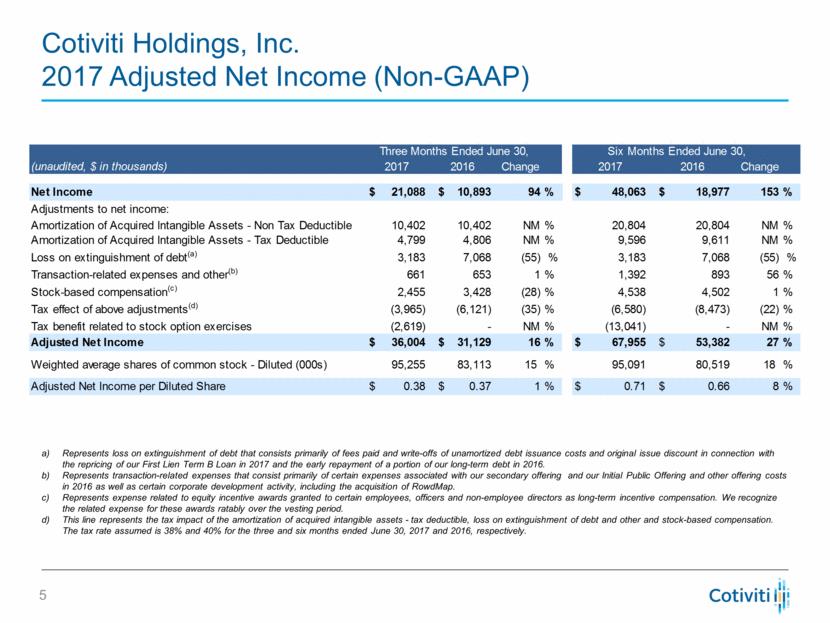
Cotiviti Holdings, Inc. 2017 Adjusted Net Income (Non-GAAP) Represents loss on extinguishment of debt that consists primarily of fees paid and write-offs of unamortized debt issuance costs and original issue discount in connection with the repricing of our First Lien Term B Loan in 2017 and the early repayment of a portion of our long-term debt in 2016. Represents transaction-related expenses that consist primarily of certain expenses associated with our secondary offering and our Initial Public Offering and other offering costs in 2016 as well as certain corporate development activity, including the acquisition of RowdMap. Represents expense related to equity incentive awards granted to certain employees, officers and non‑employee directors as long‑term incentive compensation. We recognize the related expense for these awards ratably over the vesting period. This line represents the tax impact of the amortization of acquired intangible assets - tax deductible, loss on extinguishment of debt and other and stock-based compensation. The tax rate assumed is 38% and 40% for the three and six months ended June 30, 2017 and 2016, respectively. Change Change Net Income $ 21,088 $ 10,893 94 % $ 48,063 $ 18,977 153 % Adjustments to net income: Amortization of Acquired Intangible Assets - Non Tax Deductible 10,402 10,402 NM % 20,804 20,804 NM % Amortization of Acquired Intangible Assets - Tax Deductible 4,799 4,806 NM % 9,596 9,611 NM % Loss on extinguishment of debt (a) 3,183 7,068 (55) % 3,183 7,068 (55) % Transaction-related expenses and other (b) 661 653 1 % 1,392 893 56 % Stock-based compensation (c) 2,455 3,428 (28) % 4,538 4,502 1 % Tax effect of above adjustments (d) (3,965) (6,121) (35) % (6,580) (8,473) (22) % Tax benefit related to stock option exercises (2,619) - NM % (13,041) - NM % Adjusted Net Income $ 36,004 $ 31,129 16 % $ 67,955 $ 53,382 27 % Weighted average shares of common stock - Diluted (000s) 95,255 83,113 15 % 95,091 80,519 18 % Adjusted Net Income per Diluted Share $ 0.38 $ 0.37 1 % $ 0.71 $ 0.66 8 % (unaudited, $ in thousands) 2017 2016 2017 2016 Six Months Ended June 30, Three Months Ended June 30, |
|
|
Cotiviti Holdings, Inc. 2017 Adjusted EBITDA Guidance (Non-GAAP) Net income and depreciation and amortization will be impacted by amortization expense associated with purchase accounting, once completed, related to the acquisition of RowdMap in July 2017. Represents other non-operating (income) expense that consists primarily of gains and losses on transactions settled in foreign currencies. Income received for certain sub-leases is included herein. Income tax expense for 2017 assumes an effective tax rate of approximately 38% excluding the impact of the benefit related to stock option exercises that have actually occurred through June 30, 2017. Represents transaction-related expenses that consist primarily of certain expenses associated with our secondary offering and our Initial Public Offering and other offering costs in 2016 as well as certain corporate development activity, including the acquisition of RowdMap. Represents expense related to equity incentive awards granted to certain employees, officers and non-employee directors as long-term incentive compensation. We recognize the related expense for these awards ratably over the vesting period. Represents loss on extinguishment of debt that consists primarily of fees paid and write-offs of unamortized debt issuance costs and original issue discount in connection with the repricing of our First Lien Term B Loan in 2017 and the early repayment of a portion of our long-term debt in 2016. (unaudited, in millions) Low High Net income (a) 97 $ 103 $ Adjustments to net income: Depreciation and amortization (a) 82 79 Interest expense 35 35 Other non-operating (income) expense (b) (1) (2) Income tax expense (c) 36 41 Transaction-related expenses and other (d) 2 1 Stock-based compensation (e) 12 12 Loss on extinguishment of debt (f) 3 3 Adjusted EBITDA 266 $ 272 $ |
|
|
Cotiviti Holdings, Inc. Cash Flow Data Free cash flow is a non-GAAP financial measure. Therefore, it should not be considered a substitute for income or cash flow data prepared in accordance with U.S. GAAP and may not be comparable to similarly titled measures used by other companies. The Company defines free cash flow as net cash provided by operating activities less capital expenditures. It should not be inferred that the entire free cash flow amount is available for discretionary expenditures. Management believes free cash flow is meaningful as it is used by management and investors as a measure and indicator of the financial strength of the company and its ability to generate cash. Operating Cash Flow $ 42,300 $ 72,574 Capex 16,593 14,019 Free Cash Flow (a) $ 25,707 $ 58,555 ($ in thousands) Six Months Ended June 30, 2017 2016 |
|
|
Cotiviti Holdings, Inc. Consolidated Balance Sheet Data ($ in thousands) June 30, 2017 December 31, 2016 (unaudited) Cash and cash equivalents $ 137,426 $ 110,635 Total assets 2,038,778 2,002,263 Total long-term debt (a) 775,218 780,202 Total liabilities 1,035,674 1,062,927 Total stockholders’ equity 1,003,104 939,336 Net debt leverage 2.6x 2.9x Working capital 113,529 31,037 a) Includes the current portion of our long-term debt and is net of debt issuance costs. |
|
|
0 Analytics. Insight. Value. |