Attached files
| file | filename |
|---|---|
| EX-99.1 - EX-99.1 - Apollo Commercial Real Estate Finance, Inc. | d430135dex991.htm |
| 8-K - FORM 8-K - Apollo Commercial Real Estate Finance, Inc. | d430135d8k.htm |
Exhibit 99.2

Supplemental Financial Information Package – Q2 2017 August 1, 2017 Information is as of June 30, 2017, except as otherwise noted. It should not be assumed that investments made in the future will be profitable or will equal the performance of investments in this document.
Forward Looking Statements and Other Disclosures This presentation may contain forward-looking statements that are within the meaning of Section 27A of the Securities Act of 1933, as amended, and Section 21E of the Securities Exchange Act of 1934, as amended, and such statements are intended to be covered by the safe harbor provided by the same. Forward-looking statements are subject to substantial risks and uncertainties, many of which are difficult to predict and are generally beyond management’s control. These forward-looking statements may include information about possible or assumed future results of Apollo Commercial Real Estate Finance, Inc.’s (“ARI” or the “Company”) business, financial condition, liquidity, results of operations, plans and objectives. When used in this presentation, the words “believe,” “expect,” “anticipate,” “estimate,” “plan,” “continue,” “intend,” “should,” “may” or similar expressions, are intended to identify forward-looking statements. Statements regarding the following subjects, among others, may be forward-looking: ARI’s business and investment strategy; ARI’s operating results; ARI’s ability to obtain and maintain financing arrangements; and the return on equity, the yield on investments and risks associated with investing in real estate assets including changes in business conditions and the general economy. The forward-looking statements are based on management’s beliefs, assumptions and expectations of future performance, taking into account all information currently available to ARI. Forward-looking statements are not predictions of future events. These beliefs, assumptions and expectations can change as a result of many possible events or factors, not all of which are known to ARI. Some of these factors are described under “Risk Factors,” and “Management’s Discussion and Analysis of Financial Condition and Results of Operations” included in ARI’s Annual Report on Form 10-K for the fiscal year ended December 31, 2016 and other filings with the Securities and Exchange Commission (“SEC”), which are accessible on the SEC’s website at www.sec.gov. If a change occurs, ARI’s business, financial condition, liquidity and results of operations may vary materially from those expressed in ARI’s forward-looking statements. Any forward-looking statement speaks only as of the date on which it is made. New risks and uncertainties arise over time, and it is not possible for management to predict those events or how they may affect ARI. Except as required by law, ARI is not obligated to, and does not intend to, update or revise any forward-looking statements, whether as a result of new information, future events or otherwise. This presentation contains information regarding ARI’s financial results that is calculated and presented on the basis of methodologies other than in accordance with accounting principles generally accepted in the United States (“GAAP”), including Operating Earnings and Operating Earnings per share. Please refer to slide 18 for a definition of “Operating Earnings” and the reconciliation of the applicable GAAP financial measures to non-GAAP financial measures set forth on slides 16 and 17. This presentation may contain statistics and other data that in some cases has been obtained from or compiled from information made available by third-party service providers. ARI makes no representation or warranty, expressed or implied, with respect to the accuracy, reasonableness or completeness of such information. Past performance is not indicative nor a guarantee of future returns. Index performance and yield data are shown for illustrative purposes only and have limitations when used for comparison or for other purposes due to, among other matters, volatility, credit or other factors (such as number and types of securities). Indices are unmanaged, do not charge any fees or expenses, assume reinvestment of income and do not employ special investment techniques such as leveraging or short selling. No such index is indicative of the future results of any investment by ARI. 1
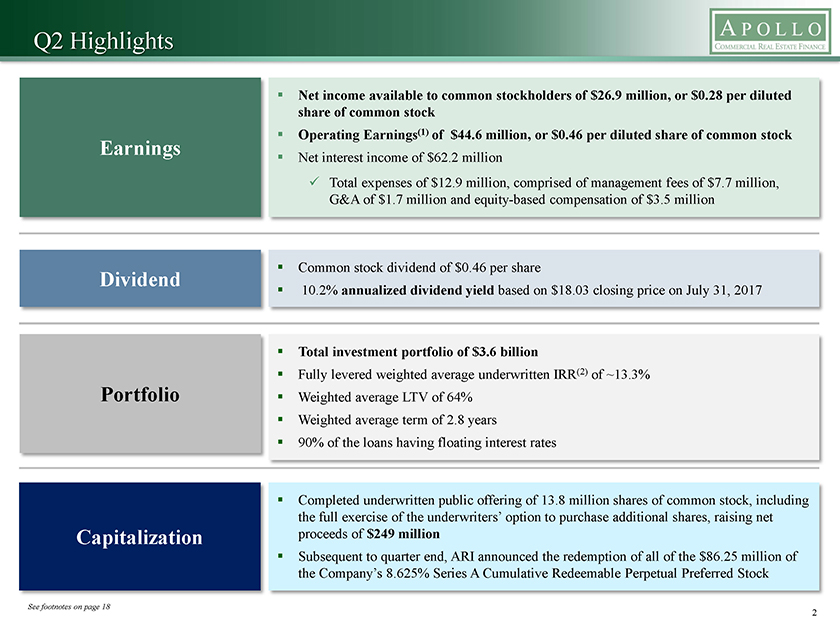
Q2 Highlights ? Net income available to common stockholders of $26.9 million, or $0.28 per diluted share of common stock ? Operating Earnings(1) of $44.6 million, or $0.46 per diluted share of common stock Earnings Net interest income of $62.2 million ? ? Total expenses of $12.9 million, comprised of management fees of $7.7 million, G&A of $1.7 million and equity-based compensation of $3.5 million Dividend ? Common stock dividend of $0.46 per share ? 10.2% annualized dividend yield based on $18.03 closing price on July 31, 2017 ? Total investment portfolio of $3.6 billion ? Fully levered weighted average underwritten IRR(2) of ~13.3% Portfolio ? Weighted average LTV of 64% ? Weighted average term of 2.8 years ? 90% of the loans having floating interest rates ? Completed underwritten public offering of 13.8 million shares of common stock, including the full exercise of the underwriters’ option to purchase additional shares, raising net Capitalization proceeds of $249 million ? Subsequent to quarter end, ARI announced the redemption of all of the $86.25 million of the Company’s 8.625% Series A Cumulative Redeemable Perpetual Preferred Stock See footnotes on page 18 2
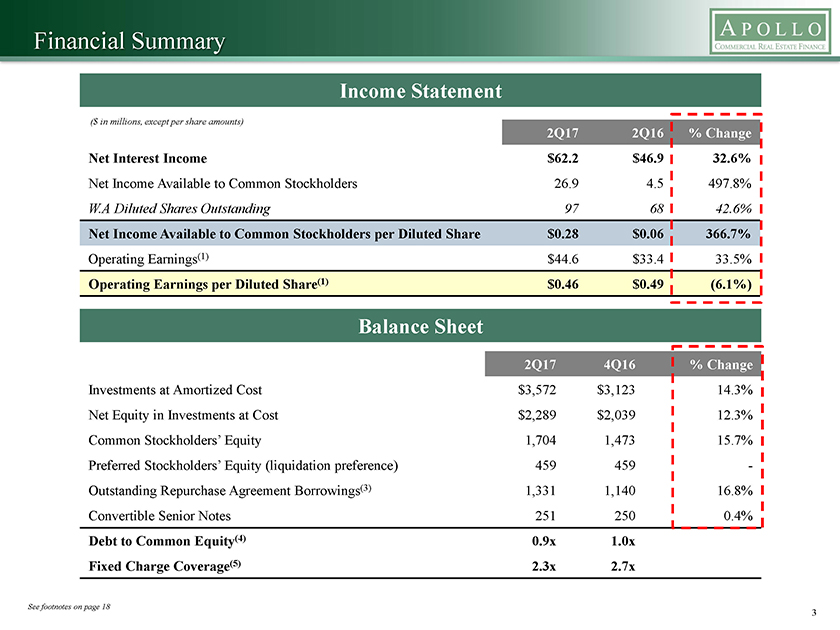
Financial Summary Income Statement ($ in millions, except per share amounts) 2Q17 2Q16 % Change Net Interest Income $62.2 $46.9 32.6% Net Income Available to Common Stockholders 26.9 4.5 497.8% W.A Diluted Shares Outstanding 97 68 42.6% Net Income Available to Common Stockholders per Diluted Share $0.28 $0.06 366.7% Operating Earnings(1) $44.6 $33.4 33.5% Operating Earnings per Diluted Share(1) $0.46 $0.49 (6.1%) Balance Sheet 1c 2Q17 4Q16 % Change Investments at Amortized Cost $3,572 $3,123 14.3% Net Equity in Investments at Cost $2,289 $2,039 12.3% Common Stockholders’ Equity 1,704 1,473 15.7% Preferred Stockholders’ Equity (liquidation preference) 459 459—Outstanding Repurchase Agreement Borrowings(3) 1,331 1,140 16.8% Convertible Senior Notes 251 250 0.4% Debt to Common Equity(4) 0.9x 1.0x Fixed Charge Coverage(5) 2.3x 2.7x
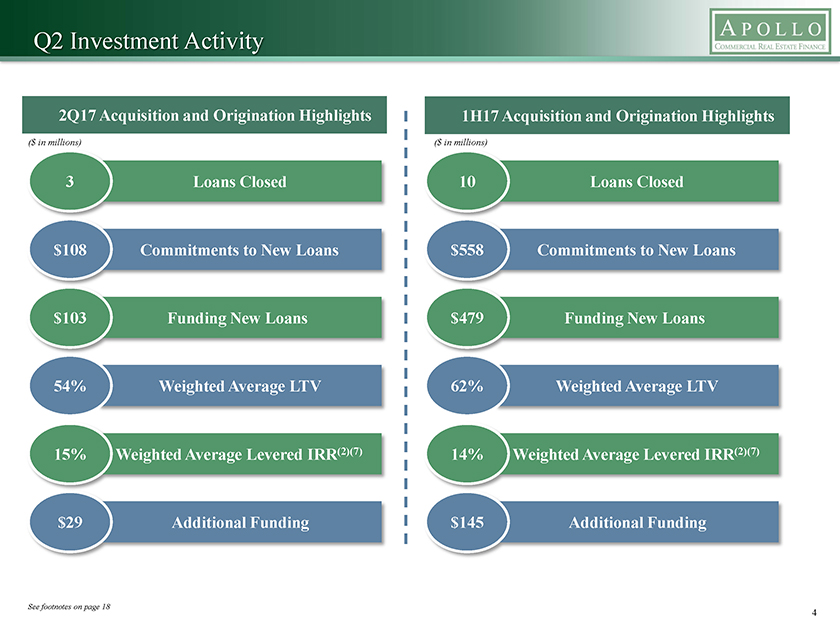
Q2 Investment Activity 2Q17 Acquisition and Origination Highlights 1H17 Acquisition and Origination Highlights ($ in millions) ($ in millions) 3 Loans Closed 10 Loans Closed $108 Commitments to New Loans $558 Commitments to New Loans $103 Funding New Loans $479 Funding New Loans 54% Weighted Average LTV 62% Weighted Average LTV 15% Weighted Average Levered IRR(2)(7) 14% Weighted Average Levered IRR(2)(7) $29 Additional Funding $145 Additional Funding See footnotes on page 18 4
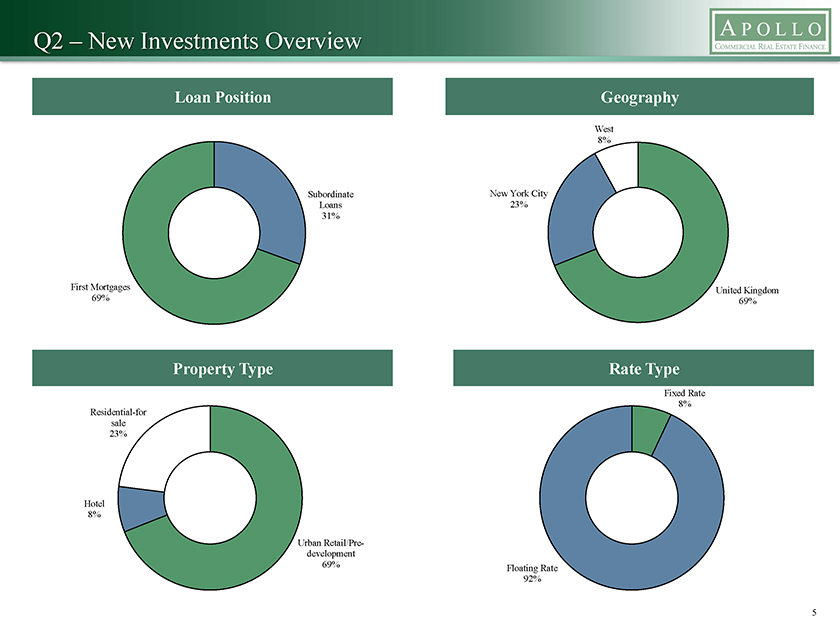
Q2 – New Investments Overview Loan Position Geography West 8% Subordinate New York City Loans 23% 31% First Mortgages United 69% 69% Property Type Rate Type Fixed Rate 8% Residential-for sale 23% Hotel 8% Urban Retail/Pre-development 69% Floating Rate 92%
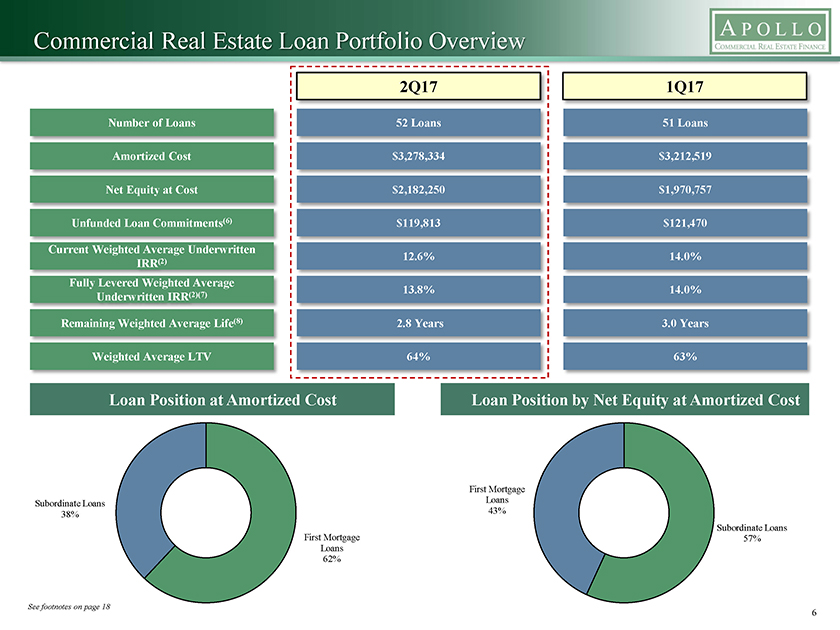
Commercial Real Estate Loan Portfolio Overview 2Q17 1Q17 Number of Loans 52 Loans 51 Loans Amortized Cost $3,278,334 $3,212,519 Net Equity at Cost $2,182,250 $1,970,757 Unfunded Loan Commitments(6) $119,813 $121,470 Current Weighted Average Underwritten (2) 12.6% 14.0% IRR Fully Levered Weighted Average (2)(7) 13.8% 14.0% Underwritten IRR Remaining Weighted Average Life(8) 2.8 Years 3.0 Years Weighted Average LTV 64% 63% Loan Position at Amortized Cost Loan Position by Net Equity at Amortized Cost First Mortgage Subordinate Loans Loans 38% 43% First Mortgage Subordinate Loans Loans 57% 62% See footnotes on page 18 6
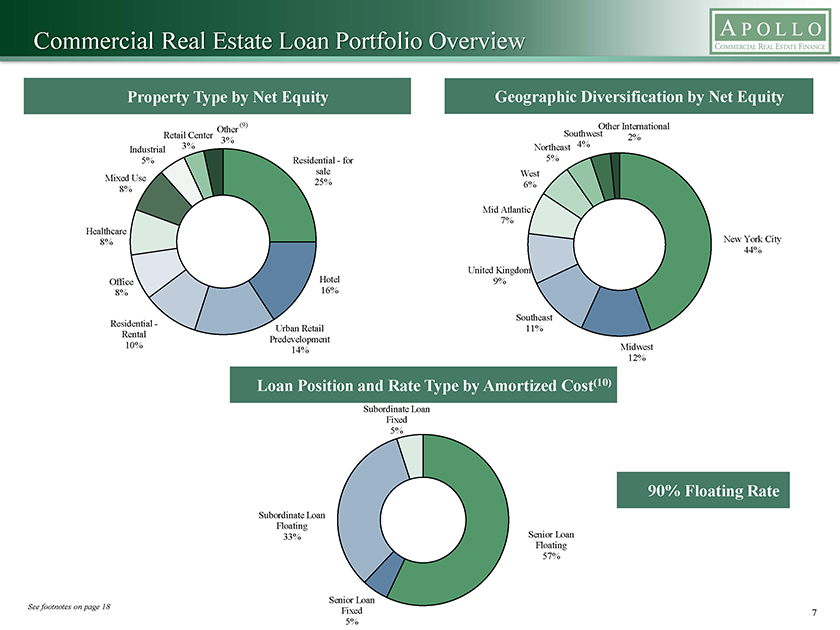
Commercial Real Estate Loan Portfolio Overview Property Type by Net Equity Geographic Diversification by Net Equity Other (9) Southwest Other International Retail Center 2% 3% 4% Industrial 3% Northeast 5% Residential—for 5% sale West Mixed Use 25% 8% 6% Mid Atlantic 7% Healthcare 8% New York City 44% Hotel United Kingdom Office 16% 9% 8% Southeast Residential -Urban Retail 11% Rental Predevelopment 10% Midwest 14% 12% Loan Position and Rate Type by Amortized Cost(10) Subordinate Loan Fixed 5% 90% Floating Rate Subordinate Loan Floating 33% Senior Loan Floating 57% Senior Loan See footnotes on page 18 Fixed 5% 7
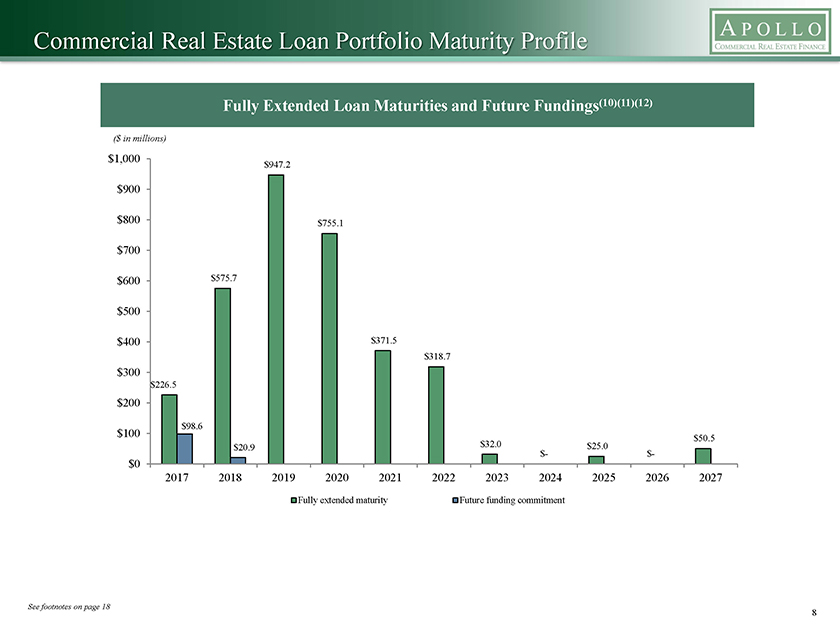
Commercial Real Estate Loan Portfolio Maturity Profile Fully Extended Loan Maturities and Future Fundings(10)(11)(12) ($ in millions) $1,000 $947.2 $900 $800 $755.1 $700 $600 $575.7 $500 $400 $371.5 $318.7 $300 $226.5 $200 $98.6 $100 $32.0 $50.5 $20.9 $25.0 $- $- $0 2017 2018 2019 2020 2021 2022 2023 2024 2025 2026 2027 Fully extended maturity Future funding commitment See footnotes on page 18 8
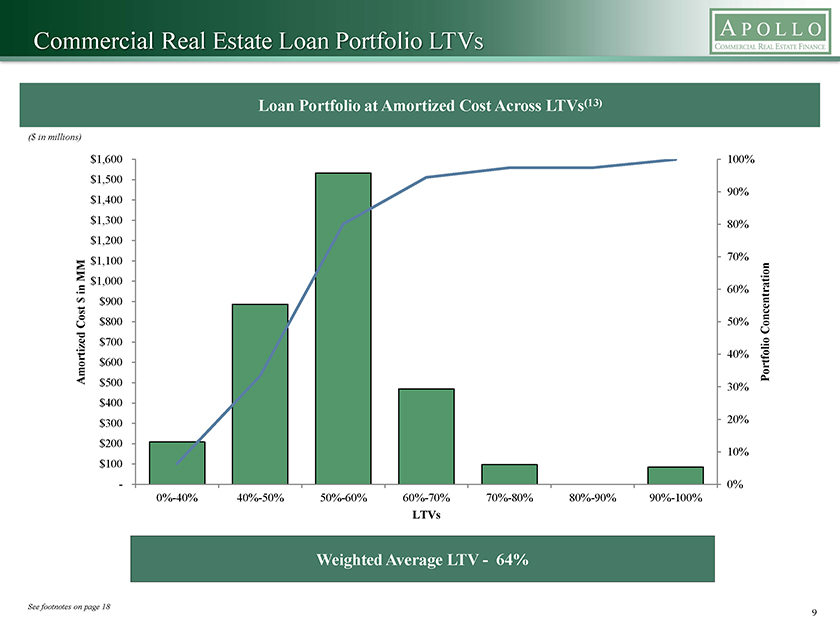
Commercial Real Estate Loan Portfolio LTVs Loan Portfolio at Amortized Cost Across LTVs(13) ($ in millions) $1,600 100% $1,500 90% $1,400 $1,300 80% $1,200 MM $1,100 70% in $1,000 60% $ $900 Cost $800 50% Concentration $700 40% Amortized $600 Portfolio $500 30% $400 $300 20% $200 $100 10%—0% 0%-40% 40%-50% 50%-60% 60%-70% 70%-80% 80%-90% 90%-100% LTVs Weighted Average LTV— 64% See footnotes on page 18 9
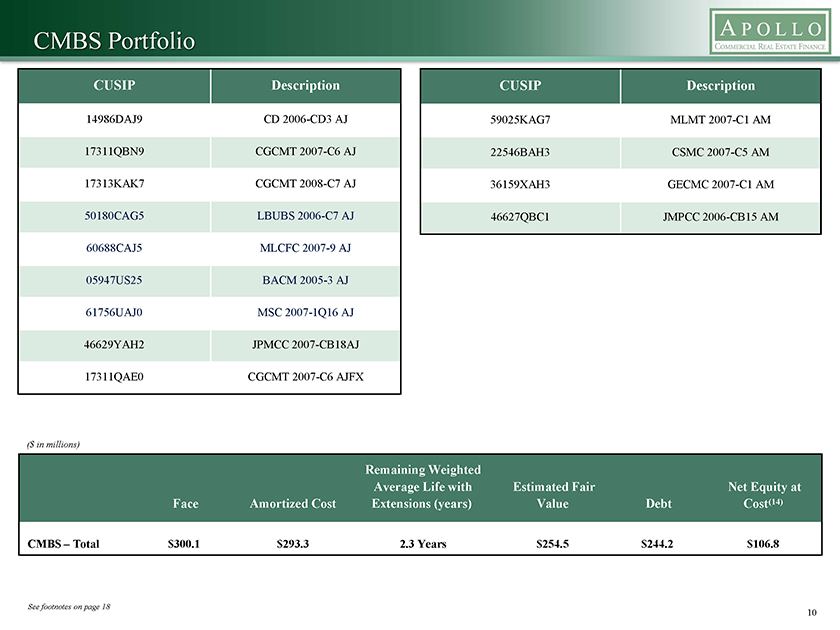
CMBS Portfolio CUSIP Description 14986DAJ9 CD 2006-CD3 AJ 17311QBN9 CGCMT 2007-C6 AJ 17313KAK7 CGCMT 2008-C7 AJ 50180CAG5 LBUBS 2006-C7 AJ 60688CAJ5 MLCFC 2007-9 AJ 05947US25 BACM 2005-3 AJ 61756UAJ0 MSC 2007-1Q16 AJ 46629YAH2 JPMCC 2007-CB18AJ 17311QAE0 CGCMT 2007-C6 AJFX CUSIP Description 59025KAG7 MLMT 2007-C1 AM 22546BAH3 CSMC 2007-C5 AM 36159XAH3 GECMC 2007-C1 AM 46627QBC1 JMPCC 2006-CB15 AM ($ in millions) Remaining Weighted Average Life with Estimated Fair Net Equity at Face Amortized Cost Extensions (years) Value Debt Cost(14) CMBS – Total $300.1 $293.3 2.3 Years $254.5 $244.2 $106.8 See footnotes on page 18 10
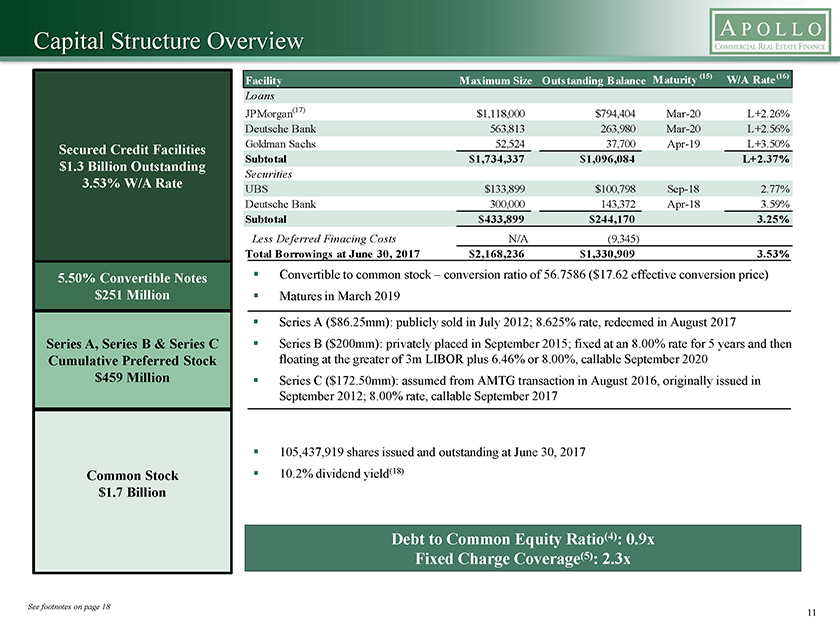
Capital Structure Overview Facility Maximum Size Outstanding Balance Maturity (15) W/A Rate(16) Loans JPMorgan(17) $1,118,000 $794,404 Mar-20 L+2.26% Deutsche Bank 563,813 263,980 Mar-20 L+2.56% Secured Credit Facilities Goldman Sachs 52,524 37,700 Apr-19 L+3.50% $1.3 Billion Outstanding Subtotal $1,734,337 $1,096,084 L+2.37% Securities 3.53% W/A Rate UBS $133,899 $100,798 Sep-18 2.77% Deutsche Bank 300,000 143,372 Apr-18 3.59% Subtotal $433,899 $244,170 3.25% Less Deferred Finacing Costs N/A (9,345) Total Borrowings at June 30, 2017 $2,168,236 $1,330,909 3.53% 5.50% Convertible Notes ? Convertible to common stock – conversion ratio of 56.7586 ($17.62 effective conversion price) $251 Million ? Matures in March 2019 ? Series A ($86.25mm): publicly sold in July 2012; 8.625% rate, redeemed in August 2017 Series A, Series B & Series C ? Series B ($200mm): privately placed in September 2015; fixed at an 8.00% rate for 5 years and then Cumulative Preferred Stock floating at the greater of 3m LIBOR plus 6.46% or 8.00%, callable September 2020 $459 Million ? Series C ($172.50mm): assumed from AMTG transaction in August 2016, originally issued in September 2012; 8.00% rate, callable September 2017 ? 105,437,919 shares issued and outstanding at June 30, 2017 Common Stock ? 10.2% dividend yield(18) $1.7 Billion Debt to Common Equity Ratio(4): 0.9x Fixed Charge Coverage(5): 2.3x See footnotes on page 18 11
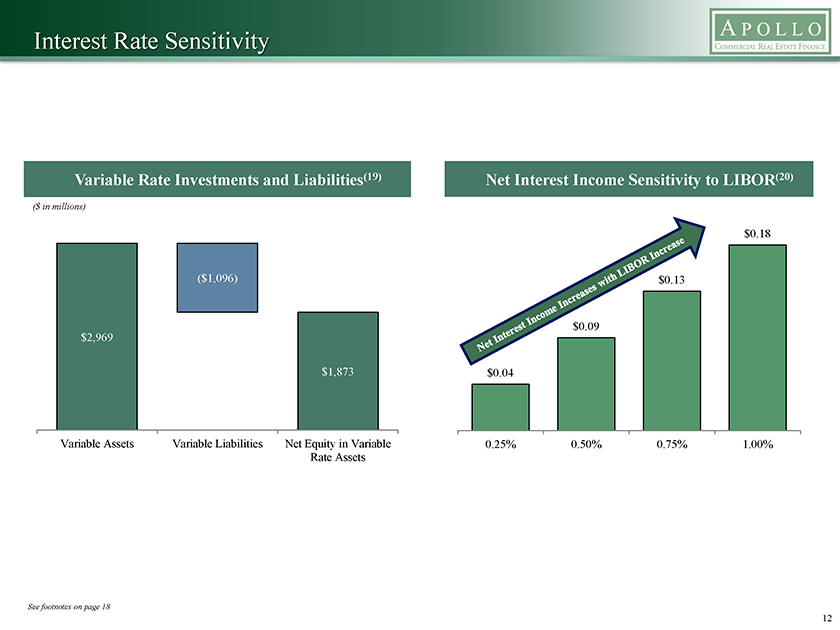
Interest Rate Sensitivity Variable Rate Investments and Liabilities(19) Net Interest Income Sensitivity to LIBOR(20) ($ in millions) $0.18 ($1,096) $0.13 $0.09 $2,969 $1,873 $0.04 Variable Assets Variable Liabilities Net Equity in Variable 0.25% 0.50% 0.75% 1.00% Rate Assets See footnotes on page 18 12

Financials
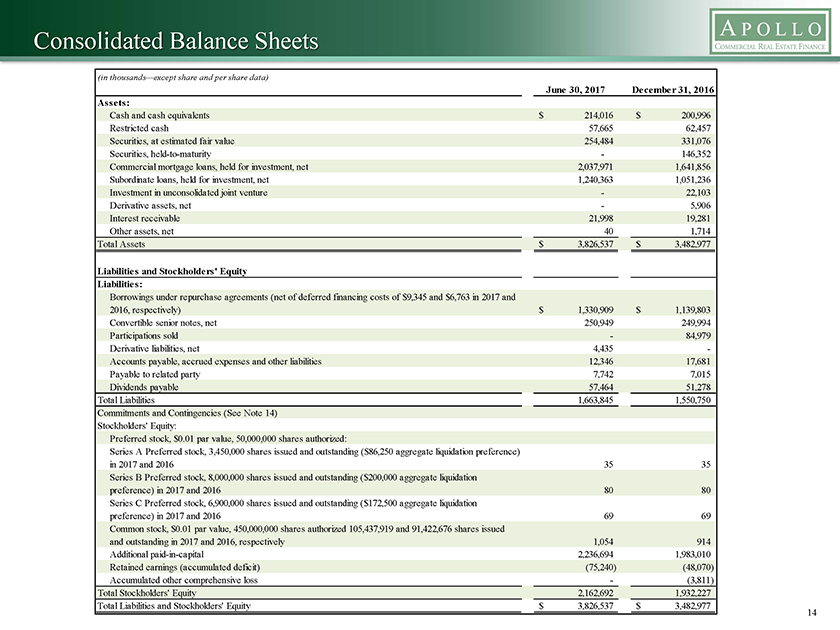
Consolidated Balance Sheets (in thousands—except share and per share data) June 30, 2017 December 31, 2016 Assets: Cash and cash equivalents $ 214,016 $ 200,996 Restricted cash 57,665 62,457 Securities, at estimated fair value 254,484 331,076 Securities, held-to-maturity - 146,352 Commercial mortgage loans, held for investment, net 2,037,971 1,641,856 Subordinate loans, held for investment, net 1,240,363 1,051,236 Investment in unconsolidated joint venture - 22,103 Derivative assets, net - 5,906 Interest receivable 21,998 19,281 Other assets, net 40 1,714 Total Assets $ 3,826,537 $ 3,482,977 Liabilities and Stockholders’ Equity Liabilities: Borrowings under repurchase agreements (net of deferred financing costs of $9,345 and $6,763 in 2017 and 2016, respectively) $ 1,330,909 $ 1,139,803 Convertible senior notes, net 250,949 249,994 Participations sold - 84,979 Derivative liabilities, net 4,435 - Accounts payable, accrued expenses and other liabilities 12,346 17,681 Payable to related party 7,742 7,015 Dividends payable 57,464 51,278 Total Liabilities 1,663,845 1,550,750 Commitments and Contingencies (See Note 14) Stockholders’ Equity: Preferred stock, $0.01 par value, 50,000,000 shares authorized: Series A Preferred stock, 3,450,000 shares issued and outstanding ($86,250 aggregate liquidation preference) in 2017 and 2016 35 35 Series B Preferred stock, 8,000,000 shares issued and outstanding ($200,000 aggregate liquidation preference) in 2017 and 2016 80 80 Series C Preferred stock, 6,900,000 shares issued and outstanding ($172,500 aggregate liquidation preference) in 2017 and 2016 69 69 Common stock, $0.01 par value, 450,000,000 shares authorized 105,437,919 and 91,422,676 shares issued and outstanding in 2017 and 2016, respectively 1,054 914 Additional paid-in-capital 2,236,694 1,983,010 Retained earnings (accumulated deficit) (75,240) (48,070) Accumulated other comprehensive loss - (3,811) Total Stockholders’ Equity 2,162,692 1,932,227 Total Liabilities and Stockholders’ Equity $ 3,826,537 $ 3,482,977 14
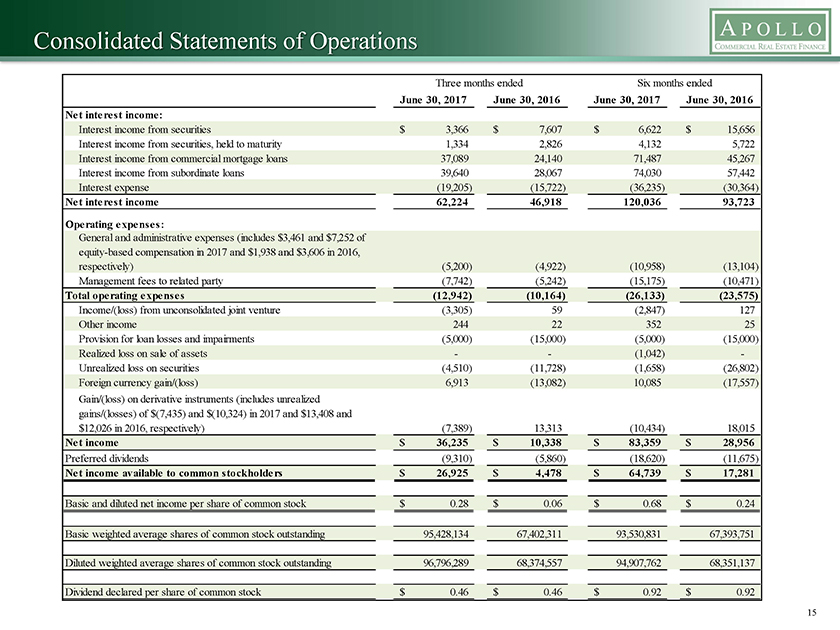
Consolidated Statements of Operations Three months ended Six months ended June 30, 2017 June 30, 2016 June 30, 2017 June 30, 2016 Net interest income: Interest income from securities $ 3,366 $ 7,607 $ 6,622 $ 15,656 Interest income from securities, held to maturity 1,334 2,826 4,132 5,722 Interest income from commercial mortgage loans 37,089 24,140 71,487 45,267 Interest income from subordinate loans 39,640 28,067 74,030 57,442 Interest expense (19,205) (15,722) (36,235) (30,364) Net interest income 62,224 46,918 120,036 93,723 Operating expenses: General and administrative expenses (includes $3,461 and $7,252 of equity-based compensation in 2017 and $1,938 and $3,606 in 2016, respectively) (5,200) (4,922) (10,958) (13,104) Management fees to related party (7,742) (5,242) (15,175) (10,471) Total operating expenses (12,942) (10,164) (26,133) (23,575) Income/(loss) from unconsolidated joint venture (3,305) 59 (2,847) 127 Other income 244 22 352 25 Provision for loan losses and impairments (5,000) (15,000) (5,000) (15,000) Realized loss on sale of assets - - (1,042) - Unrealized loss on securities (4,510) (11,728) (1,658) (26,802) Foreign currency gain/(loss) 6,913 (13,082) 10,085 (17,557) Gain/(loss) on derivative instruments (includes unrealized gains/(losses) of $(7,435) and $(10,324) in 2017 and $13,408 and $12,026 in 2016, respectively) (7,389) 13,313 (10,434) 18,015 Net income $ 36,235 $ 10,338 $ 83,359 $ 28,956 Preferred dividends (9,310) (5,860) (18,620) (11,675) Net income available to common stockholders $ 26,925 $ 4,478 $ 64,739 $ 17,281 Basic and diluted net income per share of common stock $ 0.28 $ 0.06 $ 0.68 $ 0.24 Basic weighted average shares of common stock outstanding 95,428,134 67,402,311 93,530,831 67,393,751 Diluted weighted average shares of common stock outstanding 96,796,289 68,374,557 94,907,762 68,351,137 Dividend declared per share of common stock $ 0.46 $ 0.46 $ 0.92 $ 0.92 15
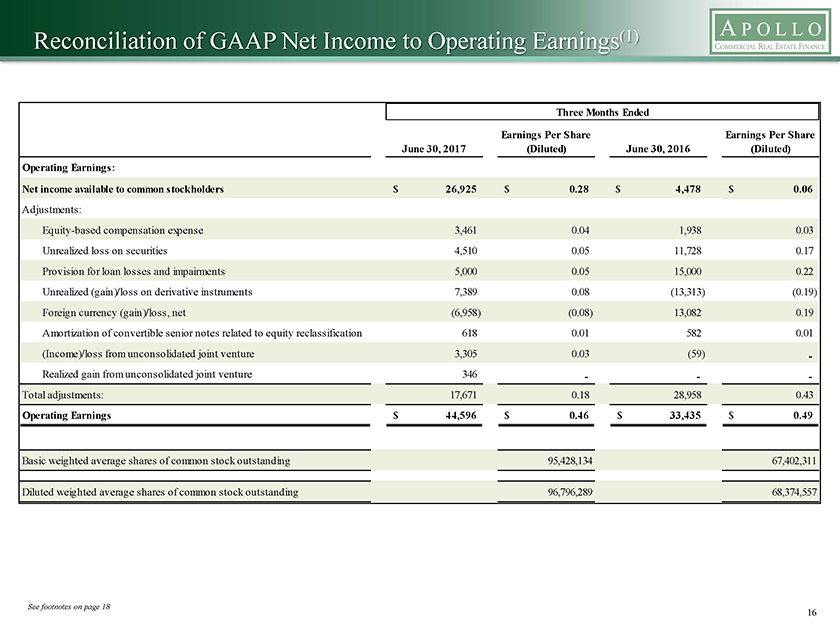
Reconciliation of GAAP Net Income to Operating Earnings(1) Three Months Ended Earnings Per Share Earnings Per Share June 30, 2017 (Diluted) June 30, 2016 (Diluted) Operating Earnings: Net income available to common stockholders $ 26,925 $ 0.28 $ 4,478 $ 0.06 Adjustments: Equity-based compensation expense 3,461 0.04 1,938 0.03 Unrealized loss on securities 4,510 0.05 11,728 0.17 Provision for loan losses and impairments 5,000 0.05 15,000 0.22 Unrealized (gain)/loss on derivative instruments 7,389 0.08 (13,313) (0.19) Foreign currency (gain)/loss, net (6,958) (0.08) 13,082 0.19 Amortization of convertible senior notes related to equity reclassification 618 0.01 582 0.01 (Income)/loss from unconsolidated joint venture 3,305 0.03 (59) - Realized gain from unconsolidated joint venture 346 - - - Total adjustments: 17,671 0.18 28,958 0.43 Operating Earnings $ 44,596 $ 0.46 $ 33,435 $ 0.49 Basic weighted average shares of common stock outstanding 95,428,134 67,402,311 Diluted weighted average shares of common stock outstanding 96,796,289 68,374,557 See footnotes on page 18 16
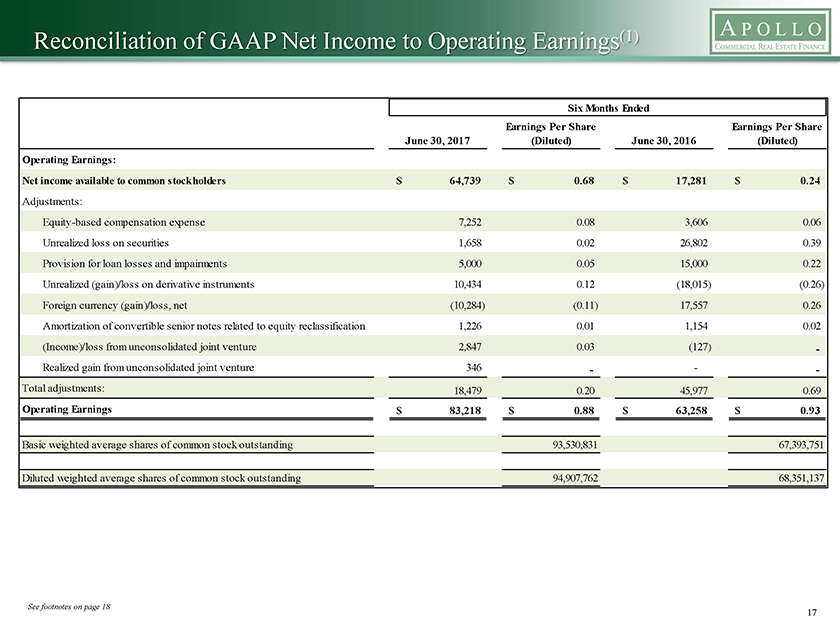
Reconciliation of GAAP Net Income to Operating Earnings(1) Six Months Ended Earnings Per Share Earnings Per Share June 30, 2017 (Diluted) June 30, 2016 (Diluted) Operating Earnings: Net income available to common stockholders $ 64,739 $ 0.68 $ 17,281 $ 0.24 Adjustments: Equity-based compensation expense 7,252 0.08 3,606 0.06 Unrealized loss on securities 1,658 0.02 26,802 0.39 Provision for loan losses and impairments 5,000 0.05 15,000 0.22 Unrealized (gain)/loss on derivative instruments 10,434 0.12 (18,015) (0.26) Foreign currency (gain)/loss, net (10,284) (0.11) 17,557 0.26 Amortization of convertible senior notes related to equity reclassification 1,226 0.01 1,154 0.02 (Income)/loss from unconsolidated joint venture 2,847 0.03 (127) - Realized gain from unconsolidated joint venture 346 - - - Total adjustments: 18,479 0.20 45,977 0.69 Operating Earnings $ 83,218 $ 0.88 $ 63,258 $ 0.93 Basic weighted average shares of common stock outstanding 93,530,831 67,393,751 Diluted weighted average shares of common stock outstanding 94,907,762 68,351,137 See footnotes on page 18 17
Footnotes (1) Operating Earnings is a non-GAAP financial measure that is used by the Company to approximate cash available for distribution and is defined by the Company as net income available to common stockholders, computed in accordance with GAAP, adjusted for (i) equity-based compensation expense (a portion of which may become cash-based upon final vesting and settlement of awards should the holder elect net share settlement to satisfy income tax withholding); (ii) any unrealized gains or losses or other non-cash items included in net income available to common stockholders, (iii) unrealized income from unconsolidated joint ventures, (iv) foreign currency gains/losses, other than realized gains/(losses) related to interest income; (v) the non-cash amortization expense related to the reclassification of a portion of the convertible senior notes to stockholders’ equity in accordance with GAAP; and (vi) provision for loan losses and impairments. Please see slides 16 and 17 for a reconciliation of GAAP net income and GAAP net income per share to Operating Earnings and Operating Earnings per Share. Operating Earnings may also be adjusted to exclude certain other non-cash items, as determined by the Manager and approved by a majority of the Company’s independent directors. (2) Internal rate of return (“IRR”) is the annualized effective compounded return rate that accounts for the time-value of money and represents the rate of return on an investment over a holding period expressed as a percentage of the investment. It is the discount rate that makes the net present value of all cash outflows (the costs of investment) equal to the net present value of cash inflows (returns on investment). It is derived from the negative and positive cash flows resulting from or produced by each transaction (or for a transaction involving more than one investment, cash flows resulting from or produced by each of the investments), whether positive, such as investment returns, or negative, such as transaction expenses or other costs of investment, taking into account the dates on which such cash flows occurred or are expected to occur, and compounding interest accordingly. The underwritten IRR for the investments shown in the table reflect the returns underwritten by the Manager, taking into account leverage and calculated on a weighted average basis assuming no dispositions, early prepayments or defaults but assuming that extension options are exercised and that the cost of borrowings remains constant over the remaining term. With respect to certain loans, the underwritten IRR calculation assumes certain estimates with respect to the timing and magnitude of future fundings for the remaining commitments and associated loan repayments, and assumes no defaults. There can be no assurance that the actual IRRs will equal the underwritten IRRs shown in the presentation. See “Item 1A-Risk Factors-The Company may not achieve its underwritten internal rate of return on its investments which may lead to future returns that may be significantly lower than anticipated” included in the Company’s Annual Report on Form 10-K for the year ended December 31, 2016 for a discussion of some of the factors that could adversely impact the returns received by the Company from the investments shown in the table or elsewhere in this presentation over time. (3) Total balance less $9,345 and $6,737 in Q2 2017and Q4 2016, respectively ,in deferred financing costs. (4) Debt to common equity is net of participations sold. (5) Fixed charge coverage is EBITDA divided by interest expense plus the preferred stock dividends. (6) Unfunded loan commitments are for loans that were previously closed but have yet to be funded. (7) Represents an underwritten levered weighted average IRR. The Company’s ability to achieve the underwritten levered weighted average IRR additionally depends upon the availability of the Company’s master repurchase agreement with JPMorgan Chase Bank, N.A. (the JPMorgan Facility”) or any replacement facility with similar terms with regard to its portfolio of first mortgage loans. Without such availability, the levered weighted average underwritten IRR will be lower than the amount shown. (8) Remaining Weighted Average Life assumes all extension options are exercised. (9) Other includes a data center and water park resorts. (10) Based upon face amount of loans. (11) Maturities reflect the fully funded amounts of the loans. (12) Future funding dates are based upon the Manager’s estimates based upon the best information available to the Manager at the time. There is no assurance that the payments will occur in accordance with these estimates or at all,which could affect the Company’s operating results. (13) LTV’s are as of the date of loan origination. (14) Includes $57.7 million of restricted cash related to the UBS Facility and the DB CMBS Facility. (15) Assumes extension options are exercised. (16) Assumes one-month LIBOR at June 30, 2017 was 1.12%. (17) The debt balance as of June 30, 2017, includes $143 million of borrowings for the first mortgage loans secured by an assemblage of properties in the Design District of Miami that does not count toward the maximum capacity under the JPMorgan Facility. (18) Based upon the $1.84 annualized dividend per share of common stock and the closing stock price on July 31, 2017. (19) Based upon face amount. (20) Based upon the Company’s portfolio as of June 30, 2017; any such hypothetical impact on interest rates on the Company’s variable rate borrowings does not consider the effect of any change in overall economic activity that could occur in a rising interest rate environment. Further, in the event of a change in interest rates of that magnitude, the Company may take actions to further mitigate the Company’s exposure to such a change. However, due to the uncertainty of the specific actions that would be taken and their possible effects, this analysis assumes no changes in the Company’s financial structure. 18