Attached files
| file | filename |
|---|---|
| EX-99.2 - SUPPLEMENTAL MATERIALS (UNOFFICIAL PDF COPY) - Orchid Island Capital, Inc. | q22017supplementalmaterials.pdf |
| EX-99.1 - EXHIBIT 99.1 - Orchid Island Capital, Inc. | orc8k20170731x991.htm |
| 8-K - ORC FORM 8-K 2017-07-31 - Orchid Island Capital, Inc. | orc8k20170731.htm |
EXHIBIT 99.1

8 Q2 2017 Supplemental Materials July 31, 2017

Disclaimers Forward-Looking InformationThis presentation contains forward-looking statements and information. Statements that are not historical facts, including statements about our beliefs and expectations, are forward-looking statements. Forward-looking statements include statements preceded by, followed by or that include the words “may,” “could,” “would,” “should,” “believe,” “expect,” “anticipate,” “plan,” “estimate,” “target,” “project,” “intend” and similar expressions. These statements include, among others, statements regarding our expected performance, anticipated returns on our investment, financing, and hedging strategies and means to implement those strategies.The forward-looking statements are based on our beliefs, assumptions and expectations of our future performance, taking into account all information currently available to us. You should not place undue reliance on these forward-looking statements. These beliefs, assumptions and expectations can change as a result of many possible events or factors, not all of which are known to us. Some of these factors are described under the caption ‘‘Risk Factors’’ in this Quarterly Report on Form 10-Q. If a change occurs, our business, financial condition, liquidity and results of operations may vary materially from those expressed in our forward-looking statements. Any forward-looking statement speaks only as of the date on which it is made. New risks and uncertainties arise from time to time, and it is impossible for us to predict those events or how they may affect us. Except as required by law, we are not obligated to, and do not intend to, update or revise any forward looking statements, whether as a result of new information, future events or otherwise. 2

GAAP to Non-GAAP Reconciliation In addition to the results presented in accordance with GAAP, our results of operations discussed below include certain non-GAAP financial information, including “Net Income Excluding Realized and Unrealized Gains and Losses.”Net Income Excluding Realized and Unrealized Gains and LossesWe have elected the fair value option for all of our MBS assets and have not elected to designate our derivative holdings for hedge accounting treatment under the Financial Accounting Standards Board (the “FASB”), Accounting Standards Codification (“ASC”), Topic 815, Derivatives and Hedging. Changes in fair value of these instruments are presented in a separate line item in our consolidated statements of operations. Therefore, we mark all of our MBS assets and hedge instruments to market every reporting period. With the volatility that occurs in markets every quarter, the market value of these assets and hedge instruments varies as well. These fluctuations in value are reported in our statement of operations every period. We have presented the results of our operations in the tables below with and without these realized and unrealized gains and losses included in the calculation of net income/(loss). We believe that net income excluding realized and unrealized gains and losses provides meaningful information to consider, in addition to the respective amounts prepared in accordance with GAAP. This non-GAAP measure helps management to evaluate its financial position and performance without the effects of these realized and unrealized gains and losses that are not necessarily indicative of our financial performance. The unrealized gains or losses on derivative instruments and MBS assets presented in our consolidated statements of operations are not necessarily representative of the ultimate gain or loss, if any, that we may realize in the future. This is because as interest rates move up or down in the future, the gains or losses we ultimately realize, and which will affect our net income for the then current period, may differ from the unrealized gains or losses recognized as of the reporting date. With respect to realized gains and losses, the application of the fair value method of accounting may cause users of our financial statements to conclude that the realized gains or losses in a given period are indicative of the gains and losses incurred from the date we purchased the assets or hedge instruments. This is not the case, as the fair value method of accounting requires us to report gains and losses based on the movement in the market value of the instrument in question since the beginning of the period only.Our presentation of net income excluding realized and unrealized gains and losses has important limitations. First, other market participants may use the available for sale method of accounting for their MBS assets. Under the available for sale method of accounting, fluctuation in the value of MBS assets are reflected in other comprehensive income, a component of the shareholders equity section of the balance sheet. Second, while we believe that the calculation of net income excluding realized and unrealized gains and losses described above helps to present our financial position and performance, it may be of limited usefulness as an analytical tool. Therefore, net income excluding realized and unrealized gains and losses should not be viewed in isolation and is not a substitute for net income computed in accordance with GAAP.The table below on page 14 and the appendix associated with the earnings per share chart on page 15 present a reconciliation of the adjustments to net income calculated in accordance with GAAP, as well as the associated per share amounts, for the second quarter of 2017 and all previous quarters. 3

Table of Contents Topic Point Financial Highlights for the QuarterMarket DevelopmentsFinancial ResultsMBS Portfolio Characteristics, Credit Counterparties, and Hedge PositionAppendix 5 6 – 1213 – 1819 – 2829 – 30 4 Slide(s)

Financial Highlights for the Quarter Ended June 30, 2017 Earnings per share of $(0.26)Incurred $0.88 loss per share from net realized and unrealized gain/(losses) on MBS and derivative instrumentsEarnings per share of $0.62 excluding realized and unrealized gains/(losses) on MBS and derivative instruments (See page 14 for a reconciliation of this non-GAAP measure to earnings per share)Book value per share of $9.23 at June 30, 2017A decrease of $0.52 (or -5.3%) from $9.75 at March 31, 2017Dividend of $0.42 declared during the quarterEconomic return of $(0.10) per share, or (1.0)% unannualized / (4.1)% annualized 5

Market Developments 6

10-Year U.S. Treasury Note & U.S. Dollar Swap: Q2 2017 7 10-Year U.S. Treasury Note: Q2 2017 10-Year U.S. Dollar Swap: Q2 2017 Source: Bloomberg Data

U.S. Treasury Curve: Q2 2017 Performance Yield (%) Change (bps) 8 Source: Bloomberg Data

U.S. Dollar Swap Curve: Q2 2017 Performance 3Mo 1Yr 2Yr 3Yr 5Yr 7Yr 10Yr 30Yr 3Mo 1Yr 2Yr 3Yr 5Yr 7Yr 10Yr 30Yr 9 Source: Bloomberg Data Tenor

FNCL 4.0 & FNCL 4.5: Q2 2017 10 Source: Bloomberg Data

Wells Fargo Production ‘85k Max’ Specified Pool Payup over TBA 11 Source: Wells Fargo Securities FNCL ‘85k Max’ 4.0 FNCL ‘85k Max’ 4.5

Wells Fargo ‘New Production’ Specified Pool Payup over TBA 12 Source: Wells Fargo Securities FNCL ‘New Prod’ 4.0 FNCL ‘New Prod’ 4.5
Financial Results 13

Financial Results for the Three Months Ended June 30, 2017 14 ($ in thousands, except per share data) Net Income Excluding Realized and Unrealized Gains and (Losses) Realized and Unrealized Gains/(Losses) Total Interest income $ 34,579 $ - $ 34,579 Interest expense (8,763) - (8,763) Net interest income 25,816 - 25,816 Realized gains on mortgage-backed securities - 3,935 3,935 Unrealized losses on mortgage-backed securities - (17,090) (17,090) Losses on interest rate futures and TBA contracts - (15,264) (15,264) Losses on interest rate swaps - (4,178) (4,178) Net portfolio income (loss) $ 25,816 $ (32,597) $ (6,781) Expenses: Management fees 1,400 - 1,400 Allocated overhead 388 - 388 Accrued incentive compensation 218 - 218 Directors' fees and liability insurance 232 - 232 Audit, legal and other professional fees 219 - 219 Direct REIT operating expenses 265 - 265 Other administrative 140 - 140 Total expenses 2,862 - 2,862 Net income (loss) $ 22,954 $ (32,597) $ (9,643) Basic and diluted net income (loss) per share $ 0.62 $ (0.88) $ (0.26) Weighted average shares outstanding - Basic and diluted 37,211,362 37,211,362 37,211,362 Dividends declared per common share $0.42 Source: Company Financials

Earnings Per Share (EPS) as Reported and with Gains/(Losses) Removed(1) 15 Source: Company Financials See appendix for supporting data.

MBS Portfolio Roll Forward March 31, 2017 to June 30, 2017 (in thousands) Portfolio Activity for the Quarter Structured Security Portfolio Pass-Through Interest-Only Inverse Interest Portfolio Securities Only Securities Sub-total Total Market value - March 31, 2017 $ 3,107,660 $ 107,214 $ 47,143 $ 154,357 $ 3,262,017 Securities purchased 2,223,226 4,926 - 4,926 2,228,152 Securities sold (1,657,306) - - - (1,657,306) Gains on sales 3,935 - - - 3,935 Return of investment n/a (6,565) (1,850) (8,415) (8,415) Pay-downs (73,466) n/a n/a n/a (73,466) Premium lost due to pay-downs (5,499) n/a n/a n/a (5,499) Mark to market losses (8,126) (3,023) (442) (3,465) (11,591) Market value - June 30, 2017 $ 3,590,424 $ 102,552 $ 44,851 $ 147,403 $ 3,737,827 16 Source: Company Financials

MBS Portfolio Capital Allocation at March 31, 2017 and June 30, 2017 ($ in thousands) Capital Allocation Structured Security Portfolio Pass-Through Interest-Only Inverse Interest Portfolio Securities Only Securities Sub-total Total As of June 30, 2017 Market value $ 3,590,424 $ 102,552 $ 44,851 $ 147,403 $ 3,737,827 Cash(1) (54,028) - - - (54,028) Borrowings(2) (3,278,456) - - - (3,278,456) Total $ 257,940 $ 102,552 $ 44,851 $ 147,403 $ 405,343 % of Total 63.60% 25.30% 11.10% 36.40% 100.00% As of March 31, 2017 Market value $ 3,107,660 $ 107,214 $ 47,143 $ 154,357 $ 3,262,017 Cash 112,723 - - - 112,723 Borrowings(3) (3,050,608) - - - (3,050,608) Total $ 169,775 $ 107,214 $ 47,143 $ 154,357 $ 324,132 % of Total 52.40% 33.10% 14.50% 47.60% 100.00% At June 30, 2017, cash was reduced by unsettled security purchases of $273.7 million which have already been included in the value of the portfolio.At June 30, 2017, there were outstanding repurchase agreement balances of $74.4 million and $34.6 million secured by IO and IIO securities, respectively. We entered into these arrangements to generate additional cash available to meet margin calls on Pass-Through MBS; therefore, we have not considered these balances to be allocated to the structured securities strategy.At March 31, 2017, there were outstanding repurchase agreement balances of $63.8 million and $33.6 million secured by IO and IIO securities, respectively. We entered into these arrangements to generate additional cash available to meet margin calls on Pass-Through MBS; therefore, we have not considered these balances to be allocated to the structured securities strategy. 17 Source: Company Financials

MBS Portfolio Returns by Sector for the Quarter Ended June 30, 2017 ($ in thousands) Returns for the Quarter Ended June 30, 2017 Structured Security Portfolio Pass-Through Interest-Only Inverse Interest Portfolio Securities Only Securities Sub-total Total Net interest income $ 23,716 $ 843 $ 1,257 $ 2,100 $ 25,816 Realized and unrealized losses (9,690) (3,023) (442) (3,465) (13,155) Derivative losses (19,442) n/a n/a n/a (19,442) Net portfolio income (loss) $ (5,416) $ (2,180) $ 815 $ (1,365) $ (6,781) Beginning Capital Allocation $ 169,775 $ 107,214 $ 47,143 $ 154,357 $ 324,132 Return on Invested Capital for the Quarter(1) (3.20)% (2.00)% 1.70% (0.90)% (2.10)% Average Capital Allocation(2) $ 213,858 $ 104,883 $ 45,997 $ 150,880 $ 364,738 Return on Average Invested Capital for the Quarter(3) (2.50)% (2.10)% 1.80% (0.90)% (1.90)% Calculated by dividing the Total Return by the Beginning Capital Allocation, expressed as a percentage.Calculated using two data points, the Beginning and Ending Capital Allocation balances.Calculated by dividing the Total Return by the Average Capital Allocation, expressed as a percentage. 18 Source: Company Financials

Portfolio Characteristics, Credit Counterparties & Hedge Position 19

Orchid Island Capital Portfolio Market Value Composition 20 Source: Company Press Releases

Orchid Island Capital Market Value of Structured Securities (IO & IIO) 21 Source: Company Press Releases

Orchid Island Capital Fixed Rate MBS Holdings 22 Source: Company Press Releases

Orchid Island Capital Portfolio Capital Allocation 23 Source: Company Press Releases
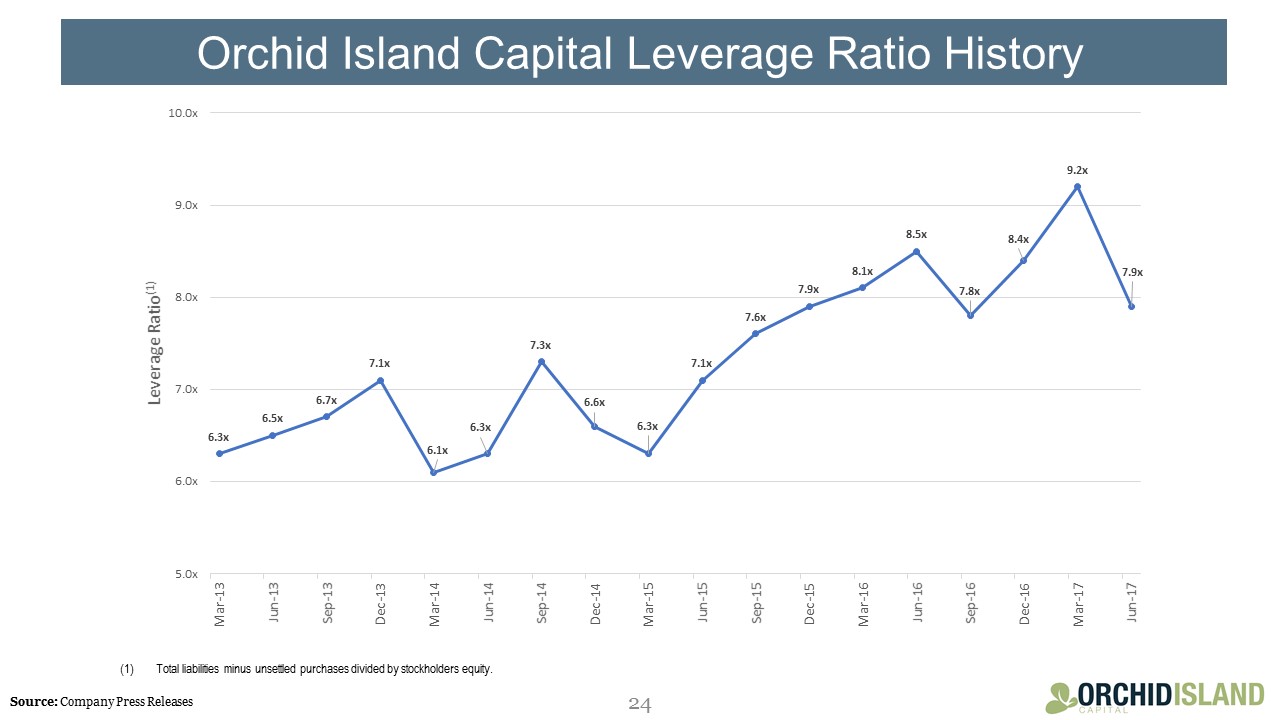
Orchid Island Capital Leverage Ratio History 24 Total liabilities minus unsettled purchases divided by stockholders equity. Source: Company Press Releases

Orchid Island Capital MBS Portfolio Characteristics as of June 30, 2017 MBS Valuation Characteristics (in thousands of $s) Asset Category Current Face FairValue Current Price Percentage of Portfolio Weighted Average Coupon Realized Jun 2017 CPR (Reported in Jul) As of June 30, 2017 Adjustable Rate MBS $ 1,814 $ 1,929 106.34 0.05% 3.52% 0.1% 10-1 Hybrid Rate MBS 41,839 42,881 102.49 1.15% 2.55% 0.8% Total Hybrid Adjustable Rate MBS 41,839 42,881 102.49 1.15% 2.55% 0.8% 15 Year Fixed Rate MBS 42,907 45,049 104.99 1.21% 3.50% 11.8% 20 Year Fixed Rate MBS 212,874 226,258 106.29 6.05% 4.00% 4.2% 30 Year Fixed Rate MBS 3,034,026 3,274,307 107.92 87.60% 4.46% 6.6% Total Fixed Rate MBS 3,289,807 3,545,614 107.78 94.86% 4.42% 6.5% Total Mortgage-backed Pass-through MBS 3,333,460 3,590,425 107.71 96.06% 4.39% 6.4% Interest-Only Securities 798,981 102,552 12.84 2.74% 3.74% 15.5% Inverse Interest-Only Securities 232,723 44,851 19.27 1.20% 5.02% 14.1% Structured MBS 1,031,704 147,402 14.29 3.94% 4.13% 15.2% Total Mortgage Assets $ 4,365,165 $ 3,737,827 100.00% 4.38% 8.6% MBS Assets by Agency Investment Company Act of 1940 (Whole Pool) Test (in thousands of $s) (in thousands of $s) As of June 30, 2017 FairValue Percentage of Portfolio As of June 30, 2017 FairValue Percentage of Portfolio Fannie Mae $ 2,621,464 70.1% Whole Pool Assets $ 3,187,442 85.3% Freddie Mac 1,107,792 29.6% Non Whole Pool Assets 550,385 14.7% Ginnie Mae 8,571 0.2% Total Portfolio $ 3,737,827 100% Total Portfolio $ 3,737,827 100% 25 Source: Company Financials

Orchid Island Capital Credit Counterparties ($ in thousands) As of June 30, 2017 Counterparty Total Outstanding Balances % of Total Weighted Average Borrowing Rate Amount at Risk(1) Weighted Average Maturity in Days J.P. Morgan Securities LLC $ 610,851 18.50% 1.32% $ 35,463 12 Wells Fargo Bank, N.A. 313,206 9.60% 1.28% 15,235 11 Citigroup Global Markets, Inc. 269,560 8.20% 1.30% 22,151 17 ICBC Financial Services, LLC 241,736 7.40% 1.30% 12,226 12 Cantor Fitzgerald & Co. 229,485 7.00% 1.34% 12,037 31 RBC Capital Markets, LLC 227,896 7.00% 1.32% 12,018 13 Mitsubishi UFJ Securities (USA), Inc. 192,516 5.90% 1.08% 9,790 17 South Street Securities, LLC 173,925 5.30% 1.27% 8,524 11 Merrill Lynch, Pierce, Fenner & Smith Inc 159,470 4.90% 1.36% 5,176 17 ED&F Man Capital Markets Inc. 155,908 4.80% 1.29% 7,837 51 Natixis, New York Branch 142,158 4.30% 1.45% 22,085 18 Mirae Asset Securities (USA) Inc. 127,280 3.90% 1.28% 6,550 43 Daiwa Capital Markets America, Inc. 92,750 2.80% 1.32% 4,331 12 FHLB-Cincinnati 80,180 2.40% 1.17% 2,773 3 KGS-Alpha Capital Markets, L.P. 68,296 2.10% 1.30% 3,527 11 Nomura Securities International, Inc. 63,992 2.00% 1.16% 3,056 40 Goldman Sachs & Co. 53,858 1.60% 1.37% 3,951 14 Guggenheim Securities, LLC 53,020 1.60% 1.34% 2,608 40 Mizuho Securities USA, Inc. 22,369 0.70% 1.35% 1,243 26 Total / Weighted Average $ 3,278,456 100.00% 1.30% $ 190,581 18 Equal to the sum of the fair value of securities sold, accrued interest receivable and cash posted as collateral (if any), minus the sum of repurchase agreement liabilities, accrued interest payable and the fair value of securities posted by the counterparties (if any). 26 Source: Company Financials
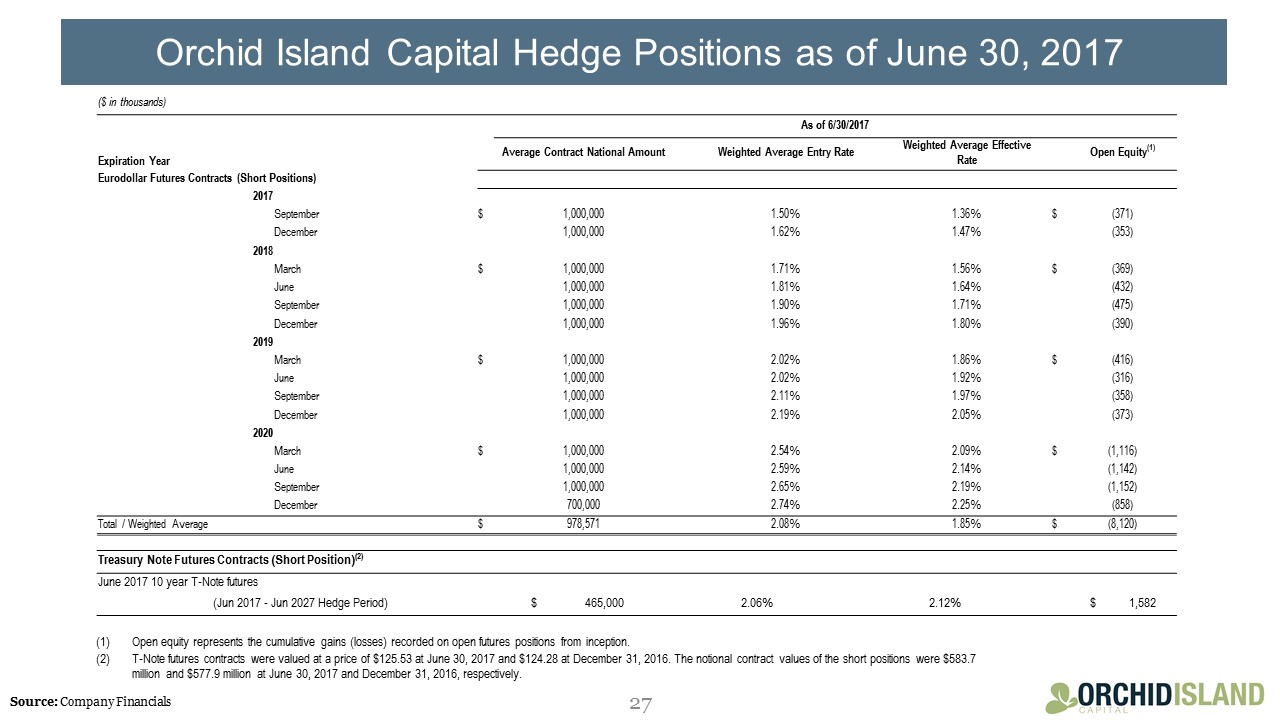
Orchid Island Capital Hedge Positions as of June 30, 2017 Treasury Note Futures Contracts (Short Position)(2) June 2017 10 year T-Note futures (Jun 2017 - Jun 2027 Hedge Period) $ 465,000 2.06% 2.12% $ 1,582 Open equity represents the cumulative gains (losses) recorded on open futures positions from inception.T-Note futures contracts were valued at a price of $125.53 at June 30, 2017 and $124.28 at December 31, 2016. The notional contract values of the short positions were $583.7 million and $577.9 million at June 30, 2017 and December 31, 2016, respectively. ($ in thousands) As of 6/30/2017 Expiration Year Average Contract National Amount Weighted Average Entry Rate Weighted Average Effective Rate Open Equity(1) Eurodollar Futures Contracts (Short Positions) 2017 September $ 1,000,000 1.50% 1.36% $ (371) December 1,000,000 1.62% 1.47% (353) 2018 March $ 1,000,000 1.71% 1.56% $ (369) June 1,000,000 1.81% 1.64% (432) September 1,000,000 1.90% 1.71% (475) December 1,000,000 1.96% 1.80% (390) 2019 March $ 1,000,000 2.02% 1.86% $ (416) June 1,000,000 2.02% 1.92% (316) September 1,000,000 2.11% 1.97% (358) December 1,000,000 2.19% 2.05% (373) 2020 March $ 1,000,000 2.54% 2.09% $ (1,116) June 1,000,000 2.59% 2.14% (1,142) September 1,000,000 2.65% 2.19% (1,152) December 700,000 2.74% 2.25% (858) Total / Weighted Average $ 978,571 2.08% 1.85% $ (8,120) 27 Source: Company Financials
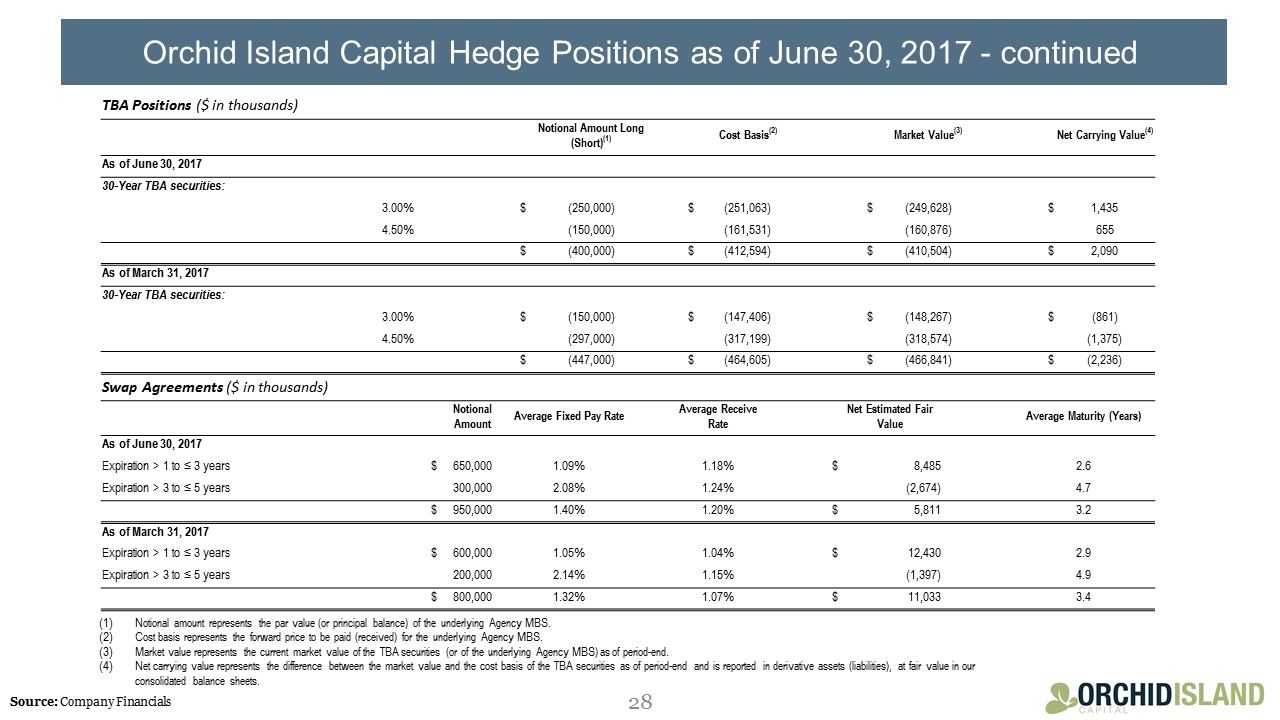
Orchid Island Capital Hedge Positions as of June 30, 2017 - continued TBA Positions ($ in thousands) Notional Amount Long (Short)(1) Cost Basis(2) Market Value(3) Net Carrying Value(4) As of June 30, 2017 30-Year TBA securities: 3.00% $ (250,000) $ (251,063) $ (249,628) $ 1,435 4.50% (150,000) (161,531) (160,876) 655 $ (400,000) $ (412,594) $ (410,504) $ 2,090 As of March 31, 2017 30-Year TBA securities: 3.00% $ (150,000) $ (147,406) $ (148,267) $ (861) 4.50% (297,000) (317,199) (318,574) (1,375) $ (447,000) $ (464,605) $ (466,841) $ (2,236) Swap Agreements ($ in thousands) Notional Amount Average Fixed Pay Rate Average Receive Rate Net Estimated Fair Value Average Maturity (Years) As of June 30, 2017 Expiration > 1 to ≤ 3 years $ 650,000 1.09% 1.18% $ 8,485 2.6 Expiration > 3 to ≤ 5 years 300,000 2.08% 1.24% (2,674) 4.7 $ 950,000 1.40% 1.20% $ 5,811 3.2 As of March 31, 2017 Expiration > 1 to ≤ 3 years $ 600,000 1.05% 1.04% $ 12,430 2.9 Expiration > 3 to ≤ 5 years 200,000 2.14% 1.15% (1,397) 4.9 $ 800,000 1.32% 1.07% $ 11,033 3.4 Notional amount represents the par value (or principal balance) of the underlying Agency MBS.Cost basis represents the forward price to be paid (received) for the underlying Agency MBS.Market value represents the current market value of the TBA securities (or of the underlying Agency MBS) as of period-end.Net carrying value represents the difference between the market value and the cost basis of the TBA securities as of period-end and is reported in derivative assets (liabilities), at fair value in our consolidated balance sheets. 28 Source: Company Financials

Appendix 29
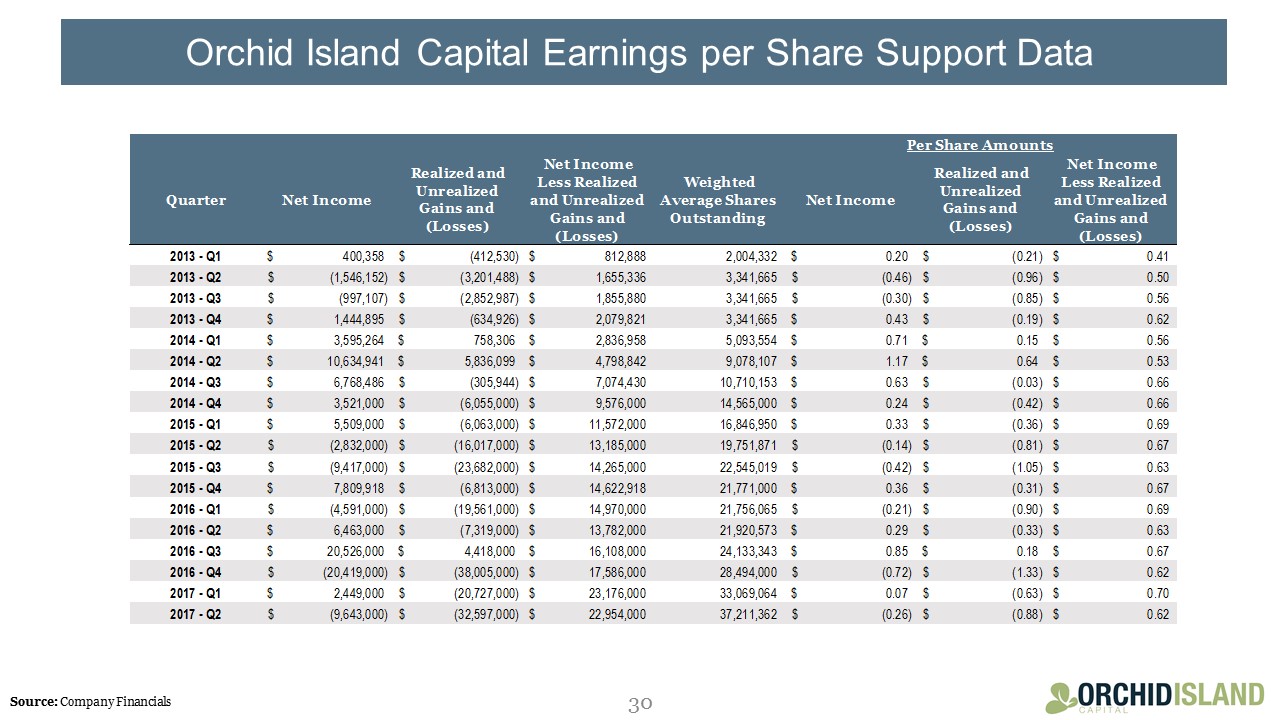
Orchid Island Capital Earnings per Share Support Data 30 Source: Company Financials