Attached files
| file | filename |
|---|---|
| 8-K - 8-K - CENTRAL VALLEY COMMUNITY BANCORP | a8-kirpresentationkbwaugus.htm |
Investor Presentation
KBW Community Bank Investor Conference
August 1 - 2, 2017
Jim Ford President & CEO
Dave Kinross EVP CFO
Forward-Looking Statements
2
Certain matters discussed herein constitute forward-looking statements within the meaning of the Private Securities Litigation Reform Act of
1995. All statements contained herein that are not historical facts, such as statements regarding the Company’s current business strategy
and the Company’s plans for future development and operations, are based upon current expectations. These statements are forward-
looking in nature and involve a number of risks and uncertainties. Such risks and uncertainties include, but are not limited to (1) significant
increases in competitive pressure in the banking industry; (2) the impact of changes in interest rates, a decline in economic conditions at the
international, national or local level on the Company’s results of operations, the Company’s ability to continue its internal growth at
historical rates, the Company’s ability to maintain its net interest margin, and the quality of the Company’s earning assets; (3) changes in the
regulatory environment; (4) fluctuations in the real estate market; (5) changes in business conditions and inflation; (6) changes in securities
markets; (7) the expected cost savings, synergies and other financial benefits for the Folsom Lake Bank (“FLB”) acquisition might not be
realized within the expected time frames or at all; (8) governmental approval of the FLB acquisition may not be obtained or adverse
regulatory conditions may be imposed in connection with governmental approval of the acquisition; (9) conditions to the closing of the FLB
acquisition may not be satisfied, (10) the shareholders of FLB may fail to approve the consummation of the acquisition, and (11) the other
risks set forth in the Company’s reports filed with the Securities and Exchange Commission, including its Annual Report on Form 10-K for the
year ended December 31, 2016. Therefore, the information set forth in such forward-looking statements should be carefully considered
when evaluating the business prospects of the Company.
Central Valley Community Bancorp will undertake no obligation to revise or publically release any revision or update to the forward looking
statements to reflect events or circumstances that occur after the date on which statements were made.
Central Valley Community Bancorp has filed a registration statement with the SEC, including a proxy statement/prospectus and other
relevant documents concerning the proposed FLB transaction. This communication does not constitute an offer to sell or the solicitation of
an offer to buy any securities or a solicitation of any vote or approval. WE URGE INVESTORS TO READ THE PROXY STATEMENT/PROSPECTUS
AND ANY OTHER DOCUMENTS FILED WITH THE SEC IN CONNECTION WITH THE MERGER OR INCORPORATED BY REFERENCE IN THE PROXY
STATEMENT/PROSPECTUS BECAUSE THEY CONTAIN IMPORTANT INFORMATION. The proxy statement/prospectus is be available for free,
both on the SEC website (http://www.sec.gov) and from Central Valley Community Bancorp and Folsom Lake Bank.
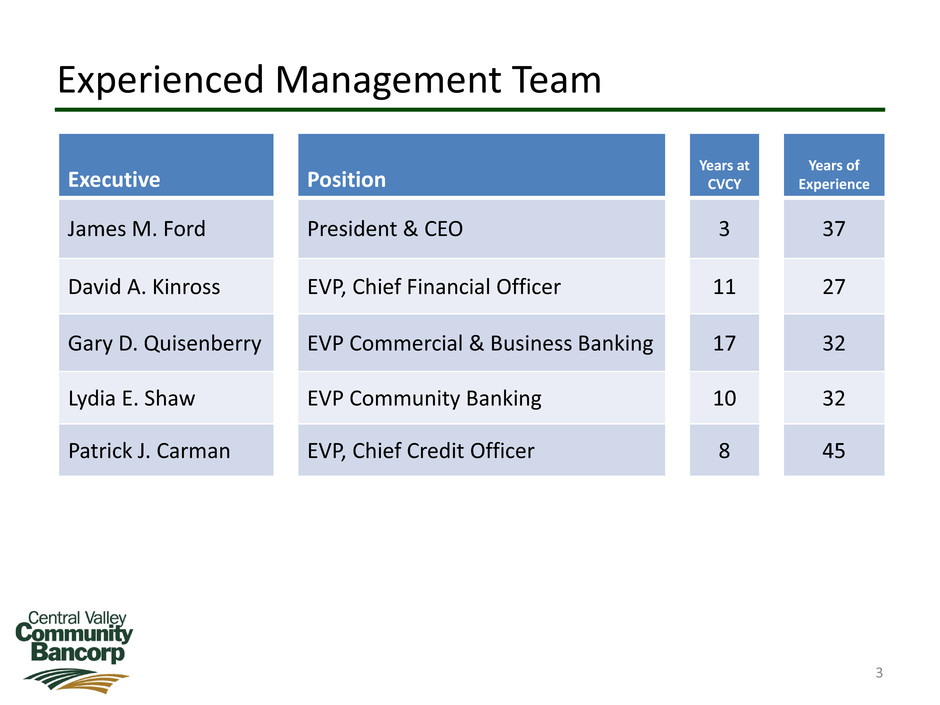
Experienced Management Team
3
Executive Position
Years at
CVCY
Years of
Experience
James M. Ford President & CEO 3 37
David A. Kinross EVP, Chief Financial Officer 11 27
Gary D. Quisenberry EVP Commercial & Business Banking 17 32
Lydia E. Shaw EVP Community Banking 10 32
Patrick J. Carman EVP, Chief Credit Officer 8 45
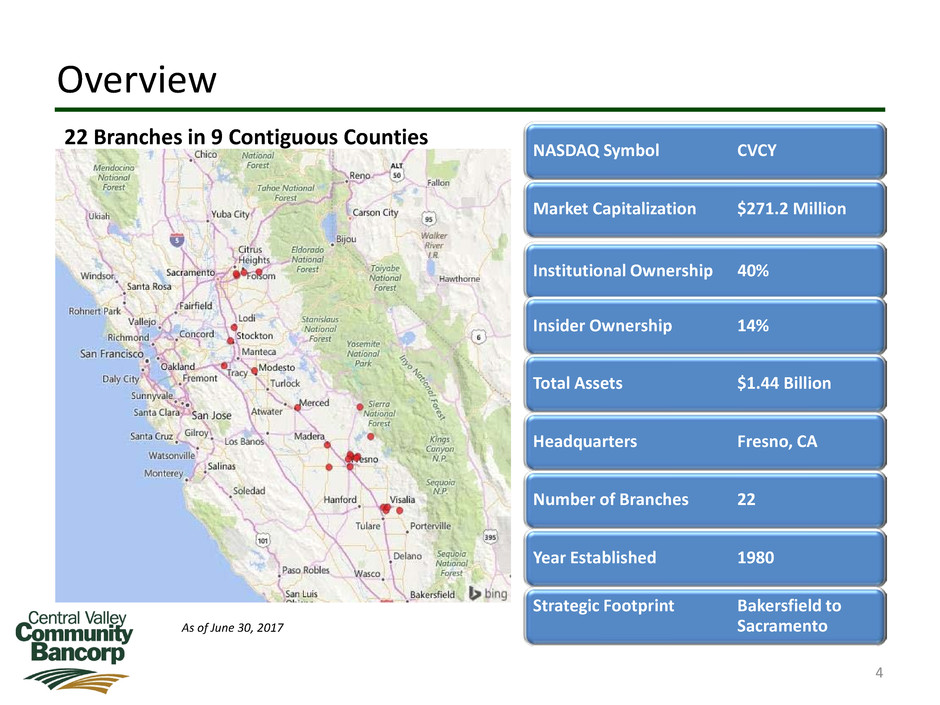
Overview
4
NASDAQ Symbol CVCY
Market Capitalization $271.2 Million
Institutional Ownership 40%
Insider Ownership 14%
Total Assets $1.44 Billion
Headquarters Fresno, CA
Number of Branches 22
Year Established 1980
Strategic Footprint Bakersfield to
Sacramento
22 Branches in 9 Contiguous Counties
As of June 30, 2017
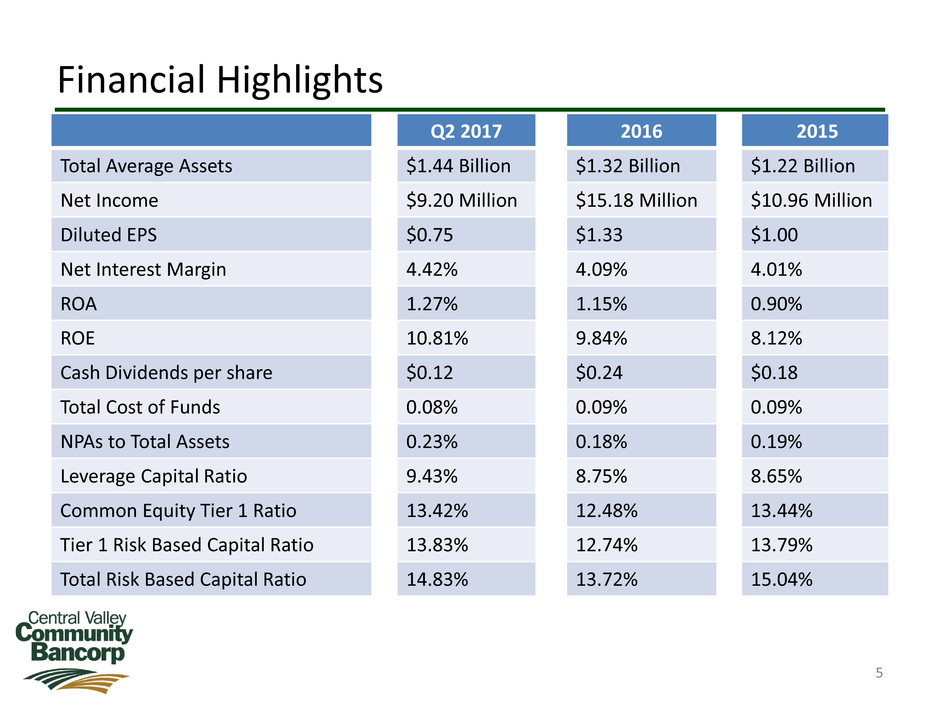
Financial Highlights
5
Q2 2017 2016 2015
Total Average Assets $1.44 Billion $1.32 Billion $1.22 Billion
Net Income $9.20 Million $15.18 Million $10.96 Million
Diluted EPS $0.75 $1.33 $1.00
Net Interest Margin 4.42% 4.09% 4.01%
ROA 1.27% 1.15% 0.90%
ROE 10.81% 9.84% 8.12%
Cash Dividends per share $0.12 $0.24 $0.18
Total Cost of Funds 0.08% 0.09% 0.09%
NPAs to Total Assets 0.23% 0.18% 0.19%
Leverage Capital Ratio 9.43% 8.75% 8.65%
Common Equity Tier 1 Ratio 13.42% 12.48% 13.44%
Tier 1 Risk Based Capital Ratio 13.83% 12.74% 13.79%
Total Risk Based Capital Ratio 14.83% 13.72% 15.04%
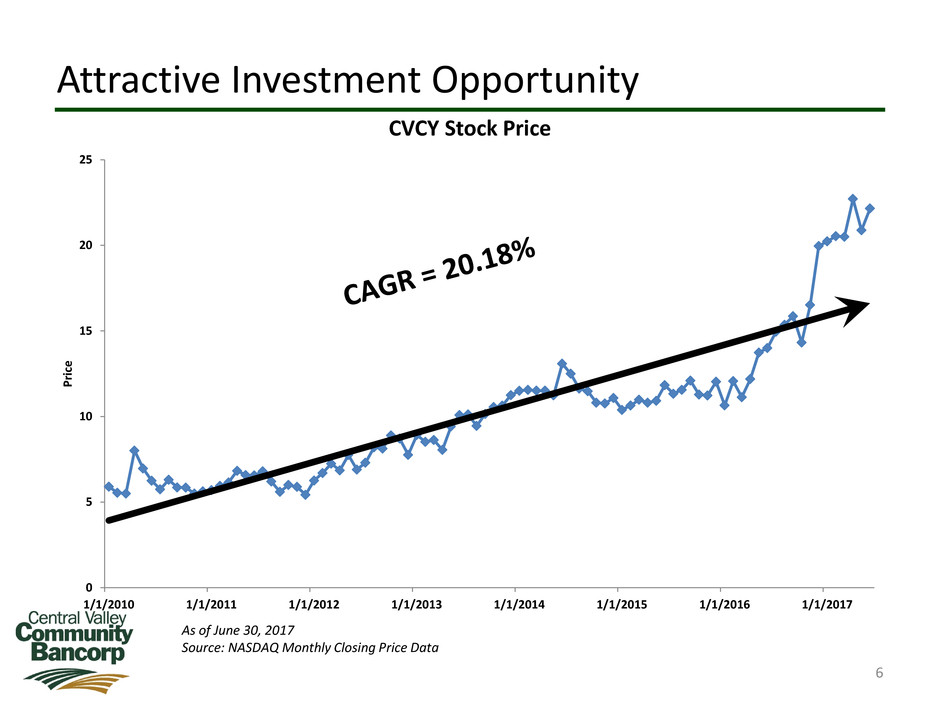
Attractive Investment Opportunity
6
As of June 30, 2017
Source: NASDAQ Monthly Closing Price Data
0
5
10
15
20
25
1/1/2010 1/1/2011 1/1/2012 1/1/2013 1/1/2014 1/1/2015 1/1/2016 1/1/2017
Pr
ic
e
CVCY Stock Price
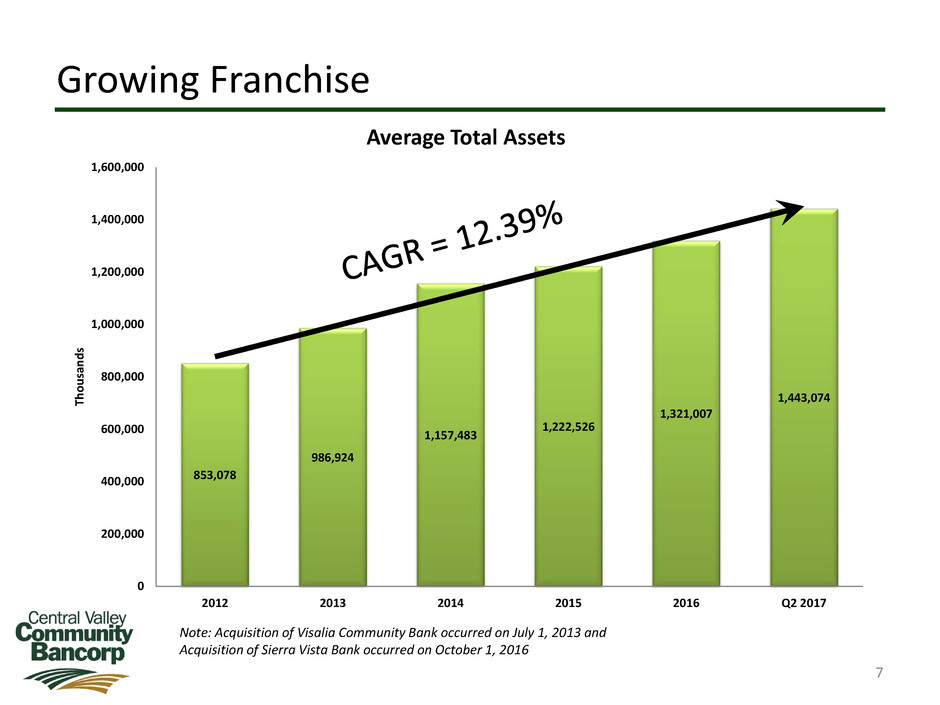
Growing Franchise
7
Note: Acquisition of Visalia Community Bank occurred on July 1, 2013 and
Acquisition of Sierra Vista Bank occurred on October 1, 2016
853,078
986,924
1,157,483
1,222,526
1,321,007
1,443,074
0
200,000
400,000
600,000
800,000
1,000,000
1,200,000
1,400,000
1,600,000
2012 2013 2014 2015 2016 Q2 2017
Th
ou
sa
nd
s
Average Total Assets
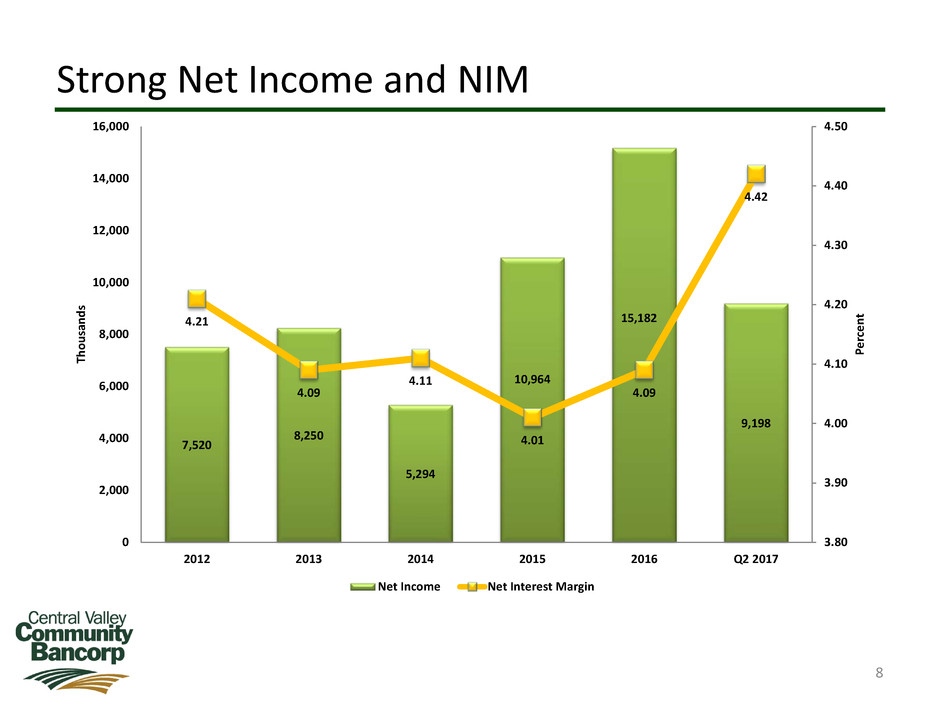
Strong Net Income and NIM
8
7,520
8,250
5,294
10,964
15,182
9,198
4.21
4.09
4.11
4.01
4.09
4.42
3.80
3.90
4.00
4.10
4.20
4.30
4.40
4.50
0
2,000
4,000
6,000
8,000
10,000
12,000
14,000
16,000
2012 2013 2014 2015 2016 Q2 2017
Pe
rc
en
t
Th
ou
sa
nd
s
Net Income Net Interest Margin
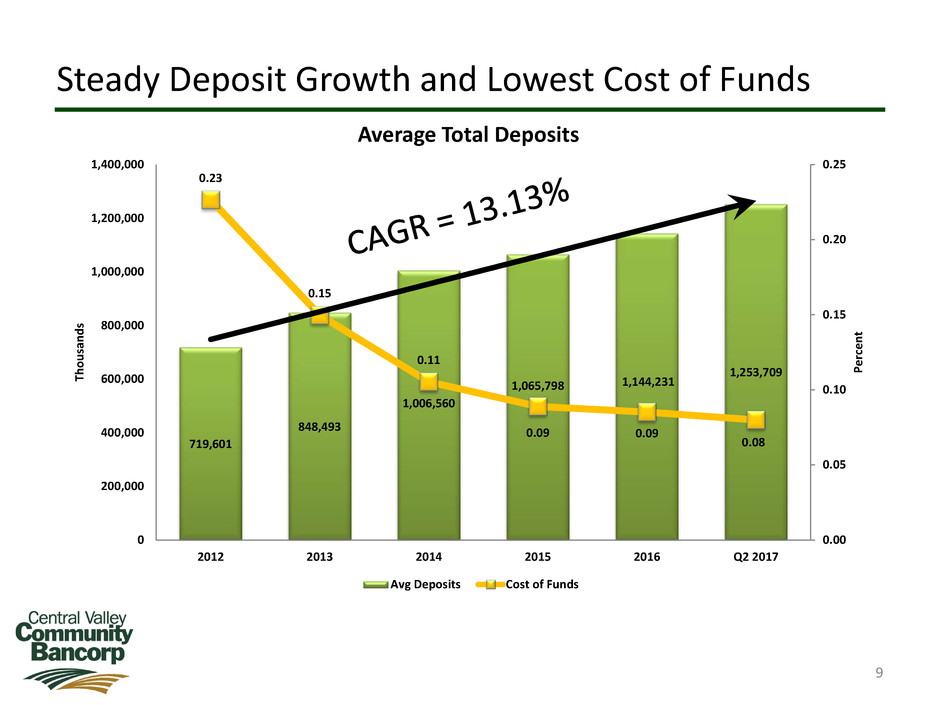
Steady Deposit Growth and Lowest Cost of Funds
9
719,601
848,493
1,006,560
1,065,798 1,144,231
1,253,709
0.23
0.15
0.11
0.09 0.09
0.08
0.00
0.05
0.10
0.15
0.20
0.25
0
200,000
400,000
600,000
800,000
1,000,000
1,200,000
1,400,000
2012 2013 2014 2015 2016 Q2 2017
Pe
rc
en
t
Th
ou
sa
nd
s
Average Total Deposits
Avg Deposits Cost of Funds
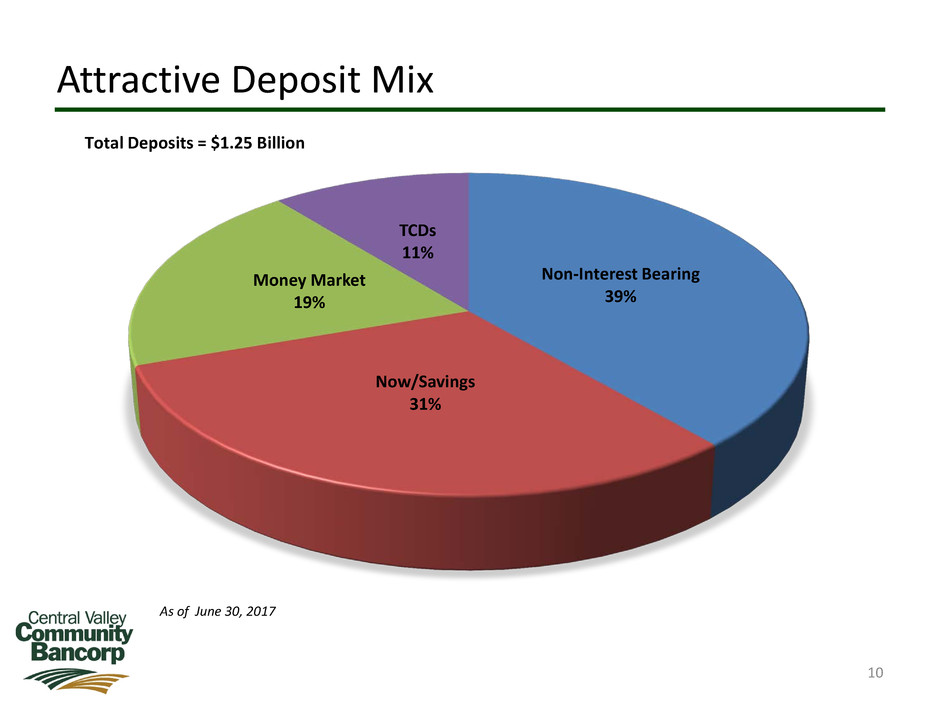
Attractive Deposit Mix
10
Non-Interest Bearing
39%
Now/Savings
31%
Money Market
19%
TCDs
11%
As of June 30, 2017
Total Deposits = $1.25 Billion
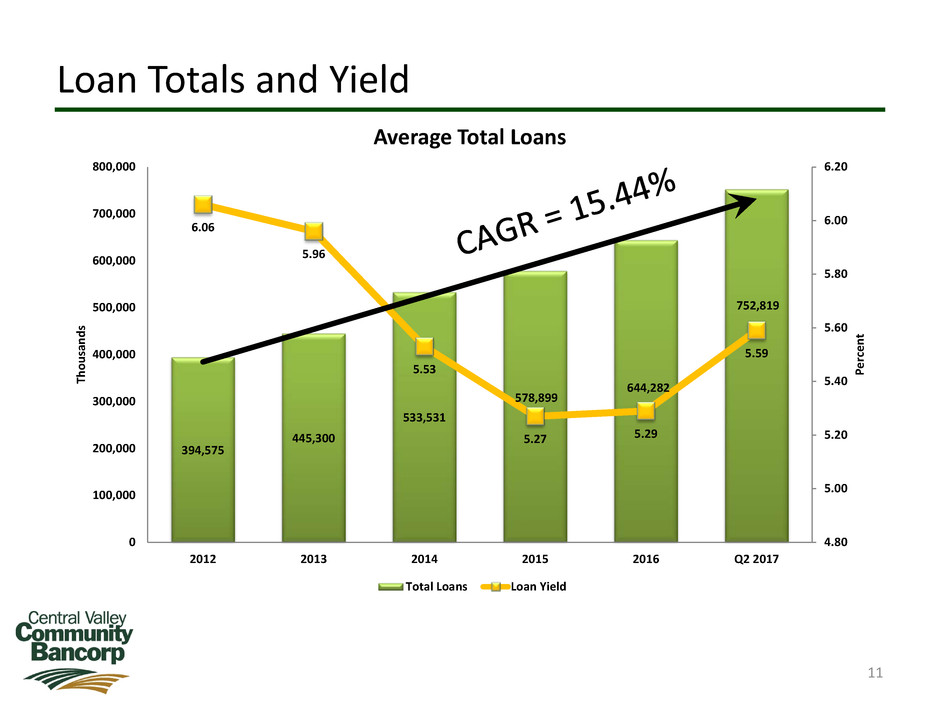
Loan Totals and Yield
11
394,575
445,300
533,531
578,899
644,282
752,819
6.06
5.96
5.53
5.27 5.29
5.59
4.80
5.00
5.20
5.40
5.60
5.80
6.00
6.20
0
100,000
200,000
300,000
400,000
500,000
600,000
700,000
800,000
2012 2013 2014 2015 2016 Q2 2017
Pe
rc
en
t
Th
ou
sa
nd
s
Average Total Loans
Total Loans Loan Yield
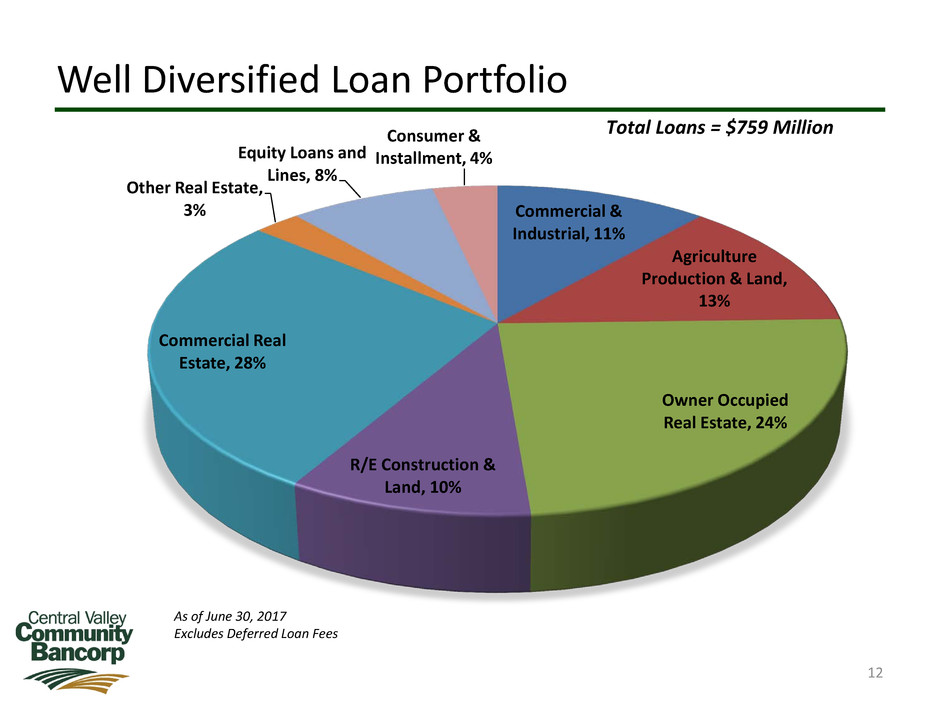
Well Diversified Loan Portfolio
12
Commercial &
Industrial, 11%
Agriculture
Production & Land,
13%
Owner Occupied
Real Estate, 24%
R/E Construction &
Land, 10%
Commercial Real
Estate, 28%
Other Real Estate,
3%
Equity Loans and
Lines, 8%
Consumer &
Installment, 4%
As of June 30, 2017
Excludes Deferred Loan Fees
Total Loans = $759 Million
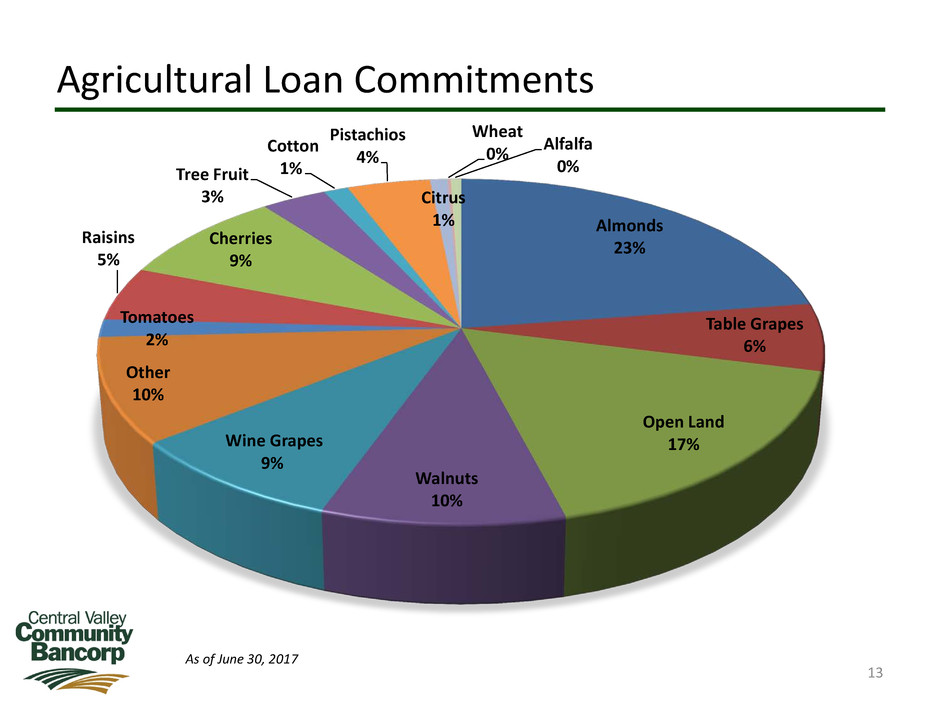
Agricultural Loan Commitments
13
Almonds
23%
Table Grapes
6%
Open Land
17%
Walnuts
10%
Wine Grapes
9%
Other
10%
Tomatoes
2%
Raisins
5%
Cherries
9%
Tree Fruit
3%
Cotton
1%
Pistachios
4%
Citrus
1%
Wheat
0% Alfalfa
0%
As of June 30, 2017
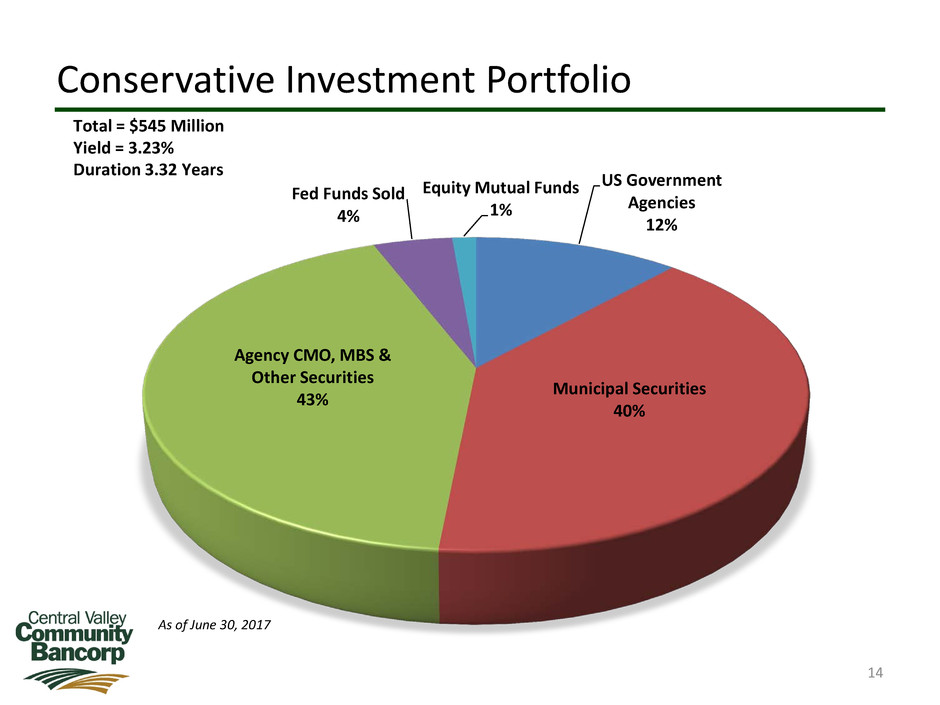
Conservative Investment Portfolio
14
US Government
Agencies
12%
Municipal Securities
40%
Agency CMO, MBS &
Other Securities
43%
Fed Funds Sold
4%
Equity Mutual Funds
1%
As of June 30, 2017
Total = $545 Million
Yield = 3.23%
Duration 3.32 Years
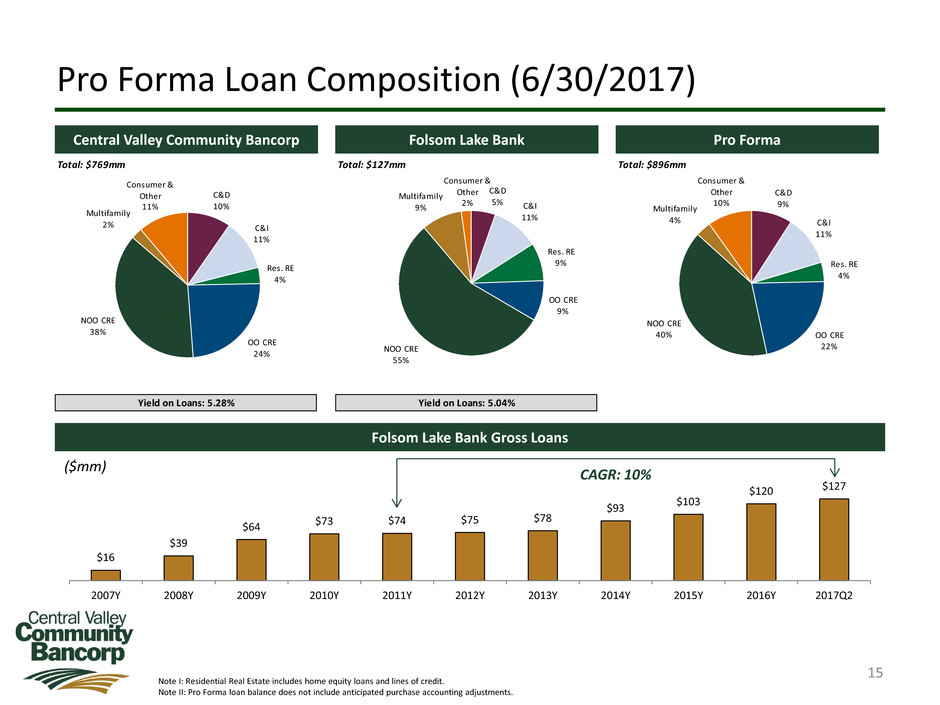
$16
$39
$64 $73 $74
$75 $78
$93
$103
$120 $127
2007Y 2008Y 2009Y 2010Y 2011Y 2012Y 2013Y 2014Y 2015Y 2016Y 2017Q2
Pro Forma Loan Composition (6/30/2017)
15
Note I: Residential Real Estate includes home equity loans and lines of credit.
Note II: Pro Forma loan balance does not include anticipated purchase accounting adjustments.
CAGR: 10%
Central Valley Community Bancorp
Folsom Lake Bank Gross Loans
Folsom Lake Bank Pro Forma
Total: $769mm
Yield on Loans: 5.28%
C&D
10%
C&I
11%
Res. RE
4%
OO CRE
24%
NOO CRE
38%
Multifamily
2%
Consumer &
Other
11%
Total: $127mm
Yield on Loans: 5.04%
C&D
5% C&I
11%
Res. RE
9%
OO CRE
9%
NOO CRE
55%
Multifamily
9%
Consumer &
Other
2%
Total: $896mm
C&D
9%
C&I
11%
Res. RE
4%
OO CRE
22%
NOO CRE
40%
Multifamily
4%
Consumer &
Other
10%
($mm)
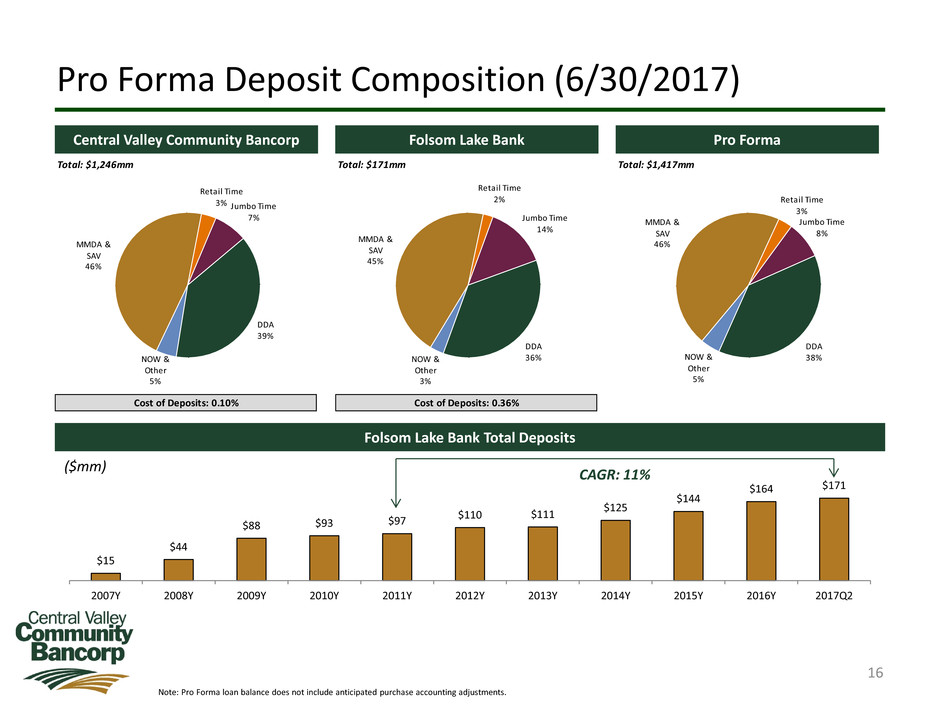
$15
$44
$88 $93 $97
$110 $111
$125
$144
$164 $171
2007Y 2008Y 2009Y 2010Y 2011Y 2012Y 2013Y 2014Y 2015Y 2016Y 2017Q2
Pro Forma Deposit Composition (6/30/2017)
16
Note: Pro Forma loan balance does not include anticipated purchase accounting adjustments.
CAGR: 11%
Central Valley Community Bancorp
Folsom Lake Bank Total Deposits
Folsom Lake Bank Pro Forma
Total: $1,246mm
Cost of Deposits: 0.10%
DDA
39%
NOW &
Other
5%
MMDA &
SAV
46%
Retail Time
3% Jumbo Time
7%
Total: $171mm
Cost of Deposits: 0.36%
DDA
36%NOW &
Other
3%
MMDA &
SAV
45%
Retail Time
2%
Jumbo Time
14%
Total: $1,417mm
DDA
38%NOW &
Other
5%
MMDA &
SAV
46%
Retail Time
3%
Jumbo Time
8%
($mm)
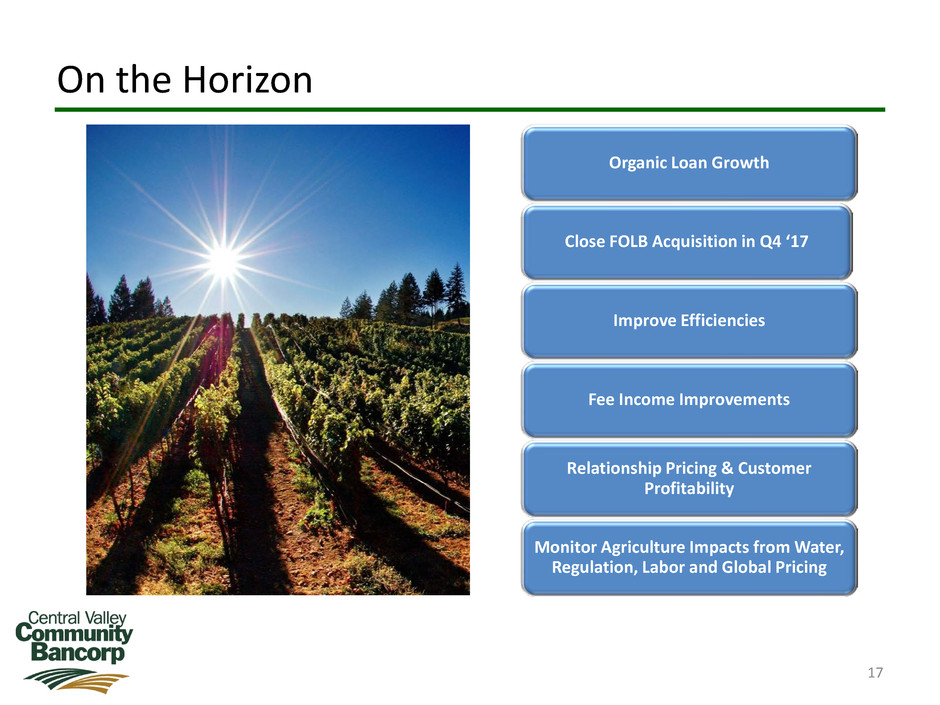
On the Horizon
17
Organic Loan Growth
Close FOLB Acquisition in Q4 ‘17
Improve Efficiencies
Fee Income Improvements
Relationship Pricing & Customer
Profitability
Monitor Agriculture Impacts from Water,
Regulation, Labor and Global Pricing
18
Investing in Relationships
